
Response of Soil Fauna to the Shift in a Riparian Landscape along an Urban–Rural Habitat Gradient

 ,
,
Abstract
:1. Introduction
2. Materials and Methods
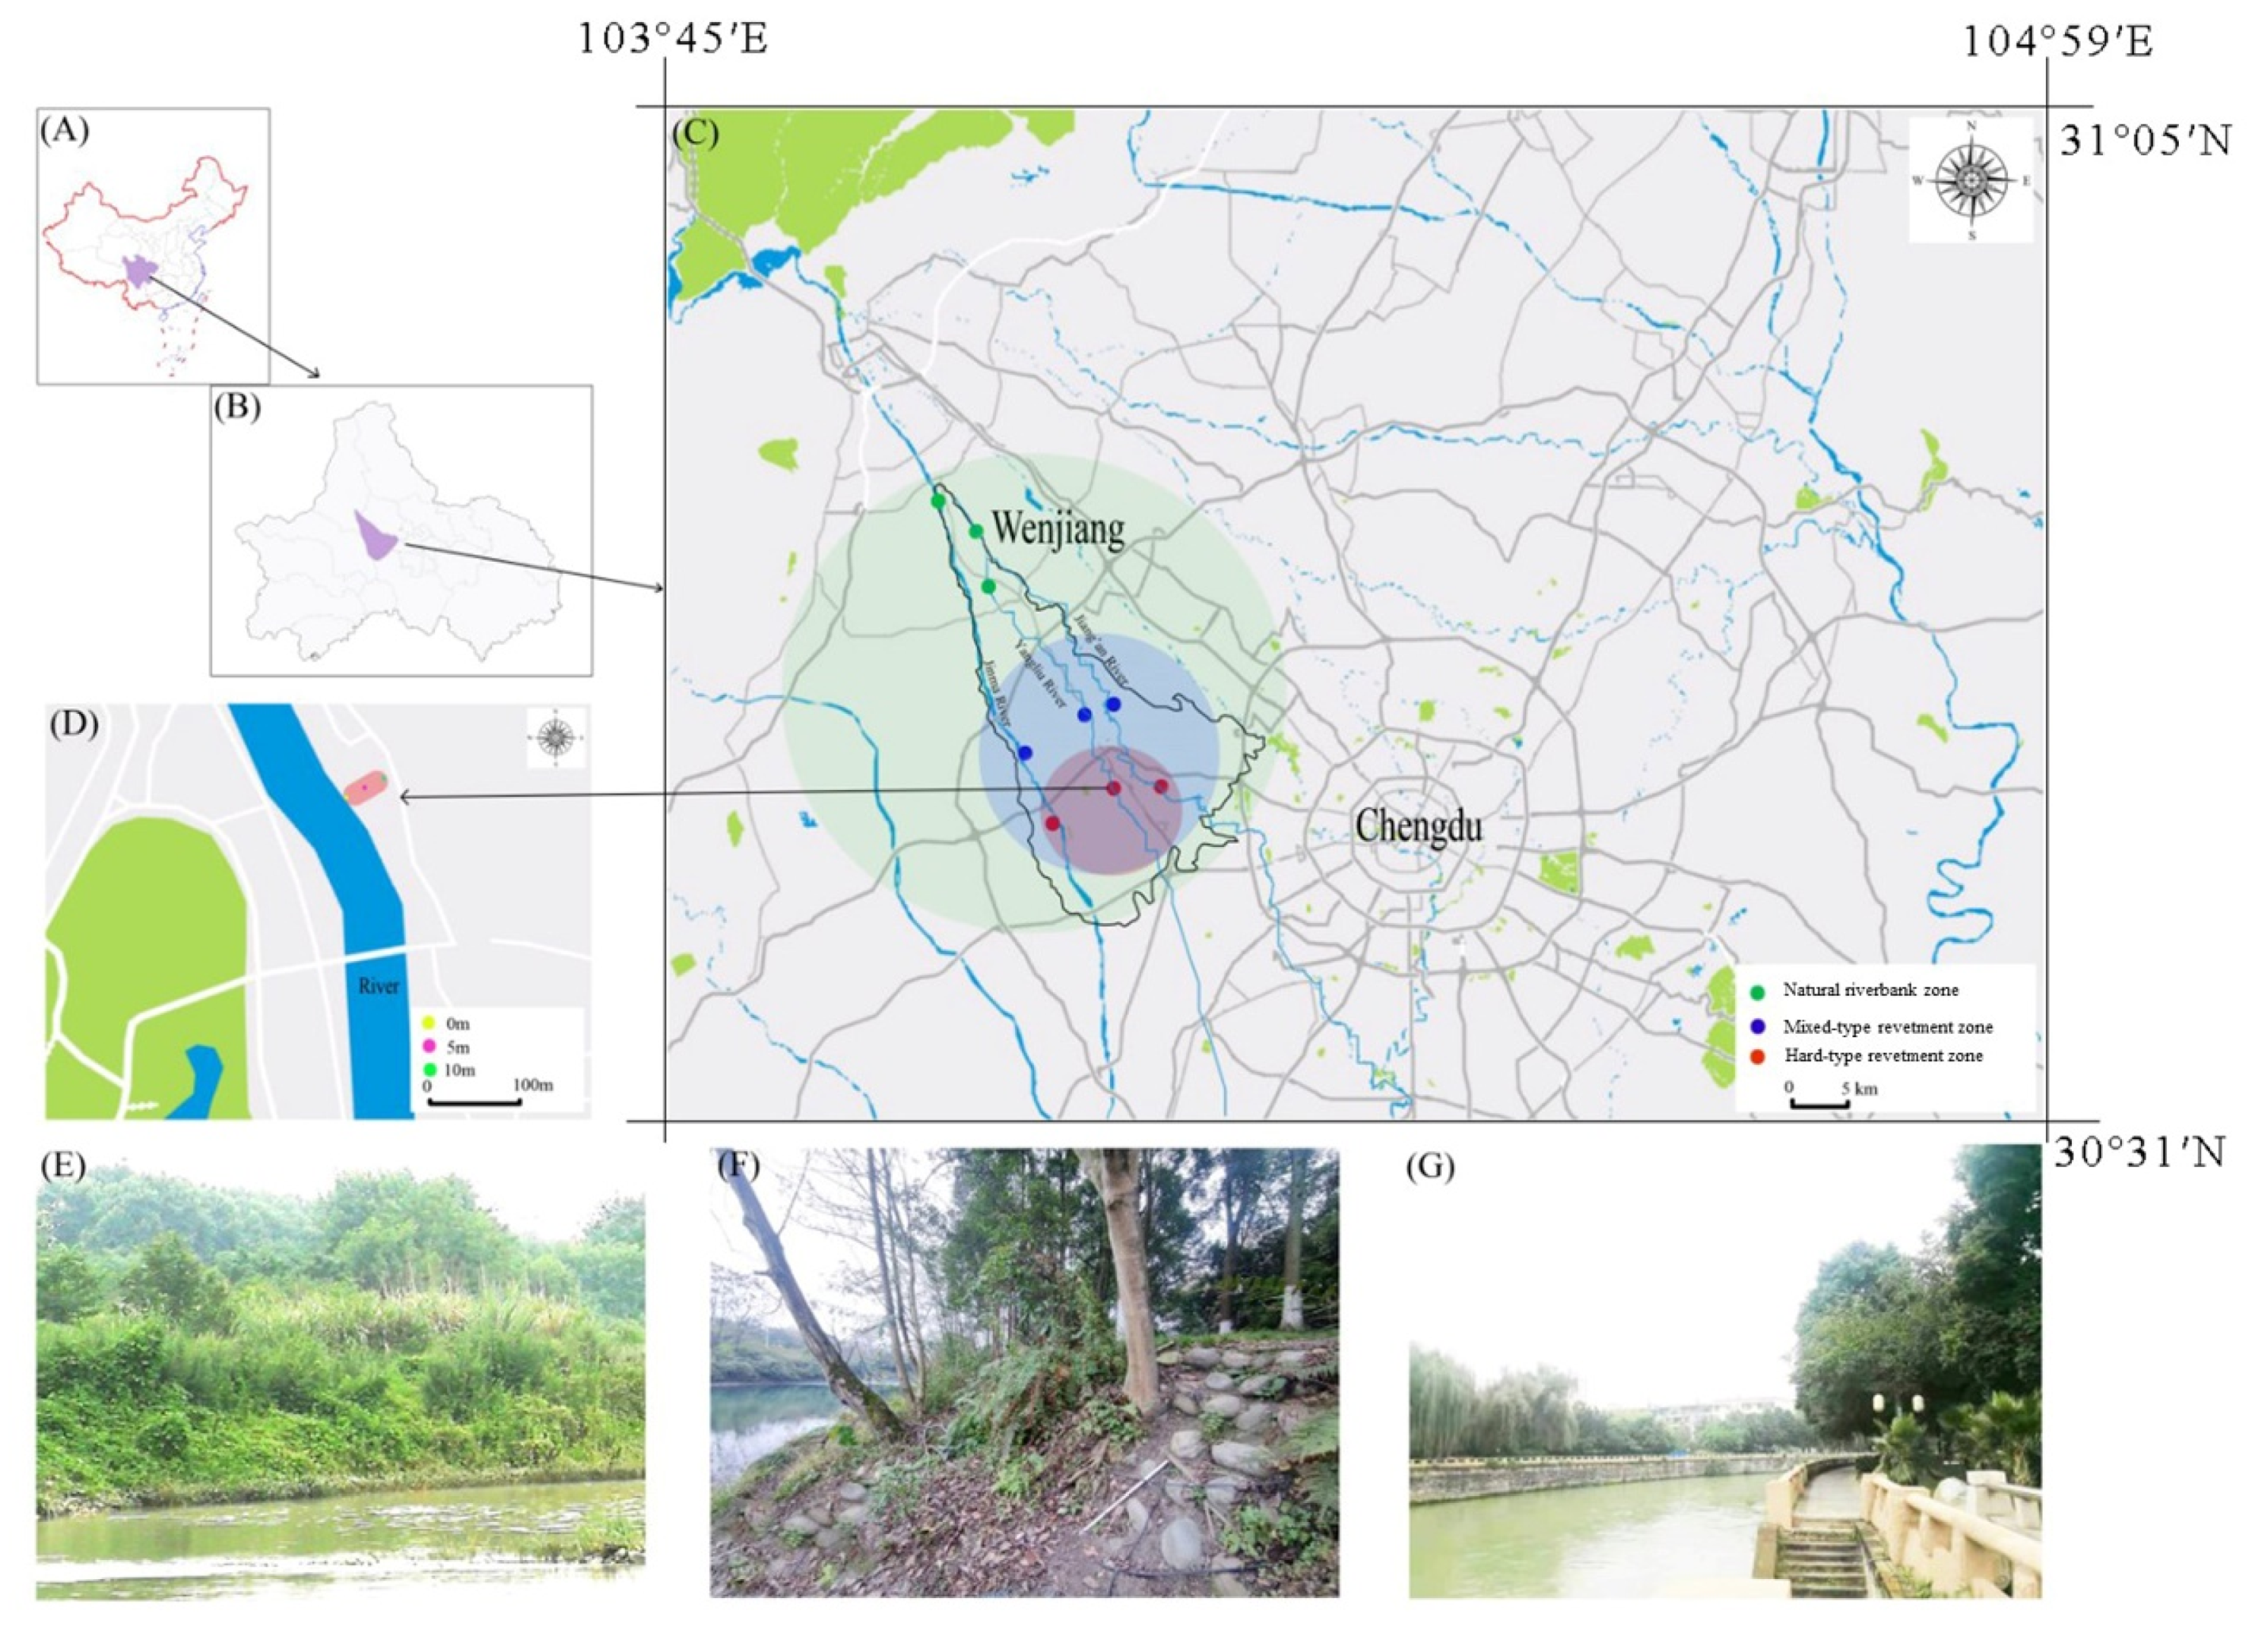
2.1. Field Site
2.2. Collection and Identification of the Soil Fauna
2.3. Vegetation Investigation
2.4. Soil Properties
2.5. Anthropogenic Disturbance Measurement
2.6. Calculation and Statistical Analysis
3. Results
3.1. Soil Fauna Abundance
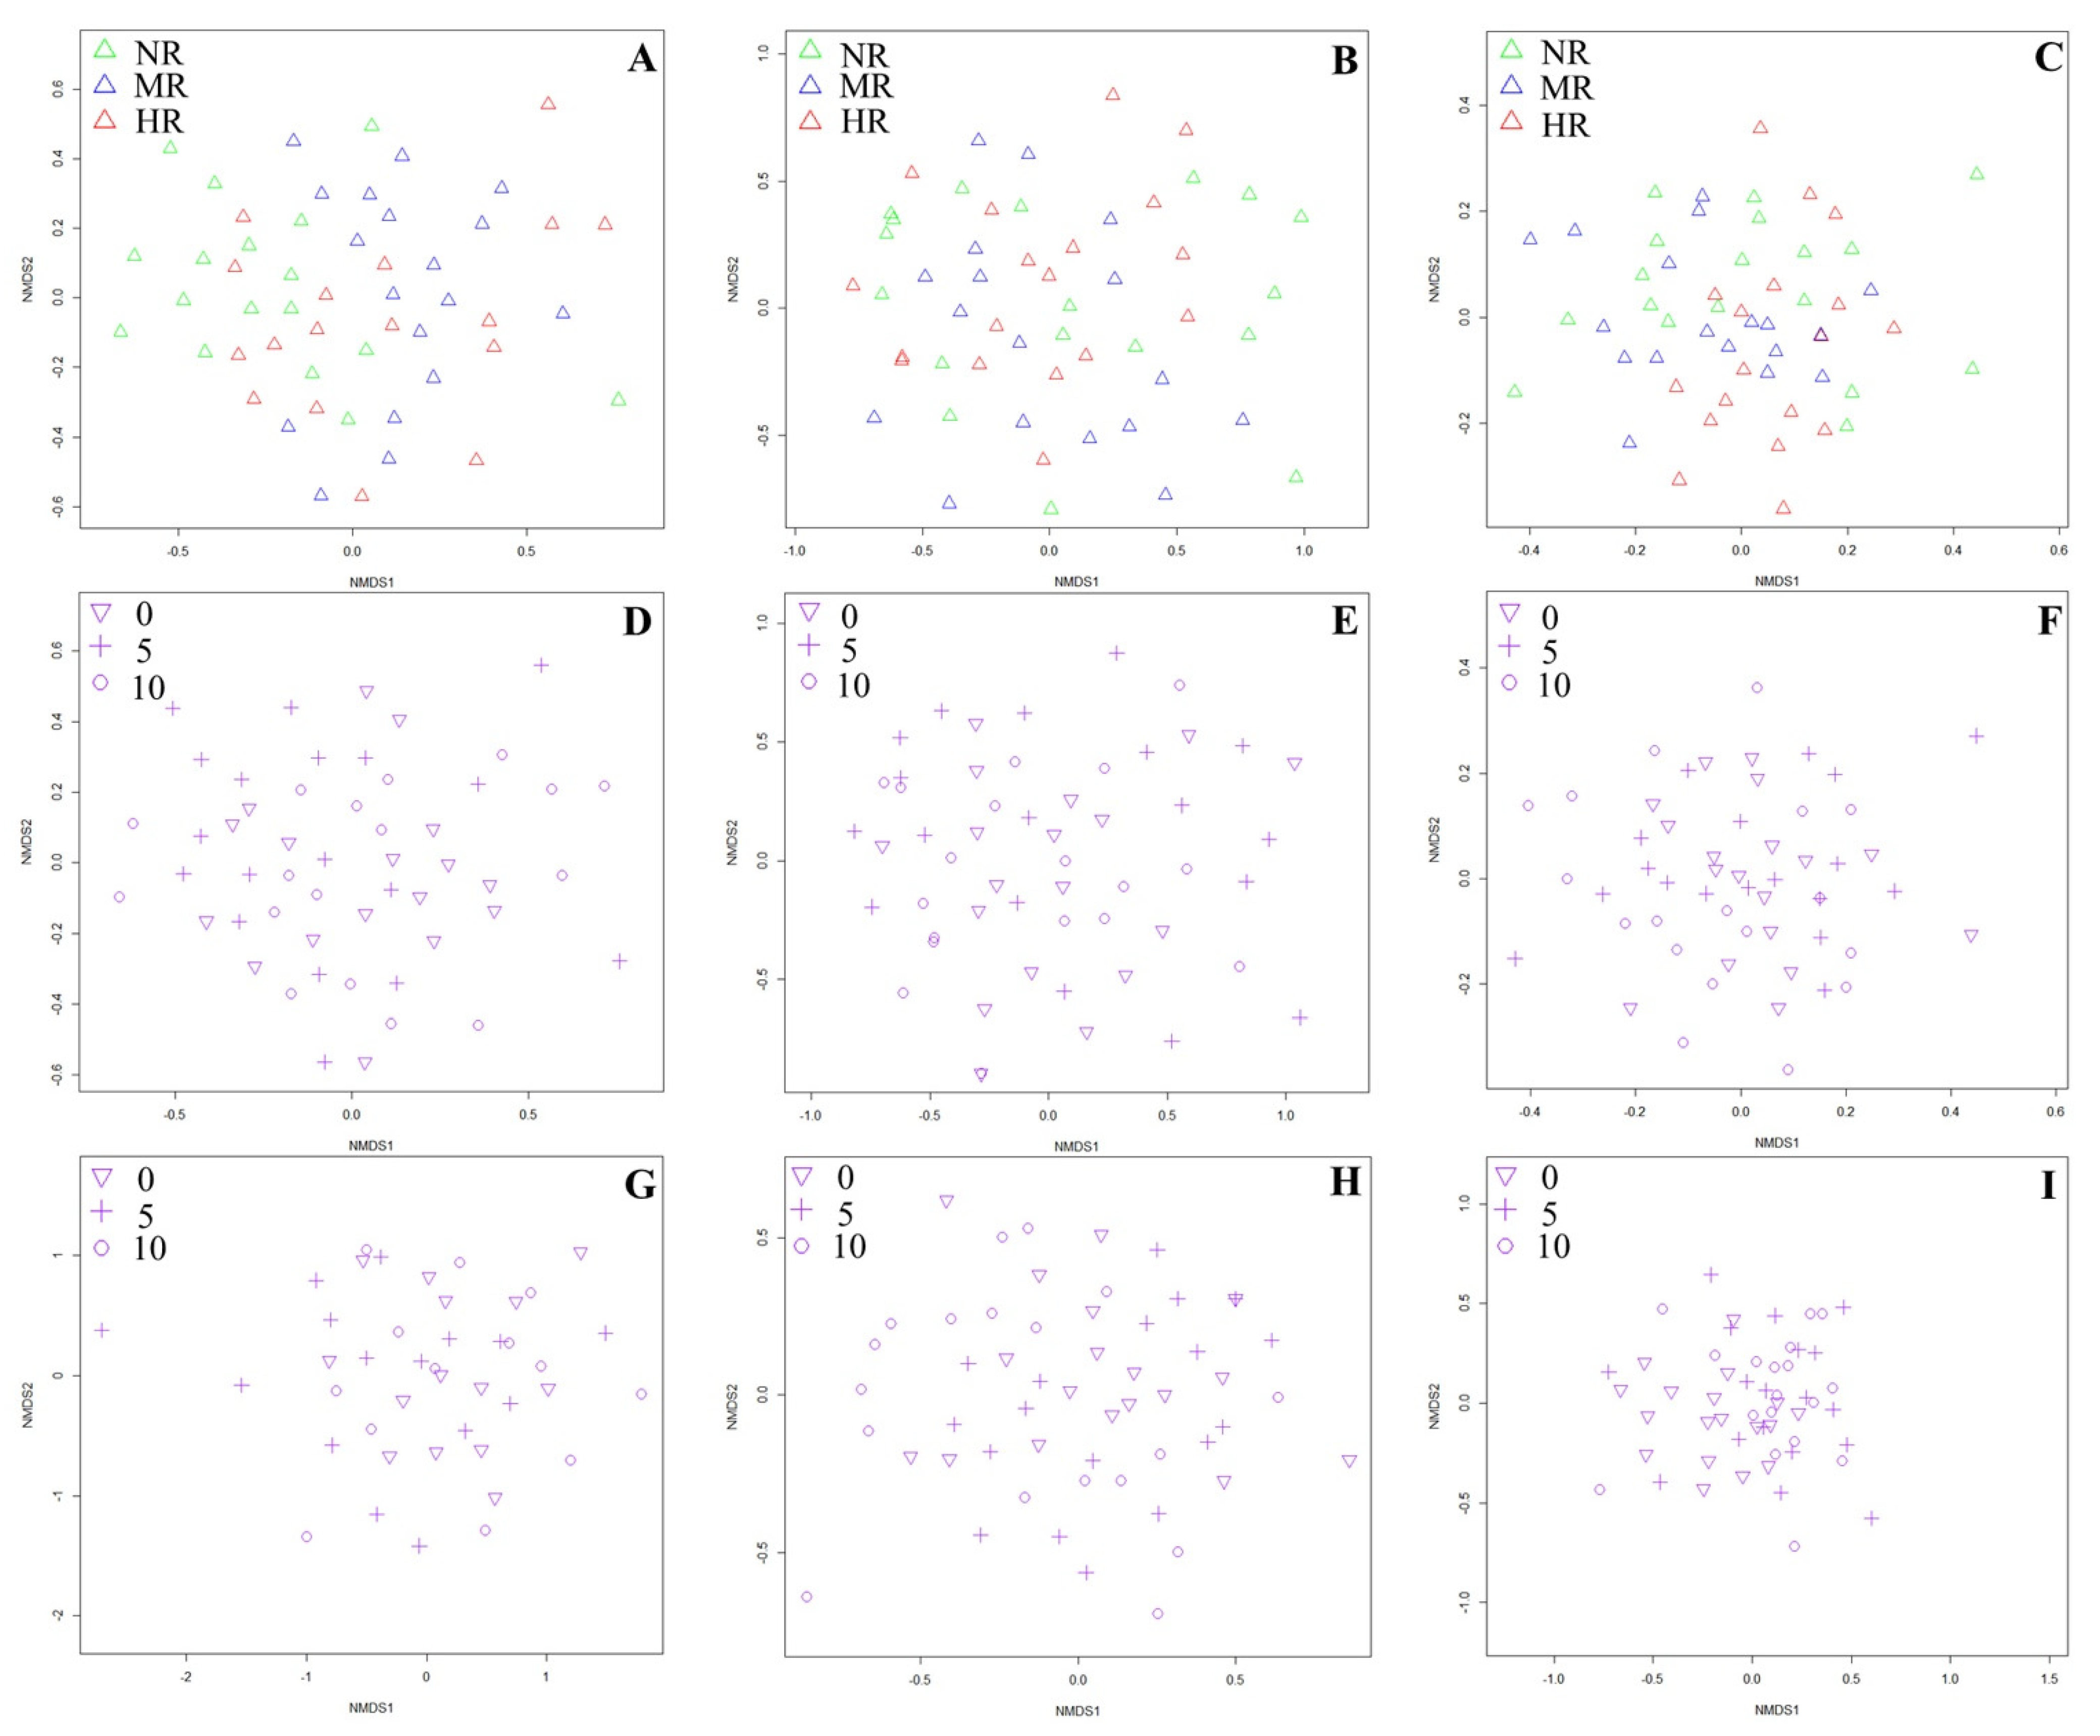
3.2. Diversity and Community Structure
3.3. Environmental Factors and Soil Fauna Communities
3.4. Indicator Species
4. Discussion
4.1. Effect of Revetment Type on Soil Fauna
4.2. Effect of Distance on the Soil Fauna
4.3. Effects of Seasonal Shifts on Soil Fauna
4.4. Effect of Urbanization on Soil Fauna
5. Conclusions
Author Contributions
Funding
Institutional Review Board Statement
Informed Consent Statement
Data Availability Statement
Acknowledgments
Conflicts of Interest
Appendix A

| Factor | Summer | Autumn | ||||||||||
|---|---|---|---|---|---|---|---|---|---|---|---|---|
| Type | Distance | Type | Distance | |||||||||
| NR | MR | HR | 0 | 5 | 10 | NR | MR | HR | 0 | 5 | 10 | |
| pH (H2O) | 6.78 ± 0.53 Aa | 6.42 ± 0.78 Aa | 6.59 ± 0.83 Aa | 6.56 ± 0.73 Aa | 6.64 ± 0.78 Aa | 6.58 ± 0.71 Aa | 6.82 ± 0.23 Aa | 6.32 ± 0.52 Ab | 6.91 ± 0.16 Aa | 6.64 ± 0.46 Aa | 6.68 ± 0.44 Aa | 6.73 ± 0.40 Aa |
| SBD (g·cm−3) | 1.29 ± 0.21 Aa | 1.17 ± 0.21 Aa | 1.26 ± 0.19 Aa | 1.18 ± 0.18 Aa | 1.27 ± 0.19 Aa | 1.26 ± 0.24 Aa | 1.24 ± 0.18 Aa | 1.23 ± 0.21 Aa | 1.31 ± 0.18 Aa | 1.21 ± 0.16 Aa | 1.33 ± 0.20 Aa | 1.24 ± 0.19 Aa |
| AN (mg·kg−1) | 18.3 ± 4.01 Ba | 23.0 ± 8.28 Ba | 31.2 ± 26.6 Aa | 24.9 ± 24.9 Ba | 23.7 ± 13.8 Ba | 23.8 ± 8.3 Ba | 28.8 ± 5.87 Ab | 42.9 ± 29.0 Aa | 28.0 ± 10.3 Ab | 29.0 ± 6.1 Aa | 40.5 ± 29.5 Aa | 38.3 ± 11.7 Aa |
| AP (mg·kg−1) | 39.4 ± 30.3 Aa | 47.5 ± 24.1 Aa | 44.1 ± 27.3 Aa | 43.2 ± 30.4 Aa | 37.1 ± 20.4 Aa | 50.8 ± 29.1 Aa | 37.3 ± 25.0 Aa | 28.4 ± 9.96 Ba | 29.0 ± 18.8 Ba | 35.0 ± 20.8 Aa | 30.9 ± 19.7 Aa | 28.8 ± 16.9 Ba |
| AK (mg·kg−1) | 150.8 ± 74.4 Aab | 112.5 ± 41.3 Ab | 160.6 ± 57.2 Aa | 120.1 ± 62.8 Aa | 147.1 ± 51.2 Aa | 156.8 ± 67.4 Aa | 171.0 ± 97.5 Aa | 141.3 ± 71.5 Aa | 131.2 ± 82.5 Aa | 149.2 ± 79.9 Aa | 137.7 ± 82.0 Aa | 156.6 ± 95.0 Aa |
| WC (%) | 23.4 ± 5.5 Aa | 23.1 ± 4.6 Aa | 20.0 ± 6.3 Aa | 24.4 ± 5.5 Aa | 22.1 ± 5.1 Aab | 20.0 ± 5.6 Ab | 20.9 ± 4.4 Aa | 19.7 ± 5.1 Aa | 15.3 ± 6.5 Bb | 21.6 ± 4.5 Ba | 18.6 ± 5.1 Bab | 15.7 ± 6.3 Bb |
| AT (°C) | 26.4 ± 2.18 Aa | 22.4 ± 2.53 Ab | 25.5 ± 2.59 Aa | 24.7 ± 3.09 Aa | 24.8 ± 2.95 Aa | 24.8 ± 3.00 Aa | 16.6 ± 0.59 Ba | 16.7 ± 0.42 Ba | 16.5 ± 0.80 Ba | 16.4 ± 0.65 Ba | 16.6 ± 0.62 Ba | 16.7 ± 0.58 Ba |
| ST (°C) | 25.41 ± 1.36 Aa | 24.33 ± 1.47 Aa | 25.96 ± 1.16 Aa | 25.3 ± 1.61 Aa | 25.3 ± 1.79 Aa | 25.6 ± 1.93 Aa | 17.95 ± 4.25 Ba | 18.64 ± 4.09 Ba | 19.41 ± 4.45 Ba | 18.2 ± 0.26 Bab | 18.0 ± 0.31 Bb | 18.2 ± 0.30 Ba |
Appendix B
| Factor | Revetment Type | |||
|---|---|---|---|---|
| NR | MR | HR | ||
| Human traffic density (ind.·h−1·100 m−2) | Summer | 1.38 ± 0.39 c | 4.90 ± 0.79 b | 20.15 ± 1.82 a |
| Autumn | 1.33 ± 0.20 c | 5.36 ± 1.37 b | 35.43 ± 2.47 a | |
| Vegetation diversity index | Shannon | 1.17 ± 0.28 a | 1.01 ± 0.31 a | 1.16 ± 0.37 a |
| Pielou | 0.94 ± 0.08 a | 0.93 ± 0.38 a | 0.87 ± 0.04 a | |
| Simpson | 0.39 ± 0.12 a | 0.53 ± 0.14 a | 0.38 ± 0.11 a | |
| Vegation composition | Exotics plants/native plants | 27% | 30% | 39% |
| Cultivated plants/spontaneous plants | 3% | 33% | 195% | |
| Soil temperature (°C) | June | 24.08 ± 0.37 a | 22.29 ± 0.23 b | 24.59 ± 0.41 a |
| July | 27.21 ± 0.35 a | 25.34 ± 0.28 b | 27.26 ± 0.29 a | |
| August | 24.93 ± 0.26 b | 25.36 ± 0.33 ab | 26.03 ± 0.42 a | |
| September | 23.17 ± 0.29 b | 23.64 ± 0.39 ab | 24.95 ± 0.76 a | |
| October | 17.90 ± 0.15 b | 18.64 ± 0.15 a | 19.15 ± 0.29 a | |
| November | 12.77 ± 0.25 b | 13.64 ± 0.05 a | 14.12 ± 0.15 a | |
Appendix C
| Factor | Entire Soil Fauna Community | Macrofauna | Microarthropods | Hygrophilous Mesofauna | |||||
|---|---|---|---|---|---|---|---|---|---|
| Summer | Autumn | Summer | Autumn | Summer | Autumn | Summer | Autumn | ||
| Type | NR | 39,334.6 ± 16,933.9 Aa | 10,010.3 ± 7808.2 Ba | 70.3 ± 54.7 Aa | 80.2 ± 40.2 Aa | 4267.7 ± 3941.5 Aa | 3737.4 ± 4013.1 Aa | 34,996.4 ± 14,169.5 Aa | 6192.6 ± 6424.6 Ba |
| MR | 28,631.0 ± 10,037.7 Aa | 11,048.5 ± 7390.5 Ba | 108.1 ± 115.6 Aa | 106.8 ± 72.0 Aa | 3257.7 ± 2360.5 Aa | 2802.9 ± 1666.4 Aa | 25,265.4 ± 9915.8 Aa | 8138.8 ± 7371.7 Ba | |
| HR | 17,918.5 ± 9400.3 Ab | 10,135.4 ± 6927.9 Ba | 19.7 ± 23.1 Bb | 98.7 ± 77.4 Aa | 1338.4 ± 479.8 Bb | 3207.1 ± 2834.2 Aa | 16,560.4 ± 9381.4 Ab | 6829.5 ± 5766.9 Ba | |
| Distance | 0 | 40,549.2 ± 15,149.3 Aa | 12,057.0 ± 7534.1 Ba | 76.6 ± 64.3 Aa | 119.6 ± 74.4 Aa | 3813.1 ± 3514.5 Aa | 3232.2 ± 2193.1 Ab | 36,659.6 ± 12,669.9 Aa | 8704.8 ± 6804.2 Ba |
| 5 | 25,226.2 ± 12,498.7 Ab | 8345.0 ± 4218.1 Ba | 53.7 ± 49.6 Ba | 87.1 ± 56.3 Aa | 2904.2 ± 3087.3 Aab | 2348.5 ± 1472.9 Aab | 22,292.9 ± 10,784.9 Ab | 5909.5 ± 4062.5 Ba | |
| 10 | 20,084.1 ± 9677.2 Ab | 10,792.1 ± 9064.6 Ba | 67.8 ± 119.0 Aa | 79.0 ± 59.1 Aa | 2146.6 ± 1633.6 Ab | 4166.7 ± 4318.5 Aa | 17,869.8 ± 9275.4 Ab | 6546.5 ± 7975.8 Ba | |
Appendix D
| Factor | Entire Soil Fauna Community | Macrofauna | Microarthropods | Hygrophilous Mesofauna | ||||||
|---|---|---|---|---|---|---|---|---|---|---|
| Density | Richness | Density | Richness | Density | Richness | Density | Richness | |||
| Summer | NR | χ2 | 11.688 | 4.967 | 120.850 | 2.292 | 6.646 | 1.767 | 11.285 | 0.092 |
| p | 0.003 | 0.083 | 0.000 | 0.318 | 0.036 | 0.413 | 0.004 | 0.955 | ||
| MR | χ2 | 11.628 | 0.811 | 0.656 | 0.928 | 0.440 | 0.685 | 11.138 | 0.153 | |
| p | 0.003 | 0.667 | 0.721 | 0.629 | 0.803 | 0.710 | 0.004 | 0.926 | ||
| HR | χ2 | 15.710 | 2.898 | 4.496 | 2.000 | 0.911 | 0.392 | 15.900 | 3.936 | |
| p | 0.000 | 0.235 | 0.106 | 0.368 | 0.634 | 0.822 | 0.000 | 0.140 | ||
| Autumn | NR | χ2 | 1.937 | 1.253 | 1.429 | 1.427 | 4.702 | 5.065 | 0.464 | 2.101 |
| p | 0.380 | 0.534 | 0.489 | 0.490 | 0.095 | 0.079 | 0.793 | 0.350 | ||
| MR | χ2 | 0.958 | 3.905 | 5.925 | 2.484 | 0.343 | 2.448 | 0.784 | 0.208 | |
| p | 0.619 | 0.142 | 0.052 | 0.290 | 0.843 | 0.294 | 0.676 | 0.901 | ||
| HR | χ2 | 3.949 | 0.104 | 0.009 | 1.618 | 3.944 | 2.304 | 4.237 | 1.466 | |
| p | 0.139 | 0.949 | 0.996 | 0.445 | 0.139 | 0.316 | 0.120 | 0.481 | ||
Appendix E
| Phylum | Class | Order | Family | Summer | Autumn | ||||||||||
|---|---|---|---|---|---|---|---|---|---|---|---|---|---|---|---|
| Type | Distance | Type | Distance | ||||||||||||
| NR | MR | HR | 0 | 5 | 10 | NR | MR | HR | 0 | 5 | 10 | ||||
| Rotifera | Digononta | Bdelloidea | Philodinidae | − | − | − | − | − | − | − | − | + | − | + | + |
| Nemata | Secernentea | Tylenchida | Criconematidae | − | + | − | + | − | + | + | + | − | + | + | + |
| Nemata | Secernentea | Tylenchida | Tylenchidae | − | + | + | + | + | + | + | + | + | + | + | + |
| Nemata | Secernentea | Tylenchida | Pratylenchidae | + | + | + | + | + | + | + | + | + | + | + | + |
| Nemata | Secernentea | Tylenchida | Heteroderidae | + | − | − | + | + | + | − | − | − | − | − | − |
| Nemata | Secernentea | Tylenchida | Paratylenchidae | + | + | + | + | + | + | + | + | + | + | + | + |
| Nemata | Secernentea | Tylenchida | Nothotylenchidae | − | − | − | − | − | − | + | − | + | + | + | + |
| Nemata | Secernentea | Tylenchida | Aphelenchoidea | − | − | + | + | + | + | + | + | + | + | + | + |
| Nemata | Secernentea | Rhabditida | Rhabditidea | + | + | + | + | + | + | + | + | + | + | + | + |
| Nemata | Secernentea | Rhabditida | Panagrolaimidae | − | − | − | − | − | − | − | − | + | − | − | + |
| Nemata | Adenophorea | Dorylaimida | Carcharolaimidae | − | − | − | − | − | − | + | − | − | + | + | − |
| Nemata | Adenophorea | Dorylaimida | Dorylaimidae | + | + | + | + | + | + | + | + | + | + | + | + |
| Nemata | Adenophorea | Araeolaimida | Plectidae | + | + | + | + | + | + | + | + | + | + | + | + |
| Annelida | Oligochaeta | Microdrile oligochaetes | Lumbricidae | + | + | + | + | + | + | + | + | + | + | + | + |
| Annelida | Oligochaeta | Megadrile oligochaetes | Enchytraeidae | − | − | − | − | − | − | − | + | + | − | + | + |
| Annelida | Hirudinea | Arhynchobdellida | Haemadipsidae | − | − | − | − | − | − | − | + | − | + | + | − |
| Mollusca | Gastropoda | Mesogastropoda | Cyclophoridae | − | − | − | − | − | − | − | + | + | + | − | + |
| Mollusca | Gastropoda | Stylommatophora | Subulinidae | + | + | + | + | + | + | + | + | + | + | + | + |
| Mollusca | Gastropoda | Stylommatophora | Pupillidae | + | − | − | + | + | − | + | + | + | + | + | + |
| Mollusca | Gastropoda | Stylommatophora | Bradybaenieae | − | + | + | + | − | − | + | + | + | + | + | + |
| Mollusca | Gastropoda | Stylommatophora | Ariophantidae | − | + | + | + | + | − | − | + | − | + | − | + |
| Mollusca | Gastropoda | Stylommatophora | Succineidae | − | + | − | + | − | − | − | − | + | − | + | − |
| Mollusca | Gastropoda | Stylommatophora | Clausiliidae | − | − | − | − | − | − | − | + | − | + | − | − |
| Mollusca | Gastropoda | Stylommatophora | Valloniidae | − | − | − | − | − | − | − | − | + | − | + | − |
| Mollusca | Gastropoda | Stylommatophora | Camaenidae | − | − | − | − | − | − | − | − | + | − | + | − |
| Arthropoda | Arachnida | Araneae | Theridiidae | + | + | − | + | + | + | + | + | + | + | + | + |
| Arthropoda | Arachnida | Araneae | Thermozodia | + | − | − | + | − | − | − | − | − | − | − | − |
| Arthropoda | Arachnida | Araneae | Ctenizidae | + | − | − | + | + | − | − | − | − | − | − | − |
| Arthropoda | Arachnida | Araneae | Anyphaenidae | + | − | − | − | + | − | − | − | − | − | − | − |
| Arthropoda | Arachnida | Araneae | Tetragnathidae | + | − | − | + | + | − | − | − | − | − | − | − |
| Arthropoda | Arachnida | Araneae | Oonopidae | + | − | − | − | + | − | − | − | − | − | − | − |
| Arthropoda | Arachnida | Araneae | Clubionidae | + | − | − | + | − | − | − | − | − | − | − | − |
| Arthropoda | Arachnida | Araneae | Lycosidae | + | − | − | + | − | + | + | + | + | + | + | + |
| Arthropoda | Arachnida | Araneae | Oecobiidae | + | − | − | + | + | − | − | − | − | − | − | − |
| Arthropoda | Arachnida | Araneae | Selenopidae | + | − | − | − | − | + | − | − | − | − | − | − |
| Arthropoda | Arachnida | Araneae | Araneidae | + | − | − | + | − | − | − | + | − | + | − | + |
| Arthropoda | Arachnida | Araneae | Oxyopidae | − | − | − | − | − | − | + | − | + | − | + | − |
| Arthropoda | Arachnida | Araneae | Scytodidae | − | − | − | − | − | − | + | − | − | − | + | − |
| Arthropoda | Arachnida | Araneae | Mimetidae | − | − | − | − | − | − | + | − | − | + | − | + |
| Arthropoda | Arachnida | Araneae | Pholcidae | − | − | − | − | − | − | + | − | + | − | + | − |
| Arthropoda | Arachnida | Araneae | Liphistiidae | − | − | − | − | − | − | + | − | + | + | + | − |
| Arthropoda | Arachnida | Araneae | Zoridae | − | − | − | − | − | − | + | + | + | + | + | + |
| Arthropoda | Arachnida | Araneae | Heteropodidae | − | − | − | − | − | − | + | − | − | − | + | − |
| Arthropoda | Arachnida | Araneae | Filistaidae | − | − | − | − | − | − | − | + | − | + | − | − |
| Arthropoda | Arachnida | Araneae | Linyphiidae | − | − | − | − | − | − | − | + | − | − | − | + |
| Arthropoda | Arachnida | Araneae | Pisauride | − | − | − | − | − | − | − | + | − | − | + | + |
| Arthropoda | Arachnida | Araneae | Agelenidae | − | − | − | − | − | − | − | − | + | + | + | − |
| Arthropoda | Arachnida | Araneae | Atypidae | − | − | − | − | − | − | − | − | + | − | + | − |
| Arthropoda | Arachnida | Araneae | Ctenidae | + | + | − | + | + | + | + | − | − | + | + | + |
| Arthropoda | Arachnida | Araneae | Gnaphosidae | + | − | − | + | − | − | − | − | − | − | − | − |
| Arthropoda | Arachnida | Araneae | Philodromidae | − | + | − | − | − | + | − | − | − | − | − | − |
| Arthropoda | Arachnida | Parasiformes | Ameroseiidae | + | + | − | + | + | + | + | + | + | + | + | + |
| Arthropoda | Arachnida | Parasiformes | Epicridae | + | + | + | + | + | + | − | + | − | − | + | − |
| Arthropoda | Arachnida | Parasiformes | Ascidae | − | + | + | − | + | + | − | − | + | + | − | + |
| Arthropoda | Arachnida | Parasiformes | Veigaiidae | + | − | − | + | − | − | + | + | − | + | + | + |
| Arthropoda | Arachnida | Parasiformes | Macrochelidae | + | + | − | + | − | − | − | − | − | − | − | − |
| Arthropoda | Arachnida | Parasiformes | Parholaspididae | + | + | + | + | + | + | + | + | + | − | + | + |
| Arthropoda | Arachnida | Parasiformes | Laeclapidae | + | + | + | + | + | + | + | + | + | + | + | + |
| Arthropoda | Arachnida | Parasiformes | Ologamasidae | − | + | − | − | − | + | − | − | − | − | − | − |
| Arthropoda | Arachnida | Parasiformes | Pachylaelapidae | − | − | + | + | + | + | − | − | − | − | − | − |
| Arthropoda | Arachnida | Acariformes | Parasitidae | + | + | + | + | + | + | + | − | + | + | + | + |
| Arthropoda | Arachnida | Acariformes | Sejidae | + | + | − | + | − | + | − | − | − | − | − | − |
| Arthropoda | Arachnida | Acariformes | Microdispidae | − | + | − | + | + | − | + | + | − | + | + | + |
| Arthropoda | Arachnida | Acariformes | Cheylrtidae | − | − | − | − | − | − | − | − | + | + | − | − |
| Arthropoda | Arachnida | Acariformes | Scutacaridae | + | − | − | + | − | − | − | − | − | − | − | − |
| Arthropoda | Arachnida | Acariformes | Cryptognathidae | − | − | − | − | − | − | + | − | − | − | − | + |
| Arthropoda | Arachnida | Acariformes | Pygmephoridae | − | + | − | − | − | + | + | + | + | + | + | + |
| Arthropoda | Arachnida | Acariformes | Tarsonmidae | − | − | − | − | − | − | + | + | + | + | − | + |
| Arthropoda | Arachnida | Acariformes | Cunaxidae | + | − | − | − | + | + | − | − | − | − | − | − |
| Arthropoda | Arachnida | Acariformes | Erythraeidae | − | − | − | − | − | − | + | − | − | + | − | − |
| Arthropoda | Arachnida | Acariformes | Zetorchestidae | + | + | + | + | + | + | + | + | − | + | + | + |
| Arthropoda | Arachnida | Acariformes | Oribatellidae | + | − | + | + | + | − | − | + | + | + | + | + |
| Arthropoda | Arachnida | Acariformes | Lohmannidae | − | − | − | − | − | − | + | − | + | − | − | + |
| Arthropoda | Arachnida | Acariformes | Trhypochthoniidae | − | − | − | − | − | − | − | + | − | + | − | − |
| Arthropoda | Arachnida | Acariformes | Mochlozetidae | − | − | − | − | − | − | − | + | − | − | + | − |
| Arthropoda | Arachnida | Acariformes | Hypochthoniidae | − | − | − | − | − | − | − | − | + | + | − | − |
| Arthropoda | Arachnida | Acariformes | Liacaridae | + | + | − | + | + | + | + | − | + | + | − | + |
| Arthropoda | Arachnida | Acariformes | Nothridae | − | + | − | + | − | + | + | − | + | − | + | + |
| Arthropoda | Arachnida | Acariformes | Malaconothridae | + | − | − | − | + | − | − | − | + | + | + | + |
| Arthropoda | Arachnida | Acariformes | Ceratozetidae | + | + | − | + | − | + | + | − | − | − | − | + |
| Arthropoda | Arachnida | Acariformes | Suctobelbidae | + | + | − | + | + | + | − | − | − | − | − | − |
| Arthropoda | Arachnida | Acariformes | Rhagidiidae | − | − | − | − | − | − | + | − | + | + | + | − |
| Arthropoda | Arachnida | Acariformes | Galumnidae | − | + | − | − | + | − | + | + | + | + | + | + |
| Arthropoda | Arachnida | Acariformes | Carabodidae | + | − | + | − | + | + | − | − | − | − | − | − |
| Arthropoda | Arachnida | Acariformes | Oppiidae | + | + | + | + | + | + | + | + | + | + | + | + |
| Arthropoda | Arachnida | Acariformes | Scheloribatidae | − | + | − | − | + | − | − | + | + | + | − | + |
| Arthropoda | Arachnida | Acariformes | Oribatulidae | + | + | + | + | + | + | + | − | + | + | + | − |
| Arthropoda | Arachnida | Acariformes | Labidostommidae | − | − | − | − | − | − | − | − | + | − | − | + |
| Arthropoda | Arachnida | Acariformes | Hermanniidae | − | + | − | − | + | − | − | − | + | + | − | − |
| Arthropoda | Arachnida | Acariformes | Cepheidae | − | − | + | − | + | − | + | − | + | + | + | − |
| Arthropoda | Arachnida | Acariformes | Peloppiidae | + | − | + | + | + | − | − | + | + | + | + | − |
| Arthropoda | Arachnida | Acariformes | Phthiracaridae | − | − | − | − | − | − | − | − | + | + | − | + |
| Arthropoda | Arachnida | Acariformes | Scutoverticidae | − | − | − | − | − | − | − | − | + | − | − | + |
| Arthropoda | Malacostraca | Isopoda | Oniscidae | − | + | − | − | + | + | − | − | − | − | − | − |
| Arthropoda | Malacostraca | Isopoda | Philosciidae | − | − | − | − | − | − | + | − | − | + | + | + |
| Arthropoda | Malacostraca | Isopoda | Porcellionidae | − | + | + | − | + | + | + | − | + | + | + | + |
| Arthropoda | Diplopoda | Polyxenida | Sphaeropoeidae | − | − | − | − | − | − | + | − | − | − | + | + |
| Arthropoda | Diplopoda | Spirobolida | Spirobolidae | − | + | − | − | + | + | + | + | − | + | + | − |
| Arthropoda | Diplopoda | Julida | Julidae | − | + | − | + | + | + | + | − | + | + | + | + |
| Arthropoda | Chilopoda | Scutigeromorpha | Scutiger coleoptrata | − | − | − | − | − | − | + | − | − | − | + | − |
| Arthropoda | Chilopoda | Lithomorpha | Lithobiidae | − | + | − | + | − | + | − | − | + | + | + | + |
| Arthropoda | Chilopoda | Scolopendromorpha | Scolopendridae | − | − | − | − | − | − | + | + | + | + | + | + |
| Arthropoda | Chilopoda | Geophilomopha | Geophilidae | + | + | + | + | + | + | + | + | + | + | + | + |
| Arthropoda | Symphyla | Symphyla | Scoutigerellidae | − | − | − | − | − | − | + | − | + | − | − | + |
| Arthropoda | Symphyla | Symphyla | Scolopendrellidae | − | − | − | − | − | − | + | + | + | + | + | + |
| Arthropoda | Protura | Acerentomata | Protentomidae | − | − | − | − | − | − | + | + | + | + | + | + |
| Arthropoda | Protura | Acerentomata | Hesperentomidae | − | − | − | − | − | − | − | − | + | − | + | − |
| Arthropoda | Protura | Sinentomata | Sinentomidae | + | − | − | + | + | − | − | − | + | − | − | + |
| Arthropoda | Protura | Sinentomata | Fujientomidae | − | − | − | − | − | − | + | − | − | + | − | − |
| Arthropoda | Collembola | Collembola | Neanuridae | − | − | − | − | − | − | + | + | + | + | + | + |
| Arthropoda | Collembola | Collembola | Onychiuridae | + | − | − | + | + | + | + | + | + | + | + | + |
| Arthropoda | Collembola | Collembola | Sminthuridae | + | + | + | − | + | + | + | + | + | + | + | + |
| Arthropoda | Collembola | Collembola | Hypogastruridae | + | + | − | + | + | + | + | + | + | + | + | + |
| Arthropoda | Collembola | Collembola | Poduridae | + | + | + | + | + | + | + | + | + | + | − | + |
| Arthropoda | Collembola | Collembola | Neelidae | + | + | + | + | + | + | + | + | − | + | + | + |
| Arthropoda | Collembola | Collembola | Isotomidae | + | − | + | + | + | + | + | + | + | + | + | + |
| Arthropoda | Collembola | Collembola | Orchesellidae | − | + | − | − | − | + | + | + | + | + | − | + |
| Arthropoda | Collembola | Collembola | Tomoceridae | − | − | − | − | − | − | + | − | + | + | + | + |
| Arthropoda | Collembola | Collembola | Cyphoderidae | − | + | + | + | − | − | − | − | + | + | − | − |
| Arthropoda | Diplura | Diplura | Japygidae | + | − | − | − | + | − | + | + | + | − | + | − |
| Arthropoda | Diplura | Diplura | Campodeidae | − | + | − | + | + | + | − | − | + | + | − | − |
| Arthropoda | Insecta | Isoptera | Rhinotermitidae | + | − | − | + | − | − | − | − | − | − | − | − |
| Arthropoda | Insecta | Isoptera | Hodotermitidae | − | − | − | − | − | − | + | − | − | − | + | + |
| Arthropoda | Insecta | Isoptera | Kalotermitidae | − | − | − | − | − | − | − | + | + | + | + | + |
| Arthropoda | Insecta | Orthoptera | Tetrigoidea | − | − | − | − | − | − | − | + | − | + | + | + |
| Arthropoda | Insecta | Orthoptera | Grylloidea | − | − | − | − | − | − | + | − | + | − | + | + |
| Arthropoda | Insecta | Deramptera | Forficulidae | − | + | − | − | − | + | + | − | − | + | − | − |
| Arthropoda | Insecta | Deramptera | Spongiphoridae | − | − | − | − | − | − | − | − | + | + | − | − |
| Arthropoda | Insecta | Hemiptera | Tingidae | + | − | − | − | + | − | − | − | − | − | − | − |
| Arthropoda | Insecta | Hemiptera | Lygaeidae | + | − | + | + | + | + | − | + | + | + | − | + |
| Arthropoda | Insecta | Hemiptera | Cydnidae | + | + | − | + | + | + | − | + | + | + | + | + |
| Arthropoda | Insecta | Hemiptera | Hebridae | + | − | − | − | − | + | + | + | + | + | + | + |
| Arthropoda | Insecta | Hemiptera | Enicocephalidae | − | − | − | − | − | − | − | + | − | − | + | + |
| Arthropoda | Insecta | Hemiptera | Pyrrhocoridae | − | − | − | − | − | − | − | + | + | + | − | + |
| Arthropoda | Insecta | Hemiptera | Schizopteridae | − | − | − | − | − | − | − | − | + | − | − | + |
| Arthropoda | Insecta | Hemiptera | Anthocoridae | + | + | − | + | + | + | + | + | − | + | + | − |
| Arthropoda | Insecta | Psocoptera | Amphientomidae | + | − | + | − | + | − | − | − | − | − | − | − |
| Arthropoda | Insecta | Psocoptera | Archipsocidae | − | + | − | + | − | − | − | − | − | − | − | − |
| Arthropoda | Insecta | Psocoptera | Psocidae | − | − | − | − | − | − | − | − | + | − | + | − |
| Arthropoda | Insecta | Psocoptera | Sphaeropsocidae | + | − | − | − | + | − | − | − | − | − | − | − |
| Arthropoda | Insecta | Psocoptera | Liposcelididae | + | + | + | + | + | + | + | + | − | + | − | + |
| Arthropoda | Insecta | Psocoptera | Caeciliidae | − | + | − | + | − | − | − | − | − | − | − | − |
| Arthropoda | Insecta | Thysanoptera | Phlaeothripidae | − | − | − | − | − | − | + | + | + | + | + | + |
| Arthropoda | Insecta | Coleoptera | Discodomidae | + | − | − | + | − | − | − | − | − | − | − | − |
| Arthropoda | Insecta | Coleoptera | Hydrophilidae | + | − | + | + | + | − | − | − | − | − | − | − |
| Arthropoda | Insecta | Coleoptera | Carabidae | + | + | + | − | + | + | − | − | + | + | + | + |
| Arthropoda | Insecta | Coleoptera | Staphylinidae | + | − | + | + | + | + | + | − | − | + | − | + |
| Arthropoda | Insecta | Coleoptera | Georissidae | + | − | − | − | − | + | − | − | − | − | − | − |
| Arthropoda | Insecta | Coleoptera | Lagriidae | + | − | − | − | − | + | − | − | − | − | − | − |
| Arthropoda | Insecta | Coleoptera | Silphidae | + | − | − | − | − | + | − | − | − | − | − | − |
| Arthropoda | Insecta | Coleoptera | Elateridae | + | − | − | − | − | + | − | − | + | + | + | − |
| Arthropoda | Insecta | Coleoptera | Endomychidae | − | − | − | − | − | − | + | − | − | + | − | − |
| Arthropoda | Insecta | Coleoptera | Languriidae | − | − | − | − | − | − | + | − | − | + | − | − |
| Arthropoda | Insecta | Coleoptera | Cucujidae | − | − | − | − | − | − | + | + | − | + | + | + |
| Arthropoda | Insecta | Coleoptera | Mycetoptoophagidae | − | − | − | − | − | − | + | + | + | + | + | + |
| Arthropoda | Insecta | Coleoptera | Scarabaeidae | − | + | − | − | − | + | − | − | + | + | − | − |
| Arthropoda | Insecta | Coleoptera | Lucanidae | − | + | − | − | − | + | − | − | + | + | − | − |
| Arthropoda | Insecta | Coleoptera | Cicindelidae | − | + | − | + | − | + | − | − | − | − | − | − |
| Arthropoda | Insecta | Coleoptera | Biphyllidae | − | − | − | − | − | − | − | + | − | + | − | + |
| Arthropoda | Insecta | Coleoptera | Nitidulidae | − | + | − | − | − | + | − | − | − | − | − | − |
| Arthropoda | Insecta | Coleoptera | Cleridae | + | − | − | − | + | + | − | − | − | − | − | − |
| Arthropoda | Insecta | Coleoptera | Archeocrypticidae | + | − | − | + | − | − | − | − | − | − | − | − |
| Arthropoda | Insecta | Coleoptera | Chrysomelidae | + | − | − | + | − | − | − | − | − | − | − | − |
| Arthropoda | Insecta | Coleoptera | Scydmaenidae | + | − | − | − | − | + | − | − | + | − | + | + |
| Arthropoda | Insecta | Coleoptera | Pselaphidae | − | − | − | − | − | − | + | − | − | − | + | + |
| Arthropoda | Insecta | Coleoptera | Curculionidae | − | − | − | − | − | − | − | + | − | + | − | − |
| Arthropoda | Insecta | Coleoptera | Throscidae | − | − | − | − | − | − | − | − | + | − | − | + |
| Arthropoda | Insecta | Coleoptera | Silvanidae | + | − | − | − | − | + | + | + | − | + | + | + |
| Arthropoda | Insecta | Coleoptera | Carabidae larvae | − | + | − | − | − | + | − | + | − | + | − | − |
| Arthropoda | Insecta | Coleoptera | Lampyridae | − | − | + | − | + | − | − | − | − | − | − | − |
| Arthropoda | Insecta | Lepidoptera | Geometridae larvae | + | − | − | + | − | − | + | − | − | − | − | + |
| Arthropoda | Insecta | Lepidoptera | Hepialide larvae | + | − | − | + | − | − | − | − | − | − | − | − |
| Arthropoda | Insecta | Lepidoptera | Pieridae larvae | − | − | − | − | − | − | − | + | − | − | + | − |
| Arthropoda | Insecta | Lepidoptera | Noctuidae larvae | − | − | − | − | − | − | − | + | − | − | + | − |
| Arthropoda | Insecta | Lepidoptera | Notodontidae larvae | − | − | + | + | − | − | − | − | − | − | − | − |
| Arthropoda | Insecta | Diptera | Ceratopogonidae larvae | + | − | − | + | − | − | − | + | − | + | + | − |
| Arthropoda | Insecta | Diptera | Dolichopodidae larvae | + | − | − | + | − | − | − | − | − | − | − | − |
| Arthropoda | Insecta | Diptera | Asteiidae larvae | + | − | − | + | − | − | − | − | − | − | − | − |
| Arthropoda | Insecta | Diptera | Mycetophilidae larvae | − | − | − | − | − | − | + | − | − | + | − | + |
| Arthropoda | Insecta | Diptera | Scatopsidae larvae | − | + | − | − | + | + | + | − | − | − | + | + |
| Arthropoda | Insecta | Diptera | Chironomidae larvae | − | − | − | − | − | − | + | + | − | + | + | + |
| Arthropoda | Insecta | Diptera | Tipulidae larvae | − | − | − | − | − | − | − | + | − | + | − | − |
| Arthropoda | Insecta | Diptera | Empididae larvae | − | − | − | − | − | − | + | + | + | + | + | − |
| Arthropoda | Insecta | Diptera | Phoridae | − | − | − | − | − | − | − | − | + | − | + | − |
| Arthropoda | Insecta | Diptera | Anisopodidae larvae | + | − | − | + | − | − | − | − | + | − | − | + |
| Arthropoda | Insecta | Diptera | Sciaridae larvae | − | − | − | − | − | − | + | − | − | + | − | − |
| Arthropoda | Insecta | Diptera | Hesperinidae larvae | − | + | − | − | + | − | − | − | − | − | − | − |
| Arthropoda | Insecta | Diptera | Limoniidae larvae | − | − | − | − | − | − | − | + | + | + | + | + |
| Arthropoda | Insecta | Hymenoptera | Ponerinae | + | + | + | + | + | + | − | − | − | − | − | − |
| Arthropoda | Insecta | Hymenoptera | Leptanillinae | − | + | − | + | + | − | + | + | + | + | + | + |
| Arthropoda | Insecta | Hymenoptera | Dorylinae | − | + | − | + | − | + | − | + | + | + | + | − |
| Total taxonomic group number | 80 | 66 | 40 | 79 | 71 | 72 | 87 | 79 | 96 | 106 | 98 | 97 | |||
Appendix E
Appendix G
| Season | Soil Animal Group | Variability Explained (%) | p Values | ||||||||||
|---|---|---|---|---|---|---|---|---|---|---|---|---|---|
| Reduced Model | Axes | pH | SBD | AN | AP | AK | WC | AT | ST | ||||
| CCA1 (RDA1) | CCA2 (RDA2) | ||||||||||||
| Summer | Macrofauna | 27.34% | 0.001 | 0.001 | 0.113 | 0.001 | 0.002 | 0.032 | 0.001 | 0.005 | |||
| Microarthropods | 17.41% | 0.033 | 0.003 | 0.607 | 0.001 | 0.003 | |||||||
| Hygrophilous mesofauna | 26.08% | 0.002 | 0.001 | 0.436 | 0.002 | 0.038 | 0.004 | ||||||
| Autumn | Macrofauna | 16.69% | 0.089 | 0.379 | 0.642 | ||||||||
| Microarthropods | 8.87% | 0.002 | 0.027 | 0.071 | 0.039 | 0.003 | 0.031 | ||||||
| Hygrophilous mesofauna | 13.15% | 0.765 | 0.711 | 0.831 | |||||||||
Appendix H
| Family | Entire Soil Fauna Community | Macrofauna | Microarthropods | Hygrophilous Mesofauna | ||||||||||||||||||||||||||||||||||||||||||||
|---|---|---|---|---|---|---|---|---|---|---|---|---|---|---|---|---|---|---|---|---|---|---|---|---|---|---|---|---|---|---|---|---|---|---|---|---|---|---|---|---|---|---|---|---|---|---|---|---|
| Summer | Autumn | Summer | Autumn | Summer | Autumn | Summer | Autumn | |||||||||||||||||||||||||||||||||||||||||
| Type | Distance | Type | Distance | Type | Distance | Type | Distance | Type | Distance | Type | Distance | Type | Distance | Type | Distance | |||||||||||||||||||||||||||||||||
| NR | MR | HR | 0 | 5 | 10 | NR | MR | HR | 0 | 5 | 10 | NR | MR | HR | 0 | 5 | 10 | NR | MR | HR | 0 | 5 | 10 | NR | MR | HR | 0 | 5 | 10 | NR | MR | HR | 0 | 5 | 10 | NR | MR | HR | 0 | 5 | 10 | NR | MR | HR | 0 | 5 | 10 | |
| Anthocoridae | 0.028 | |||||||||||||||||||||||||||||||||||||||||||||||
| Theridiidae | 0.031 | 0.020 | ||||||||||||||||||||||||||||||||||||||||||||||
| Subulinidae | 0.002 | 0.004 | ||||||||||||||||||||||||||||||||||||||||||||||
| Geophilidae | 0.023 | 0.021 | ||||||||||||||||||||||||||||||||||||||||||||||
| Julidae | 0.011 | 0.006 | ||||||||||||||||||||||||||||||||||||||||||||||
| Leptanillinae | 0.011 | 0.008 | ||||||||||||||||||||||||||||||||||||||||||||||
| Spirobolidae | 0.033 | 0.031 | ||||||||||||||||||||||||||||||||||||||||||||||
| Campodeidae | 0.022 | 0.033 | ||||||||||||||||||||||||||||||||||||||||||||||
| Onychiuridae | 0.001 | 0.001 | ||||||||||||||||||||||||||||||||||||||||||||||
| Isotomidae | 0.013 | 0.012 | ||||||||||||||||||||||||||||||||||||||||||||||
| Hypogastruridae | 0.001 | 0.001 | ||||||||||||||||||||||||||||||||||||||||||||||
| Oribatulidae | 0.020 | 0.022 | ||||||||||||||||||||||||||||||||||||||||||||||
| Pratylenchidae | 0.003 | 0.001 | 0.032 | 0.003 | 0.001 | 0.023 | 0.023 | |||||||||||||||||||||||||||||||||||||||||
| Dorylaimidae | 0.001 | 0.001 | ||||||||||||||||||||||||||||||||||||||||||||||
| Rhabditidea | 0.029 | 0.022 | 0.023 | 0.035 | ||||||||||||||||||||||||||||||||||||||||||||
| Paratylenchidae | 0.031 | 0.007 | 0.029 | 0.007 | ||||||||||||||||||||||||||||||||||||||||||||
| Heteroderidae | 0.002 | 0.004 | ||||||||||||||||||||||||||||||||||||||||||||||
| Aphelenchoidea | 0.001 | 0.015 | 0.001 | 0.010 | ||||||||||||||||||||||||||||||||||||||||||||
| Ctenidae | 0.012 | 0.004 | ||||||||||||||||||||||||||||||||||||||||||||||
| Staphylinidae | 0.031 | 0.025 | ||||||||||||||||||||||||||||||||||||||||||||||
| Kalotermitidae | 0.005 | 0.005 | ||||||||||||||||||||||||||||||||||||||||||||||
| Tetrigoidea | 0.004 | 0.013 | ||||||||||||||||||||||||||||||||||||||||||||||
| Cydnidae | 0.031 | 0.031 | ||||||||||||||||||||||||||||||||||||||||||||||
| Zetorchestidae | 0.009 | 0.006 | ||||||||||||||||||||||||||||||||||||||||||||||
| Malaconothridae | 0.013 | 0.012 | ||||||||||||||||||||||||||||||||||||||||||||||
| Tylenchidae | 0.002 | 0.008 | 0.004 | |||||||||||||||||||||||||||||||||||||||||||||
| Plectidae | 0.024 | 0.024 | ||||||||||||||||||||||||||||||||||||||||||||||
| Japygidae | 0.006 | 0.009 | ||||||||||||||||||||||||||||||||||||||||||||||
| Grylloidea | 0.033 | 0.036 | ||||||||||||||||||||||||||||||||||||||||||||||
| Total number of indicator families | 8 | 8 | 1 | 6 | 3 | 4 | 1 | 1 | 2 | 2 | 6 | 2 | 3 | 2 | 2 | 2 | 1 | 1 | 5 | 1 | 6 | 1 | 1 | |||||||||||||||||||||||||
Appendix I
| Season | Entire Soil Fauna Community | Macrofauna | Microarthropods | Hygrophilous Mesofauna | ||||||||||||||||||||
|---|---|---|---|---|---|---|---|---|---|---|---|---|---|---|---|---|---|---|---|---|---|---|---|---|
| Type | Distance | Type | Distance | Type | Distance | Type | Distance | |||||||||||||||||
| NR | MR | HR | 0 | 5 | 10 | NR | MR | HR | 0 | 5 | 10 | NR | MR | HR | 0 | 5 | 10 | NR | MR | HR | 0 | 5 | 10 | |
| Summer | 8 | 8 | 1 | 6 | 0 | 0 | 2 | 6 | 0 | 0 | 0 | 0 | 2 | 2 | 0 | 0 | 0 | 0 | 5 | 0 | 1 | 6 | 0 | 0 |
| Autumn | 3 | 4 | 1 | 1 | 2 | 0 | 2 | 3 | 0 | 0 | 2 | 0 | 0 | 1 | 1 | 0 | 0 | 0 | 1 | 0 | 0 | 1 | 0 | 0 |
References
- Briar, S.S.; Culman, S.W.; Young-Mathews, A.; Jackson, L.E.; Ferris, H. Nematode community responses to a moisture gradient and grazing along a restored riparian corridor. Eur. J. Soil Biol. 2012, 50, 32–38. [Google Scholar] [CrossRef]
- Stockan, J.A.; Baird, J.; Langan, S.J.; Young, M.R.; Iason, G.R. Effects of riparian buffer strips on ground beetles (Coleoptera, Carabidae) within an agricultural landscape. Insect Conserv. Divers. 2014, 7, 172–184. [Google Scholar] [CrossRef]
- Ives, C.D.; Hose, G.C.; Nipperess, D.A.; Taylor, M.P. Environmental and landscape factors influencing ant and plant diversity in suburban riparian corridors. Landsc. Urban Plan. 2011, 103, 372–382. [Google Scholar] [CrossRef]
- Keten, A.; Eroglu, E.; Kaya, S.; Anderson, J.T. Bird diversity along a riparian corridor in a moderate urban landscape. Ecol. Indic. 2020, 118, 106751. [Google Scholar] [CrossRef]
- Segat, J.C.; Vasoncellos, R.L.F.; Silva, D.P.; Baretta, D.; Cardoso, E.J.B.N. Ants as indicators of soil quality in an on-going recovery of riparian forests. For. Ecol. Manag. 2017, 404, 338–343. [Google Scholar] [CrossRef]
- Middleton, J.A.; Sosa, L.L.D.; Martin, B.C.; Jones, D.L.; Gleeson, D.B. Soil microbes of an urban remnant riparian zone have greater potential for n removal than a degraded riparian zone. Environ. Microbiol. 2020, 22, 3302–3314. [Google Scholar] [CrossRef]
- Olokeogun, O.S.; Kumar, M. An indicator based approach for assessing the vulnerability of riparian ecosystem under the influence of urbanization in the indian himalayan city, dehradun. Ecol. Indic. 2020, 119, 106796. [Google Scholar] [CrossRef]
- Elek, Z.; Lövei, G.L. Patterns in ground beetle (Coleoptera: Carabidae) assemblages along an urbanisation gradient in Denmark. Acta Oecol. 2007, 32, 104–111. [Google Scholar] [CrossRef]
- Ooms, A.; Dias, A.T.C.; van Oosten, A.R.; Cornelissen, J.H.C.; Ellers, J.; Berg, M.P. Species richness and functional diversity of isopod communities vary across an urbanisation gradient, but the direction and strength depend on soil type. Soil Biol. Biochem. 2020, 148, 107851. [Google Scholar] [CrossRef]
- Groffman, P.M.; Bain, D.J.; Band, L.E.; Belt, K.T.; Brush, G.S.; Grove, J.M.; Pouyat, R.V.; Yesilonis, I.C.; Zipperer, W.C. Down by the Riverside: Urban Riparian Ecology. Front. Ecol. Environ. 2003, 1, 315–321. [Google Scholar] [CrossRef]
- Burton, M.L.; Samuelson, L.J.; Pan, S. Riparian woody plant diversity and forest structure along an urban-rural gradient. Urban Ecosyst. 2005, 8, 93–106. [Google Scholar] [CrossRef]
- Burton, M.L.; Samuelson, L.J.; Mackenzie, M.D. Riparian woody plant traits across an urban–rural land use gradient and implications for watershed function with urbanization. Landsc. Urban Plan. 2009, 90, 42–55. [Google Scholar] [CrossRef]
- White, M.D.; Greer, K.A. The effects of watershed urbanization on the stream hydrology and riparian vegetation of Los Peñasquitos Creek, California. Landsc. Urban Plan. 2006, 74, 125–138. [Google Scholar] [CrossRef]
- Yan, L.; Xie, C.; Liang, A.; Jiang, R.; Che, S. Effects of revetments on soil denitrifying communities in the urban river-riparian interface. Chemosphere 2021, 263, 128077. [Google Scholar] [CrossRef] [PubMed]
- Chen, C.; Meurk, C.D.; Hui, C.; Lv, M.; Wu, S. Incorporating local ecological knowledge into urban riparian restoration in a mountainous region of southwest china. Urban For. Urban Green. 2016, 20, 140–151. [Google Scholar] [CrossRef]
- Sauvadet, M.; Chauvat, M.; Brunet, N.; Bertrand, I. Can changes in litter quality drive soil fauna structure and functions? Soil Biol. Biochem. 2017, 107, 94–103. [Google Scholar] [CrossRef]
- Anderson, J.M.; Ineson, P.; Huish, S.A. Nitrogen and cation mobilization by soil fauna feeding on leaf litter and soil organic matter from deciduous woodlands. Soil Biol. Biochem. 1983, 15, 463–467. [Google Scholar] [CrossRef]
- David, J.F. The role of litter-feeding macroarthropods in decomposition processes: A reappraisal of common views. Soil Biol. Biochem. 2014, 76, 109–118. [Google Scholar] [CrossRef] [Green Version]
- Wu, P.; Wang, C. Differences in spatiotemporal dynamics between soil macrofauna and mesofauna communities in forest ecosystems: The significance for soil fauna diversity monitoring. Geoderma 2018, 337, 266–272. [Google Scholar] [CrossRef]
- Swift, M.J.; Heal, O.W.; Anderson, J.M.; Anderson, J.M. Decomposition in Terrestrial Ecosystems; University of California Press: Berkeley, CA, USA; Los Angeles, CA, USA, 1979. [Google Scholar]
- Coleman, D.C.; Callaham, M.; Crossley, D.A., Jr. Fundamentals of Soil Ecology, 3rd ed.; Academic Press: New York, NY, USA, 2017. [Google Scholar]
- Zhang, R. Handbook of Soil Animal Research Methods; China Forestry Press: Beijing, China, 1998. [Google Scholar]
- Yin, W. Pictorial Keys to Soil Animals of China; Science Press: Beijing, China, 1998. [Google Scholar]
- Ferris, H.; Matute, M.M. Structural and functional succession in the nematode fauna of a soil food web. Appl. Soil Ecol. 2003, 23, 93–110. [Google Scholar] [CrossRef]
- Grandy, A.S.; Wieder, W.R.; Wickings, K.; Kyker-Snowman, E. Beyond microbes: Are fauna the next frontier in soil biogeochemical models? Soil Biol. Biochem. 2016, 102, 40–44. [Google Scholar] [CrossRef] [Green Version]
- Trap, J.; Bonkowski, M.; Plassard, C.; Villenave, C.; Blanchart, E. Ecological importance of soil bacterivores for ecosystem functions. Plant Soil 2016, 398, 1–24. [Google Scholar] [CrossRef]
- van Straalen, N.M. Evaluation of bioindicator systems derived from soil arthropod communities. Appl. Soil Ecol. 1998, 9, 429–437. [Google Scholar] [CrossRef]
- Santorufo, L.; van Gestel, C.A.; Rocco, A.; Maisto, G. Soil invertebrates as bioindicators of urban soil quality. Environ. Pollut. 2012, 161, 57–63. [Google Scholar] [CrossRef] [PubMed]
- Hodson, A.K.; Ferris, H.; Hollander, A.D.; Jackson, L.E. Nematode food webs associated with native perennial plant species and soil nutrient pools in California riparian oak woodlands. Geoderma 2014, 228–229, 182–191. [Google Scholar] [CrossRef]
- Gallardo, B.; Gascón, S.; González-Sanchís, M.; Cabezas, A.; Comín, F.A. Modelling the response of floodplain aquatic assemblages across the lateral hydrological connectivity gradient. Mar. Freshw. Res. 2009, 60, 924–935. [Google Scholar] [CrossRef]
- Wu, B.; Zhou, L.; Qi, S.; Jin, M.; Hu, J.; Lu, J. Effect of habitat factors on the understory plant diversity of Platycladus orientalis plantations in Beijing mountainous areas based on MaxEnt model. Ecol. Indic. 2021, 129, 107917. [Google Scholar] [CrossRef]
- Jia, Z. Chinese Plant Illustrated Book; Kaiming Bookstore: Hong Kong, China, 1937. [Google Scholar]
- Anderson, J.M.; Ingram, J.S.I. Tropical Soil Biology and Fertility. In A Handbook of Methods, 2nd ed.; CAB International: Wallingford, UK, 1993; p. 221. [Google Scholar]
- Allen, S.E.; Grimshaw, H.M.; Parkinson, J.A.; Quarmby, C. Chemical Analysis of Ecological Materials, 2nd ed.; Blackwell Scientific Publications: Oxford, UK, 1974. [Google Scholar]
- Miller, R.H.; Keeney, D.R. Methods of Soil Analysis; American Society of Agronomy: Madison, WI, USA, 1982; pp. 149–157. [Google Scholar]
- Solorzano, L. Determination of ammonia in natural waters by the phenol hypochlorite method. Limnol. Oceanogr. 1969, 14, 799–801. [Google Scholar] [CrossRef]
- Homer, C.D.; Pratt, P.F. Methods of Analysis for Soils, Plants and Waters; Agricultural Sciences Press: Berkeley, CA, USA, 1961. [Google Scholar]
- Bower, C.A.; Reitemeier, R.F.; Fireman, M. Exchangeable cation analysis of saline and alkali soils. Soil Sci. 1952, 73, 251–261. [Google Scholar] [CrossRef]
- Xie, W. Study on the Behavioral Experience Level for Yuantong Ancient Town Landscape Space in Chongzhou; Sichuan Agricultural University: Chengdu, China, 2018; pp. 63–65. [Google Scholar]
- Liao, C.; Li, J.; Huang, H. Soil animal community diversity in the forest of the southern subtropical region, China. Acta Ecol. Sin. 1997, 17, 549–555. [Google Scholar]
- Ludwig, J.A.; Reynolds, J.F. Statistical Ecology: A Primer on Methods and Computing; John Wiley: New York, NY, USA, 1988; p. 337. [Google Scholar]
- Guo, Z.; Liu, H.; Sun, X.; Cheng, G. Characristics of Species Diversity of Plant Communities in the Upper Reaches of Bailong River. Chin. J. Plant Ecol. 2003, 27, 388–395. [Google Scholar] [CrossRef] [Green Version]
- Gao, X.M.; Huang, J.H.; Wan, S.Q.; Chen, L.Z. Ecological studies on the plant communitysuccession on the abandoned cropland intaibaishan, qinling mountains Ⅱ. The community α diversity feature of the successional series. Acta Ecol. Sin. 1997, 17, 619–625. [Google Scholar] [CrossRef]
- R Core Team. R: A Language and Environment for Statistical Computing; R Foundation for Statistical Computing: Vienna, Austria, 2021. [Google Scholar]
- Hothorn, T.; Bretz, F.; Westfall, P.; Heiberger, R.M.; Schuetzenmeister, A.; Scheibe, S. Multcomp: Simultaneous Inference in General Parametric Models. R Package Version 1.4-11. 2019. Available online: https://cran.r-project.org/web/packages/multcomp/ (accessed on 18 July 2021).
- Oksanen, J.; Blanchet, F.G.; Friendly, M.; Kindt, R.; Legendre, P.; McGlinn, D.; Minchin, P.R.; O’Hara, R.B.; Simpson, G.L.; Solymos, P.; et al. Vegan: Community Ecology Package (p. R Package Version 2.5-4). 2019. Available online: https://CRAN.R-project.org/package=vegan (accessed on 20 July 2021).
- Caceres, M.D.; Jansen, F. indicspecies: Relationship Between Species and Groups of Sites. 2016. Available online: https://CRAN.R-project.org/package=indicspecies (accessed on 22 July 2021).
- Wei, X.; Wu, P. Responses of soil insect communities to alpine wetland degradation on the eastern Qinghai-Tibetan Plateau, China. Eur. J. Soil Biol. 2021, 103, 103276. [Google Scholar] [CrossRef]
- Queiroz, R.E.; Ventura, M.A.; Silva, L. Plant diversity in hiking trails crossing natura 2000 areas in the azores: Implications for tourism and nature conservation. Biodivers. Conserv. 2014, 23, 1347–1365. [Google Scholar] [CrossRef]
- Levings, S.C. Seasonal, annual, and among-site variation in the ground ant community of a deciduous tropical forest: Some causes of patchy species distributions. Ecol. Monogr. 1983, 53, 435–455. [Google Scholar] [CrossRef]
- Lambeets, K.; Vandegehuchte, M.L.; Maelfait, J.-P.; Bonte, D. Integrating environmental conditions and functional lifehistory traits for riparian arthropod conservation planning. Biol. Conserv. 2009, 142, 625–637. [Google Scholar] [CrossRef] [Green Version]
- Da Silva, P.M.; Berg, M.P.; Serrano, A.R.; Dubs, F.; Sousa, J.P. Environmental factors at different spatial scales governing soil fauna community patterns in fragmented forests. Landsc. Ecol. 2012, 27, 1337–1349. [Google Scholar] [CrossRef]
- Lachat, T.; Chumak, M.; Chumak, V.; Jakoby, O.; Müller, J.; Tanadini, M.; Wermelinger, B. Influence of canopy gaps on saproxylic beetles in primeval beech forests: A case study from the Uholka-Shyrokyi Luh forest, Ukraine. Insect Conserv. Divers. 2016, 9, 559–573. [Google Scholar] [CrossRef]
- Paetzold, A.; Schubert, C.J.; Tockner, K. Aquatic-terrestrial linkages along a braided-river: Riparian arthropods feeding on aquatic insects. Ecosystems 2005, 8, 748–759. [Google Scholar] [CrossRef]
- Tabacchi, E.; Lambs, L.; Guilloy, H.; Planty-Tabacchi, A.M.; Decamps, H. Impacts of riparian vegetation on hydrological processes. Hydrol. Processes 2000, 14, 2959–2976. [Google Scholar] [CrossRef]
- Henneron, L.; Chauvat, M.; Archaux, F.; Akpa-Vinceslas, M.; Bureau, F.; Dumas, Y.; Mignot, L.; Ningre, F.; Perret, S.; Richter, C.; et al. Plant interactions as biotic drivers of plasticity in leaf litter traits and decomposability of quercus petraea. Ecol. Monogr. 2017, 87, 321–340. [Google Scholar] [CrossRef]
- Yasuda, M.; Koike, F. The contribution of the bark of isolated trees as habitat for ants in an urban landscape. Landsc. Urban Plan. 2009, 92, 276–281. [Google Scholar] [CrossRef]
- Eisenhauer, N.; Milcu, A.; Sabais, A.C.W.; Bessler, H.; Brenner, J.; Engels, C.; Klarner, B.; Maraun, M.; Partsch, S.; Roscher, C.; et al. Plant diversity surpasses plant functional groups and plant productivity as driver of soil biota in the long term. PLoS ONE 2011, 6, e16055. [Google Scholar] [CrossRef] [Green Version]
- Fang, X.; Zhao, W.; Wang, L.; Feng, Q.; Ding, J.; Liu, Y.; Zhang, X. Variations of deep soil moisture under different vegetation types and influencing factors in a watershed of the Loess Plateau, China. Hydrol. Earth Syst. Sci. 2016, 20, 3309–3323. [Google Scholar] [CrossRef] [Green Version]
- Chi, Y.; Wang, E.; Wang, J. Identifying the anthropogenic influence on the spatial distribution of plant diversity in an estuarine island through multiple gradients. Glob. Ecol. Conserv. 2020, 21, e00833. [Google Scholar] [CrossRef]
- Gongalsky, K.B. Soil macrofauna: Study problems and perspectives. Soil Biol. Biochem. 2021, 159, 108281. [Google Scholar] [CrossRef]
- Wasserstrom, H.; Steinberger, Y. Does distance from the sea affect a soil microarthropod community? Acta Oecol. 2016, 76, 39–46. [Google Scholar] [CrossRef]
- Schnürer, J.; Clarholm, M.; Boström, S.; Rosswall, T. Effects of moisture on soil microorganisms and nematodes: A field experiment. Microb. Ecol. 1986, 12, 217–230. [Google Scholar] [CrossRef]
- Nielsen, U.N.; Ayres, E.; Wall, D.H.; Li, G.; Bardgett, R.D.; Wu, T.; Garey, J.R. Global-scale patterns of assemblage structure of soil nematodes in relation to climate and ecosystem properties. Glob. Ecol. Biogeogr. 2014, 23, 968–978. [Google Scholar] [CrossRef]
- Papatheodorou, E.M.; Argyropoulou, M.; Stamou, G.P. The effects of large-and small-scale differences in soil temperature and moisture on bacterial functional diversity and the community of bacterivorous nematodes. Appl. Soil Ecol. 2004, 25, 37–49. [Google Scholar] [CrossRef]
- Andriuzzi, W.S.; Franco, A.L.; Ankrom, K.E.; Cui, S.; de Tomasel, C.M.; Guan, P.; Gherardi, L.A.; Sala, O.E.; Wall, D.H. Body size structure of soil fauna along geographic and temporal gradients of precipitation in grasslands. Soil Biol. Biochem. 2019, 140, 107638. [Google Scholar] [CrossRef]
- Huang, Y.; Yesilonis, I.; Szlavecz, K. Soil microarthropod communities of urban green spaces in Baltimore, Maryland, USA. Urban For. Urban Green. 2020, 53, 126676. [Google Scholar] [CrossRef]
- Marathe, A.; Shanker, K.; Krishnaswamy, J.; Priyadarsanan, D.R. Species and functional group composition of ant communities across an elevation gradient in the eastern himalaya. J. Asia-Pac. Èntomol. 2021, 24, 1244–1250. [Google Scholar] [CrossRef]
- Mckinney, M.L. Urbanization, Biodiversity, and Conservation The impacts of urbanization on native species are poorly studied, but educating a highly urbanized human population about these impacts can greatly improve species conservation in all ecosystems. BioScience 2002, 52, 883–890. [Google Scholar] [CrossRef]
- Seto, K.C.; Güneralp, B.; Hutyra, L.R. Global forecasts of urban expansion to 2030 and direct impacts on biodiversity and carbon pools. Proc. Natl. Acad. Sci. USA 2012, 109, 16083–16088. [Google Scholar] [CrossRef] [PubMed] [Green Version]
- Sundermann, A.; Stoll, S.; Haase, S.P. River restoration success depends on the species pool of the immediate surroundings. Ecol. Appl. 2011, 21, 1962–1971. [Google Scholar] [CrossRef]
- Paetzold, A.; Yoshimura, C.; Tockner, K. Riparian arthropod responses to flow regulation and river channelization. J. Appl. Ecol. 2008, 45, 894–903. [Google Scholar] [CrossRef]
- Schwoertzig, E.; Poulin, N.; Hardion, L.; Trérnolières, M. Plant ecological traits highlight the effects of landscape on riparian plant communities along an urban-rural gradient. Ecol. Indic. 2016, 61, 568–576. [Google Scholar] [CrossRef]
- Walsh, C.J.; Roy, A.H.; Feminella, J.W.; Cottingham, P.D.; Groffman, P.M.; Morgan, R.P. The urban stream syndrome: Current knowledge and the search for a cure. J. N. Am. Benthol. Soc. 2005, 24, 706–723. [Google Scholar] [CrossRef]
- Mitchell, R.J.; Hester, A.J.; Campbell, C.D.; Chapman, S.J.; Cameron, C.M.; Hewison, R.L.; Potts, J.M. Explaining the variation in the soil microbial community: Do vegetation composition and soil chemistry explain the same or different parts of the microbial variation? Plant Soil 2012, 351, 355–362. [Google Scholar] [CrossRef]
- Williams, N.; Schwartz, M.; Vesk, P.A.; McCarthy, M.; Hahs, A.; Clemants, S.E.; Corlett, R.; Duncan, R.; Norton, B.; Thompson, K.; et al. A conceptual framework for predicting the effects of urban environments on floras. J. Ecol. 2008, 97, 4–9. [Google Scholar] [CrossRef]
- Lorenzo, P.; Pereira, C.S.; Rodríguez-Echeverría, S. Differential impact on soil microbes of allelopathic compounds released by the invasive Acacia dealbata Link. Soil Biol. Biochem. 2013, 57, 156–163. [Google Scholar] [CrossRef]
- Mack, R.N.; Simberloff, D.; Lonsdale, W.M.; Evans, H.; Clout, M.; Bazzaz, F.A. Biotic invasions: Causes, epidemiology, global consequences, and control. Ecol. Appl. 2000, 10, 689–711. [Google Scholar] [CrossRef]

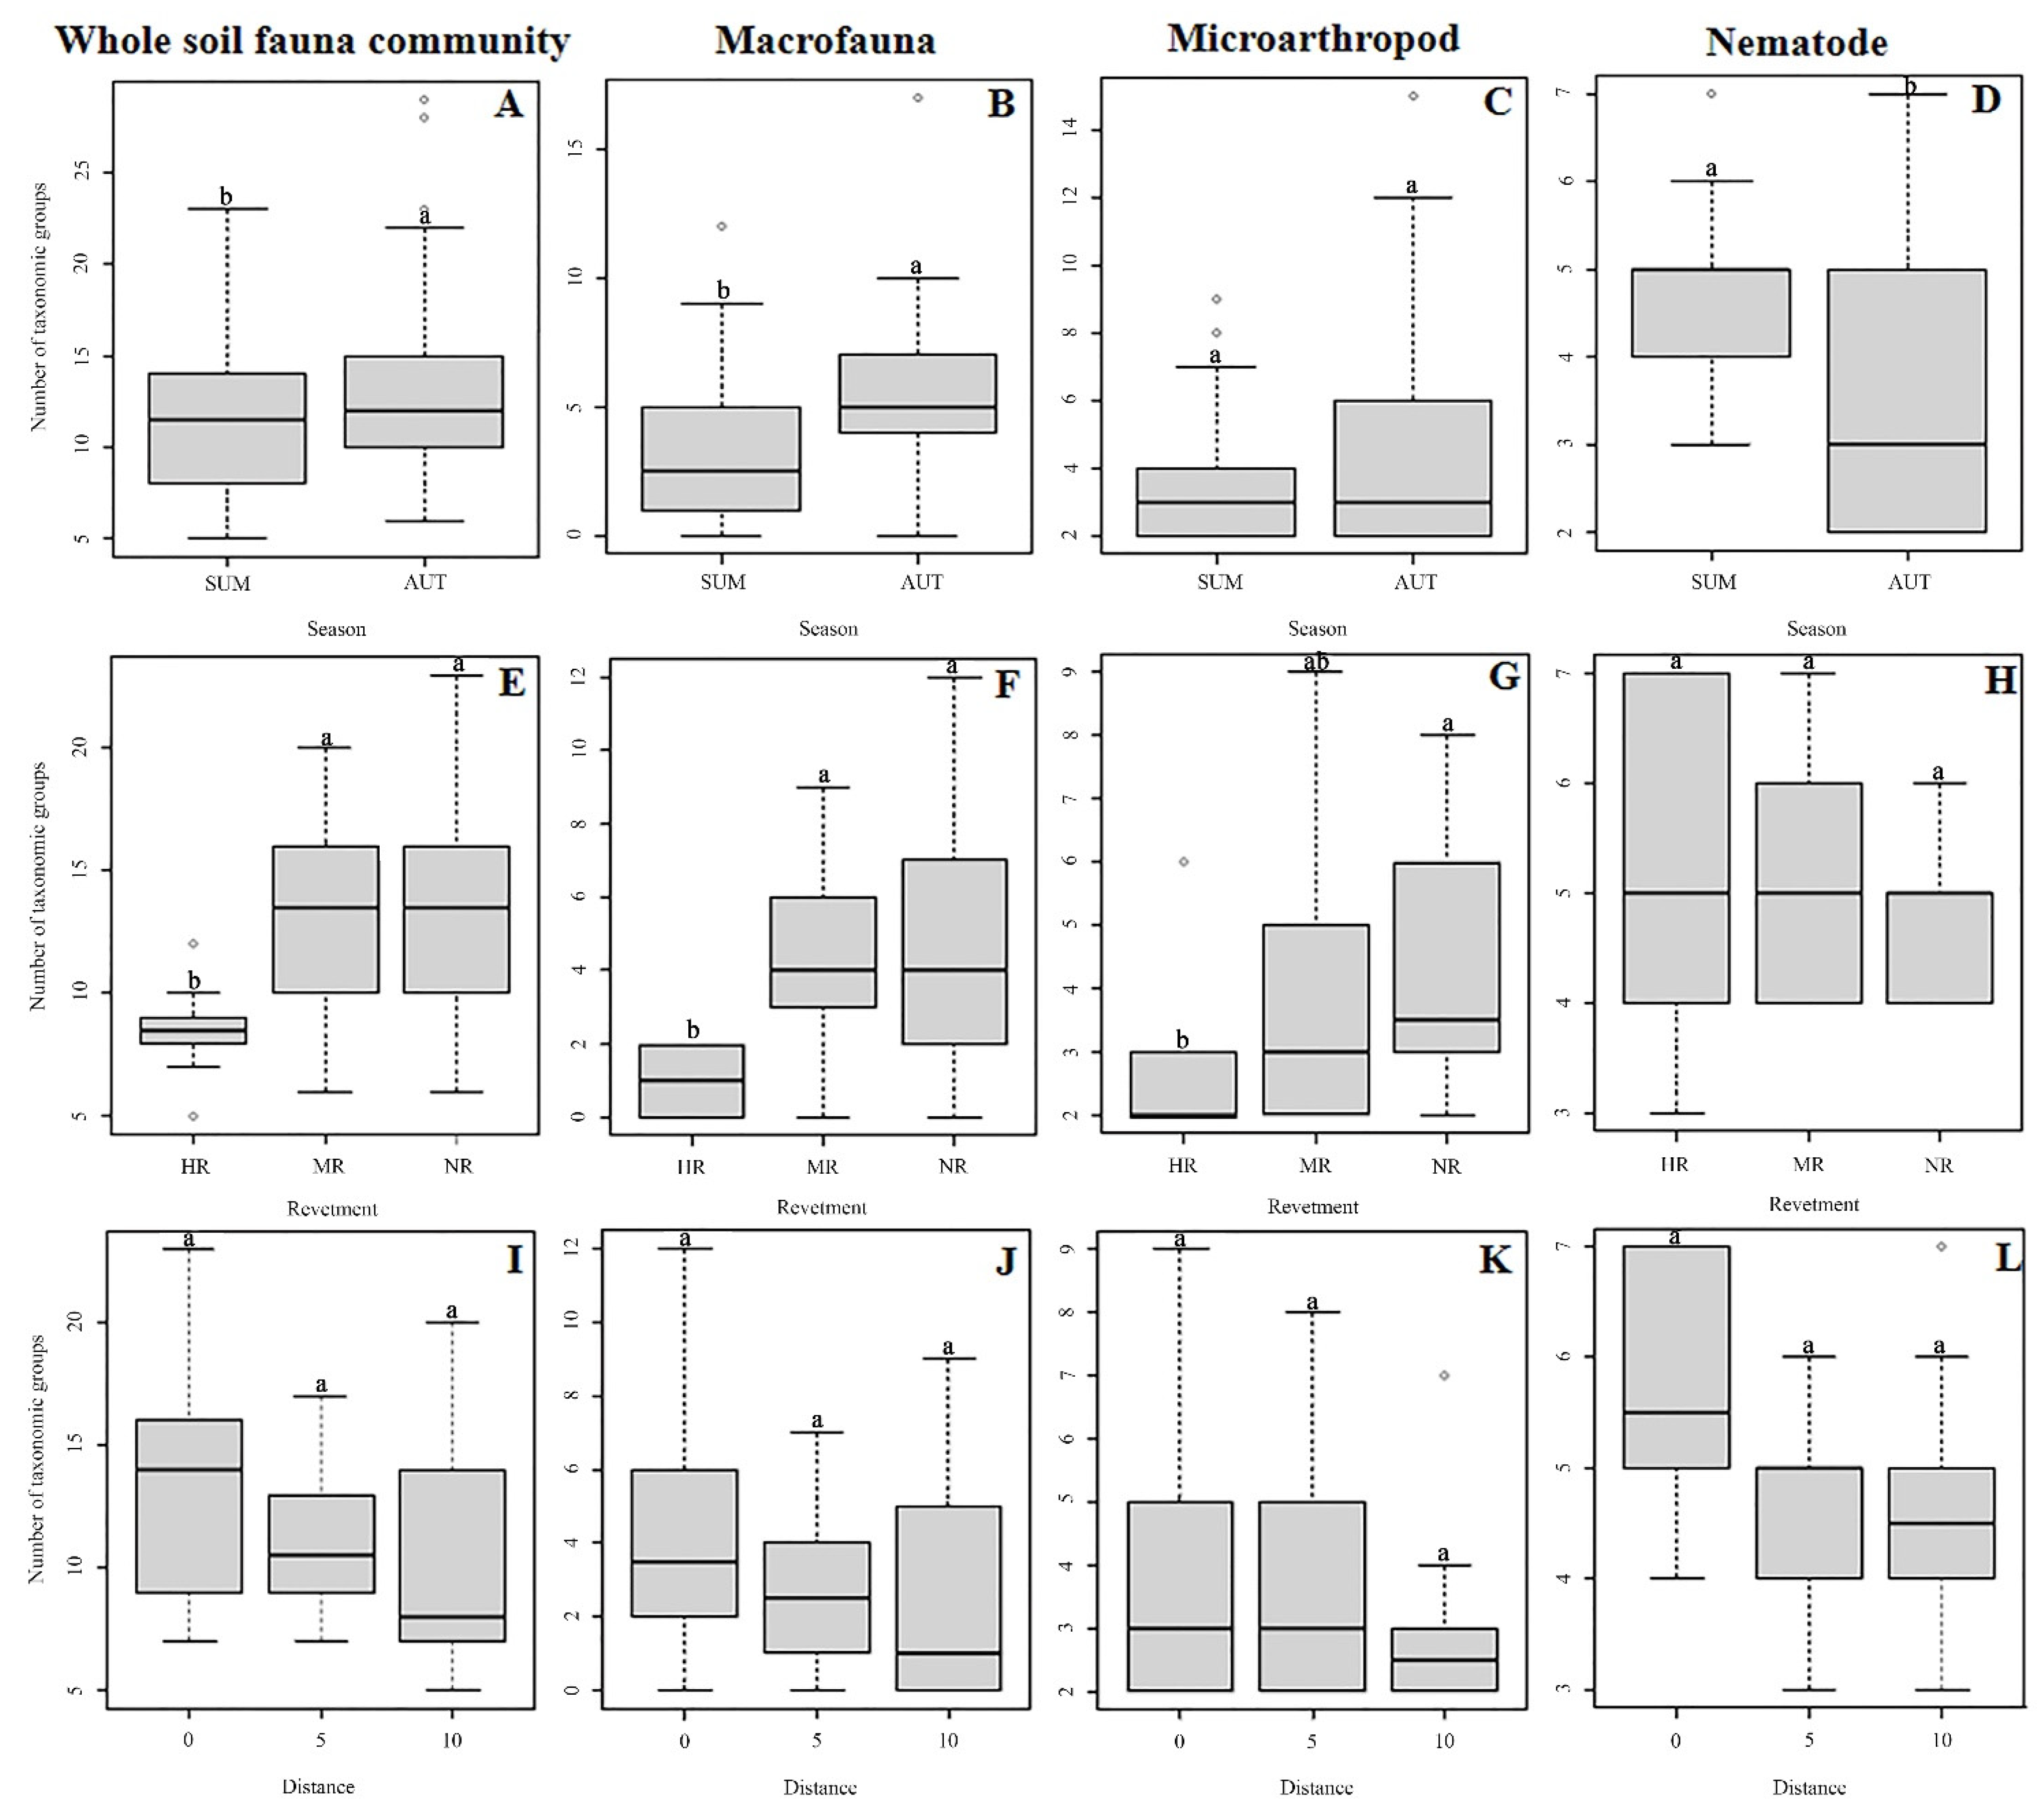


| Season | Factor | Entire Soil Fauna Community a | Macrofauna | Microarthropods | Hygrophilous Mesofauna | |||||
|---|---|---|---|---|---|---|---|---|---|---|
| Density | Richness | Density | Richness | Density | Richness | Density | Richness | |||
| Summer | Type | χ2 | 23.663 | 17.977 | 13.535 | 22.258 | 24.786 | 8.285 | 20.004 | 0.290 |
| p | 0.000 | 0.000 | 0.001 | 0.000 | 0.000 | 0.016 | 0.000 | 0.865 | ||
| Distance | χ2 | 20.114 | 5.801 | 0.593 | 1.838 | 5.338 | 1.679 | 20.467 | 2.376 | |
| p | 0.000 | 0.055 | 0.743 | 0.399 | 0.069 | 0.432 | 0.000 | 0.305 | ||
| Type × Distance | χ2 | 63.697 | 27.845 | 18.911 | 28.294 | 35.197 | 11.178 | 59.865 | 4.472 | |
| p | 0.000 | 0.001 | 0.015 | 0.000 | 0.000 | 0.192 | 0.000 | 0.812 | ||
| Autumn | Type | χ2 | 0.255 | 0.233 | 1.551 | 0.499 | 1.450 | 0.624 | 1.130 | 0.281 |
| p | 0.880 | 0.890 | 0.461 | 0.779 | 0.484 | 0.732 | 0.568 | 0.869 | ||
| Distance | χ2 | 3.103 | 2.636 | 3.575 | 1.110 | 5.870 | 4.660 | 2.429 | 1.203 | |
| p | 0.212 | 0.268 | 0.167 | 0.574 | 0.053 | 0.097 | 0.297 | 0.548 | ||
| Type × Distance | χ2 | 7.093 | 4.139 | 7.073 | 5.923 | 11.795 | 11.245 | 6.249 | 4.056 | |
| p | 0.527 | 0.844 | 0.529 | 0.656 | 0.161 | 0.188 | 0.619 | 0.852 | ||
| Season | Factor | Entire Soil Fauna Community | Macrofauna | Microarthropods | Hygrophilous Mesofauna | |
|---|---|---|---|---|---|---|
| DG | DG | DG | DG | |||
| Summer | Type | NR-MR | ns | ns | ns | ns |
| NR-HR | 0.001 | 0.001 | ns | 0.001 | ||
| MR-HR | 0.001 | 0.001 | ns | 0.008 | ||
| Distance | 0–5 | 0.001 | ns | ns | 0.001 | |
| 0–10 | 0.001 | ns | ns | 0.001 | ||
| 5–10 | ns | ns | ns | ns | ||
| Autumn | Type | NR-MR | ns | ns | ns | ns |
| NR-HR | ns | ns | ns | ns | ||
| MR-HR | ns | ns | ns | ns | ||
| Distance | 0–5 | ns | ns | ns | ns | |
| 0–10 | ns | ns | ns | ns | ||
| 5–10 | ns | ns | ns | ns | ||
| Season | Entire Soil Fauna Community | Macrofauna | Microarthropods | Hygrophilous Mesofauna | ||||
|---|---|---|---|---|---|---|---|---|
| Type | Distance | Type | Distance | Type | Distance | Type | Distance | |
| Summer | 0.001 | 0.001 | 0.001 | 0.945 | 0.001 | 0.463 | 0.001 | 0.001 |
| Autumn | 0.001 | 0.427 | 0.001 | 0.403 | 0.002 | 0.392 | 0.010 | 0.709 |
Publisher’s Note: MDPI stays neutral with regard to jurisdictional claims in published maps and institutional affiliations. |
© 2022 by the authors. Licensee MDPI, Basel, Switzerland. This article is an open access article distributed under the terms and conditions of the Creative Commons Attribution (CC BY) license (https://creativecommons.org/licenses/by/4.0/).
Share and Cite
Huang, Y.; Zeng, Q.; Luo, C.; Zhang, D.; Xie, W.; Xiao, J.; Liu, Y.; Liu, Y.; Du, J. Response of Soil Fauna to the Shift in a Riparian Landscape along an Urban–Rural Habitat Gradient. Int. J. Environ. Res. Public Health 2022, 19, 8690. https://doi.org/10.3390/ijerph19148690
Huang Y, Zeng Q, Luo C, Zhang D, Xie W, Xiao J, Liu Y, Liu Y, Du J. Response of Soil Fauna to the Shift in a Riparian Landscape along an Urban–Rural Habitat Gradient. International Journal of Environmental Research and Public Health. 2022; 19(14):8690. https://doi.org/10.3390/ijerph19148690
Chicago/Turabian StyleHuang, Yumei, Qian Zeng, Chunlan Luo, Danju Zhang, Wenfeng Xie, Jiujin Xiao, Yang Liu, Yushi Liu, and Juan Du. 2022. "Response of Soil Fauna to the Shift in a Riparian Landscape along an Urban–Rural Habitat Gradient" International Journal of Environmental Research and Public Health 19, no. 14: 8690. https://doi.org/10.3390/ijerph19148690