1. Introduction
Noncommunicable diseases (NCDs) are the leading cause of death worldwide and in China—representing 71% and 89% of all deaths, respectively [
1,
2]. Meanwhile, NCDs may facilitate the health burden of communicable diseases. For example, people with NCDs have experienced disproportionately higher rates of COVID-19 hospitalization and mortality. Minority or indigenous populations are particularly vulnerable to obesity and related NCDs in some developed countries [
3,
4]. Data are scarce in developing countries, including China.
The Tibetan population are a unique indigenous population, who traditionally live on the highest plateau in the world—the Qinghai–Tibet Plateau—with an average altitude of more than 4500 m above sea level. Regarding the Tibetan population, around 6 million are living in China, while some live in neighboring countries, notably India because of some historical reasons. In China, they mainly live in five provincial-level administrative areas—the Tibetan Autonomous Region (TAR) and Qinghai, Sichuan, Yunnan, and Gansu provinces. The TAR has the largest Tibetan population, 3.14 million, accounting for 86% of the total population in the TAR. Thus, some indicators for the TAR can be the proxy for the Tibetan population. In this article, we use the term “Tibetan” to describe the population of Tibetan ethnicity, “TAR” to describe the provincial-level administrative areas in China, and “Tibetan areas” to describe the areas (mainly the five provinces in Western China) where Tibetans live.
The unique hypobaric hypoxia environment and other related factors may have caused the suboptimal health status among the Tibetan population, to which NCDs have contributed largely. Their poor health status was indicated by a large gap in the average life expectancy between the Tibetan and benchmark populations. The average estimate for Tibetans in 2019 was 70.6 years, far below China’s national average of 76.8 years and that of developed areas in China such as Shanghai (83.7 years).
The health burden due to overall NCDs was also high among Tibetans. NCD-attributed standardized mortality rates (SMRs) in the TAR were among the highest category of 719–867/100,000 in China. To be specific, the SMRs in the TAR were in the highest category in cardiovascular diseases (387.1–460.8/100,000), but were the second-lowest category in diabetes (4.0–7.4/100,000). However, the mortality rates in cardiovascular diseases and diabetes in China in 2018 were 364.6 and 19.1 per 100,000, respectively, based on a recent national report [
5]. In addition, recent epidemiological studies in different settings have revealed an unexpectedly high prevalence of obesity and related NCDs [
6,
7,
8]. Nevertheless, the obesity and NCD patterns among the overall Tibetan populations were understudied. Further, the variations by the unique environmental and social factors, such as altitude, gender, and religious beliefs, were not yet comprehensively investigated.
To address these research gaps, this study selected obesity and two major NCDs—hypertension and diabetes—as targeted health outcomes and indicators for NCD disparities. This study aimed to (1) systematically examine the prevalence of obesity, hypertension, and diabetes among Tibetans and by gender and age groups; (2) examine the awareness, treatment, and control rates of hypertension and diabetes among Tibetans; (3) compare the health burden of targeted health outcomes in Tibetans with China’s national average; and (4) identify associated risk factors for targeted health outcomes in Tibetans. Findings can yield valuable insights to guide future research and public-health-policy development for similar indigenous populations in China and other countries.
2. Materials and Methods
2.1. Data Sources and Search Strategies
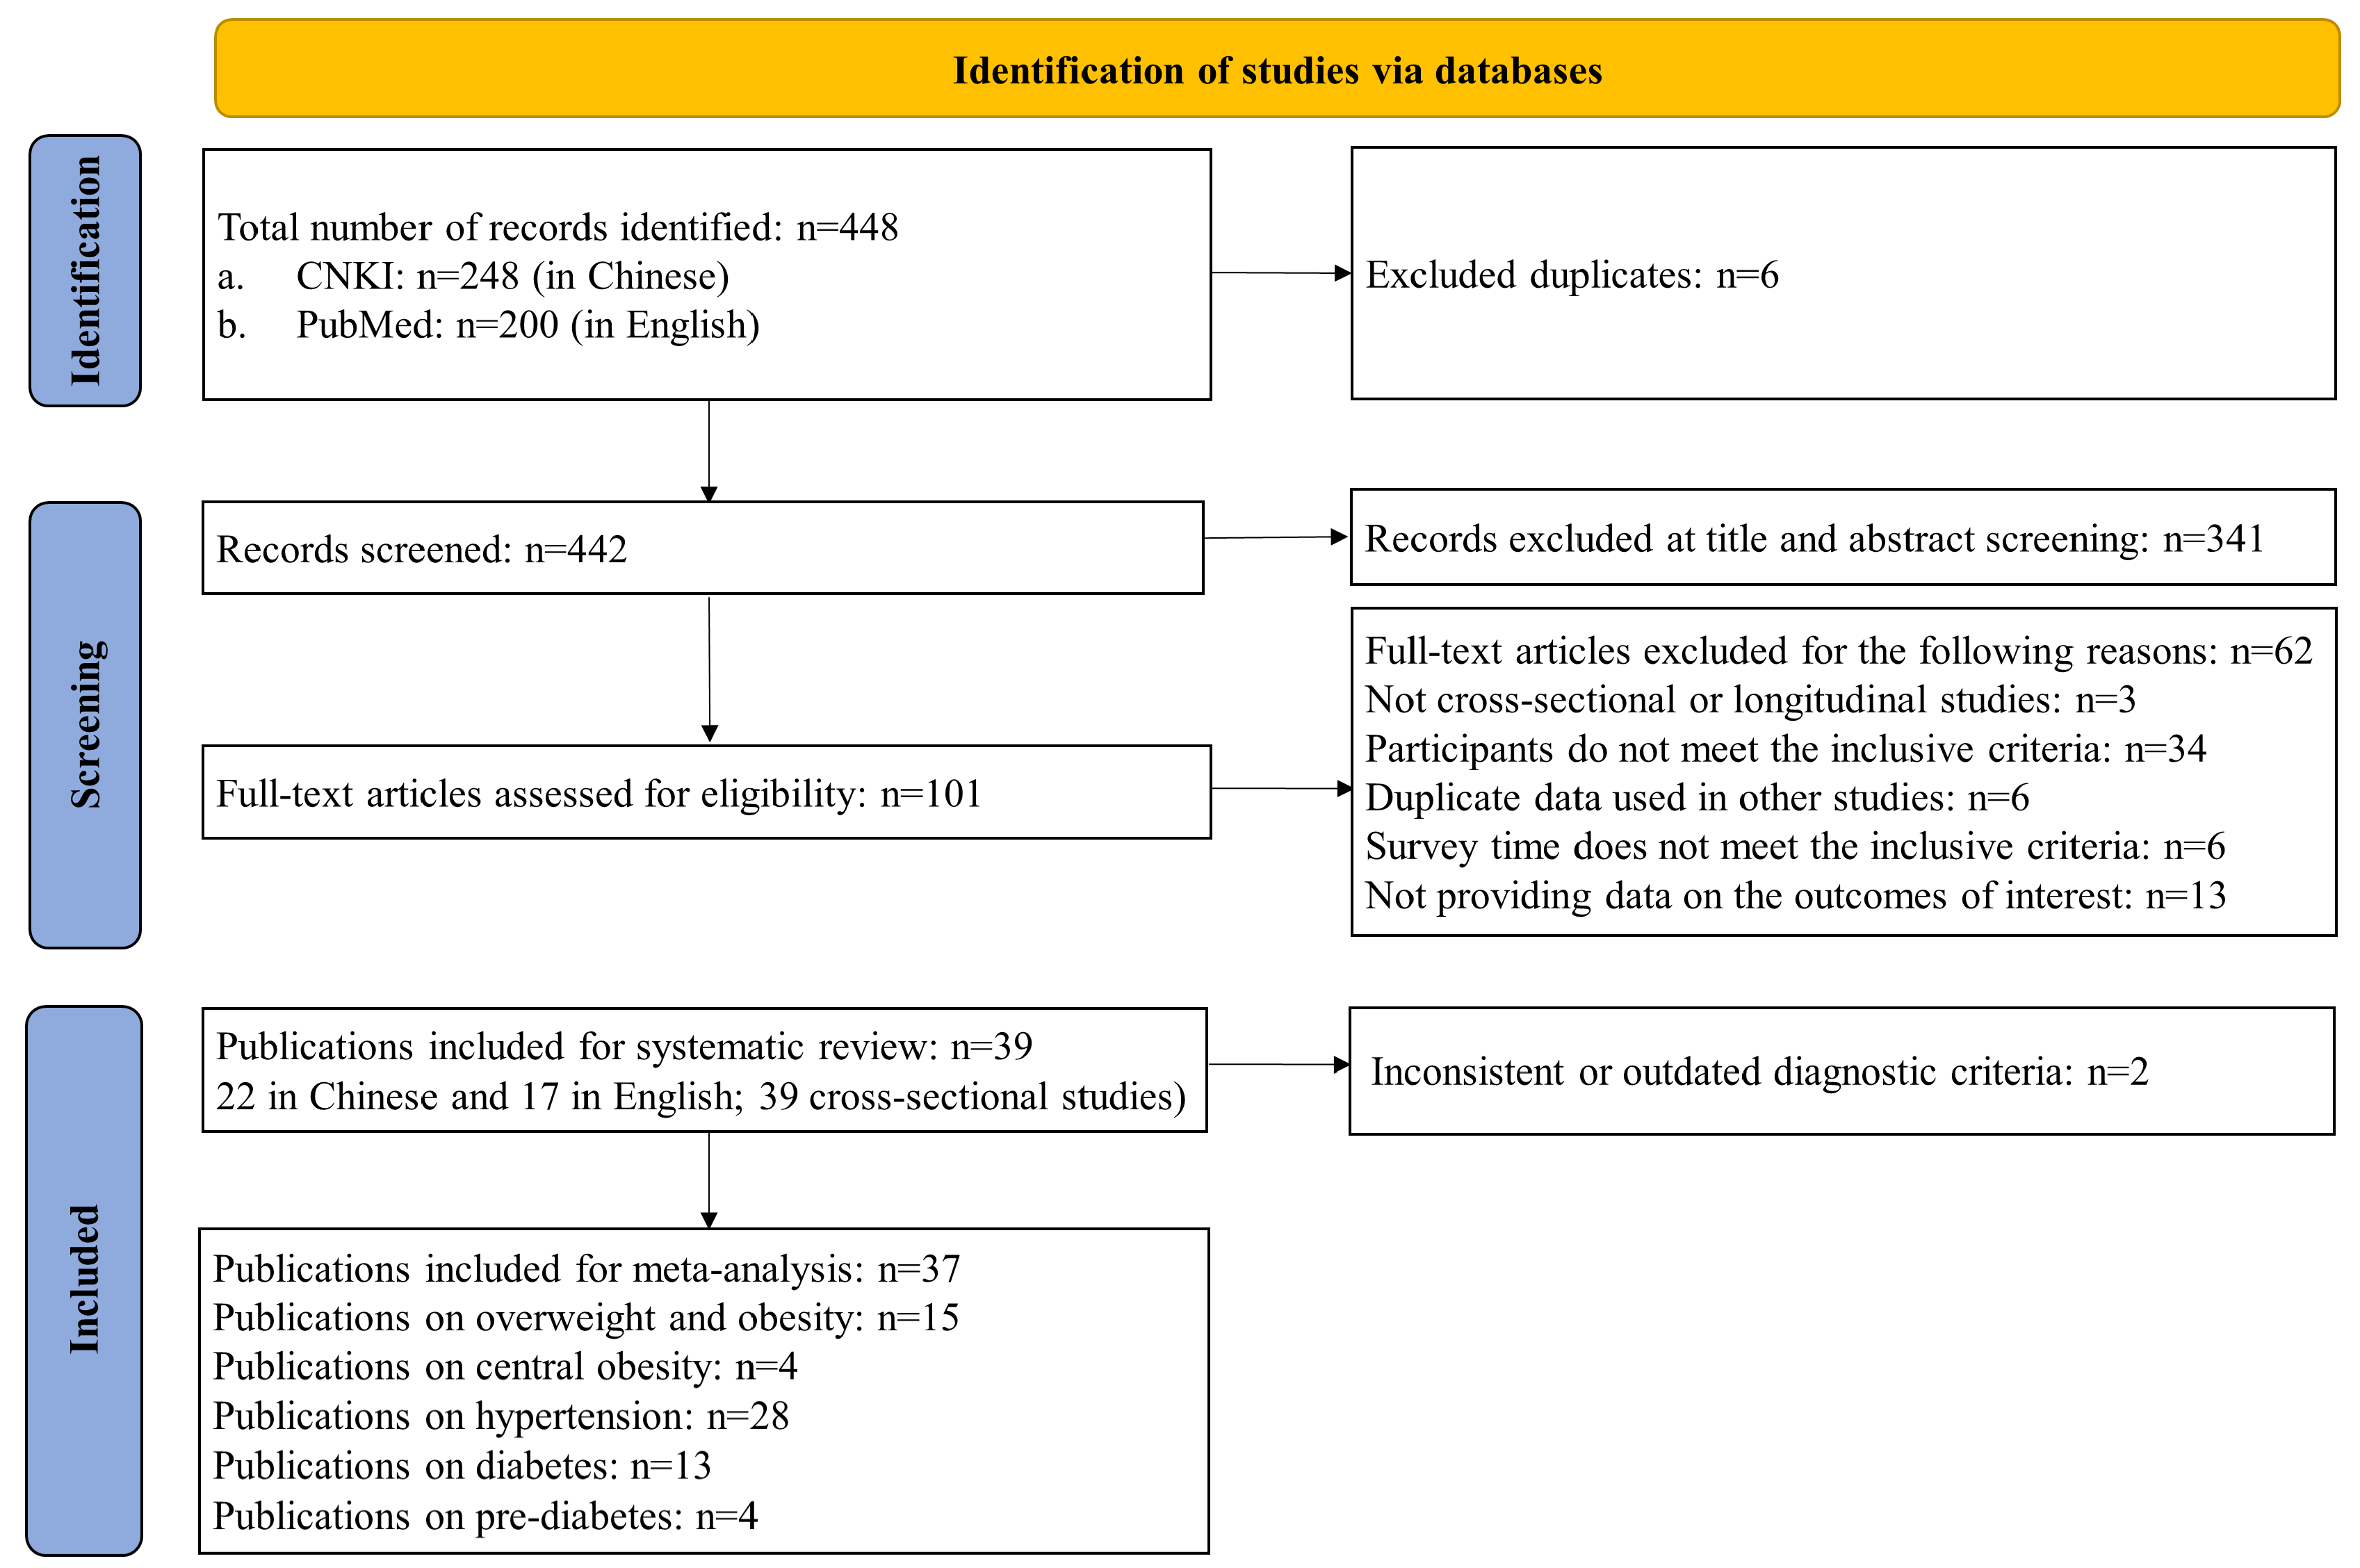
Guided by the Preferred Reporting Items for Systematic Reviews and Meta-Analyses (PRISMA) guidelines, a systematic search was performed in two academic databases: PubMed and China National Knowledge Infrastructure (CNKI). The following search terms were used: (“Tibet*”) AND (“obes*” OR “overweight*” OR “body mass index” OR “BMI” OR “adipos*” OR “waist circumference” OR “diabetes” OR “prediabetes” OR “impaired glucose tolerance” OR “impaired fasting glycemia” OR “hypertension” OR “high blood pressure”). The references of enrolled publications were also screened for eligibility. The PRISMA flowchart of study selection is shown in
Figure 1. The study protocol was registered with PROSPERO, number CRD42021255694.
2.2. Study Selection: Inclusion and Exclusion Criteria
Studies were included if they: (a) were cross-sectional or longitudinal studies published in peer-reviewed journals; (b) were written in English or Chinese; (c) reported prevalence of overweight/obesity and/or central obesity and/or hypertension and/or diabetes and/or pre-diabetes; (d) reported results for the Tibetan population; (e) had samples that did not overlap with other identified studies (if more than one publication used the same data, only the publication with the largest sample size was included); and (f) were published between January 2010 and April 2021.
Studies were excluded if they: (a) were qualitative studies, case reports, editorials, reviews, or meta-analyses; (b) did not provide data on any of the outcomes of interest; (c) surveyed before 2010; and (d) studied special populations, such as pregnant women, college students, etc.
2.3. Diagnostic Criteria for Overweight/Obesity, Hypertension, and Diabetes
Among adults, overweight/obesity was defined as a body mass index (BMI) ≥ 24 kg/m
2 based on the Chinese criteria [
9], or a BMI ≥ 25 kg/m
2 based on the World Health Organization (WHO) criteria [
10]. Central obesity was defined as waist circumference (WC) ≥ 90 cm for men and WC ≥ 80 cm for women based on the International Diabetes Federation (IDF) criteria [
11]. Among children, it was defined according to the Chinese sex–age-specific BMI cutoff points [
12].
Hypertension was defined as a systolic and/or diastolic blood pressure ≥ 140/90 mmHg, and/or a history of hypertension, and/or reported current treatment with antihypertensive medications [
13]. Diabetes was defined as self-reported diabetes, and/or fasting plasma glucose ≥ 7.0 mmol/L, and/or two-hour plasma glucose ≥ 11.1 mmol/L; pre-diabetes was defined as any participants without diabetes but with a fasting plasma-glucose level of 5.6 mmol/L to 6.9 mmol/L, and/or two-hour plasma-glucose level of 7.8 mmol/L to 11.0 mmol/L [
14].
2.4. Data Extraction and Quality Assessment
Two reviewers (K.L. and W.P.) independently extracted the following data using a standardized study form: (a) study-level characteristics (e.g., country/area, study setting, sample size, altitude, author, and survey year); (b) sample characteristics (age, gender, residence, and livelihood); (c) prevalence of overweight/obesity, central obesity, hypertension, diabetes, and pre-diabetes; (d) awareness, treatment, and control rates of hypertension and diabetes; and (f) effect sizes (e.g., Pearson’s correlation coefficient, β coefficient, or odds ratio (OR) for targeted outcomes). Disagreements were discussed to resolve the inconsistencies.
Prevalence estimates of China’s national average were from nationally representative studies conducted by the Chinese Center of Disease Control and Prevention [
2,
15,
16,
17]. For comparison, estimates were extracted for the United States (US) and the globe. Estimates in the US were derived from the National Health and Nutrition Examination Survey [
18,
19]. Global-prevalence estimates were from reports by the WHO or IDF [
10,
20,
21].
The same two reviewers independently assessed the quality of the articles using the US National Institute of Health Quality Assessment Tool for Observational Cohort and Cross-Sectional Studies [
22]. Overall quality was rated based on the total score of the 14 items: ≥7 was rated as good, 4–7 as fair, and <4 as poor.
2.5. Statistical Analysis
Prevalence estimates were calculated by pooling the study-specific estimates using a random-effect (the DerSimonian–Laird method) meta-analysis that accounted for between-study heterogeneity. Subgroup meta-analyses were conducted when stratified results were reported, such as by gender, age group, and urban/rural residence. Possible publication bias was identified by Egger’s test. Sensitivity analyses were conducted by leave-one-out method to show the effect of individual studies. Pooled prevalence estimates among Tibetans were compared with overall estimates for China, the US, and the globe.
Study heterogeneity was assessed using the I2 index. The level of heterogeneity was interpreted as modest (I2 ≤ 25%), moderate (25% < I2 ≤ 50%), substantial (50% < I2 ≤ 75%), or considerable (I2 > 75%). All statistical analyses were conducted in STATA with specific commands after meta set (e.g., meta summarize, meta forest-plot) (Version 17.0; Stata Corp., College Station, TX, USA). All analyses used two-sided tests, and p-value < 0.05 was considered statistically significant.
3. Results
3.1. Characteristics of Studies Included
Of the 448 studies screened (200 in English, 248 in Chinese), 101 were identified as potentially relevant articles, and those full-text papers were independently reviewed. In total, 39 studies (17 in English, 22 in Chinese) met the inclusion criteria for systematic review [
23,
24,
25,
26,
27,
28,
29,
30,
31,
32,
33,
34,
35,
36,
37,
38,
39,
40,
41,
42,
43,
44,
45,
46,
47,
48,
49,
50,
51,
52,
53,
54,
55,
56,
57,
58,
59,
60,
61], of which 37 studies with consistent diagnostic criteria (115,403 participants) were included in the meta-analyses (
Figure 1) [
25,
26,
27,
28,
29,
30,
31,
32,
33,
34,
35,
36,
37,
38,
39,
40,
41,
42,
43,
44,
45,
46,
47,
48,
49,
50,
51,
52,
53,
54,
55,
56,
57,
58,
59,
60,
61].
Data for overweight/obesity, hypertension, and diabetes were pooled separately in the meta-analysis.
Supplementary Table S1 shows study characteristics, key findings, and quality ratings of the 39 studies. All were cross-sectional studies; none were longitudinal studies. Two studies used nationally representative survey data. Seven studies were rated as good quality, twenty-six as fair, and six as poor.
Supplementary Table S2 shows the study quality rating of the 39 studies. No publication bias was identified for overweight/obesity and diabetes studies, but publication bias did exist for hypertension studies by Egger’s test (
Supplementary Table S3). Sensitivity analysis using the leave-one-out method for hypertension prevalence did [
26,
27] not show large impacts by any individual study (
Supplementary Figure S1).
Among the 37 studies included in the meta-analysis, 28 were on hypertension, 19 on overweight/obesity or central obesity, and 14 on diabetes or pre-diabetes. Regarding participants’ age distribution, 32 studies were conducted among adults, and 5 studies were among children. The studies included were geographically diverse: 36 studies were conducted in the five provinces in Western China, the so-called Tibetan areas in China; and 1 study included subjects from both China and India. Specifically, 20 studies were performed in the TAR, 7 studies in Sichuan province, 5 in Gansu province, 4 in Qinghai province, and 2 in Yunnan province.
3.2. Pooled-Prevalence Estimates of Overweight/Obesity, Hypertension, and Diabetes among Tibetans, and Comparison with Average Estimates for China, the US, and the Globe
The prevalence of overweight/obesity, hypertension, and diabetes varied substantially among the included studies. In meta-analyses, most of the I
2 were above 90%. The pooled-prevalence estimates for overweight/obesity among adults, based on the Chinese (BMI ≥ 24 kg/m
2) and WHO (BMI ≥ 25 kg/m
2) criteria, were 47.9% (95% CI 38.0–57.8) and 31.6% (95% CI 20.9–42.3), respectively, while the estimate for central obesity was 43.5% (95% CI 40.4–46.6); the pooled estimate among children was 15.4% (95% CI 13.7–17.2) (
Figure 2). Stratified analyses showed that the overweight/obesity prevalence estimate for men was higher than for women (57.7% vs. 48.2%), while central obesity showed the opposite pattern (
Supplementary Table S4).
The prevalence of hypertension in adults varied from 8.4% to 64.6% in the 25 studies. For the 13 studies reporting diabetes prevalence, the rates varied from 0.9% to 27.0%. The pooled-prevalence estimates for hypertension and diabetes were 31.4% (27.1–35.7) and 7.5% (5.2–9.8), respectively, while the estimate for pre-diabetes was 20.2% (11.5–28.8) (
Figure 3). Stratified analyses showed a higher pooled-prevalence estimate among men than women for both hypertension and diabetes, and a monotonic decrease in estimates among residents in urban areas, rural areas, and Buddhist institutes for both conditions (
Supplementary Table S4).
Compared with average estimates for China, the US, and the globe, the pooled estimates of overweight/obesity among Tibetan adults were lower using the WHO criteria (
Figure 4A). When Chinese criteria were applied, China’s national average estimates among adults in 2010, 2013, 2015, and 2018 were 42.7%, 46.9%, 47.7%, and 51.2%, respectively. Estimates among children (7–17 years) in 2002, 2012, and 2017 were 6.5%, 16.0%, and 19.0%, respectively, compared to the pooled estimate of 15.4% (13.7–17.2), using the Chinese standard. We did not find data on overweight/obesity among Tibetan children using the WHO criteria. The pooled estimate of hypertension in Tibetan adults was higher than the recent estimates for China and the globe (hypertension 31.4%, 27.5%, and 22.0%, respectively) and that of diabetes was lower than the recent estimates for China, the US, and the globe (7.5%, 11.9%, 14.6%, and 9.3%, respectively) (
Figure 4) [
2,
10,
15,
16,
17,
18,
19,
20,
21].
Diagnostic criteria: (1) overweight/obesity among adults was defined as BMI ≥ 25 kg/m2 (WHO criteria); (2) hypertension among adults was defined as systolic and/or diastolic blood pressure ≥ 140/90 mmHg; and (3) diabetes was defined as self-reported diabetes, and/or fasting plasma glucose ≥ 7.0 mmol/L, and/or two-hour plasma glucose ≥ 11.1 mmol/L, and/or HbA1c ≥ 6.5%. Data sources: overweight and obesity: (1) for China, national-average prevalence was from the China Chronic Disease and Risk Factors Surveillance (CCDRFS) program; (2) prevalence in the United States was from the National Health and Nutrition Examination Survey (NHANES); and (3) global prevalence was from the World Health Organization (WHO). Hypertension and diabetes: (1) Chinese national-average prevalence for 2010 and 2013 was from the Report on Chronic Diseases and Risk Factors Surveillance in China (2010 and 2013); for 2018, it was from the Report on Nutrition and Chronic Disease Status of Chinese Residents (2020). (2) For the US, prevalence of hypertension and diabetes was from the National Health and Nutrition Examination Survey (NHANES), 2017–2018. (3) Global prevalence of hypertension was from the World Health Organization (WHO), and prevalence of diabetes among adults (20–79 years) was from the IDF Diabetes Atlas 9th edition, published in 2019.
3.3. Awareness, Treatment, and Control Rates of Hypertension and Diabetes, Compared with China’s National Average
Five studies examined the rates of awareness, treatment, and control for hypertension and showed generally low rates [
36,
37,
42,
47,
59]. Among the five studies, two in Gansu revealed consistently lower awareness, treatment, and control rates for hypertension than China’s national average, three in Lhasa and two influential Buddhist institutes and their surrounding communities showed slightly better, but still low, rates [
42,
47,
59]. The study in Gansu showed the rates monotonically decreased when educational level decreased [
36]. A similar monotonic decrease in the rates was also observed in urban, agricultural, and pastoral areas [
37]. Two studies suggested local residents had better awareness and treatment rates than monks and nuns [
36,
42]. We identified two studies of diabetes management among Tibetans, and showed generally lower awareness, treatment, and control rates than China’s national average (
Table 1) [
38,
47].
3.4. Risk Factors for Obesity, Hypertension, and Diabetes
We identified 11 studies that examined the environmental, socioeconomic, and lifestyle factors associated with obesity, hypertension, and diabetes among Tibetan adults using multi-variable regression. Nine studies investigated factors for hypertension [
31,
40,
42,
46,
49,
56,
59,
60,
61], while two investigated factors for diabetes and/or pre-diabetes, but none did so for obesity [
43,
58]. This suggests that more future research is needed on the factors affecting diabetes and obesity risks among Tibetans.
One of the 11 studies included Tibetans from both China and India [
43]. Our re-calculated results showed much higher prevalence of overweight/obesity, hypertension, and diabetes among Tibetans living in China than those in India (overweight/obesity, 12.7% vs. 7.2%; hypertension 46.3% vs. 39.1%; diabetes 12.7% vs. 7.2%). More future research is needed to better understand these differences, which can indicate the effects of environmental factors on these health conditions.
Regarding the influencing factors for hypertension, urban residence was consistently shown as an independent risk factor for hypertension (OR 1.46 to 1.99) [
31,
59]. Living in high-altitude areas was also a consistent risk factor. Depending on cut-off values for “high” altitude and different populations, the ORs ranged from 1.46 to 2.07 [
46,
56]. Being a monk or a nun was protective for hypertension, compared to being a community resident (OR 0.62) [
42]. The association between educational attainment and hypertension was inconsistent, probably due the different reference values for education [
49,
61]. Regarding lifestyle factors, an inconsistent relationship was shown between hypertension and physical activity [
42,
61]; two studies identified alcohol drinking as an influencing factor [
56,
60], while one did not [
42]; two identified smoking as risk factor [
56,
60], while one did not [
59]; and one reported that more time spent practicing Buddhist activities decreased hypertension risks [
40]. Among dietary factors, vegetarian diet and occasional coffee drinking were associated with decreased ORs for hypertension [
31,
42]; while excess salt intake and daily fat and oil intake were positively associated with hypertension [
31,
59].
Regarding the influencing factors for diabetes, farmers and urban dwellers had higher or marginally higher risks for diabetes compared to nomads [
43]; neither high altitude nor smoking was associated with the prevalence of diabetes [
43,
58].
4. Discussion
This is the first comprehensive investigation with meta-analysis on obesity and NCD burden among the Tibetan population and highlanders, using findings from 39 published studies and compared with national average estimates for China, the US, and the globe. Our study findings revealed a high burden of obesity and hypertension among the Tibetan population, and the diversified NCD patterns depended on the geographical, environmental, and lifestyle factors. Specifically, pooled-prevalence estimates show almost one-third of Tibetan adults and one-sixth of Tibetan children were overweight or obese, and the estimate of hypertension (31.4%) was higher than recent estimates for China and the globe (27.5% and 22.0%). The low rates of awareness, treatment, and control for hypertension and diabetes further increased the health burden of NCDs. Importantly, high altitude and urban residence were consistent risk factors for hypertension. Only limited studies investigated influencing factors for diabetes, and none have done so for obesity. Further, the finding of the low diabetes prevalence among Tibetans, which did not match the prevalent obesity, raised interesting scientific questions related to public health and clinical management.
However, all these 39 identified studies are based on local study samples and cross-sectional surveys. Neither representative studies of Tibetan population nor longitudinal studies were identified. Future research with such a study design is needed.
4.1. Double Burden of Malnutrition (DBM) in Tibetans
Previously, most public health and research efforts regarding Tibetans in China had focused on undernutrition, while not many have focused on NCDs. Available data have shown steady improvements in undernutrition problems in Tibetans, thanks to national and local efforts. Our study findings suggest that future efforts need to address DBM and the increasing NCD burden in Tibetans. The over-nutrition and NCD problems in the Tibetan population in China are likely to become worse in the near future, considering economic development, increase in family income, and shifts in living environment, lifestyle, and occupation factors.
Both DBM across the lifecycle and DBM among children contribute to the prevalent adult obesity. The high pooled prevalence of overweight/obesity (31.6% vs. 39.0% worldwide) among Tibetan adults was probably resultant from suboptimal early life nutrition and the obesogenic environment afterward. Such dynamics are prevalent in indigenous populations [
62] and re related to socioeconomic development [
63]. A previous study showed Tibetans were at high risk for under-nutrition decades ago [
64], which made Tibetans more vulnerable to obesity and other NCDs in lifecycle dynamics. This is shown as undernutrition in early life and overnutrition in adulthood, notably as DBM across the lifecycle [
65]. Our previous study revealed a high burden of obesity and NCDs among semi-urbanized Tibetan adults [
8,
45], which was consistent with the results of this study and to a large international collaborated population study among indigenous populations [
4]. Further, this study revealed one-sixth of Tibetan children were overweight or obese. In fact, we found DBM also existed among Tibetan children at the population level [
45]. Both conditions—overnutrition and undernutrition—in childhood may predict obesity in adulthood. Public-health-intervention programs for tackling DBM among Tibetan children, such as family-, daycare-, and school-based interventions, are needed in fighting against NCDs and in promoting health equality.
4.2. High Hypertension Prevalence among Tibetans
The hypertension burden (high prevalence and low management rates) is high among Tibetans, and this also indicates the burden of the cardiovascular diseases affecting them. Some unique lifestyle and environmental factors, such as excess salt intake and high altitude, may have led to the high hypertension rate among Tibetans [
31,
46,
56]. Excess salt intake is the top-ranking dietary risk factor for health, according to the Global Burden of Disease Project [
66]. It has been linked to the common Tibetan practice of drinking butter tea (sūyóu chá), traditionally made from tea leaves, yak butter, water, and salt.
Living in higher altitude areas was a unique risk factor for hypertension. Previous study among inhabitants in the Tibetan areas showed a 2% increase in prevalence of hypertension with every 100 m increase in altitude, which might be in part a result of physiological adaptation to hypobaric hypoxia [
67]. The overall health impacts from the adaptation were unknown. Further, altitude-dependent population-specific cut-offs for hypertension are needed. In addition to the interesting scientific question, the altitude threshold for increased hypertension risks and adverse cardiovascular outcomes is also critical for evidence-based health policy and other integrated polices, such as the migration and resettled programs for Tibetans, as we have summarized before [
8].
4.3. Low Diabetes Prevalence among Tibetans
Future research of diabetes and associated risk factors among Tibetans may provide new insights for the prevention of diabetes. The low pooled-diabetes prevalence among Tibetans (about 40% lower than the national average, 7.5% vs. 11.9%) was consistent with findings from nationally representative surveys [
38,
51] and may be attributed to multifaceted factors. Current evidence has shown the roles of dietary factors and the diagnostic criteria of diabetes. Our study has identified the metabolic protective role of traditional Tibetan diets, in which tsamba, a whole grain rich in β glucagon functioning in glucose regulation, is an important component [
6,
68,
69].
In addition, the cut-off value of HbA1c for diabetes diagnosis among the Tibetan population, which usually had a higher hemoglobin level due to low oxygen adaptation, should be lower than the normal cut-off [
70]. The usage of the identical HbA1c level for diagnosis may lead to an underestimation of diabetes prevalence among Tibetans. Further, studies in other populations, such as Brazilians and Bangladeshis, also showed cut-offs of HbA1c for diabetes diagnosis should be population-specific [
71,
72]. Tibetan-population-specific HbA1c cut-off, therefore, should be investigated. In addition, HbA1c cut-offs stratified by hemoglobin level needs to be considered.
Another explanation for the low diabetes prevalence may be the relatively low life expectancy of Tibetans. Interestingly, another indigenous highland population in Chile showed a low diabetes prevalence (1.5%) but a high overweight/obesity prevalence (men 39.7%; women 58.0%) in 2001, which was in line with our findings among Tibetans [
73]. Underlying genetic, epigenetic, and other mechanisms of low diabetes prevalence in relation to the high-altitude adaption need further investigation.
4.4. Diverse NCD Patterns and Associated Risk Factors in Tibetans
The NCD patterns varied some by geographical, environmental, socioeconomic, and lifestyle factors. Of note, the studies included were unevenly distributed by geographic areas. A number of 37 studies were conducted in China, and only 2 relevant studies were in India [
7,
43]. Of China’s five provincial-level Tibetan areas, over half of the included studies were conducted in the TAR, while only two were in Yunnan. Some of the macro- and meso-level determinants, such as natural and social environments, political systems, and economic development, had a strong influence on obesity and related health outcomes [
74], but were largely not studied in the extant literature. This indicates a research gap for further investigation. A unique geographic risk factor for hypertension among Tibetans was high altitude, as discussed above.
Socioeconomic factors may partly explain the differences in prevalence of targeted health outcomes. Lower prevalence of obesity and NCDs exists among Tibetans in India than in China, which was indicated by one included cross-country study in around 2010 [
43], which demonstrated the driving force of economic development [
63]. This was further supported by the higher pooled prevalence of hypertension and diabetes in urban areas compared to rural areas in this study. The fact that rates of obesity and NCDs were more prevalent among Tibetans in the same Indian community in 2016 lends further credence to this view [
7]. In addition to the lagging behind of economic development in the Indian Tibetan community, residents there were the descendants of refugees. The limited resources available may have delayed nutritional and epidemiological transition.
Tibetan Buddhist beliefs and related practices were unique protective factors for obesity and NCD patterns. Our meta-analysis suggested lower pooled-prevalence estimates of hypertension and diabetes among Buddhists in religious institutes compared with urban and rural residents. It also stands to reason that meditative practices may protect Buddhists from hypertension [
40,
42], and a vegetarian diet may explain the lower prevalence of diabetes [
42]. Buddhists also rarely smoke or consume alcohol—lifestyle choices that are linked to NCDs [
75].
4.5. Hypertension and Diabetes Management
The combination of: (1) low rates of awareness, treatment, and control of NCDs among Tibetans, (2) their high pooled-prevalence estimates of obesity and hypertension; and (3) changes in their living environment and lifestyles suggest a potential future NCD crisis and the challenges that exist for mitigating the impact. Tibetan pastoralists—who live at about 4000 m above sea level—are at the highest risk for hypertension-related adverse outcomes, given their low management rates and high prevalence estimates. This is further complicated by the fact that the large geographic region, sparse population, and limited infrastructure make access to medical care and other social services difficult. In a past study that we conducted within pastoral communities undergoing rapid urbanization, almost three-fourths of the adults that we surveyed had no formal education, and fewer than one in six had completed primary school [
6]. This low literacy rate has likely been a barrier to managing NCDs and promoting healthy lifestyles. Given these considerations, Tibetans could potentially benefit from targeted public-health-intervention programs that center on the tenets and practices of Buddhism as well.
4.6. Study Strengths and Limitations
The study has some strengths. First, this is the first systematic review and meta-analysis on obesity and related NCD patterns among Tibetans and among highlanders. Second, we reviewed both English and Chinese peer-reviewed publications to gain a comprehensive and culturally informed understanding of the topic. Third, we addressed a clear gap in the literature by considering both natural and social determinants of NCD patterns, such as altitude, livelihood, residence, and religion. In particular, religion’s role in NCD patterns and its potential implications for promoting public health were examined.
This study also has limitations. First, the pooled-prevalence estimates of obesity, hypertension, and diabetes were not standardized. There are considerable variations in study design, study sample selection, and data-analysis methods of the included studies. Second, there was large variability in estimates across reviewed studies. These limited their comparability among the included studies and with the national average of China and other populations. In addition, some of the included studies were of suboptimal quality according to the assessment tool. Nevertheless, we have used the best data available to increase understanding of this important topic.
4.7. Policy Implications and Recommendations for Future Research
This study has some important public health and policy implications. First, double-track actions are needed to tackle the ‘double burden’ of increasing the high burden of NCDs and the previously dominant undernutrition and communicable diseases among Tibetans. Second, the higher hypertension prevalence and the lower prevalence of overweight/obesity and diabetes among Tibetans compared with the national average in China, and their poor NCD management showed a critical time window to tackle the NCDs burden among the Tibetan population, in order to avoid worse health and economic consequences in the future. It is necessary to build the capacity of healthcare professionals at the community level, improve the accessibility to healthcare services, and increase the health literacy level among Tibetan residents. Third, the potential health consequences of the increased risks for hypertension in high-altitude areas have important health implications for resettling and relocation programs, which moved many Tibetan pastoralists down to urban areas [
8]. Finally, Buddhist institutes and practices can serve as a platform for health promotion and implementation strategies, given the generally low educational level and wide-spread Buddhist beliefs and practices among Tibetans.
Our recommendations for future research include: First, studies using Tibetan-population representative samples and longitudinal studies are needed. This is probably similar for other minority populations in China. A coordinated design and conduction are necessary for such studies. Moreover, translational studies are needed to transfer the identified determinants to evidence-based and culturally sensitive actions. Further, the mechanistic exploration to the low diabetes prevalence among Tibetans and among highlanders may provoke important insights for diabetes prevention and management. Finally, validated cut-offs for hypertension and diabetes diagnosis among Tibetans need to be developed. Possible misclassification of such cases in clinical management is also an interesting and meaningful research question.
5. Conclusions
This study revealed the high health burden of obesity and related NCDs among the Tibetan population and the critical time window to tackle obesity and NCDs. There is a need for more rigorous research on this population, including a representative longitudinal study of the Tibetan population and translational and clinical studies to inform tailored interventions and evidence-based, culturally sensitive policy development. Inter- and intra-population health disparity in NCDs should be addressed. In addition, our findings may have some important implications for other indigenous populations in China and for highlanders in other countries, to achieve the Healthy China 2030 national goals and the United Nations’ Sustainable Development Goals.
Supplementary Materials
The following supporting information can be downloaded at:
https://www.mdpi.com/article/10.3390/ijerph19148787/s1. Table S1: Characteristics and key findings of the included studies for systematic review (
n = 39) and meta-analysis (
n = 37); Table S2: Study quality assessment for the included 39 studies; Table S3: The Egger’s test for publication bias of the included studies for overweight/obesity, diabetes, and hypertension; Table S4: Subgroup meta-analysis of pooled prevalence (%, 95% CI) estimates of overweight/obesity, hypertension, and diabetes among the Tibetan population based on the included studies; Figure S1: Sensitivity analysis of the included studies for hypertension.
Author Contributions
Conceptualization, Y.W. and W.P.; methodology, K.L. and Z.S.; validation, W.P. and K.L.; formal analysis, K.L., Z.S., W.P. and Y.W.; investigation, W.P. and K.L.; data curation, K.L.; writing—original draft preparation, W.P., A.F.Y. and K.L.; writing—review and editing, W.P., K.L., A.F.Y., Z.S., J.Z., L.J.C., A.H. and Y.W.; visualization, K.L.; supervision, Y.W.; project administration, W.P.; funding acquisition, Y.W. and W.P. All authors have read and agreed to the published version of the manuscript.
Funding
This work was supported by the National Key Research & Development Program of China [grant numbers 2017YFC0907200 & 2017YFC0907201]; the Natural Scientific Foundation of China [grant number 82103846]; and the Chinese Nutrition Society [grant number CNS-SCP-2020-40].
Institutional Review Board Statement
Not applicable.
Informed Consent Statement
Not applicable.
Data Availability Statement
Data analyzed in this study were a re-analysis of existing data, which are contained within the article and the
Supplementary Tables.
Conflicts of Interest
The authors declare that the research was conducted in the absence of any commercial or financial relationships that could be construed as potential conflict of interest.
References
- United Nations & World Health Organization. Time to Deliver. Third UN High-Level Meeting on Non-Communicable Diseases. Available online: https://www.who.int/ncds/governance/third-un-meeting/brochure.pdf (accessed on 20 December 2021).
- The Chinese National Health Commission. The Nutrition and Health Status of the Chinese People (2020 Report). Available online: http://www.scio.gov.cn/xwfbh/xwbfbh/wqfbh/42311/44583/wz44585/Document/1695276/1695276.htm (accessed on 20 December 2021).
- Di Cesare, M.; Khang, Y.-H.; Asaria, P.; Blakely, T.; Cowan, M.J.; Farzadfar, F.; Guerrero, R.; Ikeda, N.; Kyobutungi, C.; Msyamboza, K.P.; et al. Inequalities in non-communicable diseases and effective responses. Lancet 2013, 381, 585–597. [Google Scholar] [CrossRef] [Green Version]
- Anderson, I.; Robson, B.; Connolly, M.; Al-Yaman, F.; Bjertness, E.; King, A.; Tynan, M.; Madden, P.R.; Bang, A.; Coimbra, P.C.E.A., Jr.; et al. Indigenous and tribal peoples’ health (The Lancet-Lowitja Institute Global Collaboration): A population study. Lancet 2016, 388, 131–157. [Google Scholar] [CrossRef]
- The Nutrition and Health Status of the Chinese People (2015 Report); People’s Health Press: Beijing, China, 2015.
- Peng, W.; Liu, Y.; Malowany, M.; Chen, H.; Su, X.; Liu, Y. Metabolic syndrome and its relation to dietary patterns among a selected urbanised and semi-urbanised Tibetan population in transition from nomadic to settled living environment. Public Health Nutr. 2021, 24, 984–992. [Google Scholar] [CrossRef] [PubMed]
- Lin, B.Y.; Genden, K.; Shen, W.; Wu, P.S.; Yang, W.C.; Hung, H.F.; Fu, C.-M.; Yang, K.-C. The prevalence of obesity and metabolic syndrome in Tibetan immigrants living in high altitude areas in Ladakh, India. Obes. Res. Clin. Pract. 2018, 12, 365–371. [Google Scholar] [CrossRef] [PubMed]
- Peng, W. Nutritional implications of Tibetan Plateau resettling and urbanization programmes. In United Nations System Standing Committee on Nutrition (UNSCN)—Nutrition; Oenema, S., Campeau, C., Delmuè, D., Eds.; UNSCN: Roma, Italy, 2019; Volume 44, pp. 83–90. [Google Scholar]
- The Chinese National Health Commission. Health Industry Standards of the People’s Republic of China—Criteria of Weight for Adults. 2013. Available online: http://www.nhc.gov.cn/ewebeditor/uploadfile/2013/08/20130808135715967.pdf (accessed on 20 December 2021).
- World Health Organization. Fact Sheet: Obesity and Overweight. 2021. Available online: https://www.who.int/news-room/fact-sheets/detail/obesity-and-overweight (accessed on 20 December 2021).
- International Diatetes Federation. The IDF Consensus Worldwide Definition of the Metabolic Syndrome. Available online: https://www.idf.org/webdata/docs/%20IDF_Metasyndrome_definition.pdf (accessed on 20 December 2021).
- The Chinese National Health Commission. Health Industry Standards of the People’s Republic of China—Screening for Overweight and Obesity among School-Age Children and Adolescents. 2018. Available online: http://www.nhc.gov.cn/ewebeditor/uploadfile/2018/03/20180330094031236.pdf (accessed on 20 December 2021).
- Joint Committee for Guideline R. 2018 Chinese Guidelines for Prevention and Treatment of Hypertension—A report of the Revision Committee of Chinese Guidelines for Prevention and Treatment of Hypertension. J. Geriatr. Cardiol. 2019, 16, 182–241. [Google Scholar]
- Chinese Diabetes Society. Guideline for the prevention and treatment of type 2 diabetes mellitus in China (2020 edition). Chin. J. Diabetes Mellitus 2021, 13, 315–409. [Google Scholar]
- Wang, L.; Zhou, B.; Zhao, Z.; Yang, L.; Zhang, M.; Jiang, Y.; Li, Y.; Zhou, M.; Wang, L.; Huang, Z.; et al. Body-mass index and obesity in urban and rural China: Findings from consecutive nationally representative surveys during 2004–2018. Lancet 2021, 398, 53–63. [Google Scholar] [CrossRef]
- Chinese Center for Disease Control and Prevention. Report on Chronic Disease Risk Factor Surveillance in China (2010); Military Medical Science Press: Beijing, China, 2012. [Google Scholar]
- Chinese Center for Disease Control and Prevention. Report on Chronic Disease Risk Factor Surveillance in China (2013); Military Medical Science Press: Beijing, China, 2016. [Google Scholar]
- Wang, L.; Li, X.; Wang, Z.; Bancks, M.P.; Carnethon, M.R.; Greenland, P.; Feng, Y.-Q.; Wang, H.; Zhong, V.W. Trends in Prevalence of Diabetes and Control of Risk Factors in Diabetes Among US Adults, 1999–2018. JAMA 2021, 326, 1–13. [Google Scholar] [CrossRef]
- Fryar, C.D.; Ostchega, Y.; Hales, C.M.; Zhang, G.; Kruszon-Moran, D. Hypertension Prevalence and Control Among Adults: United States, 2015–2016. NCHS Data Brief 2017, 289, 1–8. [Google Scholar]
- International Diatetes Federation. IDF Diabetes Atlas, 9th ed.; IDF: Brussels, Belgium, 2019. [Google Scholar]
- World Health Organization. Global NCD Target Reduce High Blood Pressure; WHO: Geneva, Switzerland, 2016. [Google Scholar]
- NHLBI. Study Quality Assessment Tools (Internet); NHLBI: Bethesda, MD, USA, 2020. Available online: https://www.nhlbi.nih.gov/health-topics/study-quality-assessment-tools (accessed on 20 December 2021).
- Xu, R.; Song, Y.; Ma, J.; Zhang, B.; Hu, P. Secular Trend of Overweight and Obesity Prevalence Among Tibetan Primary and High School Students, 1991–2014. Chin. J. Public Health 2017, 33, 1712–1716. [Google Scholar]
- Zhang, M.; Zhang, B. Investigation and Analysis on the Nutritional Status of Tibetan School-age Children in Basu County, Tibet. Tibet. Med. 2019, 40, 79–80. [Google Scholar]
- Chen, N.; Lyu, X. Correlation Analysis of Pre-diabetes Prevalence and Risk Factors in Tibet Plateau. Tibet. Sci. Technol. 2019, 5, 70–72. [Google Scholar]
- Chen, W.; Liu, Q.; Wang, H.; Chen, W.; Johnson, R.J.; Dong, X.; Li, H.; Ba, S.; Tan, J.; Luo, N.; et al. Prevalence and risk factors of chronic kidney disease: A population study in the Tibetan population. Nephrol. Dial. Transpl. 2011, 26, 1592–1599. [Google Scholar] [CrossRef] [PubMed] [Green Version]
- Chen, X.; Danzenggongji. The Relationship Between Physical Activity and Body Composition of Tibetan Junior High School Students in Lhasa. Chin. J. Sch. Health 2020, 41, 1406–1410. [Google Scholar]
- Chen, Y.; Yue, L.; He, L.; Yi, B.; Huang, L.; Li, J.; Tang, Y.; Tian, F. Investigation on the Prevalence of Hypertension Among Preschool Children in Gannan Tibetan Autonomous Prefecture. Chin. J. Prev. Contr. Chron. Dis. 2020, 28, 845–847. [Google Scholar]
- Ciren, W.; Luo, Y.; Zhang, Z.; Chen, N.; Lyu, X.; Mneng, S.; Yang, S.; Amina; Basangpuchi; Li, A.; et al. Investigation of Methabollic Syndrom in Adult Tibetan Population in Lhasa, Tibet. Chongqing Yixue 2020, 49, 3912–3915. [Google Scholar]
- Deng, R.; Wang, G.; Hong, P.; Li, J.; Li, Q.; Wan, Y.; Xiong, H. Illness prevalence rate in Tibet, China: Data from the 2018 National Health Service Survey. BMC Public Health 2020, 20, 955. [Google Scholar] [CrossRef]
- Huang, X.; Zhou, Z.; Liu, J.; Song, W.; Chen, Y.; Liu, Y.; Zhang, M.; Dai, W.; Yi, Y.; Zhao, S. Prevalence, awareness, treatment, and control of hypertension among China’s Sichuan Tibetan population: A cross-sectional study. Clin. Exp. Hypertens. 2016, 38, 457–463. [Google Scholar] [CrossRef]
- Huang, Y.; Ruan, Y. The Obesity Status of Three Ethnic Groups in Yunnan Province and the Use of ROC Curve for Early Warning of Hypertension. Soft Sci. Health 2019, 33, 74–78. [Google Scholar]
- Lai, S.; Wang, H.; Qiao, Z.; Zhang, X.; Wu, X.; Taga; Basang; Zhang, Y. Analysis on the Results of the Physical Examination of Tibetan and Chinese Students in Linzhi, Tibet in 2010. Strait J. Prev. Med. 2011, 17, 21–24. [Google Scholar]
- Li, K.; Gesangluobu; Yang, X.; Changjue; Dawaciren; Gusanglamu; Zhang, M.; Ren, D.; Cidanluobu. Investigation and Comparison of the Prevalence of Metabolic Syndrome in Tibetan and Han Nationalities in Tibet Plateau. J. High Alt. Med. 2017, 27, 52–55. [Google Scholar]
- Li, T.; Liu, Y.; Dan, L.; Guo, J.; Xie, J.; Sanlang, P.; Wang, C. The Prevalence and Risk Factors of Metabolic Syndrome Among Plateau Tibetan Population in Aba area, Sichuan: A Cross-sectional Survey. Mordern Prev. Med. 2020, 47, 4235–4240. [Google Scholar]
- Li, X.; Cai, H.; He, J.; Ramachandran, D.; Xie, P.; Huang, Y.; Wang, H.; Liu, Y.; Qiao, Y.; Zhang, Q. Prevalence, awareness, treatment and control of hypertension in Tibetan monks from Gansu Province, Northwest China. Clin. Exp. Hypertens. 2015, 37, 536–541. [Google Scholar] [CrossRef] [PubMed]
- Li, X.; Qiao, Y.; Li, B.; Li, C. Prevelance and Awareness onf Hypertension in Gansu Gannan Tibetan Adult Population. China J. Cardiol. 2012, 6, 527–529. [Google Scholar]
- Li, Y.; Teng, D.; Shi, X.; Qin, G.; Qin, Y.; Quan, H.; Shi, B.; Sun, H.; Ba, J.; Chen, B.; et al. Prevalence of diabetes recorded in mainland China using 2018 diagnostic criteria from the American Diabetes Association: National cross sectional study. BMJ 2020, 369, m997. [Google Scholar] [CrossRef] [PubMed]
- Liao, A.; Zhang, J.; Zhao, C.; Li, K. Investigation on The Prevalence of Polycythemia and Hypertension in Tibetan Plateau in Qiongjie County, Tibet’s Agricultural Area. Tibet. Sci. Technol. 2015, 12, 31–32. [Google Scholar]
- Liu, K.; Xu, Y.; Wang, S.; Shi, R.; Gong, S.; Li, X.; Yang, Y.; Chen, X. Buddhist Activities related to Sedentary behavior and Hypertension in Tibetan monks. J. Hum. Hypertens. 2019, 33, 756–762. [Google Scholar] [CrossRef] [PubMed]
- Lu, C.; Fang, W.; Chang, L.; Da, Z. Investigation and Analysis of Chronic Diseases of Tibetan Herdsmen in Plateau. Hosp. Admin. J. Chin. PLA 2020, 27, 1166–1169+77. [Google Scholar]
- Meng, Q.; Xu, Y.; Shi, R.; Zhang, X.; Wang, S.; Liu, K.; Chen, X. Effect of religion on hypertension in adult Buddhists and residents in China: A cross-sectional study. Sci. Rep. 2018, 8, 8203. [Google Scholar] [CrossRef]
- Okumiya, K.; Sakamoto, R.; Ishimoto, Y.; Kimura, Y.; Fukutomi, E.; Ishikawa, M.; Suwa, K.; Imai, H.; Chen, W.; Kato, E.; et al. Glucose intolerance associated with hypoxia in people living at high altitudes in the Tibetan highland. BMJ Open 2016, 6, e009728. [Google Scholar] [CrossRef] [Green Version]
- Pan, M.; Dai, X.; Zeng, Z. Investigation of Plateau Hypertension in residents in Muli. J. Mod. Clin. Med. 2014, 40, 295–296. [Google Scholar]
- Peng, W.; Wang, S.; Han, S.; Su, X.; Zhao, L. Double burden of malnutrition in urbanized settled Tibetan communities on the Tibetan plateau. Asia Pac. J. Clin. Nutr. 2020, 29, 161–165. [Google Scholar]
- Peng, Y.; Zeren, L.; Shi, W.; Li, L.; Fang, G.; Xu, H. Prevalence and Risk Factors of Hypertension Among Tibetans in Changdu, Tibet. J. Chongqing Med. Univ. 2020, 45, 552–555. [Google Scholar]
- Sherpa, L.Y.; Stigum, H.; Chongsuvivatwong, V.; Nafstad, P.; Bjertness, E. Prevalence of metabolic syndrome and common metabolic components in high altitude farmers and herdsmen at 3700 m in Tibet. High Alt. Med. Biol. 2013, 14, 37–44. [Google Scholar] [CrossRef] [PubMed]
- Shi, C.; Zhou, L.; Chen, J.; Cheng, L.; Zhang, L. Analysis on the Morphological and Development of Tibetan and Han Nationality Among 7- to 18-year-old Primary and Secondary School Students in Sichuan Province. Chin. J. Child Health Care 2020, 28, 637–641. [Google Scholar]
- Song, C.; Chongsuvivatwong, V.; Zhu Luo Bu, O.; Ji, D.; Sang Zhuo Ma, B.; Sriplung, H. Relationship between hypertension and geographic altitude: A cross-sectional survey among residents in Tibet. J. Int. Med. Res. 2020, 48, 300060520903645. [Google Scholar] [CrossRef] [PubMed]
- Sun, P.; Wang, Q.; Zhang, Y.; Huo, Y.; Nima, N.; Fan, J. Association between homocysteine level and blood pressure traits among Tibetans: A cross-sectional study in China. Medicine 2019, 98, e16085. [Google Scholar] [CrossRef]
- Wang, L.; Gao, P.; Zhang, M.; Huang, Z.; Zhang, D.; Deng, Q.; Li, Y.; Zhao, Z.; Qin, X.; Jin, D.; et al. Prevalence and Ethnic Pattern of Diabetes and Prediabetes in China in 2013. JAMA 2017, 317, 2515–2523. [Google Scholar] [CrossRef]
- Xu, S.; Jiayong, Z.; Li, B.; Zhu, H.; Chang, H.; Shi, W.; Gao, Z.; Ning, X.; Wang, J. Prevalence and Clustering of Cardiovascular Disease Risk Factors among Tibetan Adults in China: A Population-Based Study. PLoS ONE 2015, 10, e0129966. [Google Scholar] [CrossRef]
- Xu, T.; Liu, J.; Zhu, G.; Liu, J.; Han, S. Prevalence of prehypertension and associated risk factors among Chinese adults from a large-scale multi-ethnic population survey. BMC Public Health 2016, 16, 775. [Google Scholar] [CrossRef] [Green Version]
- Xu, T.; Zhu, G.; Liu, J.; Han, S. Gender-specific prevalence and associated risk factors of high normal blood pressure and hypertension among multi-ethnic Chinese adolescents aged 8–18 years old. Blood Press 2015, 24, 189–195. [Google Scholar] [CrossRef] [PubMed]
- Yao, Y.; Fan, P.; Zhang, X. Tibetan High-altitude Areas of Political Science and Law of Publice Servants to Investigate the Statues of Metabolic Syndrom. Mordern Prev. Med. 2010, 37, 1465–1466+71. [Google Scholar]
- Ye, Z.; Yi, J.; Su, L.; Gu, Q. Prevalence and Related Factors of Hypertension Among Tibetan and Han Adultes at Different Altitudes. Chin. J. Soc. Med. 2018, 35, 508–512. [Google Scholar]
- Zhang, H.; Ma, L.; Zhang, Z.; Jiang, Y.; Zhao, Y.; Yang, L.; Liang, D.; Dong, W.; Liu, L.; Zhao, F.; et al. Distribution characteristics of hypertension, fatty liver, and hyperuricemia in adult Tibetan residents: A survey based on a community in Lhasa. J. Environ. Occup. Med. 2020, 37, 1182–1187. [Google Scholar]
- Zhang, Z.; Luo, Y.; Liu, L.; Lyu, X.; Meng, S.; Basangpuchi; Du, J.; Yang, L. Preliminary investigation on prevalence of pre-diabetes and diabetes among Tibetan adults in Lhasa. Chin. J. Diabetes 2019, 27, 567–571. [Google Scholar]
- Zheng, X.; Yao, D.K.; Zhuo-Ma, C.R.; Tang, J.; Wang, T.R.; Zhang, H.H.; Wang, L.X. Prevalence, self-awareness, treatment, and control of hypertension in Lhasa, Tibet. Clin. Exp. Hypertens. 2012, 34, 328–333. [Google Scholar] [CrossRef]
- Zhu, C.; Bian, H. Analysis of Risk Factors in Tibetan Residdents with Hypertension. J. Clin. Cardiol. 2014, 30, 62–64. [Google Scholar]
- Zhuo, M.; Tang, Y.; Kang, F.; Peng, Y. The Prevalence of Hypertention and its Influencing Factors Among Tibetan in Gannan of Gansu Province. Chin. Prev. Med. 2015, 16, 675–679. [Google Scholar]
- Ramirez-Zea, M.; Kroker-Lobos, M.F.; Close-Fernandez, R.; Kanter, R. The double burden of malnutrition in indigenous and nonindigenous Guatemalan populations. Am. J. Clin. Nutr. 2014, 100, 1644s–1651s. [Google Scholar] [CrossRef] [Green Version]
- Gao, L.; Bhurtyal, A.; Wei, J.; Akhtar, P.; Wang, L.; Wang, Y. Double Burden of Malnutrition and Nutrition Transition in Asia: A Case Study of 4 Selected Countries with Different Socioeconomic Development. Adv. Nutr. 2020, 11, 1663–1670. [Google Scholar] [CrossRef]
- Dang, S.; Yan, H.; Yamamoto, S.; Wang, X.; Zeng, L. Poor nutritional status of younger Tibetan children living at high altitudes. Eur. J. Clin. Nutr. 2004, 58, 938–946. [Google Scholar] [CrossRef] [PubMed]
- Wells, J.C.; Sawaya, A.L.; Wibaek, R.; Mwangome, M.; Poullas, M.S.; Yajnik, C.S.; Demaio, A. The double burden of malnutrition: Aetiological pathways and consequences for health. Lancet 2020, 395, 75–88. [Google Scholar] [CrossRef]
- GBD 2017 Diet Collaborators. Health effects of dietary risks in 195 countries, 1990–2017: A systematic analysis for the Global Burden of Disease Study 2017. Lancet 2019, 393, 1958–1972. [Google Scholar] [CrossRef] [Green Version]
- Mingji, C.; Onakpoya, I.J.; Perera, R.; Ward, A.M.; Heneghan, C.J. Relationship between altitude and the prevalence of hypertension in Tibet: A systematic review. Heart Br. Card. Soc. 2015, 101, 1054–1060. [Google Scholar] [CrossRef] [PubMed] [Green Version]
- Peng, W.; Liu, Y.; Liu, Y.; Zhao, H.; Chen, H. Major dietary patterns and their relationship to obesity among urbanized adult Tibetan pastoralists. Asia Pac. J. Clin. Nutr. 2019, 28, 507–519. [Google Scholar] [PubMed]
- Mio, K.; Yamanaka, C.; Matsuoka, T.; Kobayashi, T.; Aoe, S. Effects of β-glucan Rich Barley Flour on Glucose and Lipid Metabolism in the Ileum, Liver, and Adipose Tissues of High-Fat Diet Induced-Obesity Model Male Mice Analyzed by DNA Microarray. Nutrients 2020, 12, 3546. [Google Scholar] [CrossRef] [PubMed]
- Ren, Q.; Lv, X.; Yang, L.; Yue, J.; Luo, Y.; Zhou, L.; Meng, S.; Yang, S.; Puchi, B.; Zhou, X.; et al. Erythrocytosis and Performance of HbA1c in Detecting Diabetes on an Oxygen-Deficient Plateau: A Population-based Study. J. Clin. Endocrinol. Metab. 2020, 105, e1612–e1620. [Google Scholar] [CrossRef]
- do Vale Moreira, N.C.; Montenegro, R.M., Jr.; Meyer, H.E.; Bhowmik, B.; Mdala, I.; Siddiquee, T.; Fernandes, V.O.; Hussain, A. Glycated Hemoglobin in the Diagnosis of Diabetes Mellitus in a Semi-Urban Brazilian Population. Int. J. Environ. Res. Public Health 2019, 16, 3598. [Google Scholar] [CrossRef] [Green Version]
- Bhowmik, B.; Diep, L.M.; Munir, S.B.; Rahman, M.; Wright, E.; Mahmood, S.; Afsana, F.; Ahmed, T.; Khan, A.K.A.; Hussain, A. HbA(1c) as a diagnostic tool for diabetes and pre-diabetes: The Bangladesh experience. Diabet. Med. 2013, 30, e70–e77. [Google Scholar] [CrossRef]
- Santos, J.L.; Pérez-Bravo, F.; Carrasco, E.; Calvillán, M.; Albala, C. Low prevalence of type 2 diabetes despite a high average body mass index in the aymara natives from chile. Nutrition 2001, 17, 305–309. [Google Scholar] [CrossRef]
- Wang, Y.; Zhao, L.; Gao, L.; Pan, A.; Xue, H. Health policy and public health implications of obesity in China. Lancet Diabetes Endocrinol. 2021, 9, 446–461. [Google Scholar] [CrossRef]
- Chiu, T.H.T.; Pan, W.H.; Lin, M.N.; Lin, C.L. Vegetarian diet, change in dietary patterns, and diabetes risk: A prospective study. Nutr. Diabetes 2018, 8, 12. [Google Scholar] [CrossRef] [PubMed] [Green Version]
| Publisher’s Note: MDPI stays neutral with regard to jurisdictional claims in published maps and institutional affiliations. |
© 2022 by the authors. Licensee MDPI, Basel, Switzerland. This article is an open access article distributed under the terms and conditions of the Creative Commons Attribution (CC BY) license (https://creativecommons.org/licenses/by/4.0/).


 ,
, 


