
Chinese Residents’ Healthy Eating Intentions and Behaviors: Based on an Extended Health Belief Model

Abstract
:1. Introduction
2. Theoretical Framework and Research Hypothesis
2.1. Perceived Susceptibility and Perceived Severity
2.2. Perceived Benefits and Perceived Barriers
2.3. Self-Efficacy
2.4. Health Consciousness
2.5. Healthy Eating Intentions
2.6. Moderating Effect of Perceived Barriers
2.7. Mediating Effect of the Healthy Eating Intentions
3. Data Source
3.1. Data Collection and Study Sample Design
3.2. Survey Instrument
4. Result and Discussion
4.1. Common Method Variance
4.2. Reliability and Validity Analysis
4.2.1. Reliability Analysis
4.2.2. Validity Analysis
4.3. Explanatory Power of Model
4.4. Path Analysis
4.5. Mediation Analysis
4.6. Multi-Group Analysis
4.7. Importance Performance Matrix
5. Conclusions and Suggestions
5.1. Conclusions
5.2. Suggestions
5.3. Limitations
Author Contributions
Funding
Institutional Review Board Statement
Informed Consent Statement
Data Availability Statement
Conflicts of Interest
Appendix A. Constructs and Measurement Items
| Construct | Items | Source |
| Perceived Susceptibility | Unhealthy eating can happen to anyone | [51,52] |
| In order to prevent disease, healthy eating should be carried out | ||
| Everyone suffers from various diseases due to unhealthy eating | ||
| Perceived Severity | Unhealthy eating can have a negative impact on life | [15] |
| Unhealthy eating is very harmful | ||
| Unhealthy eating is a serious health issue | ||
| Perceived Benefits | Healthy eating can reduce your risk of illness | [53] |
| Healthy eating can improve your overall physical condition | ||
| Healthy eating can prevent certain diseases (such as hypertension) | ||
| Perceived Barriers | You do not know what healthy eating behaviors are | [53,54] |
| You do not have the time and effort to improve eating behavior | ||
| It is difficult for you to eat healthier | ||
| Self-Efficacy | You have sufficient experience to ensure that your eating is healthy | [53,55] |
| Healthy eating is easy for you | ||
| Healthy eating is within your capabilities | ||
| Health Consciousness | You think you take health very seriously in your life | [56] |
| You often notice and worry about your health | ||
| You will do things that are good for health | ||
| Healthy Eating Intentions | You expect to eat a healthy eating in the future | [57,58] |
| Your chances of switching to a healthy eating are high | ||
| You will reduce unhealthy eating and increase healthy eating | ||
| Healthy eating will be the main dietary pattern for you in the future | ||
| Healthy Eating Behaviors | You eat fruits and vegetables almost every day | [59] |
| You eat fairly lightly | ||
| You basically have a plan for what you eat every day | ||
| You eat almost at the same time every day | ||
| You eat 3 meals almost daily | ||
| You can reasonably arrange the consumption of different types of food in each meal |
Appendix B. Harman’s Single Factor Test
| Total Variance Explained | |||||||||
| Initial Eigenvalues | Extraction Sums of Squared Loadings | Quadratic Sums of Rotational Loadings | |||||||
| Total | % of Variance | Cumulative% | Total | % of Variance | Cumulative% | Total | % of Variance | Cumulative% | |
| 1 | 9.597 | 34.275 | 34.275 | 9.597 | 34.275 | 34.275 | 5.426 | 19.380 | 19.380 |
| 2 | 3.488 | 12.458 | 46.733 | 3.488 | 12.458 | 46.733 | 3.941 | 14.075 | 33.455 |
| 3 | 2.145 | 7.660 | 54.393 | 2.145 | 7.660 | 54.393 | 3.293 | 11.760 | 45.215 |
| 4 | 1.446 | 5.164 | 59.557 | 1.446 | 5.164 | 59.557 | 2.984 | 9.657 | 54.872 |
| 5 | 1.213 | 4.332 | 63.889 | 1.213 | 4.332 | 63.889 | 2.245 | 7.018 | 61.890 |
| 6 | 1.211 | 3.331 | 67.220 | 1.211 | 3.331 | 67.220 | 2.101 | 4.443 | 66.333 |
| 7 | 1.119 | 3.014 | 70.234 | 1.119 | 3.014 | 70.234 | 1.212 | 3.508 | 69.841 |
| 8 | 1.109 | 2.105 | 72.339 | 1.109 | 2.105 | 72.339 | 1.110 | 2.498 | 72.339 |
Appendix C. Common Method Variance Analysis
| Constructs | Items | Substantive Factor Loading (R1) | R12 | Method Factor Loading (R2) | R22 |
| Perceived Susceptibility | SUS1 | 0.801 | 0.642 | 0.190 | 0.036 |
| SUS2 | 0.829 | 0.687 | 0.055 | 0.003 | |
| SUS3 | 0.788 | 0.621 | 0.093 | 0.009 | |
| Perceived Severity | SEV | 0.880 | 0.774 | −0.030 | 0.001 |
| SEV | 0.929 | 0.863 | 0.144 | 0.021 | |
| SEV | 0.923 | 0.852 | 0.009 | 0.000 | |
| Perceived Benefits | BEN1 | 0.882 | 0.778 | −0.009 | 0.000 |
| BEN2 | 0.899 | 0.808 | −0.025 | 0.001 | |
| BEN3 | 0.893 | 0.797 | −0.041 | 0.002 | |
| Perceived Barriers | BAR1 | 0.829 | 0.687 | 0.007 | 0.000 |
| BAR2 | 0.869 | 0.755 | 0.820 | 0.672 | |
| BAR3 | 0.871 | 0.759 | 0.007 | 0.000 | |
| Self-Efficacy | SE1 | 0.862 | 0.743 | −0.044 | 0.002 |
| SE2 | 0.892 | 0.796 | −0.041 | 0.002 | |
| SE3 | 0.891 | 0.794 | 0.010 | 0.000 | |
| Health Consciousness | HC1 | 0.865 | 0.748 | −0.037 | 0.001 |
| HC2 | 0.853 | 0.728 | −0.061 | 0.004 | |
| HC3 | 0.891 | 0.794 | −0.070 | 0.005 | |
| Healthy Eating Intentions | HEI1 | 0.696 | 0.484 | 0.182 | 0.033 |
| HEI2 | 0.741 | 0.549 | −0.035 | 0.001 | |
| HEI3 | 0.744 | 0.554 | 0.029 | 0.001 | |
| HEI4 | 0.728 | 0.530 | 0.050 | 0.003 | |
| Healthy Eating Behaviors | HEB1 | 0.731 | 0.534 | 0.017 | 0.000 |
| HEB2 | 0.801 | 0.642 | −0.066 | 0.004 | |
| HEB3 | 0.803 | 0.645 | 0.004 | 0.000 | |
| HEB4 | 0.866 | 0.750 | 0.033 | 0.001 | |
| HEB5 | 0.896 | 0.803 | 0.026 | 0.001 | |
| HEB6 | 0.893 | 0.797 | −0.015 | 0.000 | |
| Average | 0.841 | 0.711 | 0.043 | 0.029 | |
| Ratio | 24.517 | ||||
Appendix D. The Exploratory Factor Analysis Results of the Measures, Test of KMO, and Bartlett
| Constructs | Items | Factor 1 | Factor 2 | Factor 3 | Factor 4 | Factor 5 | Factor 6 | Factor 7 | Factor 8 |
| Perceived Susceptibility | SUS1 | 0.636 | |||||||
| SUS2 | 0.704 | ||||||||
| SUS3 | 0.715 | ||||||||
| Perceived Severity | SEV1 | 0.816 | |||||||
| SEV2 | 0.819 | ||||||||
| SEV3 | 0.802 | ||||||||
| Perceived Benefits | BEN1 | 0.685 | |||||||
| BEN2 | 0.644 | ||||||||
| BEN3 | 0.663 | ||||||||
| Perceived Barriers | BAR1 | 0.838 | |||||||
| BAR2 | 0.862 | ||||||||
| BAR3 | 0.842 | ||||||||
| Self-Efficacy | SE1 | 0.781 | |||||||
| SE2 | 0.797 | ||||||||
| SE3 | 0.779 | ||||||||
| Health Consciousness | HC1 | 0.568 | |||||||
| HC2 | 0.574 | ||||||||
| HC3 | 0.639 | ||||||||
| Healthy Eating Intentions | HEI1 | 0.665 | |||||||
| HEI2 | 0.709 | ||||||||
| HEI3 | 0.758 | ||||||||
| HEI4 | 0.742 | ||||||||
| Healthy Eating Behaviors | HEB1 | 0.578 | |||||||
| HEB2 | 0.624 | ||||||||
| HEB3 | 0.599 | ||||||||
| HEB4 | 0.771 | ||||||||
| HEB5 | 0.773 | ||||||||
| HEB6 | 0.703 | ||||||||
| Kaiser–Meyer–Olkin | 0.930 | ||||||||
| Bartlett | 0.000 | ||||||||
References
- Han, A.; Sun, T.H.; Ming, J.; Chai, L.; Liao, X.W. Are the chinese moving toward a healthy diet? Evidence from macro data from 1961 to 2017. Int. J. Environ. Res. Public Health 2020, 17, 5294. [Google Scholar] [CrossRef] [PubMed]
- Afshin, A.; Sur, P.J.; Fay, K.A.; Cornaby, L.; Ferrara, G.; Salama, J.S. Health effects of dietary risks in 195 countries, 1990-2017: A systematic analysis for the global burden of disease study. Lancet 2019, 393, 1958–1972. [Google Scholar] [CrossRef] [Green Version]
- Romieu, I.; Dossus, L.; Barquera, S.; Blottière, H.M.; Franks, P.W.; Gunter, M.; Hwalla, N.; Hursting, S.D.; Leitzmann, M.; Margetts, B. Energy balance and obesity: What are the main drivers? Cancer Causes Control 2017, 28, 247–258. [Google Scholar] [CrossRef] [PubMed] [Green Version]
- Rohani, H.; Bidkhori, M.; Eslami, A.A.; Sadeghi, E.; Sadeghi, A. Psychological factors of healthful diet promotion among diabetics: An application of health action process approach. Electron. Phys. 2018, 10, 6647–6654. [Google Scholar] [CrossRef] [Green Version]
- Bettina, E.; Mette, R.S.; Sisse, F.; Lars, J.D.; Tina, V. Intention and perceptions of healthy eating versus actual intake among patients with type 1 and type 2 diabetes and the general population. Patient Prefer. Adherence 2021, 15, 2027–2037. [Google Scholar]
- Zhou, A.B.; Xie, P.; Tian, Z.; Pan, C.C. The influence of emotion on eating behavior. Adv. Psychol. Sci. 2021, 29, 2013–2023. (In Chinese) [Google Scholar] [CrossRef]
- Ji, W.J.; Du, J.; Li, X.L.; Liu, Y.J.; Liang, A.M. Incidence of eating problems and related factors in children aged 1-6 years. Chin. J. Epidemiol. 2020, 41, 1818–1823. (In Chinese) [Google Scholar]
- Shi, S.Y.; Gong, Y.B.; Chai, W.Z. A study on the current situation and influencing factors of unhealthy dietary behaviors among middle school students in Beijing. Chin. J. Health Educ. 2020, 36, 418–422. (In Chinese) [Google Scholar]
- Bouwman, E.P.; Onwezen, M.C.; Taufik, D.; Buisonjé, D.D.; Ronteltap, A. Brief self-efficacy interventions to increase healthy dietary behaviours: Evidence from two randomized controlled trials. Br. Food J. 2020, 122, 3297–3311. [Google Scholar] [CrossRef]
- Alexandria, G.B.; Jannette, B.P.; Kym, B. Dietary intake among church-affiliated african americans: The role of intentions and beliefs. J. Black Psychol. 2020, 46, 29–54. [Google Scholar]
- Chansukree, P.; Rungjindarat, N. Social cognitive determinants of healthy eating behaviors in late adolescents: A gender perspective. J. Nutr. Educ. Behav. 2017, 49, 204–210. [Google Scholar] [CrossRef] [PubMed]
- Jeong, J.Y.; Ham, S. Application of the health belief model to customers’ use of menu labels in restaurants. Appetite 2018, 123, 208–215. [Google Scholar] [CrossRef] [PubMed]
- Wang, T.J.; Wang, H.J.; Zeng, Y.J.; Cai, X.Q.; Xie, L.D. Health beliefs associated with preventive behaviors against noncommunicable diseases. Patient Educ. Couns. 2022, 105, 173–181. [Google Scholar] [CrossRef]
- Kavanaugh, M.; Fisher, K.; Quinlan, J.J. Use of focus groups to identify food safety risks for older adults in the U.S. Foods 2022, 11, 37. [Google Scholar] [CrossRef] [PubMed]
- Chu, H.; Liu, S. Integrating health behavior theories to predict American’s intention to receive a COVID-19 vaccine. Patient Educ. Couns. 2021, 104, 1878–1886. [Google Scholar] [CrossRef]
- Lipman, S.A.; Burt, S.A.; Michael, P.S. Self-reported prevalence of pests in Dutch households and the use of the health belief model to explore householders’ intentions to engage in pest control. PLoS ONE 2017, 12, 2017. [Google Scholar] [CrossRef] [PubMed] [Green Version]
- Rosenstock, I.M.; Strecher, V.J.; Becker, M.H. Social learning theory and the health belief model. Health Educ. Behav. 1988, 15, 175–183. [Google Scholar] [CrossRef]
- Wang, M.L.; Huang, L.; Pan, C.L.; Bai, L. Adopt proper food-handling intention: An application of the health belief model. Food Control 2021, 127, 108169. [Google Scholar] [CrossRef]
- Janz, N.K.; Becker, M.H. The health belief model: A decade later. Health Educ. Behav. 1984, 11, 1–47. [Google Scholar] [CrossRef] [Green Version]
- Pan, F.; Hsu, P.K.; Chang, W.H. Exploring the factors affecting bitter melon peptide intake behavior: A health belief model perspective. Risk Manag. Healthc. Policy 2020, 13, 2219–2226. [Google Scholar] [CrossRef]
- Tajeri, M.M.; Raheli, H.; Zarifian, S.; Yazdanpanah, M. The power of the health belief model to predict water demand management: A case study of farmers’ water conservation in Iran. J. Environ. Manag. 2020, 263, 110388. [Google Scholar] [CrossRef]
- Chamroonsawasdi, K.; Chottanapund, S.; Pamungkas, R.A.; Tunyasitthisundhorn, P.; Sornpaisarn, B.; Numpaisan, O. Protection motivation theory to predict intention of healthy eating and sufficient physical activity to prevent diabetes mellitus in Thai population: A path analysis. Diabetes Metab. Syndr. 2021, 15, 121–127. [Google Scholar] [CrossRef]
- Rosenstock, I.M. Historical origins of the health belief model. Health Educ. Behav. 1974, 2, 328–335. [Google Scholar] [CrossRef]
- Ng, B.Y.; Kankanhalli, A.; Xu, Y.J. Studying users’ computer security behavior: A health belief perspective. Decis. Support Syst. 2009, 46, 815–825. [Google Scholar] [CrossRef]
- Cooke, R.; Dahdah, M.; Norman, P.; French, D.P. How well does the theory of planned behaviour predict alcohol consumption? a systematic review and meta-analysis. Health Psychol. Rev. 2016, 10, 148–167. [Google Scholar] [CrossRef] [PubMed]
- Ajzen, I. Attitudes, traits, and actions: Dispositional prediction of behavior in personality and social psychology. Adv. Exp. Soc. Psychol. 1987, 20, 1–63. [Google Scholar]
- Cho, J.; Park, D.; Lee, H.E. Cognitive factors of using health apps: Systematic analysis of relationships among health consciousness, health information orientation, eHealth literacy, and health app use efficacy. J. Med. Internet Res. 2014, 16, 125. [Google Scholar] [CrossRef]
- Versele, V.; Marijn Stok, F.; Aerenhouts, D.; Deforche, B.; Bogaerts, A.; Devlieger, R.; Clarys, P.; Deliens, T. Determinants of changes in womens’ and mens’ eating behavior across the transition to parenthood: A focus group study. Int. J. Behav. Nutr. Phys. Act. 2021, 18, 95. [Google Scholar] [CrossRef]
- Michaelidou, N.; Hassan, L.M. The role of health consciousness, food safety concern and ethical identity on attitudes and intentions towards organic food. Int. J. Consum. Stud. 2008, 32, 163–170. [Google Scholar] [CrossRef]
- Mamun, A.A.; Hayat, N.; Zainol, N.R.B. Healthy eating determinants: A study among malaysian young adults. Foods 2020, 9, 974. [Google Scholar] [CrossRef]
- Ajzen, I. The theory of planned behavior. Organ. Behav. Hum. Decis. Process. 1991, 50, 179–211. [Google Scholar] [CrossRef]
- Chen, M.; Wang, Y.Q.; Yin, S.J. Research on the Reformation Path of China’s Food Safety Certification Policy: From the Perspective of Consumer Preference; Economy and Management Publishing House: Beijing, China, 2019. (In Chinese) [Google Scholar]
- Webb, T.L.; Sheeran, P. Does changing behavioral intentions engender behavior change? a meta-analysis of the experimental evidence. Psychol. Bull. 2006, 132, 249–268. [Google Scholar] [CrossRef] [PubMed] [Green Version]
- Rezai, G.; Teng, P.K.; Shamsudin, M.N.; Mohamed, Z.; Stanton, J.L. Effect of perceptual differences on consumer purchase intention of natural functional food. J. Agribus. Dev. Emerg. Econ. 2017, 7, 153–173. [Google Scholar] [CrossRef]
- Davis, F.D.; Bagozzi, R.P.; Warshaw, P.R. User acceptance of computer technology: A comparison of two theoretical models. Manage. Sci. 1989, 35, 982–1003. [Google Scholar] [CrossRef] [Green Version]
- Yin, S.J.; Li, R.; Wu, L.H.; Chen, X.J. Introduction to 2018 China Development Report on Food Safety; Peking University Press: Beijing, China, 2018. (In Chinese) [Google Scholar]
- Liang, H.; Saraf, N.; Xue, H.Y. Assimilation of enterprise systems: The effect of institutional pressures and the mediating role of top management. MIS Q. 2007, 31, 59–87. [Google Scholar] [CrossRef]
- Nunnally, J.C.; Bernstein, I.H. Psychometric Theory; McGraw-Hill: New York, NY, USA, 1994. [Google Scholar]
- Fornell, C.; Larcker, D.F. Evaluating structural equation models with unobservable variables and measurement error. J. Mark. Res. 1981, 18, 39–50. [Google Scholar] [CrossRef]
- Chin, W.W. Issues and opinion on structural equation modeling. MIS Q. 1998, 22, 7–16. [Google Scholar]
- Cenfetelli, R.T.; Bassellier, G. Interpretation of formative measurement in information systems research. MIS Q. 2009, 33, 689–707. [Google Scholar] [CrossRef]
- Stone, M. Cross-validatory choice and assessment of statistical predictions. J. R. Stat. Soc. 1974, 36, 111–133. [Google Scholar] [CrossRef]
- Ateş, H.; Özdenk, G.D.; Çalışkan, C. Determinants of science teachers’ healthy eating behaviors: Combining health belief model and theory of planned behavior. J. Balt. Sci. Educ. 2021, 20, 573–589. [Google Scholar] [CrossRef]
- Diddana, T.Z. Factors associated with dietary practice and nutritional status of pregnant women in Dessie town, northeastern Ethiopia: A community-based cross-sectional study. BMC Pregnancy Childbirth 2019, 19, 1–10. [Google Scholar] [CrossRef] [Green Version]
- Shahrabani, S. The impact of Israels’ front-of-package labeling reform on consumers’ behavior and intentions to change dietary habits. Isr. J. Health Policy Res. 2021, 10, 44. [Google Scholar] [CrossRef] [PubMed]
- Cook, L.A. Health belief model and healthy consumption: Toward an integrated model. J. Food Prod. Mark. 2018, 24, 22–38. [Google Scholar] [CrossRef]
- Zuo, Y.; Zhang, M.; Si, Y.; Wu, X.; Ren, Z. Prediction of health risk preventative behavior of amateur marathon runners: A cross-sectional study. Risk Manag. Healthc. Policy 2021, 14, 2929–2944. [Google Scholar] [CrossRef] [PubMed]
- Mackinnon, D.P. Introduction to Statistical Mediation Analysis; McGraw-Hill: New York, NY, USA, 2008. [Google Scholar]
- Hair, J.F.; Risher, J.J.; Sarstedt, M.; Ringle, C.M. When to use and how to report the results of PLS-SEM. Eur. Bus. Rev. 2019, 31, 2–24. [Google Scholar] [CrossRef]
- Ringle, C.M.; Sarstedt, M. Gain more insight from your PLS-SEM results: The importance-performance map analysis. Ind. Manag. Data Syst. 2016, 116, 165–1886. [Google Scholar] [CrossRef]
- Yang, J.Z. Predicting young adults’ intentions to get the H1N1 vaccine: An integrated model. J. Health Commun. 2015, 20, 69–79. [Google Scholar] [CrossRef]
- Dehdari, T.; Dehdari, L.; Jazayeri, S. Diet-related stomach cancer behavior among iranian college students: A text messaging intervention. Asian Pac. J. Cancer Prev. 2016, 17, 5165–5172. [Google Scholar]
- Hojjati, M.; Yazdanpanah, M.; Fourozani, M. Willingness of Iranian young adults to eat organic foods: Application of the health belief model. Food. Qual. Prefer. 2015, 41, 75–83. [Google Scholar]
- Dong-Yean, P. Utilizing the health belief model to predicting female middle school students’ behavioral intention of weight reduction by weight status. Nutr. Res. Pract. 2011, 5, 337–348. [Google Scholar]
- Wang, X.B.; Chen, D.D.; Xie, T.T.; Zhang, W. Predicting women’s intentions to screen for breast cancer based on the health belief model and the theory of planned behavior. J. Obstet. Gynaecol. Res. 2019, 45, 2440–2451. [Google Scholar] [CrossRef] [PubMed]
- Nguyen, N.; Nguyen, H.V.; Nguyen, P.T.; Tran, V.T.; Nguyen, H.N.; Nguyen, T.M.N.; Cao, T.K.; Nguyen, T.H. Some key factors affecting consumers’ intentions to purchase functional foods: A case study of functional yogurts in vietnam. Foods 2020, 9, 24. [Google Scholar] [CrossRef] [PubMed] [Green Version]
- Povey, R.; Conner, M.; Sparks, P.; James, R.; Shepherd, R. The theory of planned behaviour and healthy eating: Examining additive and moderating effects of social influence variables. Psychol. Health 2000, 14, 991–1006. [Google Scholar] [CrossRef] [PubMed]
- Conner, M.; Norman, P.; Bell, R. The theory of planned behaviour and healthy eating. Health Psychol. 2002, 21, 194–201. [Google Scholar] [CrossRef]
- Gebreyesus, H.A.; Abreha, G.F.; Besherae, S.D.; Abera, M.A.; Nigatu, T.G. Eating behavior among persons with type 2 diabetes mellitus in North Ethiopia: A cross-sectional study. BMC Endocr. Disord. 2021, 21, 99. [Google Scholar] [CrossRef]


| Frequency (n) | Percentage (%) | Frequency (n) | Percentage (%) | ||
|---|---|---|---|---|---|
| Residence | Marital status | ||||
| Urban | 924 | 72.13 | Married | 632 | 49.34 |
| Rural | 357 | 27.87 | Unmarried | 649 | 50.66 |
| Gender | Body mass index | ||||
| Male | 571 | 44.57 | BMI < 18.5 | 156 | 12.18 |
| Female | 710 | 55.43 | 18.5 ≤ BMI < 24 | 754 | 58.86 |
| Age | BMI ≥ 24 | 371 | 28.96 | ||
| 18~25 years old | 462 | 36.07 | Employment status | ||
| 26~30 years old | 273 | 21.31 | Attend school | 216 | 16.86 |
| 31~40 years old | 281 | 21.94 | Employment | 868 | 67.76 |
| 41~50 years old | 168 | 13.11 | Retirement | 43 | 3.36 |
| above 51 years old | 97 | 7.57 | Unemployed | 154 | 12.02 |
| Education | Family income (per year) | ||||
| Primary and below | 20 | 1.56 | USD < 15,780 | 646 | 50.43 |
| Junior high school | 114 | 8.90 | USD 15,780~31,560 | 411 | 32.08 |
| High school/secondary | 198 | 15.46 | USD 31,560~47,340 | 132 | 10.31 |
| Junior College/Bachelor | 811 | 63.31 | USD 47,340~63,120 | 46 | 3.59 |
| Graduate student | 138 | 10.77 | USD ≥ 63,120 | 46 | 3.59 |
| Construct | Items | Loading | VIF | Cronbach’s Alpha | CR | AVE |
|---|---|---|---|---|---|---|
| Perceived Susceptibility (SUS) | SUS1 | 0.764 | 2.009 | 0.730 | 0.846 | 0.648 |
| SUS2 | 0.847 | |||||
| SUS3 | 0.801 | |||||
| Perceived Severity (SEV) | SEV1 | 0.880 | 2.452 | 0.897 | 0.936 | 0.830 |
| SEV2 | 0.928 | |||||
| SEV3 | 0.924 | |||||
| Perceived Benefits (BEN) | BEN1 | 0.879 | 2.057 | 0.871 | 0.921 | 0.795 |
| BEN2 | 0.901 | |||||
| BEN3 | 0.894 | |||||
| Perceived Barriers (BAR) | BAR1 | 0.817 | 1.050 | 0.819 | 0.887 | 0.725 |
| BAR2 | 0.816 | |||||
| BAR3 | 0.918 | |||||
| Self-Efficacy (SE) | SE1 | 0.859 | 1.469 | 0.857 | 0.913 | 0.777 |
| SE2 | 0.889 | |||||
| SE3 | 0.896 | |||||
| Health Consciousness (HC) | HC1 | 0.866 | 1.748 | 0.839 | 0.903 | 0.757 |
| HC2 | 0.849 | |||||
| HC3 | 0.894 | |||||
| Healthy Eating Intentions (HEI) | HEI1 | 0.804 | 1.000 | 0.887 | 0.922 | 0.749 |
| HEI2 | 0.866 | |||||
| HEI3 | 0.895 | |||||
| HEI4 | 0.894 | |||||
| Healthy Eating Behaviors (HEB) | HEB1 | 0.732 | - | 0.835 | 0.879 | 0.547 |
| HEB2 | 0.751 | |||||
| HEB3 | 0.728 | |||||
| HEB4 | 0.718 | |||||
| HEB5 | 0.723 | |||||
| HEB6 | 0.785 |
| SUS | SEV | BEN | BAR | SE | HC | HEI | HEB | |
|---|---|---|---|---|---|---|---|---|
| Fornell–Larcker Criterion | ||||||||
| SUS | 0.805 | |||||||
| SEV | 0.689 | 0.911 | ||||||
| BEN | 0.582 | 0.669 | 0.892 | |||||
| BAR | −0.030 | −0.041 | −0.068 | 0.851 | ||||
| SE | 0.164 | 0.218 | 0.280 | −0.218 | 0.882 | |||
| HC | 0.357 | 0.438 | 0.477 | −0.118 | 0.540 | 0.870 | ||
| HEI | 0.480 | 0.535 | 0.600 | −0.139 | 0.438 | 0.655 | 0.865 | |
| HEB | 0.233 | 0.281 | 0.316 | −0.141 | 0.536 | 0.507 | 0.509 | 0.740 |
| Heterotrait–Monotrait Ratio (HTMT) | ||||||||
| SUS | - | |||||||
| SEV | 0.843 | - | ||||||
| BEN | 0.722 | 0.757 | - | |||||
| BAR | 0.073 | 0.059 | 0.075 | - | ||||
| SE | 0.198 | 0.248 | 0.323 | 0.237 | - | |||
| HC | 0.449 | 0.506 | 0.558 | 0.122 | 0.634 | - | ||
| HEI | 0.591 | 0.602 | 0.686 | 0.150 | 0.500 | 0.758 | - | |
| HEB | 0.283 | 0.317 | 0.363 | 0.144 | 0.635 | 0.600 | 0.581 | - |
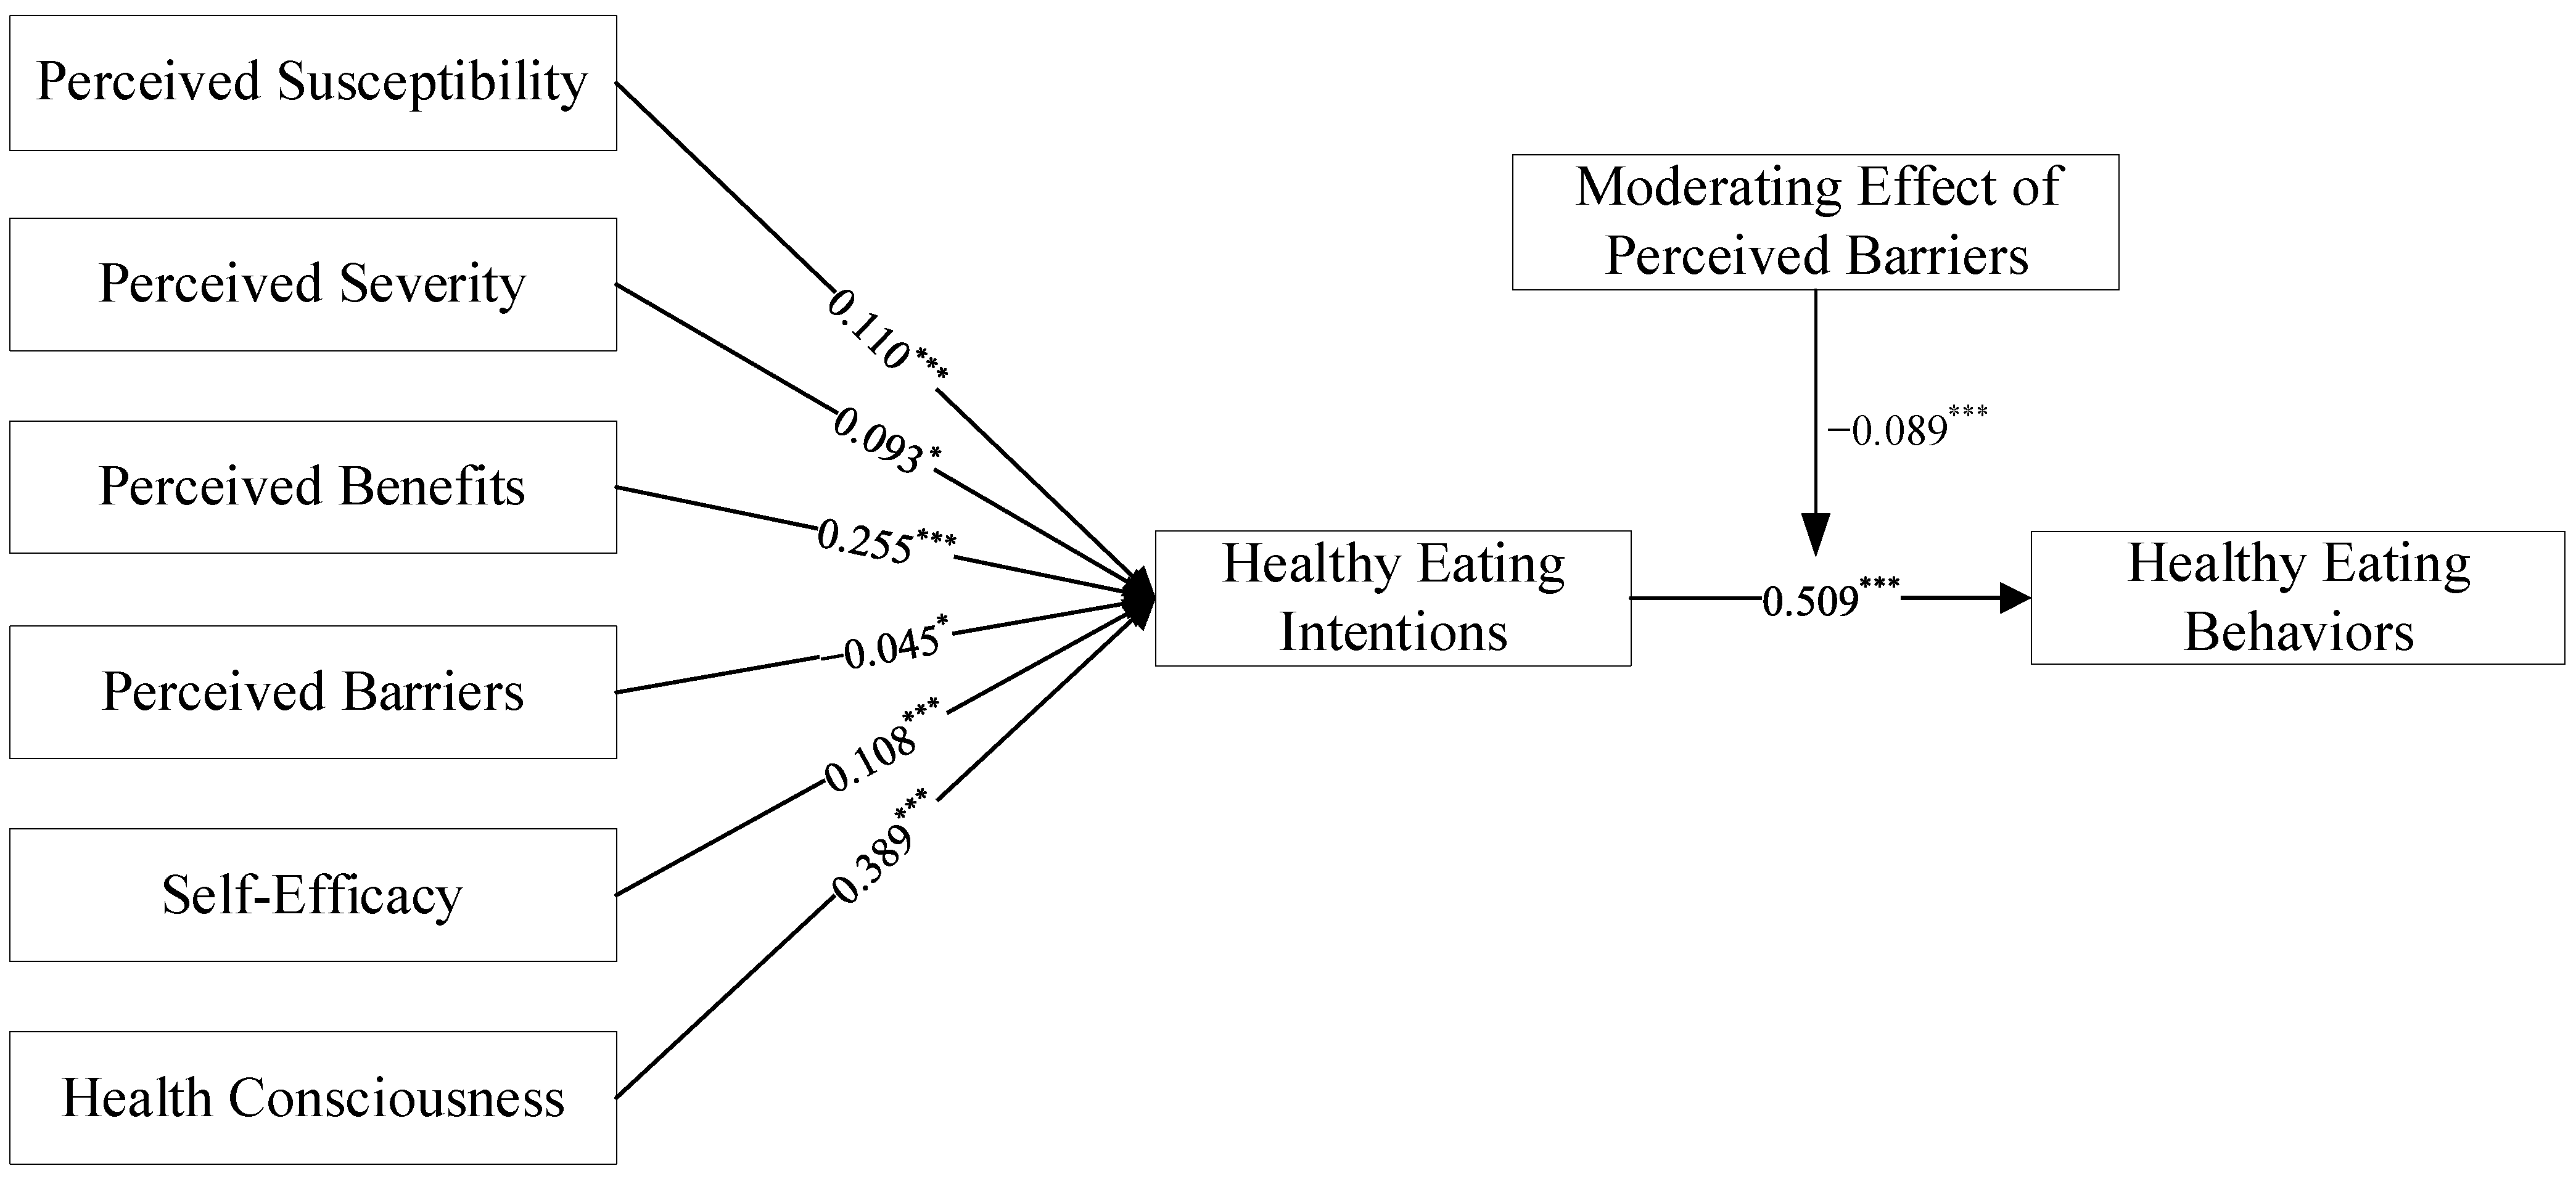
| Hypo | Path | Beta | S.D. | p-Value | Confidence Interval | f2 | R2 | Q2 | Decision |
|---|---|---|---|---|---|---|---|---|---|
| H1 | SUS -> HEI | 0.110 *** | 0.027 | 0.000 | [0.056, 0.161] | 0.151 | 0.563 | 0.419 | Support |
| H2 | SEV -> HEI | 0.093 * | 0.038 | 0.013 | [0.023, 0.170] | 0.212 | Support | ||
| H3 | BEN -> HEI | 0.255 *** | 0.041 | 0.000 | [0.176, 0.336] | 0.173 | Support | ||
| H4 | BAR -> HEI | −0.045 * | 0.019 | 0.018 | [−0.083, −0.008] | 0.204 | Support | ||
| H5 | SE -> HEI | 0.108 *** | 0.026 | 0.000 | [0.058, 0.159] | 0.168 | Support | ||
| H6 | HC -> HEI | 0.389 *** | 0.034 | 0.000 | [0.323, 0.453] | 0.199 | Support | ||
| H7 | HEI -> HEB | 0.509 *** | 0.025 | 0.000 | [0.457, 0.554] | 0.351 | 0.358 | 0.237 | Support |
| Moderating Effect of Perceived Barriers | |||||||||
| H8 | Interaction item -> HEB | −0.089 *** | 0.021 | 0.000 | [−0.120, −0.042] | - | Support | ||
| Hypo | Associations | Direct Effects | Indirect Effects | Total Effects | VAF | Decision |
|---|---|---|---|---|---|---|
| H9a | SUS -> HEI -> HEB | 0.014 (0.489) | 0.248 *** (11.023) | 0.262 *** (7.291) | 0.947 | Support |
| H9b | SEV -> HEI -> HEB | 0.012 (0.417) | 0.269 *** (11.640) | 0.281 *** (8.754) | 0.957 | Support |
| H9c | BEN -> HEI -> HEB | 0.017 (0.579) | 0.300 *** (12.437) | 0.316 *** (10.760) | 0.949 | Support |
| H9d | BAR -> HEI -> HEB | −0.084 ** (3.267) | −0.071 ** (5.290) | −0.155 *** (5.704) | 0.458 | Support |
| H9e | SE -> HEI -> HEB | 0.398 *** (13.471) | 0.148 *** (9.334) | 0.546 *** (22.841) | 0.271 | Support |
| H9f | HC -> HEI -> HEB | 0.313 *** (9.359) | 0.199 *** (8.581) | 0.512 *** (20.803) | 0.389 | Support |
| Path | Gender | Age | Education | Income | BMI | Residence | Marital Status | Employment Status |
|---|---|---|---|---|---|---|---|---|
| SUS -> HEI | 0.285 | 0.227 | 0.883 | 0.052 | 0.656 | 0.174 | 0.980 | 0.834 |
| SEV -> HEI | 0.338 | 0.183 | 0.769 | 0.500 | 0.844 | 0.265 | 0.533 | 0.179 |
| BEN -> HEI | 0.515 | 0.295 | 0.505 | 0.368 | 0.527 | 0.669 | 0.557 | 0.630 |
| BAR -> HEI | 0.170 | 0.783 | 0.896 | 0.772 | 0.895 | 0.341 | 0.197 | 0.289 |
| SE -> HEI | 0.857 | 0.216 | 0.219 | 0.319 | 0.931 | 0.708 | 0.700 | 0.125 |
| HC -> HEI | 0.813 | 0.501 | 0.733 | 0.065 | 0.221 | 0.495 | 0.470 | 0.279 |
| HEI -> HEB | 0.655 | 0.417 | 0.049 | 0.928 | 0.170 | 0.958 | 0.291 | 0.538 |
| SUS -> HEI -> HEB | 0.183 | 0.385 | 0.532 | 0.398 | 0.117 | 0.538 | 0.581 | 0.864 |
| SEV -> HEI -> HEB | 0.562 | 0.156 | 0.865 | 0.416 | 0.512 | 0.227 | 0.283 | 0.544 |
| BEN -> HEI -> HEB | 0.871 | 0.627 | 0.191 | 0.750 | 0.331 | 0.573 | 0.614 | 0.940 |
| BAR -> HEI -> HEB | 0.111 | 0.781 | 0.836 | 0.507 | 0.492 | 0.750 | 0.508 | 0.759 |
| SE -> HEI -> HEB | 0.810 | 0.156 | 0.067 | 0.597 | 0.281 | 0.968 | 0.221 | 0.132 |
| HC -> HEI -> HEB | 0.363 | 0.517 | 0.328 | 0.276 | 0.140 | 0.956 | 0.121 | 0.408 |
| Interaction item -> HEB | 0.053 | 0.292 | 0.074 | 0.347 | 0.404 | 0.417 | 0.424 | 0.586 |
| Associations | Total Effect | Performance |
|---|---|---|
| Perceived Susceptibility | 0.112 | 83.706 |
| Perceived Severity | 0.085 | 64.680 |
| Perceived Benefits | 0.086 | 83.998 |
| Perceived Barriers | −0.030 | 48.228 |
| Self-Efficacy | 0.352 | 74.046 |
| Health Consciousness | 0.258 | 84.421 |
Publisher’s Note: MDPI stays neutral with regard to jurisdictional claims in published maps and institutional affiliations. |
© 2022 by the authors. Licensee MDPI, Basel, Switzerland. This article is an open access article distributed under the terms and conditions of the Creative Commons Attribution (CC BY) license (https://creativecommons.org/licenses/by/4.0/).
Share and Cite
Wang, Y.; Wen, X.; Zhu, Y.; Xiong, Y.; Liu, X. Chinese Residents’ Healthy Eating Intentions and Behaviors: Based on an Extended Health Belief Model. Int. J. Environ. Res. Public Health 2022, 19, 9037. https://doi.org/10.3390/ijerph19159037
Wang Y, Wen X, Zhu Y, Xiong Y, Liu X. Chinese Residents’ Healthy Eating Intentions and Behaviors: Based on an Extended Health Belief Model. International Journal of Environmental Research and Public Health. 2022; 19(15):9037. https://doi.org/10.3390/ijerph19159037
Chicago/Turabian StyleWang, Yiqin, Xiaowei Wen, Ying Zhu, Yanling Xiong, and Xuefan Liu. 2022. "Chinese Residents’ Healthy Eating Intentions and Behaviors: Based on an Extended Health Belief Model" International Journal of Environmental Research and Public Health 19, no. 15: 9037. https://doi.org/10.3390/ijerph19159037