
An N-Shaped Association between Population Density and Abdominal Obesity


Abstract
:1. Introduction
2. Materials and Methods
2.1. Data
2.2. Abdominal Obesity
2.3. Community Built Environmental Attributes
2.4. Individual Socioeconomic Characteristics
2.5. Analytical Approaches
3. Results
3.1. Descriptive Analysis
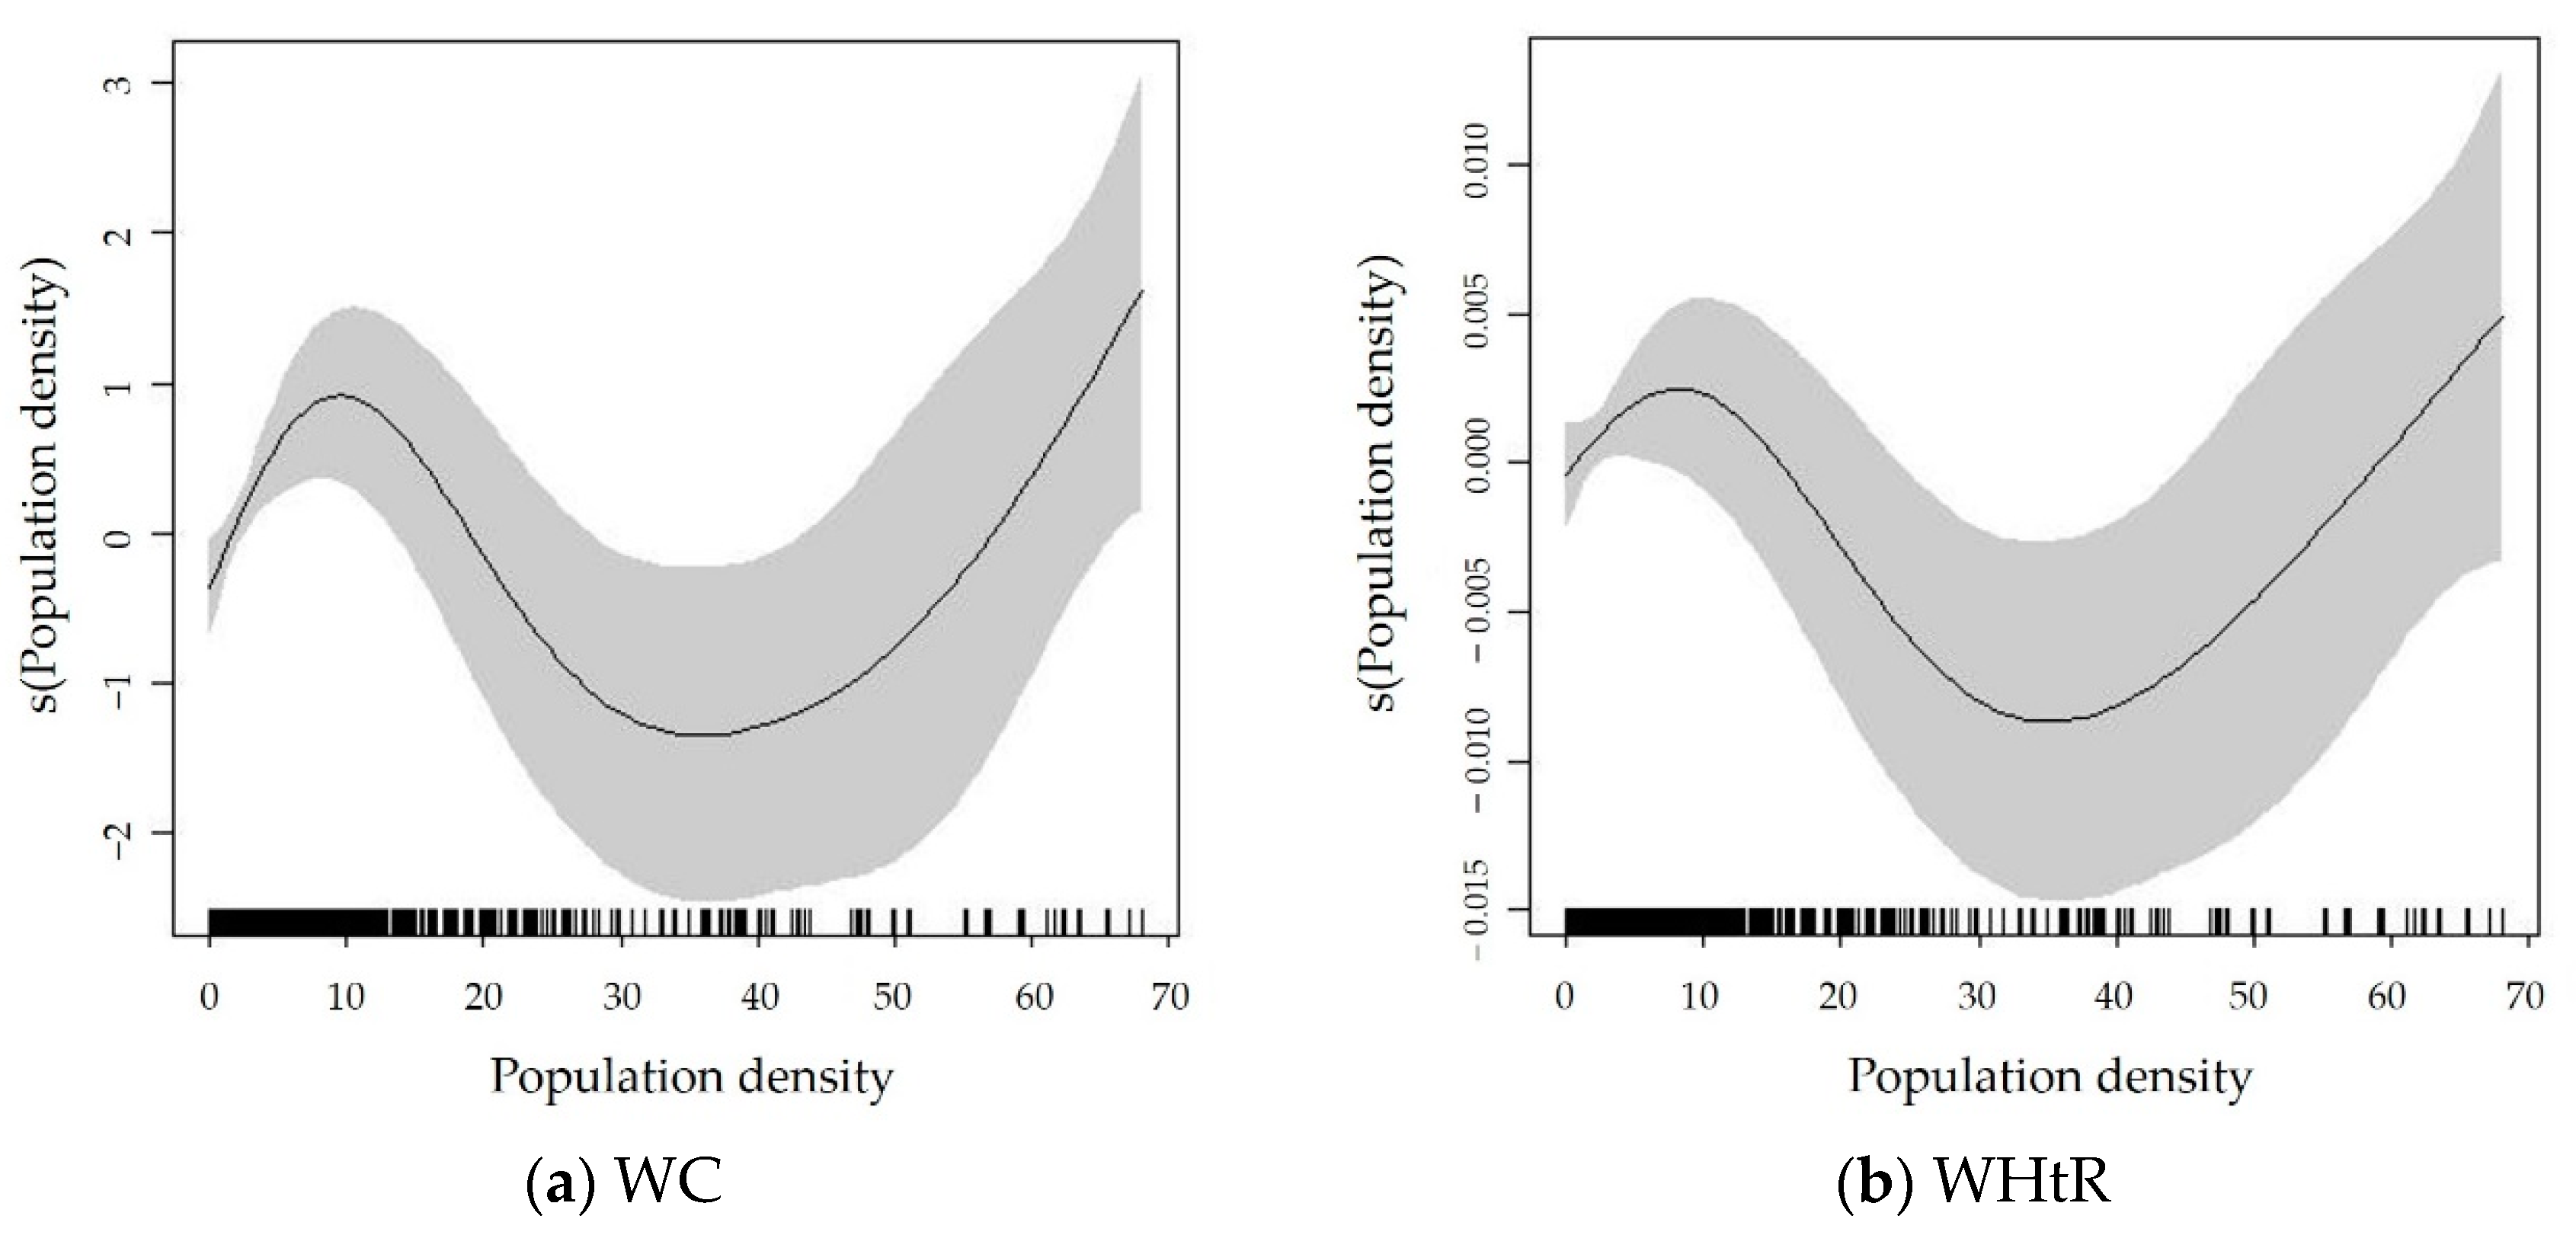
3.2. Associations of Population Density and Covariables with WC and WHtR
3.3. Robustness Check
4. Discussion
5. Conclusions
Author Contributions
Funding
Institutional Review Board Statement
Informed Consent Statement
Data Availability Statement
Acknowledgments
Conflicts of Interest
References
- Gao, F.; Zheng, K.I.; Wang, X.; Sun, Q.; Pan, K.; Wang, T.; Chen, Y.; Targher, G.; Byrne, C.D.; George, J.; et al. Obesity is a risk factor for greater COVID-19 severity. Diabetes Care 2020, 43, e72–e74. [Google Scholar] [CrossRef] [PubMed]
- Chooi, Y.C.; Ding, C.; Magkos, F. The epidemiology of obesity. Metab. Clin. Exp. 2019, 92, 6–10. [Google Scholar] [CrossRef] [PubMed] [Green Version]
- Walls, H.L.; Backholer, K.; Proietto, J.; McNeil, J.J. Obesity and trends in life expectancy. J. Obes. 2012, 2012, 107989. [Google Scholar] [CrossRef] [PubMed] [Green Version]
- Parikh, R.M.; Joshi, S.R.; Menon, P.S.; Shah, N.S. Index of central obesity—A novel parameter. Med. Hypotheses 2007, 68, 1272–1275. [Google Scholar] [CrossRef]
- Wang, H.; Wang, J.; Liu, M.-M.; Wang, D.; Liu, Y.-Q.; Zhao, Y.; Huang, M.-M.; Liu, Y.; Sun, J.; Dong, G.-H. Epidemiology of general obesity, abdominal obesity and related risk factors in urban adults from 33 communities of Northeast China: The CHPSNE study. BMC Public Health 2012, 12, 1–10. [Google Scholar] [CrossRef] [PubMed] [Green Version]
- Booth, K.M.; Pinkston, M.M.; Poston, W.S.C. Obesity and the built environment. J. Am. Diet. Assoc. 2005, 105, 110–117. [Google Scholar] [CrossRef] [Green Version]
- Papas, M.A.; Alberg, A.J.; Ewing, R.; Helzlsouer, K.J.; Gary, T.L.; Klassen, A.C. The built environment and obesity. Epidemiol. Rev. 2007, 29, 129–143. [Google Scholar] [CrossRef] [Green Version]
- Pan, X.-F.; Wang, L.; Pan, A. Epidemiology and determinants of obesity in China. Lancet Diabetes Endocrinol. 2021, 9, 373–392. [Google Scholar] [CrossRef]
- Yin, C.; Yao, X.; Sun, B. Population density and obesity in rural China: Mediation effects of car ownership. Transp. Res. Part D Transp. Environ. 2022, 105, 103228. [Google Scholar] [CrossRef]
- Leal, C.; Bean, K.; Thomas, F.; Chaix, B. Multicollinearity in associations between multiple environmental features and body weight and abdominal fat: Using matching techniques to assess whether the associations are separable. Am. J. Epidemiol. 2012, 175, 1152–1162. [Google Scholar] [CrossRef] [Green Version]
- Sarkar, C.; Webster, C.; Gallacher, J. Association between adiposity outcomes and residential density: A full-data, cross-sectional analysis of 419562 UK Biobank adult participants. Lancet Planet. Health 2017, 1, e277–e288. [Google Scholar] [CrossRef] [Green Version]
- Yin, C.; Cao, J.; Sun, B. Examining non-linear associations between population density and waist-hip ratio: An application of gradient boosting decision trees. Cities 2020, 107, 102899. [Google Scholar] [CrossRef]
- China Obesity Working Group. Guidelines for the prevention and control of overweight and obesity in Chinese adults (excerpt). Acta Nutr. Sin. 2004, 26, 1–4. [Google Scholar]
- WHO. Obesity. Preventing and Managing the Global Epidemic. In Report of a WHO Consultation on Obesity; WHO Technical Report Series; WHO: Geneva, Switzerland, 1998. [Google Scholar]
- Xi, B.; He, D.; Hu, Y.; Zhou, D. Prevalence of metabolic syndrome and its influencing factors among the Chinese adults: The China Health and Nutrition Survey in 2009. Prev. Med. 2013, 57, 867–871. [Google Scholar] [CrossRef] [Green Version]
- Shao, J.; Yu, L.; Shen, X.; Li, D.; Wang, K. Waist-to-height ratio, an optimal predictor for obesity and metabolic syndrome in Chinese adults. J. Nutr. Health Aging 2010, 14, 782–785. [Google Scholar] [CrossRef]
- Sun, B.; Yin, C.; Yao, X. Densification and health in China: A U-shaped association between population density and obesity. Trans. Plan. Urban Res. 2022, 27541223221111500. [Google Scholar] [CrossRef]
- Frank, L.D.; Andresen, M.A.; Schmid, T.L. Obesity relationships with community design, physical activity, and time spent in cars. Am. J. Prev. Med. 2004, 27, 87–96. [Google Scholar] [CrossRef]
- Paulitsch, R.G.; Dumith, S.C. Is food environment associated with body mass index, overweight and obesity? A study with adults and elderly subjects from southern Brazil. Prev. Med. Rep. 2021, 21, 101313. [Google Scholar] [CrossRef]
- McDonald, K.N.; Oakes, J.M.; Forsyth, A. Effect of street connectivity and density on adult BMI: Results from the Twin Cities Walking Study. J. Epidemiol. Commun. Health 2012, 66, 636–640. [Google Scholar] [CrossRef]
- Ruppert, D.; Wand, M.P.; Carroll, R.J. Semiparametric Regression; Cambridge University Press: Cambridge, UK, 2003. [Google Scholar]
- Hastie, T.J. Generalized Additive Models. In Statistical Models in S; Routledge: Oxfordshire, UK, 2017; pp. 249–307. [Google Scholar]
- Wood, S.N. Generalized Additive Models: An Introduction with R, 2nd ed.; Chapman and Hall/CRC: Boca Raton, FL, USA, 2017. [Google Scholar]
- Fukuda, D.; Yai, T. Semiparametric specification of the utility function in a travel mode choice model. Transp. J. 2010, 37, 221–238. [Google Scholar] [CrossRef]
- Snijders, T.A.; Bosker, R.J. Multilevel Analysis: An Introduction to Basic and Advanced Multilevel Modeling; Sage: Thousand Oaks, CA, USA, 2011. [Google Scholar]
- Wang, X.; Shao, C.; Yin, C.; Guan, L. Exploring the relationships of the residential and workplace built environment with commuting mode choice: A hierarchical cross-classified structural equation model. Transp. Lett. 2022, 14, 274–281. [Google Scholar] [CrossRef]
- Wood, S. Package ‘MGCV’. Available online: https://cran.r-project.org/web/packages/mgcv/mgcv.pdf (accessed on 29 March 2022).
- Troy, A.R.; Bonnell, L.N.; Littenberg, B. Relationship between the built environment and body mass index in a rural context: A cross-sectional study from Vermont. Cureus 2018, 10, e3040. [Google Scholar] [CrossRef] [PubMed] [Green Version]
- Ao, Y.; Yang, D.; Chen, C.; Wang, Y. Exploring the effects of the rural built environment on household car ownership after controlling for preference and attitude: Evidence from Sichuan, China. J. Transp. Geogr. 2019, 74, 24–36. [Google Scholar] [CrossRef]
- Mettner, J. Are cars making us fat? Minn. Med. 2006, 89, 14–15. [Google Scholar] [PubMed]
- Bonnell, L.N.; Troy, A.R.; Littenberg, B. Nonlinear relationship between nonresidential destinations and body mass index across a wide range of development. Prev. Med. 2021, 153, 106775. [Google Scholar] [CrossRef]
- van der Loop, H.; Haaijer, R.; Willigers, J. New findings in the Netherlands about induced demand and the benefits of new road infrastructure. Transp. Res. Procedia 2016, 13, 72–80. [Google Scholar] [CrossRef] [Green Version]
- Arbel, Y.; Fialkoff, C.; Kerner, A. Does body fat change with car ownership rates? A longitudinal survey of gender differences. J. Urban Manag. 2020, 9, 19–34. [Google Scholar] [CrossRef]
- Rundle, A.; Roux, A.V.D.; Freeman, L.M.; Miller, D.; Neckerman, K.M.; Weiss, C.C. The urban built environment and obesity in New York City: A multilevel analysis. Am. J. Health Promot. 2007, 21, 326–334. [Google Scholar] [CrossRef]
- Lopez, R.P. Neighborhood risk factors for obesity. Obesity 2007, 15, 2111–2119. [Google Scholar] [CrossRef]
- Frank, L.D.; Sallis, J.F.; Conway, T.L.; Chapman, J.E.; Saelens, B.E.; Bachman, W. Many pathways from land use to health—Associations between neighborhood walkability and active transportation, body mass index, and air quality. J. Am. Plan. Assoc. 2006, 72, 75–87. [Google Scholar] [CrossRef]
- Witten, K.; Blakely, T.; Bagheri, N.; Badland, H.; Ivory, V.; Pearce, J.; Mavoa, S.; Hinckson, E.; Schofield, G. Neighborhood built environment and transport and leisure physical activity: Findings using objective exposure and outcome measures in New Zealand. Environ. Health Perspect. 2012, 120, 971–977. [Google Scholar] [CrossRef] [PubMed]
- Michimi, A.; Wimberly, M.C. Associations of supermarket accessibility with obesity and fruit and vegetable consumption in the conterminous United States. Int. J. Health Geogr. 2010, 9, 1–14. [Google Scholar] [CrossRef] [Green Version]
- Bodor, J.N.; Rice, J.C.; Farley, T.A.; Swalm, C.M.; Rose, D. The association between obesity and urban food environments. J. Urban Health 2010, 87, 771–781. [Google Scholar] [CrossRef] [PubMed] [Green Version]
- Bray, G.A.; Popkin, B.M. Dietary fat intake does affect obesity! Am. J. Clin. Nutr. 1998, 68, 1157–1173. [Google Scholar] [CrossRef] [PubMed]
- Xu, F.; Li, J.Q.; Liang, Y.Q.; Wang, Z.Y.; Hong, X.; Ware, R.S.; Leslie, E.; Sugiyama, T.; Owen, N. Residential density and adolescent overweight in a rapidly urbanising region of mainland China. J. Epidemiol. Commun. Health 2010, 64, 1017–1021. [Google Scholar] [CrossRef] [PubMed]
- Zhao, P.; Kwan, M.-P.; Zhou, S. The uncertain geographic context problem in the analysis of the relationships between obesity and the built environment in Guangzhou. Int. J. Environ. Res. Public Health Nutr. 2018, 15, 308. [Google Scholar] [CrossRef] [PubMed] [Green Version]
- Yin, C.; Sun, B. Disentangling the effects of the built environment on car ownership: A multi-level analysis of Chinese cities. Cities 2018, 74, 188–195. [Google Scholar] [CrossRef]
- Cooksey-Stowers, K.; Schwartz, M.B.; Brownell, K.D. Food swamps predict obesity rates better than food deserts in the United States. Int. J. Environ. Res. Public Health 2017, 14, 1366. [Google Scholar] [CrossRef] [Green Version]
- An, R.; He, L.; Shen, M.J. Impact of neighbourhood food environment on diet and obesity in China: A systematic review. Public Health Nutr. 2020, 23, 457–473. [Google Scholar] [CrossRef] [PubMed]
- Torres, S.J.; Nowson, C.A. Relationship between stress, eating behavior, and obesity. Nutrition 2007, 23, 887–894. [Google Scholar] [CrossRef] [Green Version]
- Li, M.; Qian, Z.; Vaughn, M.; Boutwell, B.; Ward, P.; Lu, T.; Lin, S.; Zhao, Y.; Zeng, X.-W.; Liu, R.-Q. Sex-specific difference of the association between ambient air pollution and the prevalence of obesity in Chinese adults from a high pollution range area: 33 communities Chinese health study. Atmos. Environ. 2015, 117, 227–233. [Google Scholar] [CrossRef]
- Li, F.; Harmer, P.; Cardinal, B.J.; Bosworth, M.; Johnson-Shelton, D. Obesity and the built environment: Does the density of neighborhood fast-food outlets matter? Am. J. Health Promot. 2009, 23, 203–209. [Google Scholar] [CrossRef] [PubMed] [Green Version]
- French, P.; Crabbe, M. Fat China: How Expanding Waistlines Are Changing a Nation; Anthem Press: London, UK, 2010. [Google Scholar]
- Ford, N.D.; Patel, S.A.; Narayan, K.M. Obesity in low- and middle-income countries: Burden, drivers, and emerging challenges. Annu. Rev. Public Health 2017, 38, 145–164. [Google Scholar] [CrossRef] [PubMed] [Green Version]


| Variable | Mean/% | Std. Dev. | Min | Max |
|---|---|---|---|---|
| Dependent Variables | ||||
| WC (cm) | 82.46 | 10.56 | 45 | 107.30 |
| WHtR | 0.51 | 0.06 | 0.36 | 0.68 |
| Built environmental attributes | ||||
| Population density (1000 people/km2) | 6.42 | 13.59 | 0.001 | 68 |
| Business density (count/km2) | 3.93 | 17.95 | 0 | 150 |
| Fast food restaurant density (count/km2) | 0.68 | 3.41 | 0 | 26 |
| Distance to the nearest wet market (km) | 1.44 | 3.16 | 0 | 35 |
| Distance to the nearest park (km) | 8.57 | 15.08 | 0 | 90 |
| Distance to the nearest school (km) | 0.56 | 1.16 | 0 | 6 |
| Distance to the nearest bus stop (km) | 1.06 | 2.91 | 0 | 18 |
| Socioeconomic characteristics | ||||
| Men | 47% | — | — | — |
| Age (years) | 45.49 | 12.19 | 18 | 65 |
| Han Chinese | 88% | — | — | — |
| Urban | 35% | — | — | — |
| Married | 87% | — | — | — |
| Years of education | 8.60 | 3.96 | 0 | 18 |
| Employment status | ||||
| Farmer | 24% | — | — | — |
| Nonfarmer | 41% | — | — | — |
| Unemployed | 35% | — | — | — |
| Household income (10,000 yuan/year) | 4.78 | 7.86 | 0 | 480 |
| Household size (count) | 3.75 | 1.53 | 1 | 13 |
| Variable | WC | WHtR | ||
|---|---|---|---|---|
| Nonparametric Component | Edf | F | Edf | F |
| Population density | 3.870 *** | 8.755 | 3.423 *** | 8.037 |
| Parametric Component | Beta | SE | Beta | SE |
| Other built environmental attributes | ||||
| Business density | 0.01086 *** | 0.00298 | 0.00005 * | 0.00002 |
| Fast food restaurant density | 0.05282 ** | 0.01643 | 0.00025 * | 0.00010 |
| Distance to the nearest wet market | −0.01907 | 0.01944 | −0.00011 | 0.00012 |
| Distance to the nearest park | −0.02553 *** | 0.00392 | −0.00014 *** | 0.00002 |
| Distance to the nearest school | −0.04925 | 0.04956 | −0.00040 | 0.00030 |
| Distance to the nearest bus stop | 0.02204 | 0.01907 | 0.00018 | 0.00012 |
| Socioeconomic characteristics | ||||
| Men | 4.35229 *** | 0.10600 | −0.00659 *** | 0.00064 |
| Age | 0.16084 *** | 0.00522 | 0.00135 *** | 0.00003 |
| Han Chinese | 0.53568 ** | 0.18600 | 0.00055 | 0.00112 |
| Urban | −0.08320 | 0.12289 | −0.00112 | 0.00074 |
| Married | 1.67396 *** | 0.16417 | 0.00868 *** | 0.00099 |
| Years of education | −0.13983 *** | 0.01645 | −0.00159 *** | 0.00010 |
| Employment status (ref. = farmers) | ||||
| Nonfarmers | 1.59588 *** | 0.15582 | 0.00729 *** | 0.00094 |
| Unemployed | 1.70086 *** | 0.15185 | 0.00889 *** | 0.00092 |
| Household income | −0.00082 | 0.00708 | −0.00003 | 0.00004 |
| Household size | −0.12949 *** | 0.03747 | −0.00043 | 0.00023 |
| Region effects | Controlled | Controlled | Controlled | Controlled |
| Time effects | Controlled | Controlled | Controlled | Controlled |
| Goodness-of-fit | ||||
| Adjusted R2 | 0.162 | 0.144 |
| Variable | WC | WHtR | ||
|---|---|---|---|---|
| Nonparametric Component | Edf | F | Edf | F |
| Population density | 3.969 *** | 5.038 | 3.519 ** | 3.347 |
| Parametric Component | Beta | SE | Beta | SE |
| Other built environmental attributes | Controlled | Controlled | Controlled | Controlled |
| Socioeconomic characteristics | Controlled | Controlled | Controlled | Controlled |
| Region effects | Controlled | Controlled | Controlled | Controlled |
| Goodness-of-fit | ||||
| Adjusted R2 | 0.131 | 0.123 |
Publisher’s Note: MDPI stays neutral with regard to jurisdictional claims in published maps and institutional affiliations. |
© 2022 by the authors. Licensee MDPI, Basel, Switzerland. This article is an open access article distributed under the terms and conditions of the Creative Commons Attribution (CC BY) license (https://creativecommons.org/licenses/by/4.0/).
Share and Cite
Sun, B.; Yao, X.; Yin, C. An N-Shaped Association between Population Density and Abdominal Obesity. Int. J. Environ. Res. Public Health 2022, 19, 9577. https://doi.org/10.3390/ijerph19159577
Sun B, Yao X, Yin C. An N-Shaped Association between Population Density and Abdominal Obesity. International Journal of Environmental Research and Public Health. 2022; 19(15):9577. https://doi.org/10.3390/ijerph19159577
Chicago/Turabian StyleSun, Bindong, Xiajie Yao, and Chun Yin. 2022. "An N-Shaped Association between Population Density and Abdominal Obesity" International Journal of Environmental Research and Public Health 19, no. 15: 9577. https://doi.org/10.3390/ijerph19159577