
Risk Communication in the Alert Phase of the COVID-19 Pandemic: Analysis of News Flow at National and Global Levels


Abstract
:1. Introduction
1.1. Risk Communication in Public Health Emergencies
1.2. International News Flow
1.3. Global Media Systems
1.4. The Present Study
- How did the overall characteristics of the news media citation networks change from Stage 1 to Stage 2 of the COVID-19 alert phase?
- How did the core and periphery of the news media citation networks change from Stage 1 to Stage 2 of the COVID-19 alert phase?
- How did the key nodes of the news media citation networks change from Stage 1 to Stage 2 of the COVID-19 alert phase?
2. Method
2.1. Data Collection
2.2. Constructing the Media Citation Network
2.3. Measuring the Network Structure
2.4. Identifying and Analysing the Communities
2.5. Measuring Node Performance
3. Result
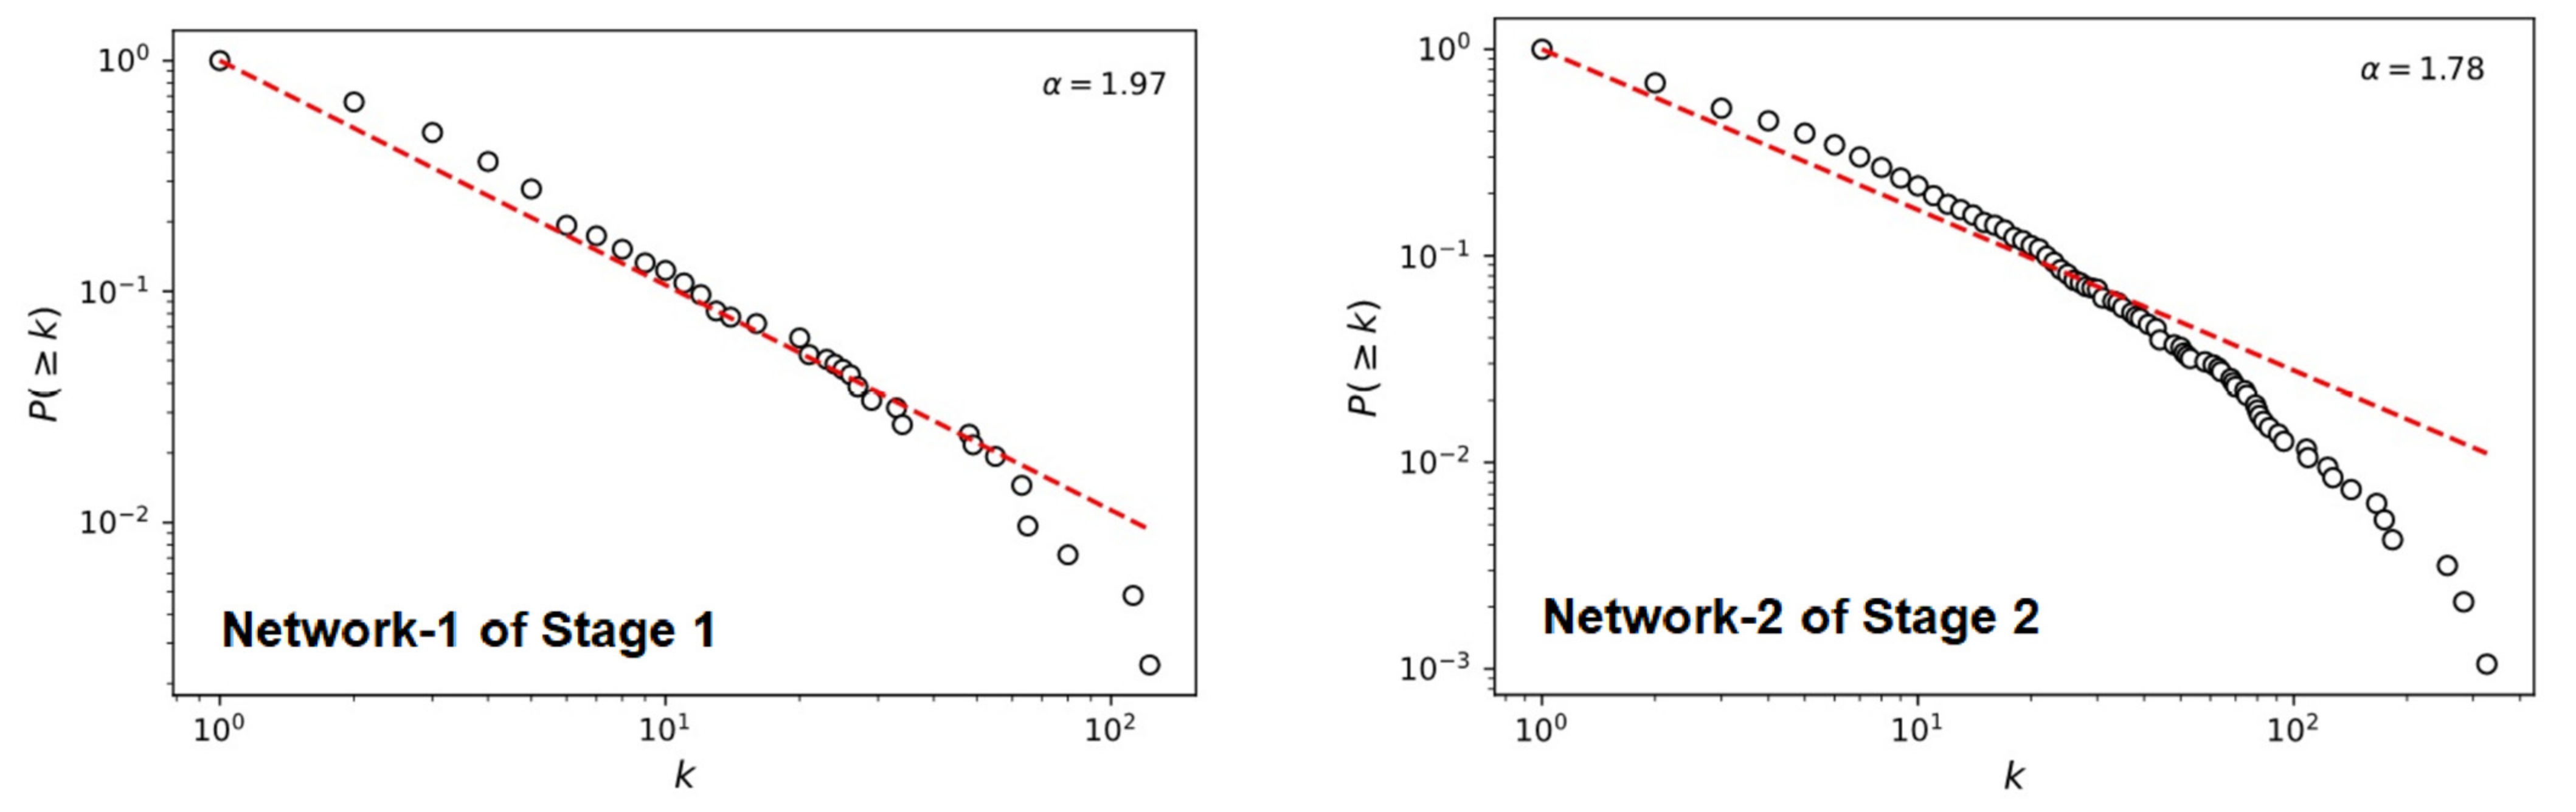
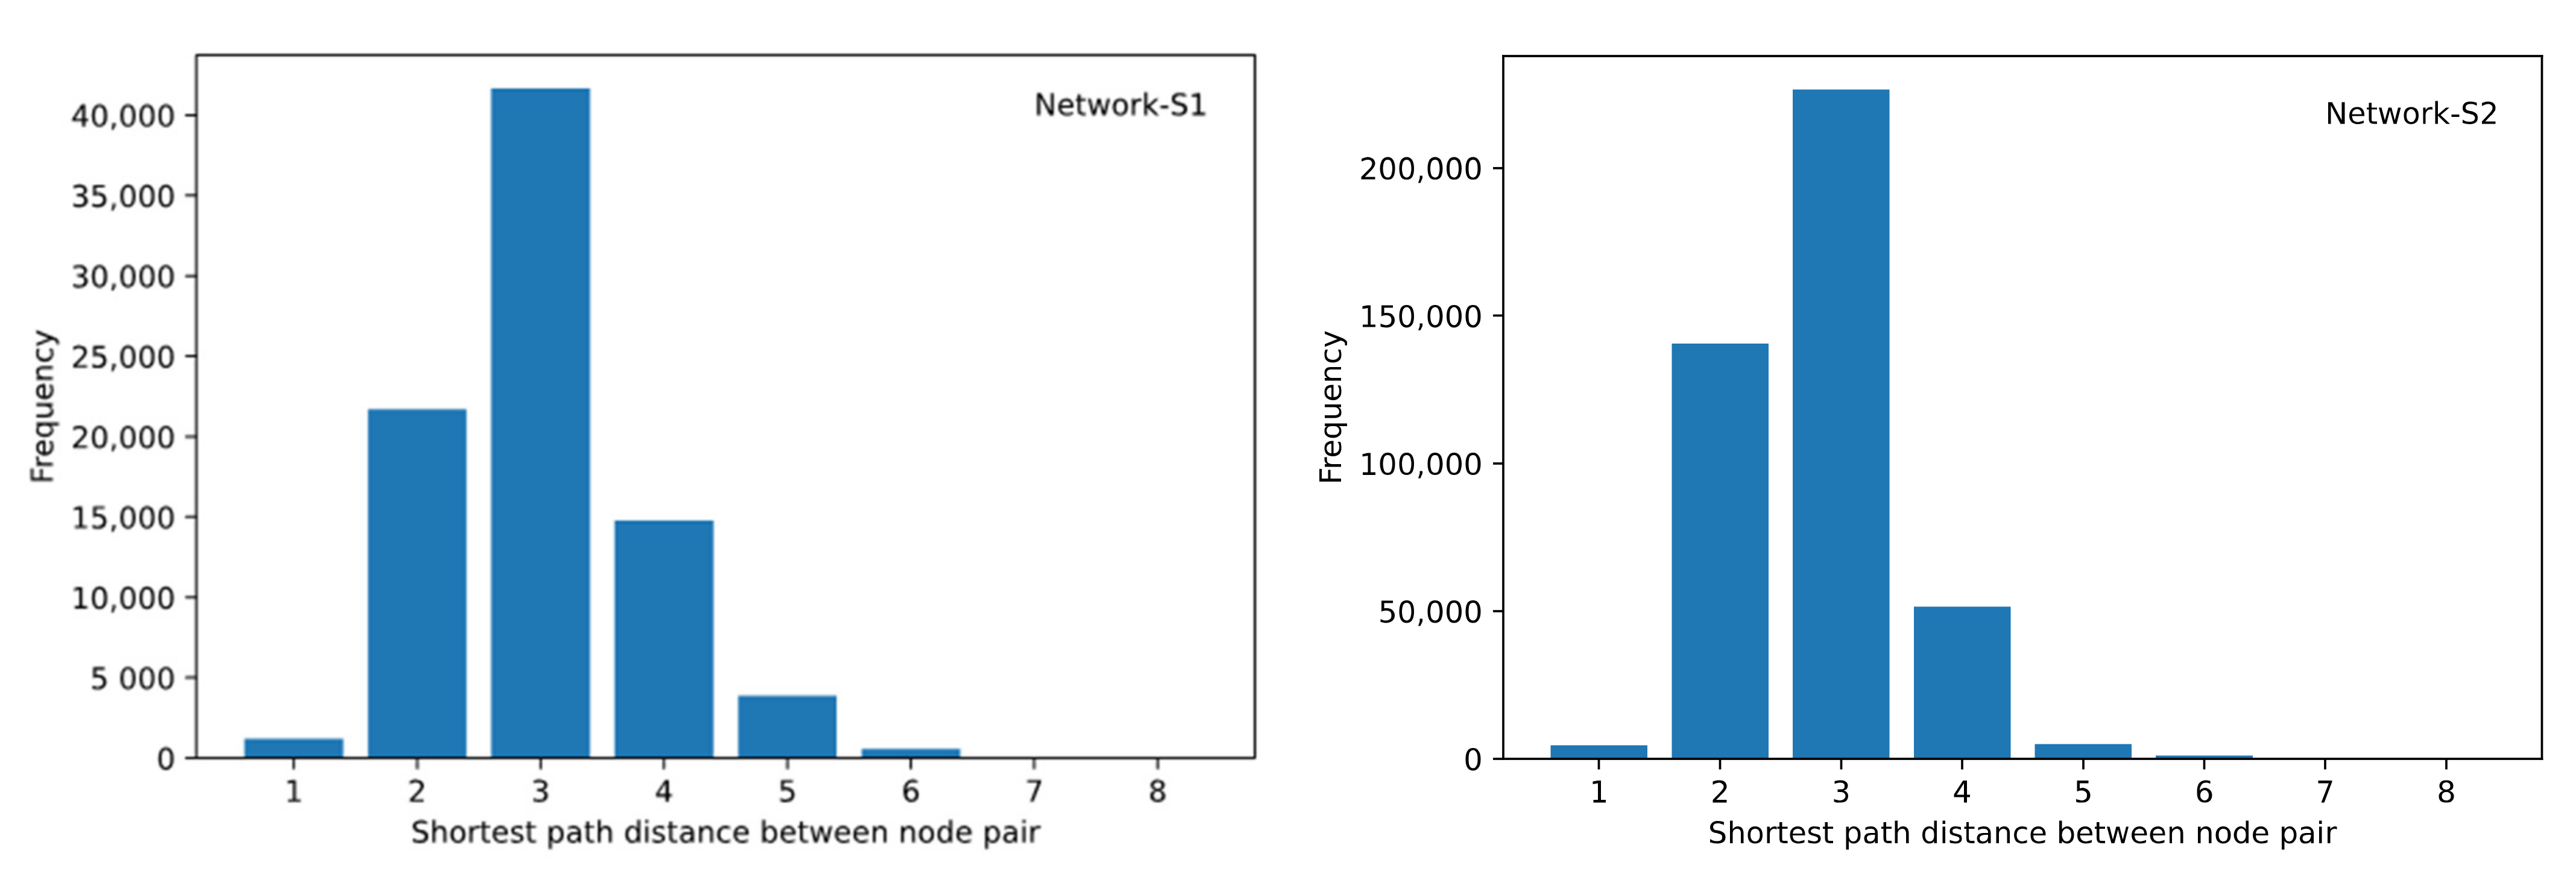
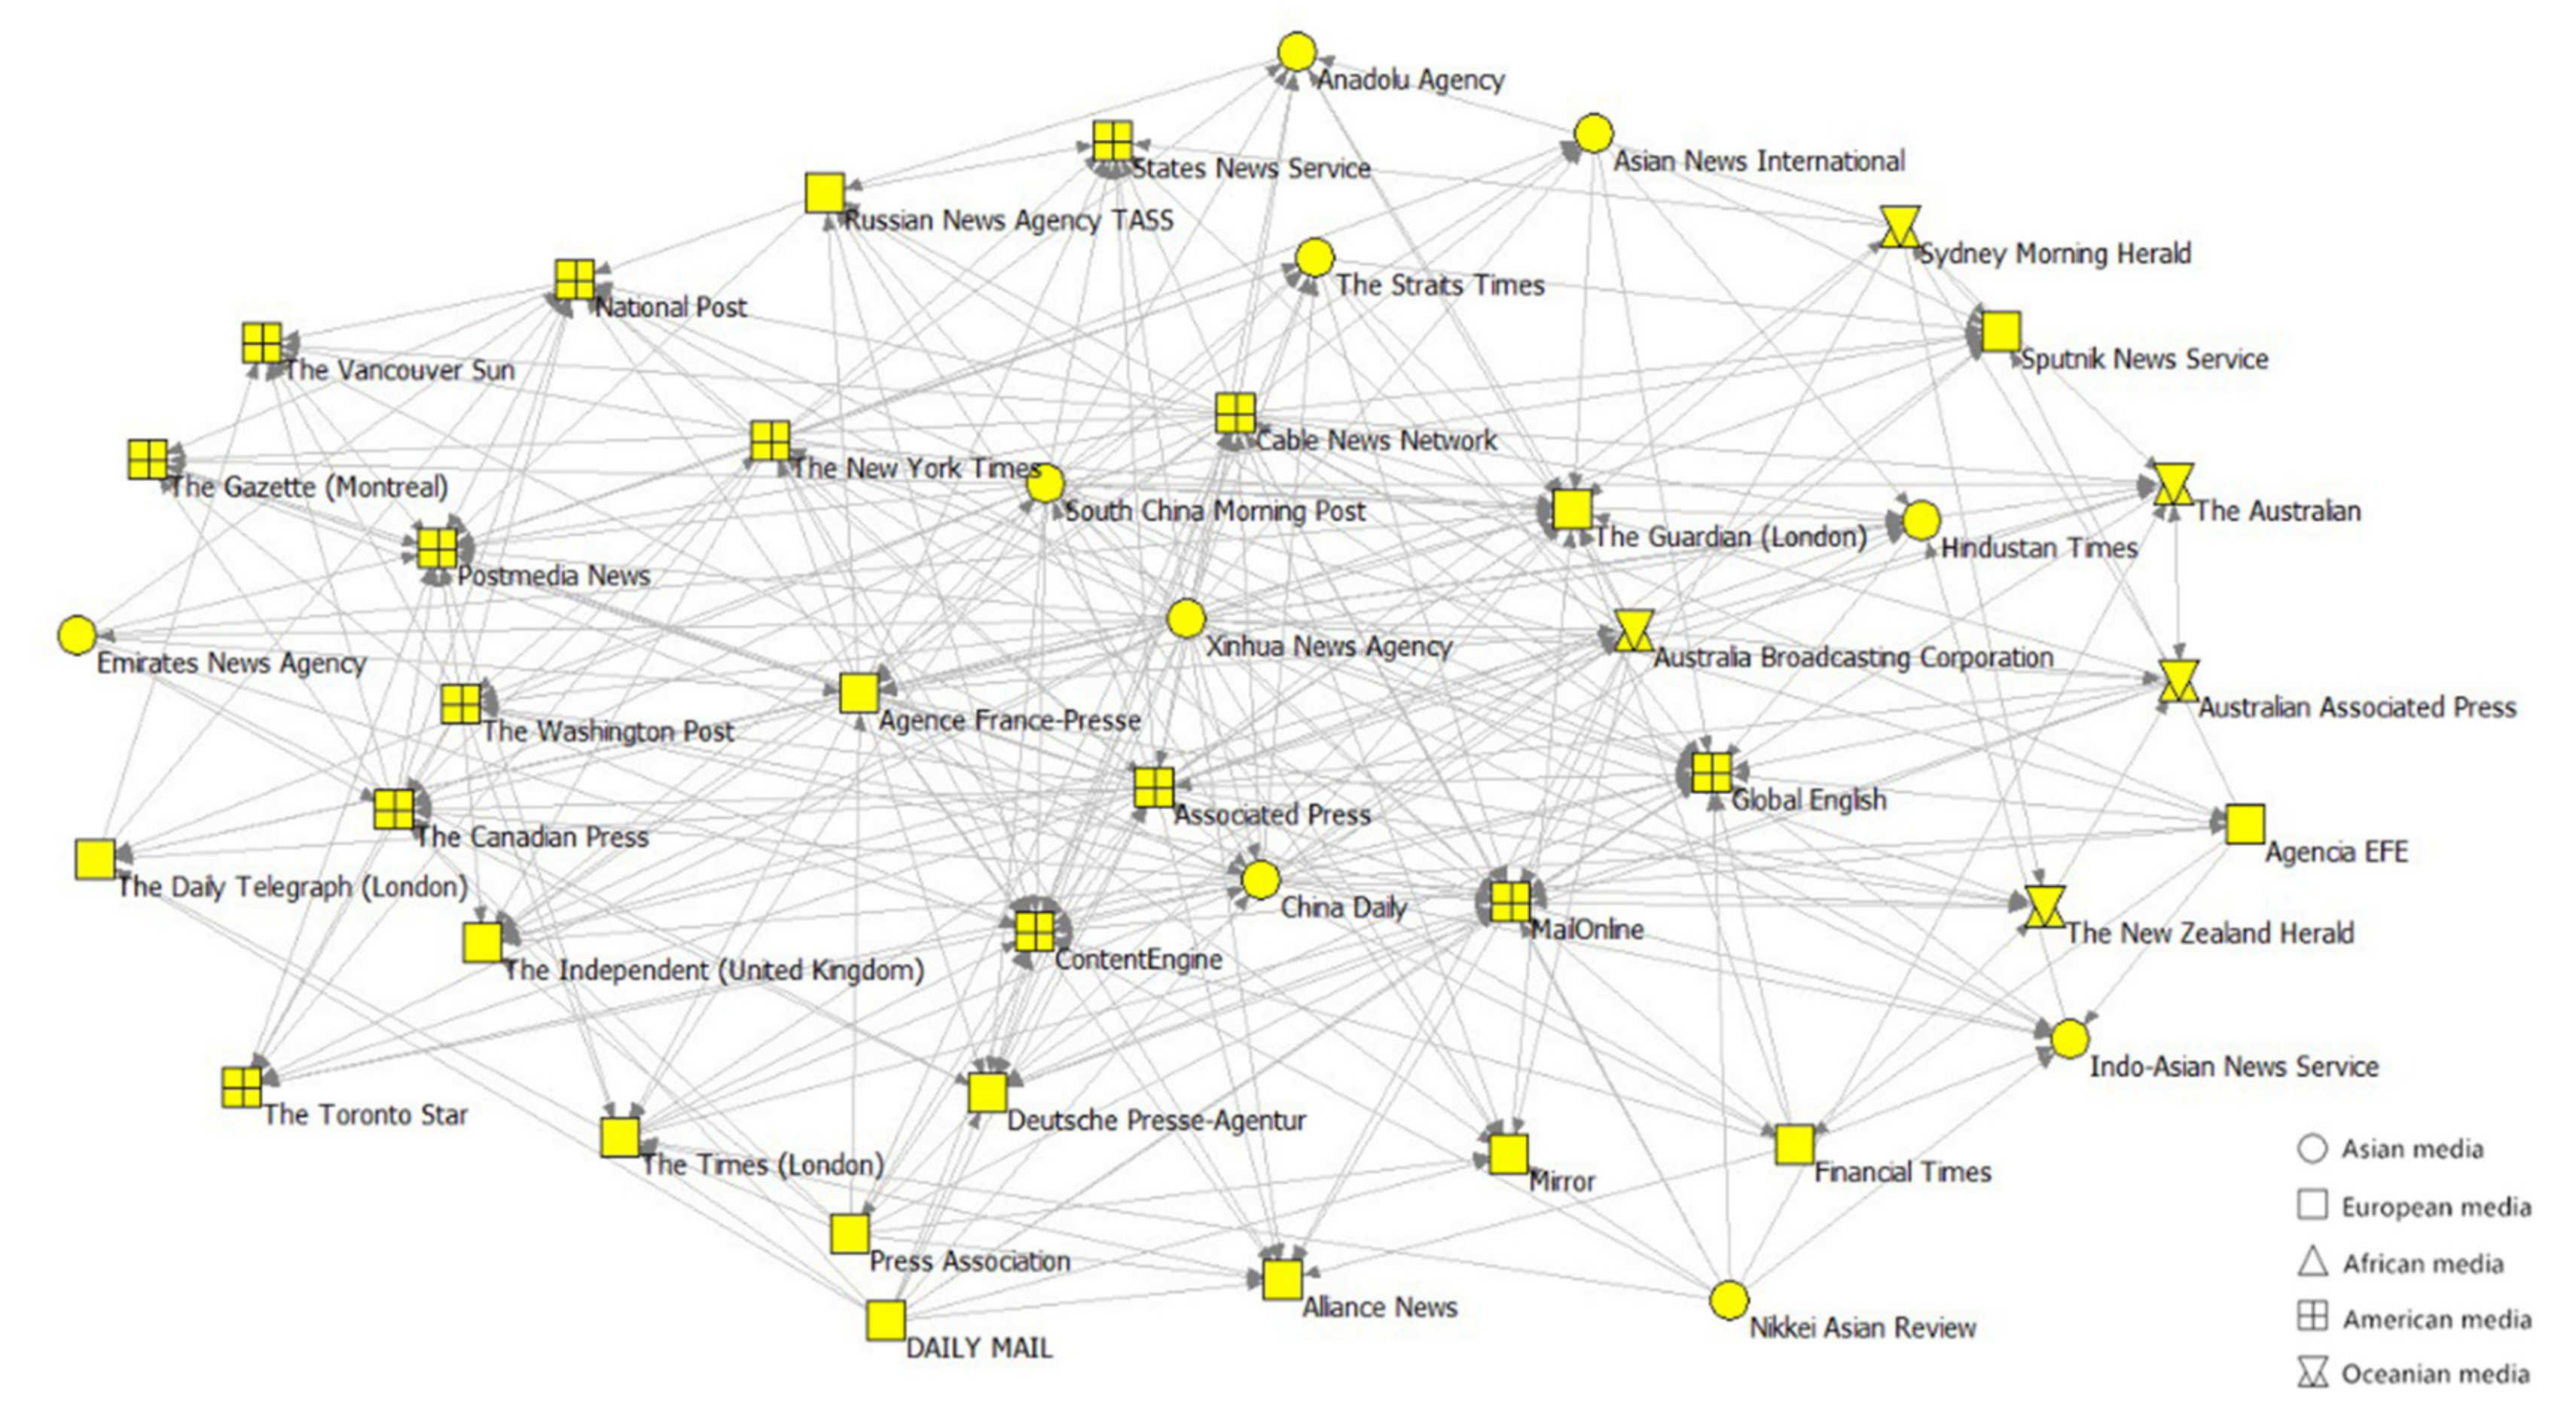
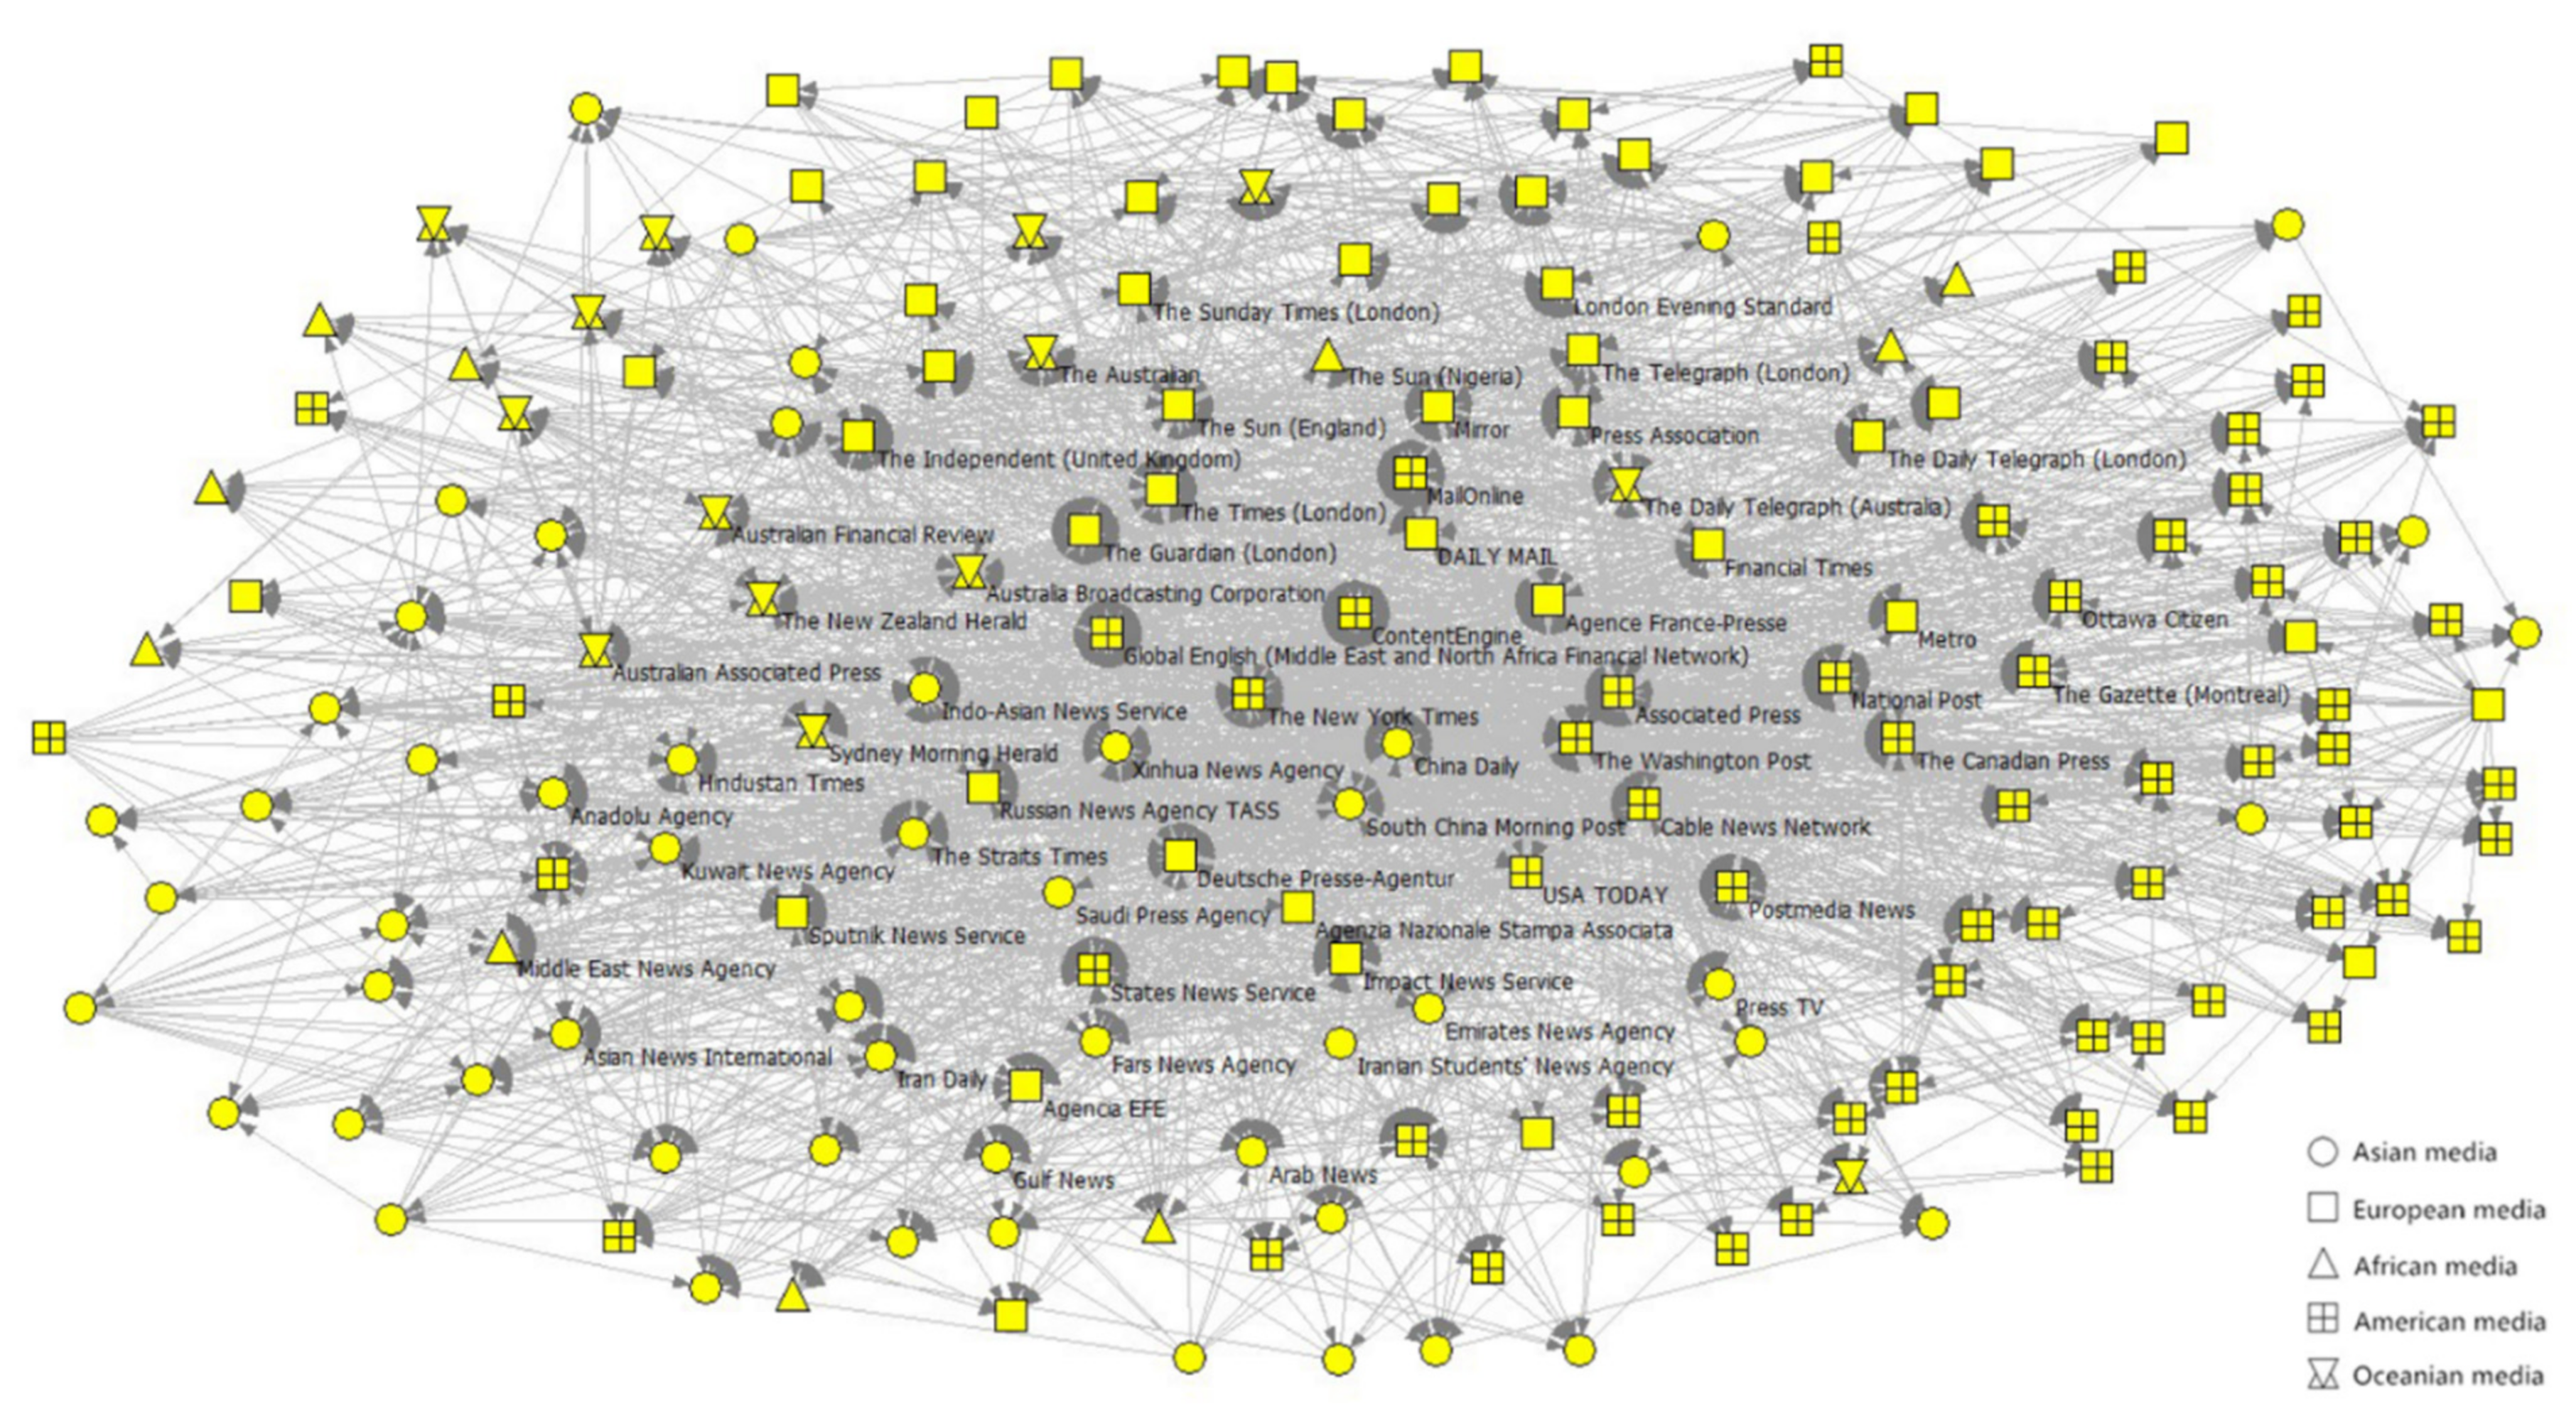
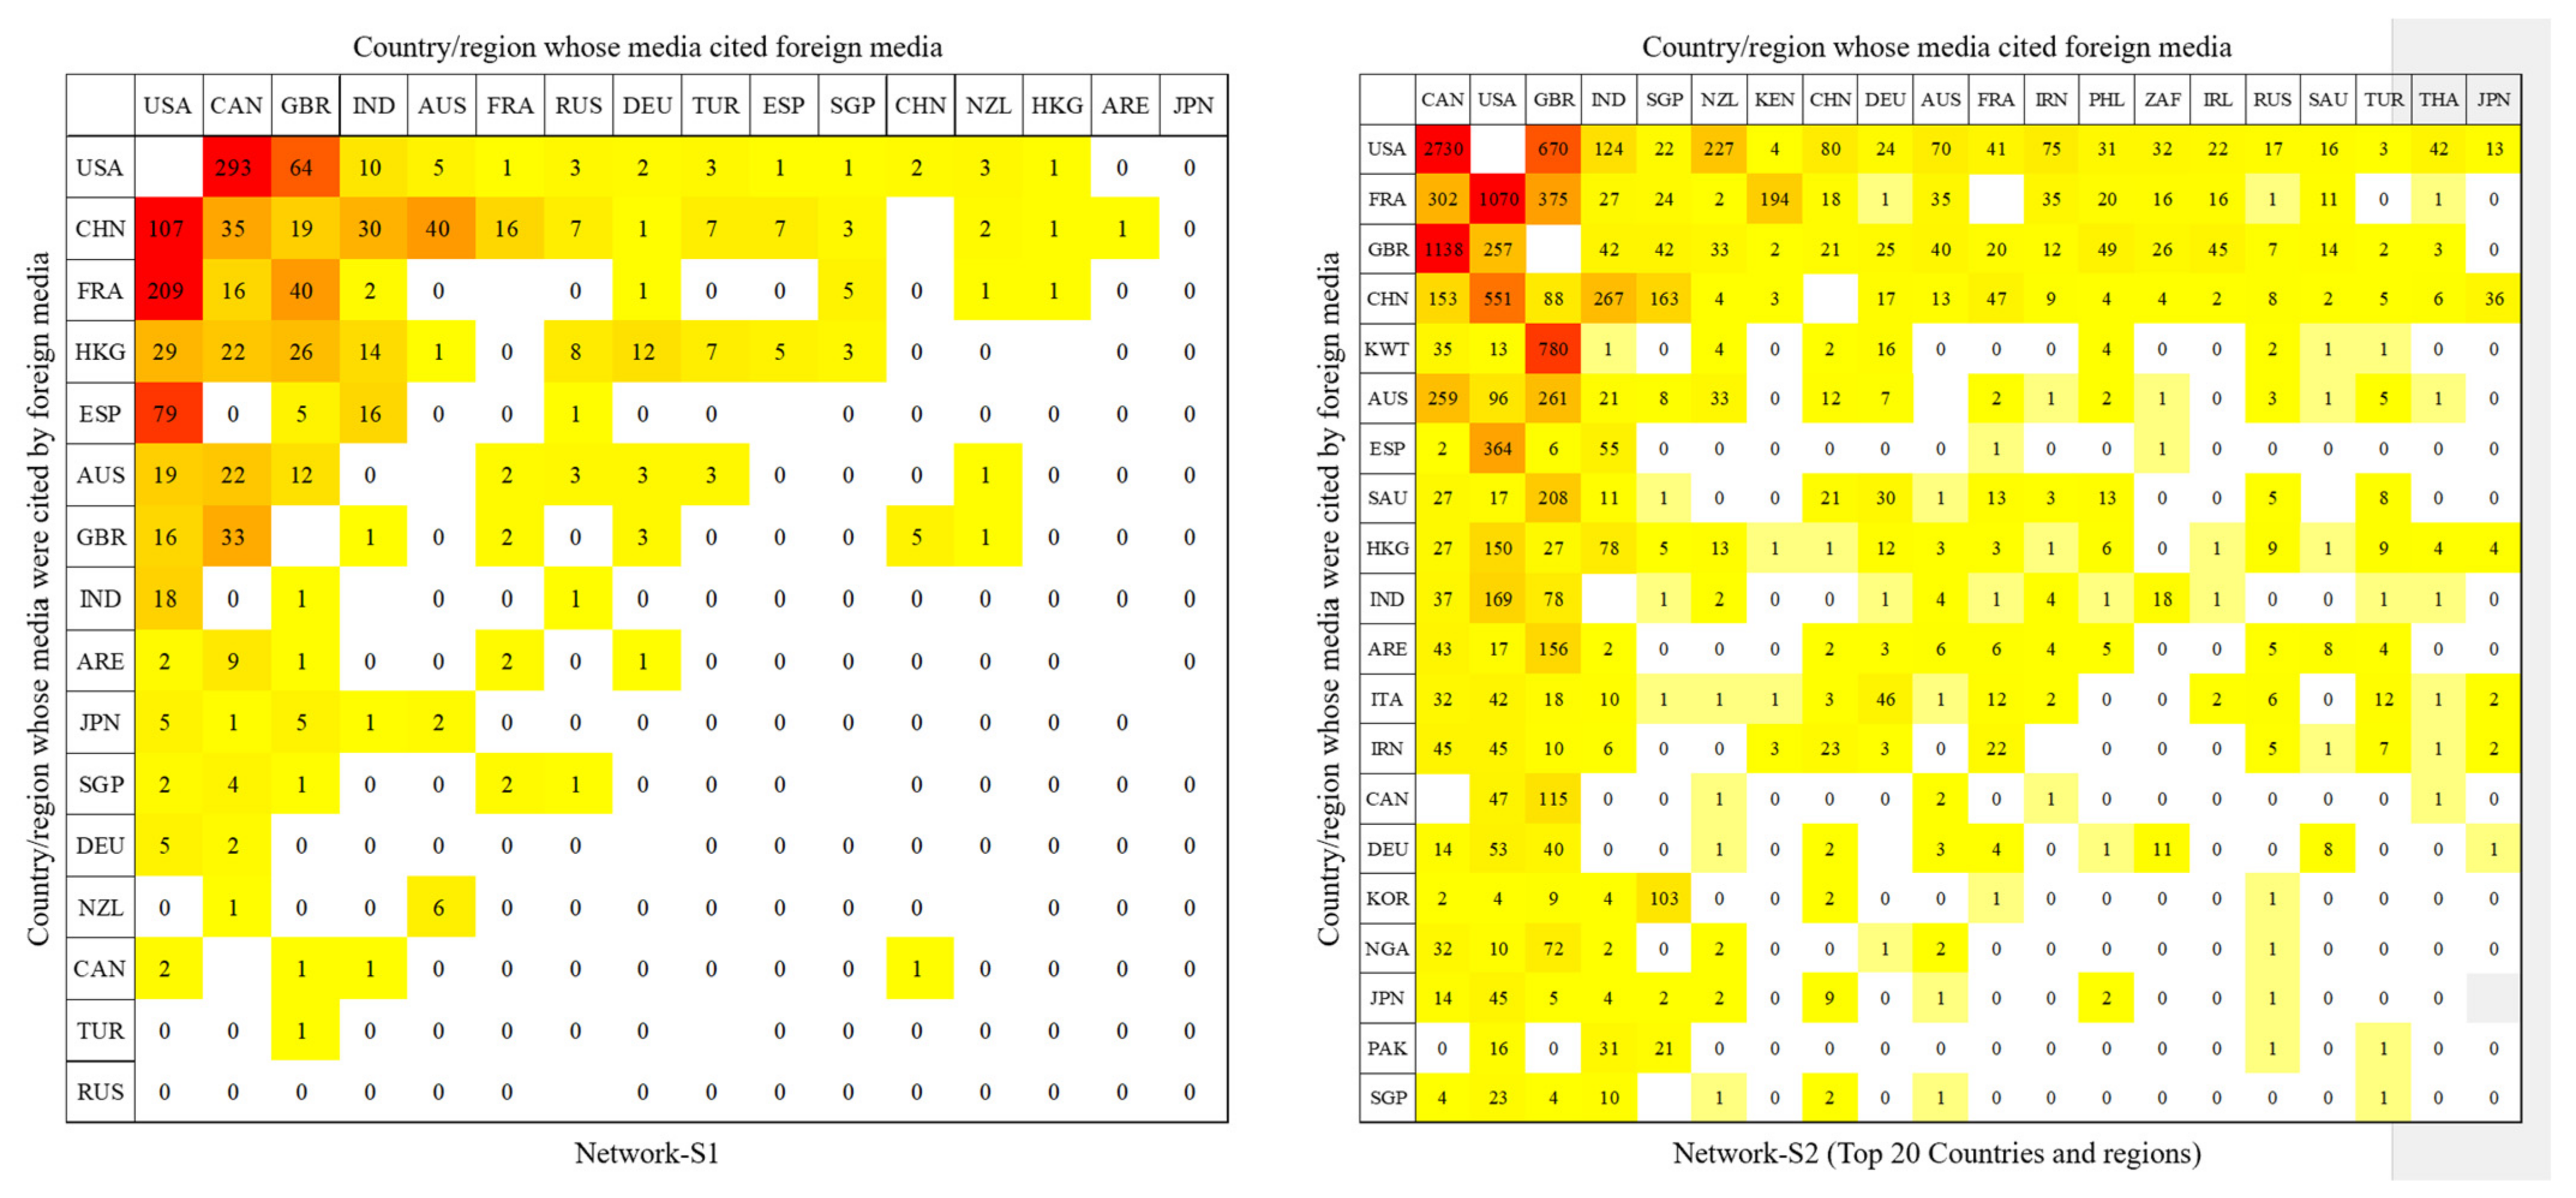
3.1. Network Structure
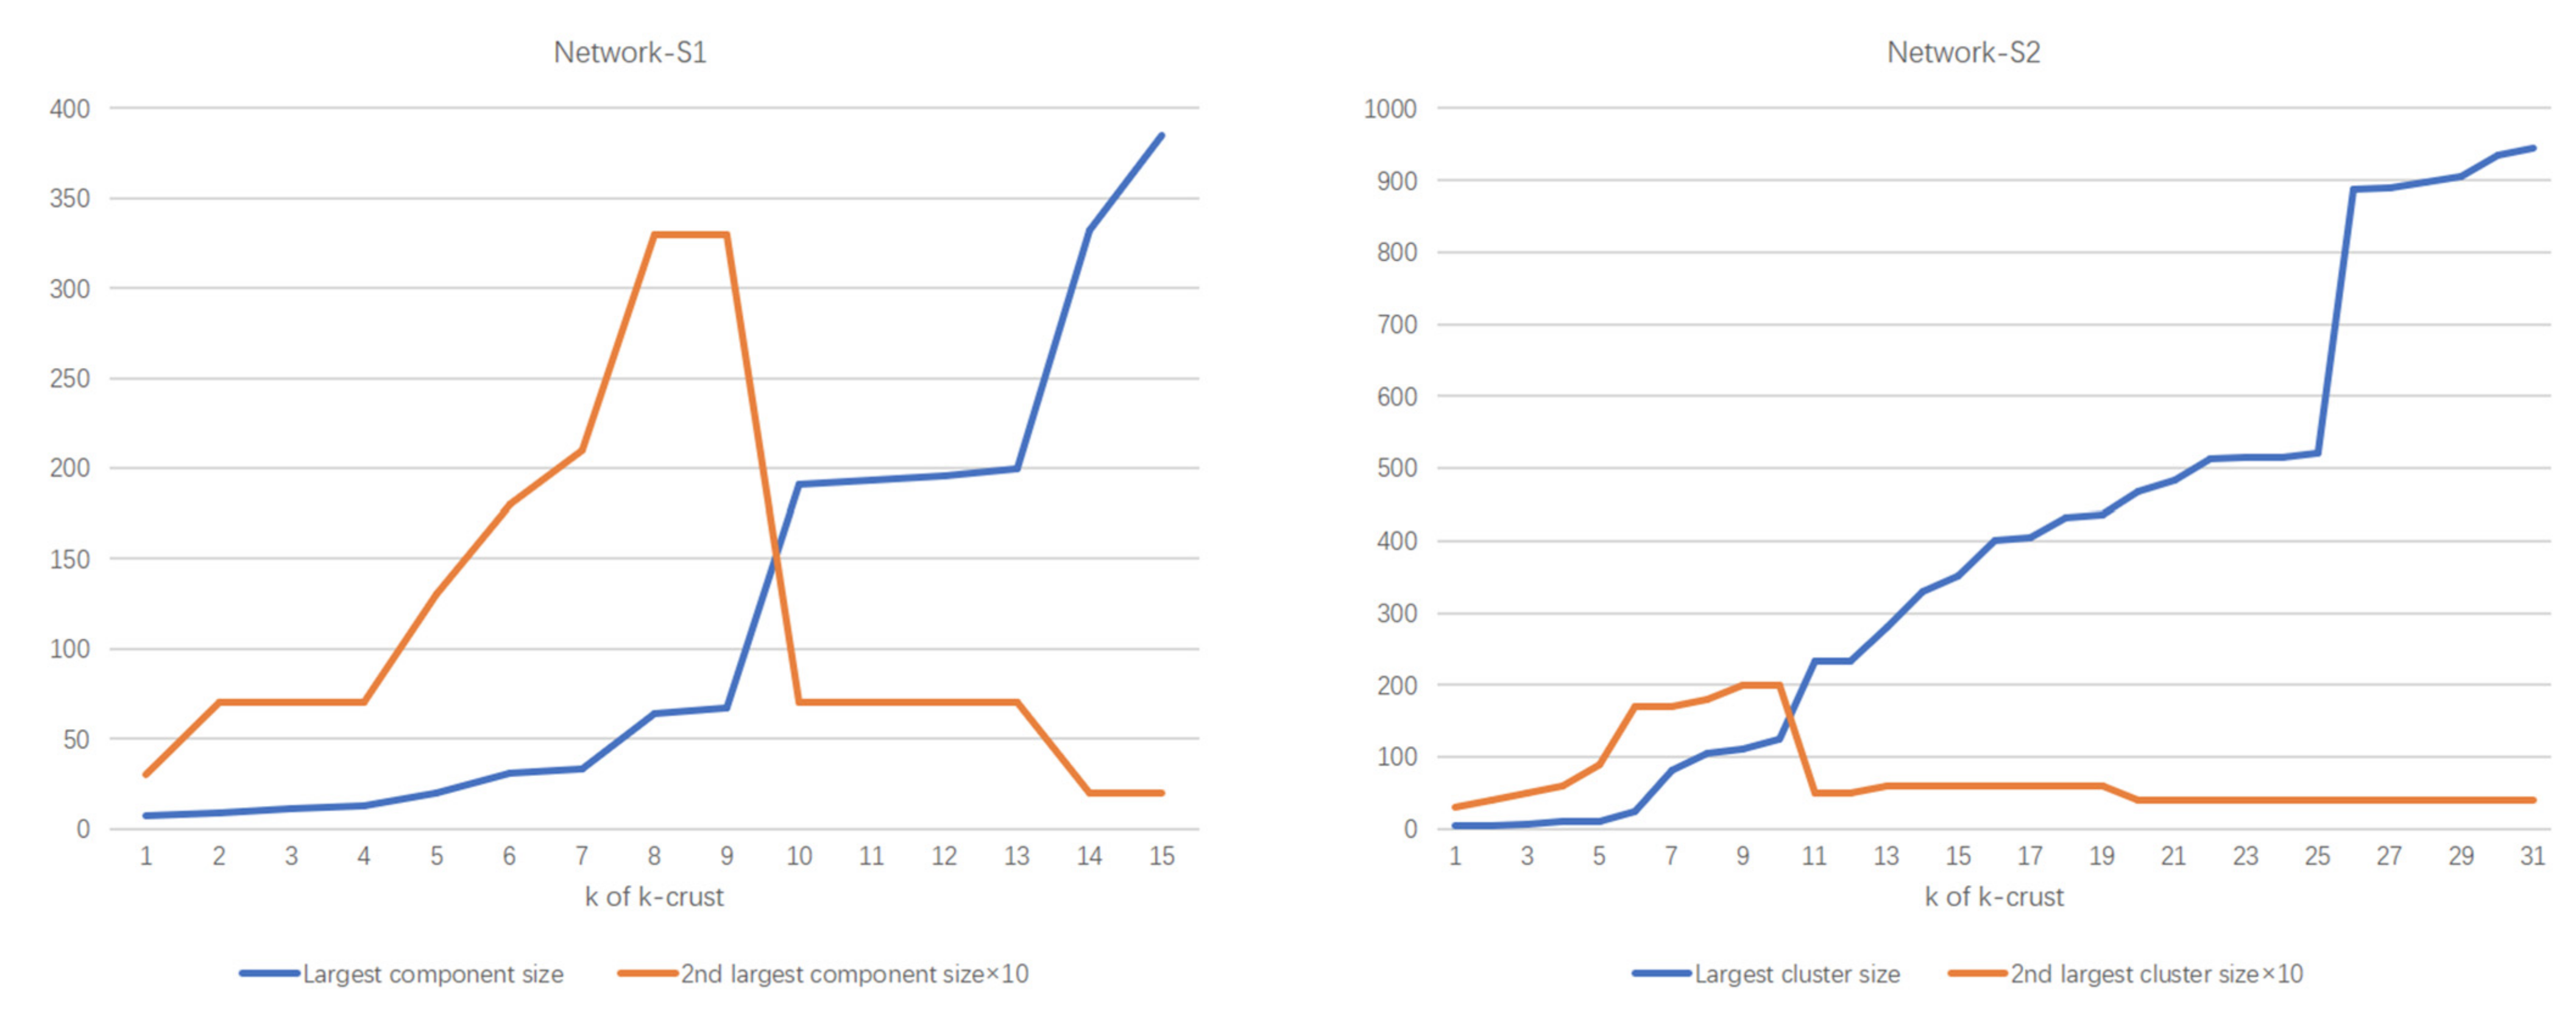
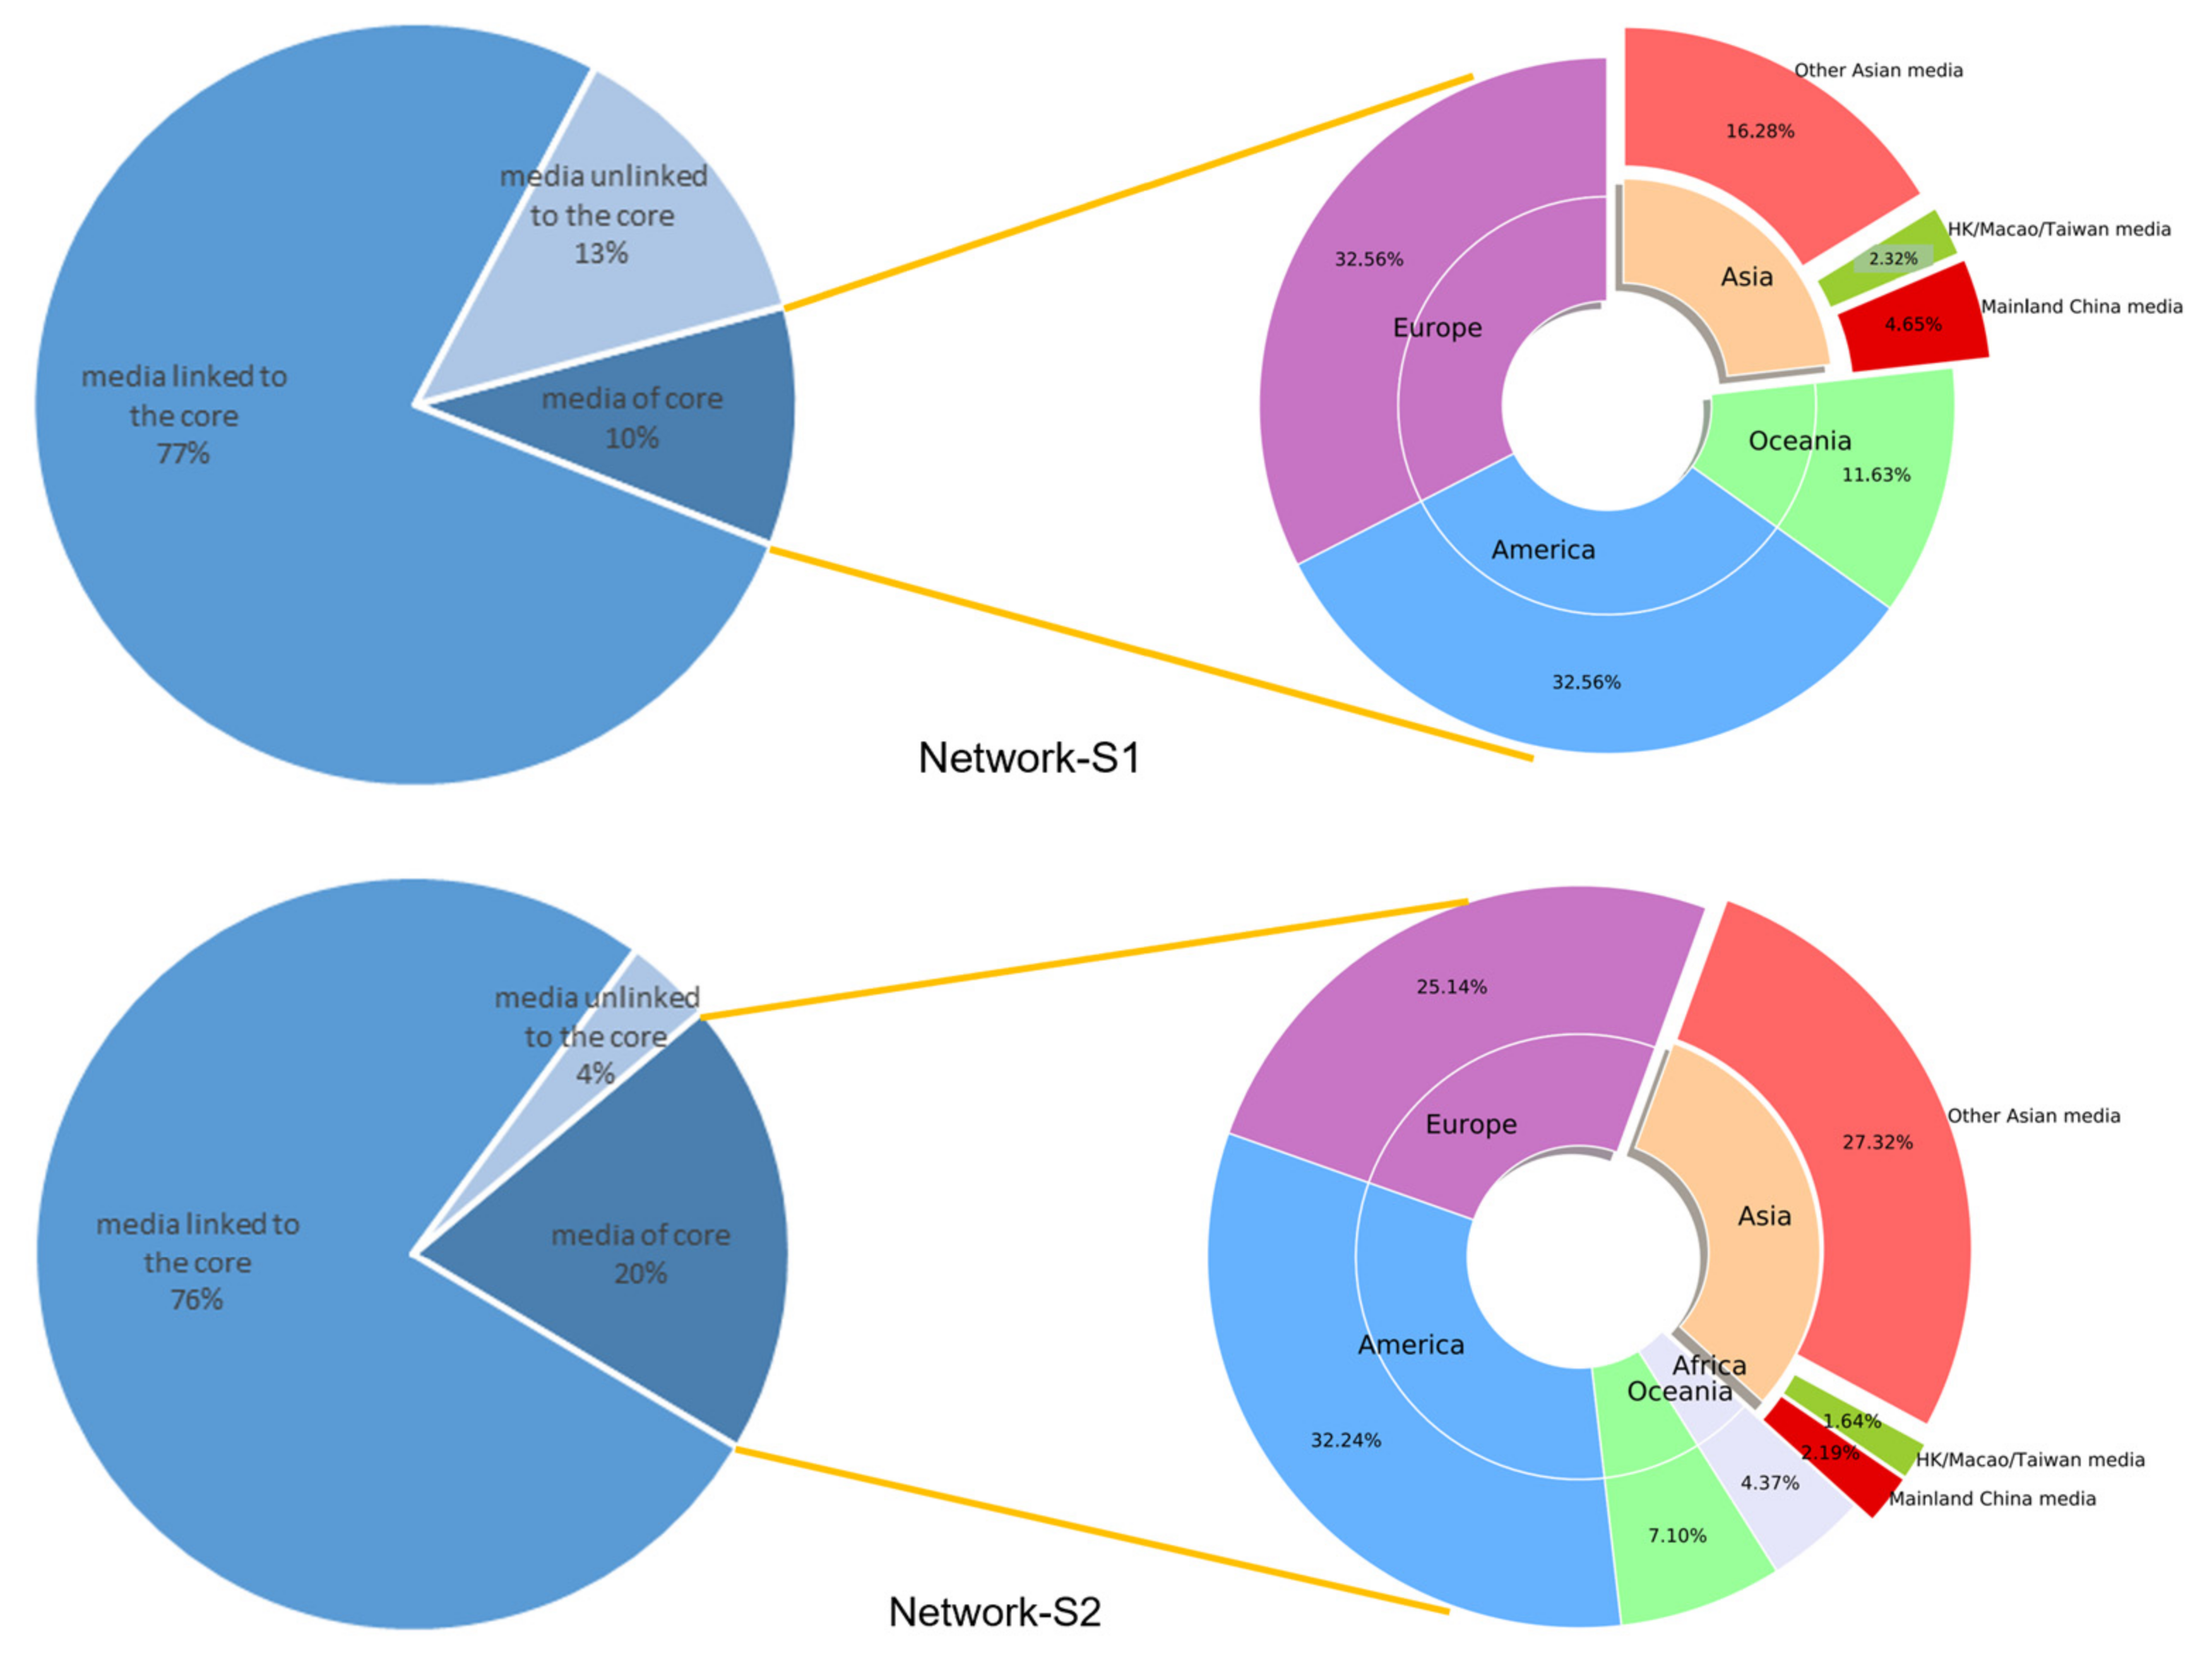
3.2. Network Core and Periphery
3.3. Node Performance
4. Conclusions
Author Contributions
Funding
Data Availability Statement
Conflicts of Interest
Appendix A

| Country/Region | Abbr. | Country/Region | Abbr. | Country/Region | Abbr. | Country/Region | Abbr. |
|---|---|---|---|---|---|---|---|
| Australia | AUS | Ireland | IRL | New Zealand | NZL | South Africa | ZAF |
| Canada | CAN | Italy | ITA | Nigeria | NGA | Spain | ESP |
| France | FRA | Japan | JPN | Pakistan | PAK | Thailand | THA |
| Germany | DEU | Kenya | KEN | Philippines | PHL | Turkey | TUR |
| Hong Kong | HKG | Korea, Republic of | KOR | Russian Federation | RUS | United Arab Emirates | ARE |
| India | IND | Kuwait | KWT | Saudi Arabia | SAU | United Kingdom | GBR |
| Iran, the Islamic Republic of | IRN | Mainland China | CHN | Singapore | SGP | United States of America | USA |
References
- Olagoke, A.A.; Olagoke, O.O.; Hughes, A.M. Exposure to coronavirus news on mainstream media: The role of risk perceptions and depression. Br. J. Health Psychol. 2020, 25, 865–874. [Google Scholar] [CrossRef]
- Yao, H. The more exposure to media information about COVID-19, the more distressed you will feel. Brain Behav. Immun. 2020, 87, 167–169. [Google Scholar] [CrossRef] [PubMed]
- Arafat, S.M.Y.; Kar, S.K.; Menon, V.; Kaliamoorthy, C.; Mukherjee, S.; Alradie-Mohamed, A.; Sharma, P.; Marthoenis, M.; Kabir, R. Panic buying: An insight from the content analysis of media reports during COVID-19 pandemic. Neurol. Psychiatry Brain Res. 2020, 37, 100–103. [Google Scholar] [CrossRef]
- Chen, H.; Huang, X.; Li, Z. A content analysis of Chinese news coverage on COVID-19 and tourism. Curr. Issues Tour. 2020, 25, 198–205. [Google Scholar] [CrossRef]
- Glik, D.C. Risk Communication for Public Health Emergencies. Annu. Rev. Public Health 2007, 28, 33–54. [Google Scholar] [CrossRef]
- Caldarelli, G.; De Nicola, R.; Petrocchi, M.; Pratelli, M.; Saracco, F. Flow of online misinformation during the peak of the COVID-19 pandemic in Italy. EPJ Data Sci. 2021, 10, 34. [Google Scholar] [CrossRef] [PubMed]
- Gabore, S.M. Western and Chinese media representation of Africa in COVID-19 news coverage. Asian J. Commun. 2020, 30, 299–316. [Google Scholar] [CrossRef]
- Guo, L.; Vargo, C.J. Predictors of International News Flow: Exploring a Networked Global Media System. J. Broadcast. Electron. Media 2020, 64, 418–437. [Google Scholar] [CrossRef]
- Park, H.W.; Barnett, G.A.; Chung, C.J. Structural changes in the 2003–2009 global hyperlink network. Glob. Netw. 2011, 11, 522–542. [Google Scholar] [CrossRef]
- Segev, E. From where does the world look flatter? A comparative analysis of foreign coverage in world news. Journalism 2017, 20, 924–942. [Google Scholar] [CrossRef]
- World Health Organization. Pandemic Influenza Risk Management: A WHO Guide to Inform and Harmonize National and International Pandemic Preparedness and Response; (WHO/WHE/IHM/GIP/2017.1); World Health Organization: Geneva, Switzerland, 2017; Available online: https://apps.who.int/iris/handle/10665/259893 (accessed on 2 January 2022).
- Adams, K.; McClure, M.L.; Fuller, H.J.A. A description of rapid design and implementation of new features in an electronic health record in the United States Department of Veterans Affairs, Veterans Health Administration response to the Covid-19 pandemic. Knowl. Manag. E-Learn. 2021, 13, 438–451. [Google Scholar] [CrossRef]
- Oladele, H.O.; Opele, J.K.; Avwioro, T.O.; Afolabi, A.O.; Awotorebo, O.T. The perception and attitude of nursing students towards online learning during the Covid-19 lockdown in South West Nigeria. Knowl. Manag. E-Learn. 2022, 14, 30–45. [Google Scholar] [CrossRef]
- Généreux, M.; David, M.D.; O’Sullivan, T.; Carignan, M.-È.; Blouin-Genest, G.; Champagne-Poirier, O.; Champagne, É.; Burlone, N.; Qadar, Z.; Herbosa, T.; et al. Communication strategies and media discourses in the age of COVID-19: An urgent need for action. Health Promot. Int. 2021, 36, 1178–1185. [Google Scholar] [CrossRef] [PubMed]
- Giddens, A. Risk and Responsibility. Mod. Law Rev. 1999, 62, 1–10. [Google Scholar] [CrossRef]
- Gozzi, N.; Tizzani, M.; Starnini, M.; Ciulla, F.; Paolotti, D.; Panisson, A.; Perra, N. Collective Response to Media Coverage of the COVID-19 Pandemic on Reddit and Wikipedia: Mixed-Methods Analysis. J. Med. Internet Res. 2020, 22, e21597. [Google Scholar] [CrossRef]
- Greenberg, J.; Dubé, E.; Driedger, M. Vaccine hesitancy: In search of the risk communication comfort zone. PLoS Curr. 2017, 9. [Google Scholar] [CrossRef]
- Driedger, M.; Maier, R.; Capurro, G.; Jardine, C. Drawing from the ‘bank of credibility’: Perspectives of health officials and the public on media handling of the H1N1 pandemic. J. Risk Res. 2021, 24, 1499–1516. [Google Scholar] [CrossRef]
- Li, X.; Cao, B. Media variants, situation awareness, and protective public-health behaviors. Chin. J. Commun. 2019, 12, 467–483. [Google Scholar] [CrossRef]
- Lin, C.A.; Lagoe, C. Effects of News Media and Interpersonal Interactions on H1N1 Risk Perception and Vaccination Intent. Commun. Res. Rep. 2013, 30, 127–136. [Google Scholar] [CrossRef]
- Oh, S.-H.; Paek, H.-J.; Hove, T. Cognitive and emotional dimensions of perceived risk characteristics, genre-specific media effects, and risk perceptions: The case of H1N1 influenza in South Korea. Asian J. Commun. 2015, 25, 14–32. [Google Scholar] [CrossRef]
- Chiu, D.K.W.; Lin DT, T.; Kafeza, E.; Wang, M.; Hu, H.; Hu, H.; Zhuang, Y. Alert-Based Disaster Notification and Resource Allocation. Inf. Syst. Front. 2010, 12, 29–47. [Google Scholar] [CrossRef] [Green Version]
- Laing, A. The H1N1 crisis: Roles played by government communicators, the public and the media. J. Prof. Commun. 2011, 1, 123–149. [Google Scholar] [CrossRef] [Green Version]
- Mayo-Cubero, M. News sections, journalists and information sources in the journalistic coverage of crises and emergencies in Spain. Prof. De La Inf. 2020, 29, e290211. [Google Scholar] [CrossRef]
- Alvarez-Galvez, J.; Suarez-Lledo, V.; Rojas-Garcia, A. Determinants of Infodemics During Disease Outbreaks: A Systematic Review. Front. Public Health 2021, 9, 603603. [Google Scholar] [CrossRef]
- Laato, S.; Islam AK, M.N.; Islam, M.N.; Whelan, E. What drives unverified information sharing and cyberchondria during the COVID-19 pandemic? Eur. J. Inf. Syst. 2020, 29, 288–305. [Google Scholar] [CrossRef]
- Tapia, L. COVID-19 and Fake News in the Dominican Republic. Am. J. Trop. Med. Hyg. 2020, 102, 1172–1174. [Google Scholar] [CrossRef]
- Ophir, Y. Coverage of Epidemics in American Newspapers Through the Lens of the Crisis and Emergency Risk Communication Framework. Health Secur. 2018, 16, 147–157. [Google Scholar] [CrossRef] [Green Version]
- Kilgo, D.K.; Yoo, J.; Johnson, T.J. Spreading Ebola Panic: Newspaper and Social Media Coverage of the 2014 Ebola Health Crisis. Health Commun. 2018, 34, 811–817. [Google Scholar] [CrossRef] [PubMed]
- Masip, P.; Aran-Ramspott, S.; Ruiz-Caballero, C.; Suau, J.; Almenar, E.; Puertas-Graell, D. News consumption and media coverage during the confinement by Covid-19: Information overload, ideological bias and sensationalism. Prof. De La Inf. 2020, 29, 1–12. [Google Scholar] [CrossRef]
- Yan, Q.; Tang, Y.; Yan, D.; Wang, J.; Yang, L.; Yang, X.; Tang, S. Impact of media reports on the early spread of COVID-19 epidemic. J. Theor. Biol. 2020, 502, 110385. [Google Scholar] [CrossRef]
- Yan, Y.; Bissell, K. The Sky Is Falling: Predictors of News Coverage of Natural Disasters Worldwide. Commun. Res. 2015, 45, 862–886. [Google Scholar] [CrossRef]
- Wallerstein, I. The Modern World-System: Capitalist Agriculture and the Origins of the European World-Economy in the Sixteenth Century; Academic Press: New York, NY, USA, 1974; Volume 974, Available online: https://www.jstor.org/stable/10.1525/j.ctt1pnrj9 (accessed on 2 January 2022).
- Roman, N.; Alkazemi, M.F.; Stewart, M.C. Tweeting about terror: A World Systems Theory approach to comparing international newspaper coverage online. Int. Commun. Gaz. 2020, 82, 507–525. [Google Scholar] [CrossRef]
- Kim, K.; Barnett, G.A. The Determinants of International News Flow. Commun. Res. 1996, 23, 323–352. [Google Scholar] [CrossRef]
- Chang, T.-K.; Himelboim, I.; Dong, D. Open Global Networks, Closed International Flows. Int. Commun. Gaz. 2009, 71, 137–159. [Google Scholar] [CrossRef]
- Grasland, C. International news flow theory revisited through a space–time interaction model: Application to a sample of 320,000 international news stories published through RSS flows by 31 daily newspapers in 2015. Int. Commun. Gaz. 2019, 82, 231–259. [Google Scholar] [CrossRef] [Green Version]
- Guo, L.; Mays, K.; Wang, J. Whose Story Wins on Twitter? Journal. Stud. 2017, 20, 563–584. [Google Scholar] [CrossRef]
- Czvetkó, T.; Honti, G.; Sebestyén, V.; Abonyi, J. The intertwining of world news with Sustainable Development Goals: An effective monitoring tool. Heliyon 2021, 7, e06174. [Google Scholar] [CrossRef]
- Fracasso, A.; Grassano, N.; Vittucci Marzetti, G. The Gravity of Foreign News Coverage in the EU: Does the Euro Matter? JCMS J. Common Mark. Stud. 2014, 53, 274–291. [Google Scholar] [CrossRef]
- Blondheim, M.; Segev, E.; Cabrera, M.-Á. The Prominence of Weak Economies: Factors and Trends in Global News Coverage of Economic Crisis, 2009–2012. Int. J. Commun. 2015, 9, 22. [Google Scholar]
- Segev, E. The group-sphere model of international news flow: A cross-national comparison of news sites. Int. Commun. Gaz. 2015, 78, 200–222. [Google Scholar] [CrossRef] [Green Version]
- Himelboim, I. The International Network Structure of News Media: An Analysis of Hyperlinks Usage in News Web sites. J. Broadcasting Electron. Media 2010, 54, 373–390. [Google Scholar] [CrossRef]
- Picard, R.G. Twilight or New Dawn of Journalism? Journal. Stud. 2014, 15, 500–510. [Google Scholar] [CrossRef]
- Reese, S.D. The New Geography of Journalism Research. Digit. Journal. 2016, 4, 816–826. [Google Scholar] [CrossRef]
- Pak, C.; Cotter, K.; DeCook, J. Intermedia Reliance and Sustainability of Emergent Media: A Large-Scale Analysis of American News Outlets’ External Linking Behaviors. Int. J. Commun. 2020, 14, 3546–3568. [Google Scholar]
- Hatcher, J.A.; Thayer, D. Assessing Collaboration in One Media Ecosystem. Journal. Pract. 2016, 11, 1283–1301. [Google Scholar] [CrossRef]
- Lowrey, W.; Gower, K.; Evans, W.; Mackay, J. Assessing Newspaper Preparedness for Public Health Emergencies. Journal. Mass Commun. Q. 2006, 83, 362–380. [Google Scholar] [CrossRef]
- Elia, E. Media coverage of climate change information by the Tanzania Guardian and Daily News in 2015. Inf. Dev. 2018, 35, 535–550. [Google Scholar] [CrossRef]
- Veltri, G.A. Information flows and centrality among elite European newspapers. Eur. J. Commun. 2012, 27, 354–375. [Google Scholar] [CrossRef] [Green Version]
- Elejalde, E.; Ferres, L.; Herder, E.; Bollen, J. Quantifying the ecological diversity and health of online news. J. Comput. Sci. 2018, 27, 218–226. [Google Scholar] [CrossRef]
- Newman, M.E.J. The Structure and Function of Complex Networks. SIAM Rev. 2003, 45, 167–256. [Google Scholar] [CrossRef] [Green Version]
- Gong, X.; Xiao, R. Research on multi-agent simulation of epidemic news spread characteristics. J. Artif. Soc. Soc. Simul. 2007, 10, 1. Available online: https://www.jasss.org/10/3/1.html (accessed on 2 January 2022).
- Spitz, A.; Gertz, M. Breaking the News. In Proceedings of the 2015 IEEE/ACM International Conference on Advances in Social Networks Analysis and Mining, Paris, France, 25–28 August 2015. [Google Scholar] [CrossRef]
- Traag, V.A.; Reinanda, R.; van Klinken, G. Structure of a Media Co-occurrence Network. In Proceedings of ECCS; Springer: Cham, Switzerland, 2014; pp. 81–91. [Google Scholar] [CrossRef] [Green Version]
- Özgür, A.; Bingol, H. Social Network of Co-occurrence in News Articles. In Lecture Notes in Computer Science; Springer: Berlin/Heidelberg, Germany, 2004; pp. 688–695. [Google Scholar] [CrossRef]
- World Health Organization. Timeline: WHO’s COVID-19 Response. Available online: https://www.theoceancleanup.com/updates/whales-likely-impacted-by-great-pacific-garbage-patch/ (accessed on 11 March 2022).
- World Health Organization. Novel Coronavirus (2019-nCoV): Situation Report, 9; World Health Organization: Geneva, Switzerland, 2020; Available online: https://apps.who.int/iris/handle/10665/330774 (accessed on 2 January 2022).
- Prieto-Ramos, F.; Pei, J.M.; Cheng, L. Institutional and news media denominations of COVID-19 and its causative virus: Between naming policies and naming politics. Discourse Commun. 2020, 14, 635–652. [Google Scholar] [CrossRef]
- Dong, H.J.; Zhou, M.L.; Che, D.W.; Zhang, H.Y.; Bodomo, A. Analysis of COVID-19 name varieties in Chinese mass and social media. Int. J. Environ. Res. Public Health 2021, 18, 9850. [Google Scholar] [CrossRef] [PubMed]
- Barabási, A.-L.; Albert, R. Emergence of Scaling in Random Networks. Science 1999, 286, 509–512. [Google Scholar] [CrossRef] [Green Version]
- Watts, D.J.; Strogatz, S.H. Collective dynamics of ‘small-world’ networks. Nature 1998, 393, 440–442. [Google Scholar] [CrossRef]
- Kitsak, M.; Gallos, L.K.; Havlin, S.; Liljeros, F.; Muchnik, L.; Stanley, H.E.; Makse, H.A. Identification of influential spreaders in complex networks. Nat. Phys. 2010, 6, 888–893. [Google Scholar] [CrossRef] [Green Version]
- Carmi, S.; Havlin, S.; Kirkpatrick, S.; Shavitt, Y.; Shir, E. A model of Internet topology using k-shell decomposition. Proc. Natl. Acad. Sci. USA 2007, 104, 11150–11154. [Google Scholar] [CrossRef] [PubMed] [Green Version]
- Girvan, M.; Newman, M.E.J. Community structure in social and biological networks. Proc. Natl. Acad. Sci. USA 2002, 99, 7821–7826. [Google Scholar] [CrossRef] [Green Version]
- Brin, S.; Page, L. Reprint of: The anatomy of a large-scale hypertextual web search engine. Comput. Netw. 2012, 56, 3825–3833. [Google Scholar] [CrossRef]
- Scott, J.; Carrington, P. The SAGE Handbook of Social Network Analysis; SAGE Publications: Southern Oaks, CA, USA, 2011. [Google Scholar] [CrossRef] [Green Version]
- Page, L.; Brin, S.; Motwani, R.; Winograd, T. The PageRank Citation Ranking: Bringing Order to the Web; Stanford InfoLab: Stanford, CA, USA, 1999; Available online: http://ilpubs.stanford.edu:8090/422/ (accessed on 2 January 2022).


| Stage | Number of Nodes | Number of Edges | Total Edge Weights | Density | Number of Components | Largest Component Size |
|---|---|---|---|---|---|---|
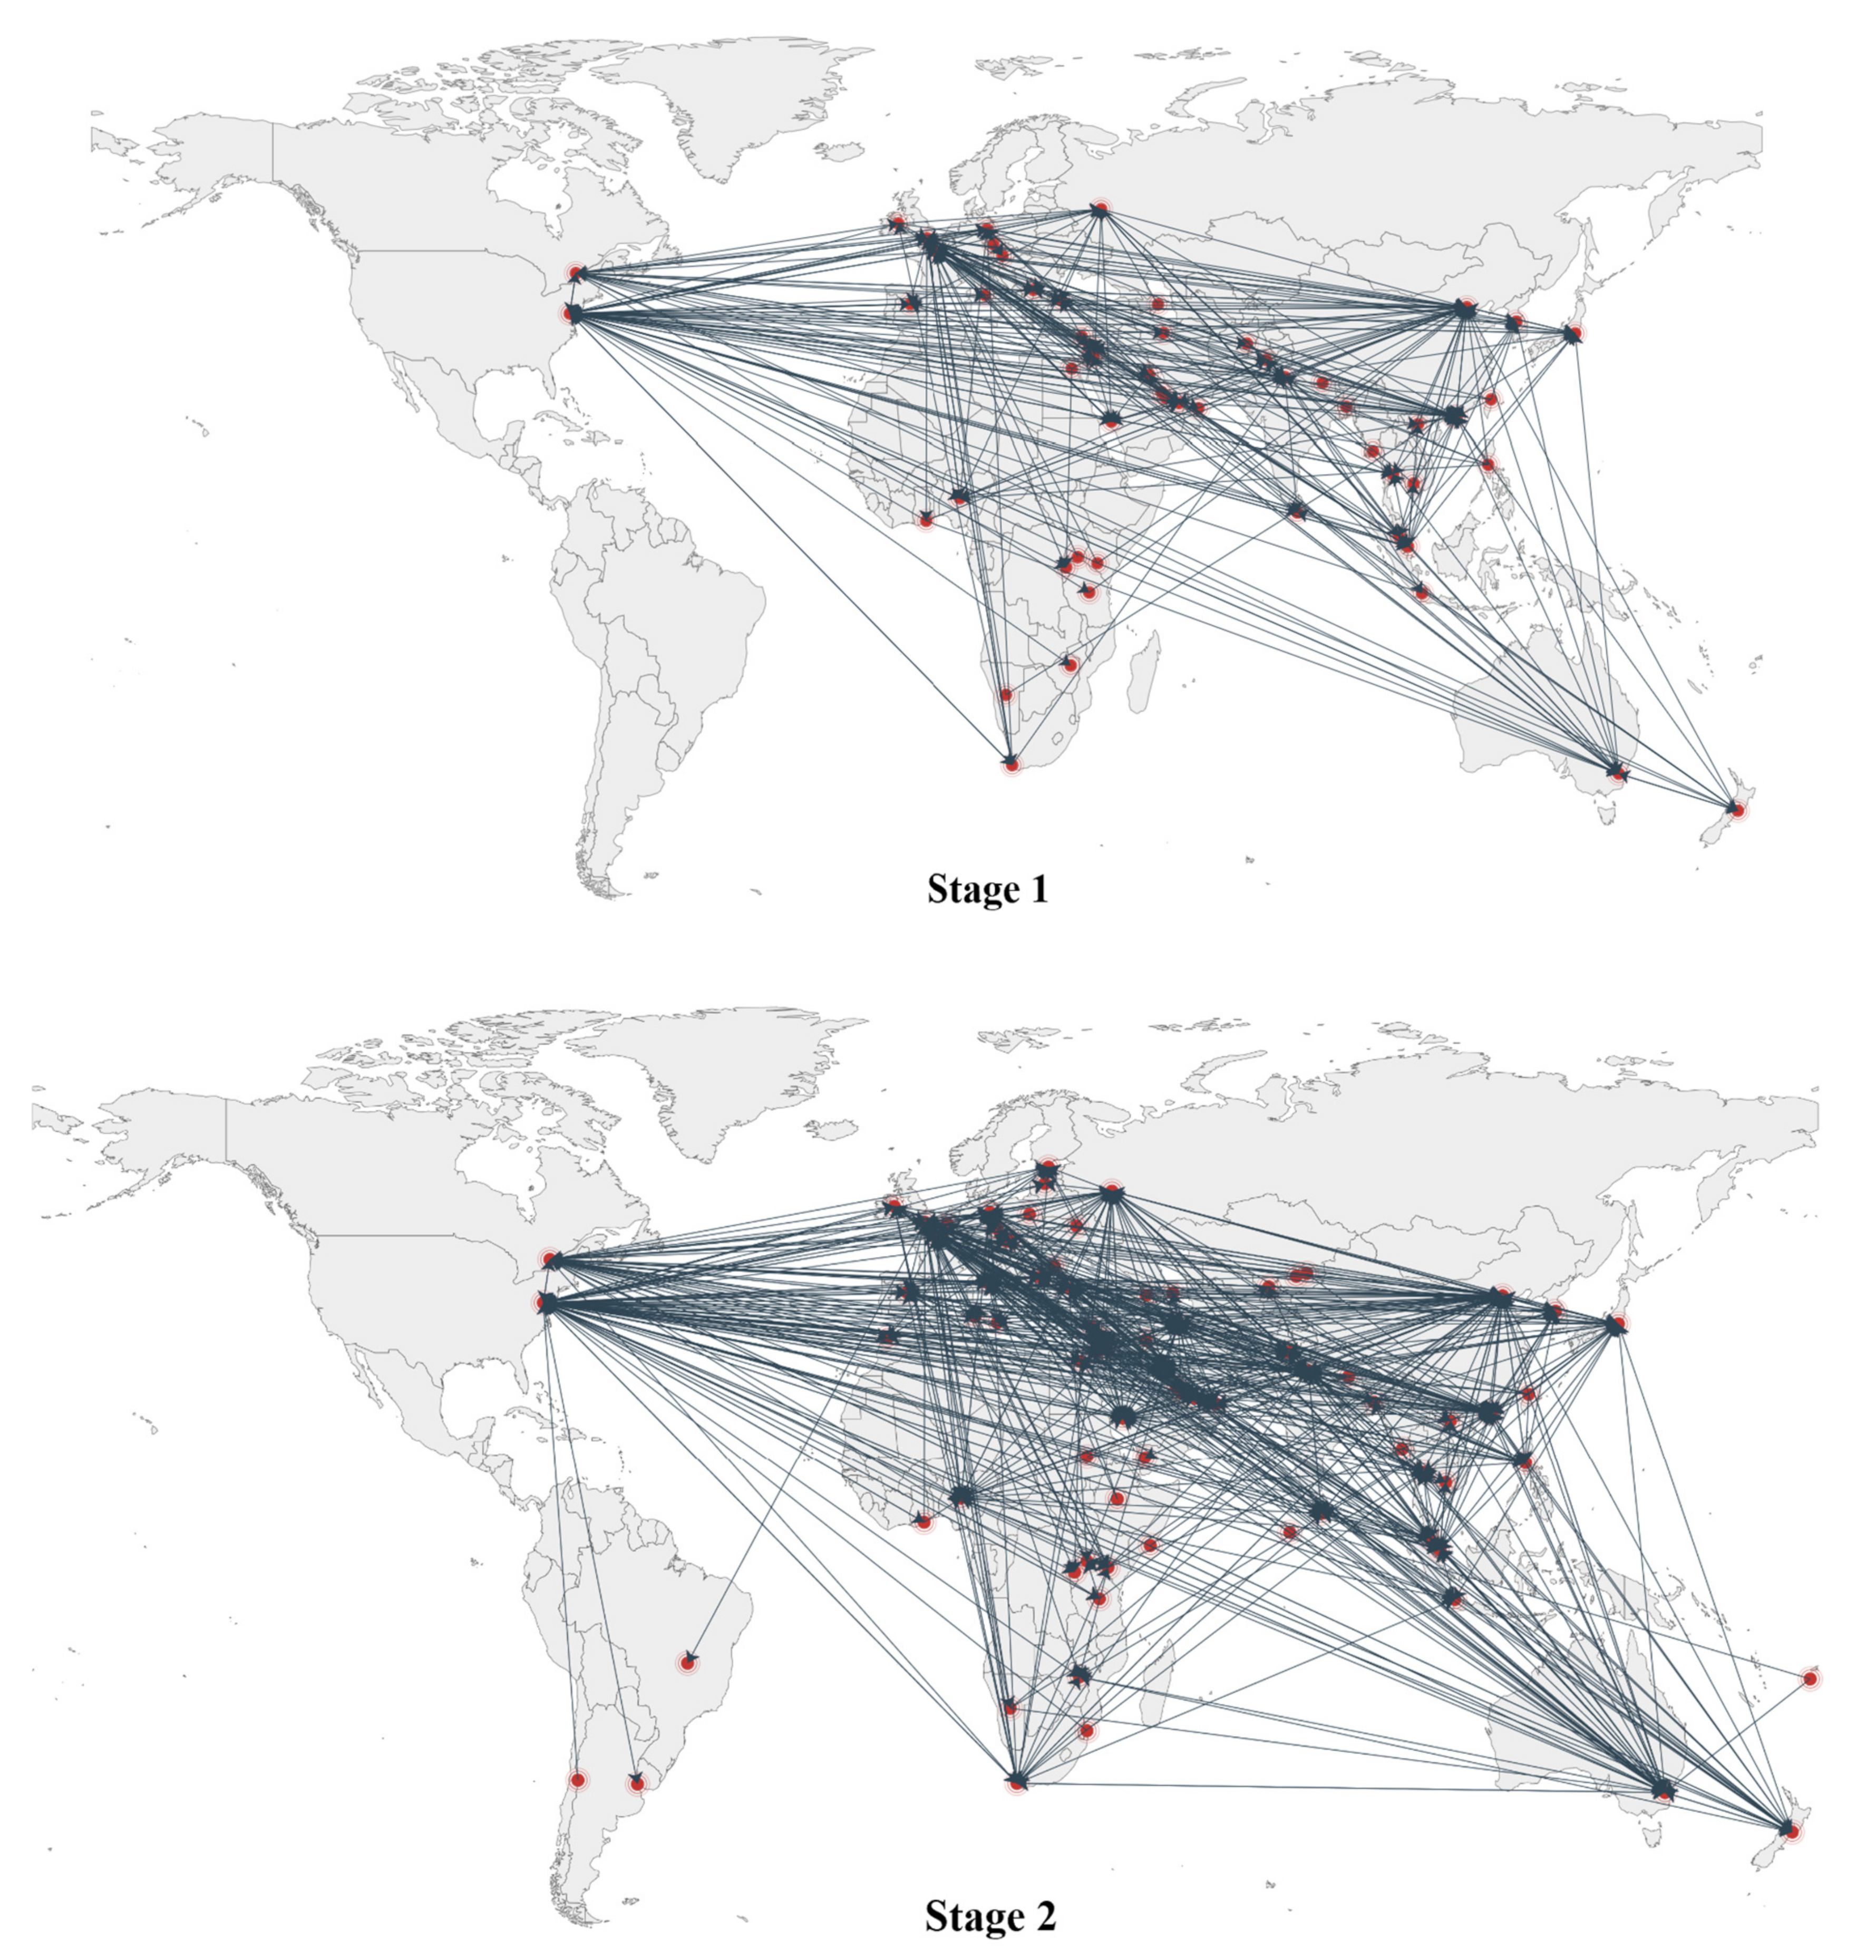
| Stage 1 | 414 | 1211 | 3936 | 0.007 | 3 | 410 |
| Stage 2 | 946 | 4772 | 28,620 | 0.005 | 9 | 927 |
| Network | Number of the Core’s Nodes | Number of the Core’s Edges | The Average Local Clustering Coefficient of the Core |
|---|---|---|---|
| Network-S1 | 43 | 304 | 0.501 |
| Network-S2 | 192 | 2699 | 0.494 |
| Network | Rank | Media | Country/Region | Total Ndegree |
|---|---|---|---|---|
| Network-S1 | 1 | Associated Press | USA | 1.627119 |
| 2 | The Canadian Press | Canada | 1.271186 | |
| 3 | Agence France-Presse | France | 1.000000 | |
| 4 | ContentEngine | USA | 0.978208 | |
| 5 | Xinhua News Agency | Mainland China | 0.796610 | |
| 6 | South China Morning Post | Hong Kong | 0.508475 | |
| 7 | National Post | Canada | 0.469734 | |
| 8 | China Daily | Mainland China | 0.421308 | |
| 9 | Postmedia News | Canada | 0.418886 | |
| 10 | MailOnline | Canada | 0.411622 | |
| Network-S2 | 1 | Associated Press | USA | 5.698413 |
| 2 | The Canadian Press | Canada | 3.680423 | |
| 3 | Agence France-Presse | France | 2.797884 | |
| 4 | ContentEngine | USA | 2.156614 | |
| 5 | The New York Times | USA | 1.452910 | |
| 6 | Xinhua News Agency | Mainland China | 1.400000 | |
| 7 | Impact News Service | United Kingdom | 1.355556 | |
| 8 | National Post | Canada | 1.299471 | |
| 9 | MailOnline | Canada | 1.131217 | |
| 10 | Cable News Network | USA | 1.087831 |
| Network | Rank | Media | Country/Region | PageRank |
|---|---|---|---|---|
| Network-S1 | 1 | Associated Press | USA | 0.016915 |
| 2 | Xinhua News Agency | Mainland China | 0.013245 | |
| 3 | Press Association | United Kingdom | 0.011630 | |
| 4 | Agence France-Presse | France | 0.007972 | |
| 5 | Cable News Network | USA | 0.007893 | |
| 6 | South China Morning Post | Hong Kong | 0.006989 | |
| 7 | The New York Times | USA | 0.006682 | |
| 8 | China Daily | Mainland China | 0.006580 | |
| 9 | The Canadian Press | Canada | 0.006110 | |
| 10 | The Washington Post | USA | 0.005043 | |
| Network-S2 | 1 | Associated Press | USA | 0.013947 |
| 2 | The New York Times | USA | 0.011430 | |
| 3 | Cable News Network | USA | 0.009437 | |
| 4 | Press Association | United Kingdom | 0.008192 | |
| 5 | Xinhua News Agency | Mainland China | 0.004814 | |
| 6 | Agence France-Presse | France | 0.004381 | |
| 7 | The Washington Post | USA | 0.004038 | |
| 8 | South China Morning Post | Hong Kong | 0.003378 | |
| 9 | Australia Broadcasting Corporation | Australia | 0.003355 | |
| 10 | Financial Times | United Kingdom | 0.003268 |
Publisher’s Note: MDPI stays neutral with regard to jurisdictional claims in published maps and institutional affiliations. |
© 2022 by the authors. Licensee MDPI, Basel, Switzerland. This article is an open access article distributed under the terms and conditions of the Creative Commons Attribution (CC BY) license (https://creativecommons.org/licenses/by/4.0/).
Share and Cite
Guo, H.; Zhang, J.; Feng, S.; Chen, B.; Wang, M. Risk Communication in the Alert Phase of the COVID-19 Pandemic: Analysis of News Flow at National and Global Levels. Int. J. Environ. Res. Public Health 2022, 19, 9588. https://doi.org/10.3390/ijerph19159588
Guo H, Zhang J, Feng S, Chen B, Wang M. Risk Communication in the Alert Phase of the COVID-19 Pandemic: Analysis of News Flow at National and Global Levels. International Journal of Environmental Research and Public Health. 2022; 19(15):9588. https://doi.org/10.3390/ijerph19159588
Chicago/Turabian StyleGuo, Hua, Jiandong Zhang, Shihui Feng, Boyin Chen, and Minhong Wang. 2022. "Risk Communication in the Alert Phase of the COVID-19 Pandemic: Analysis of News Flow at National and Global Levels" International Journal of Environmental Research and Public Health 19, no. 15: 9588. https://doi.org/10.3390/ijerph19159588
APA StyleGuo, H., Zhang, J., Feng, S., Chen, B., & Wang, M. (2022). Risk Communication in the Alert Phase of the COVID-19 Pandemic: Analysis of News Flow at National and Global Levels. International Journal of Environmental Research and Public Health, 19(15), 9588. https://doi.org/10.3390/ijerph19159588