
Groundwater Quality Assessment in the Northern Part of Changchun City, Northeast China, Using PIG and Two Improved PIG Methods

Abstract
:1. Introduction
2. Overview of the Study Area
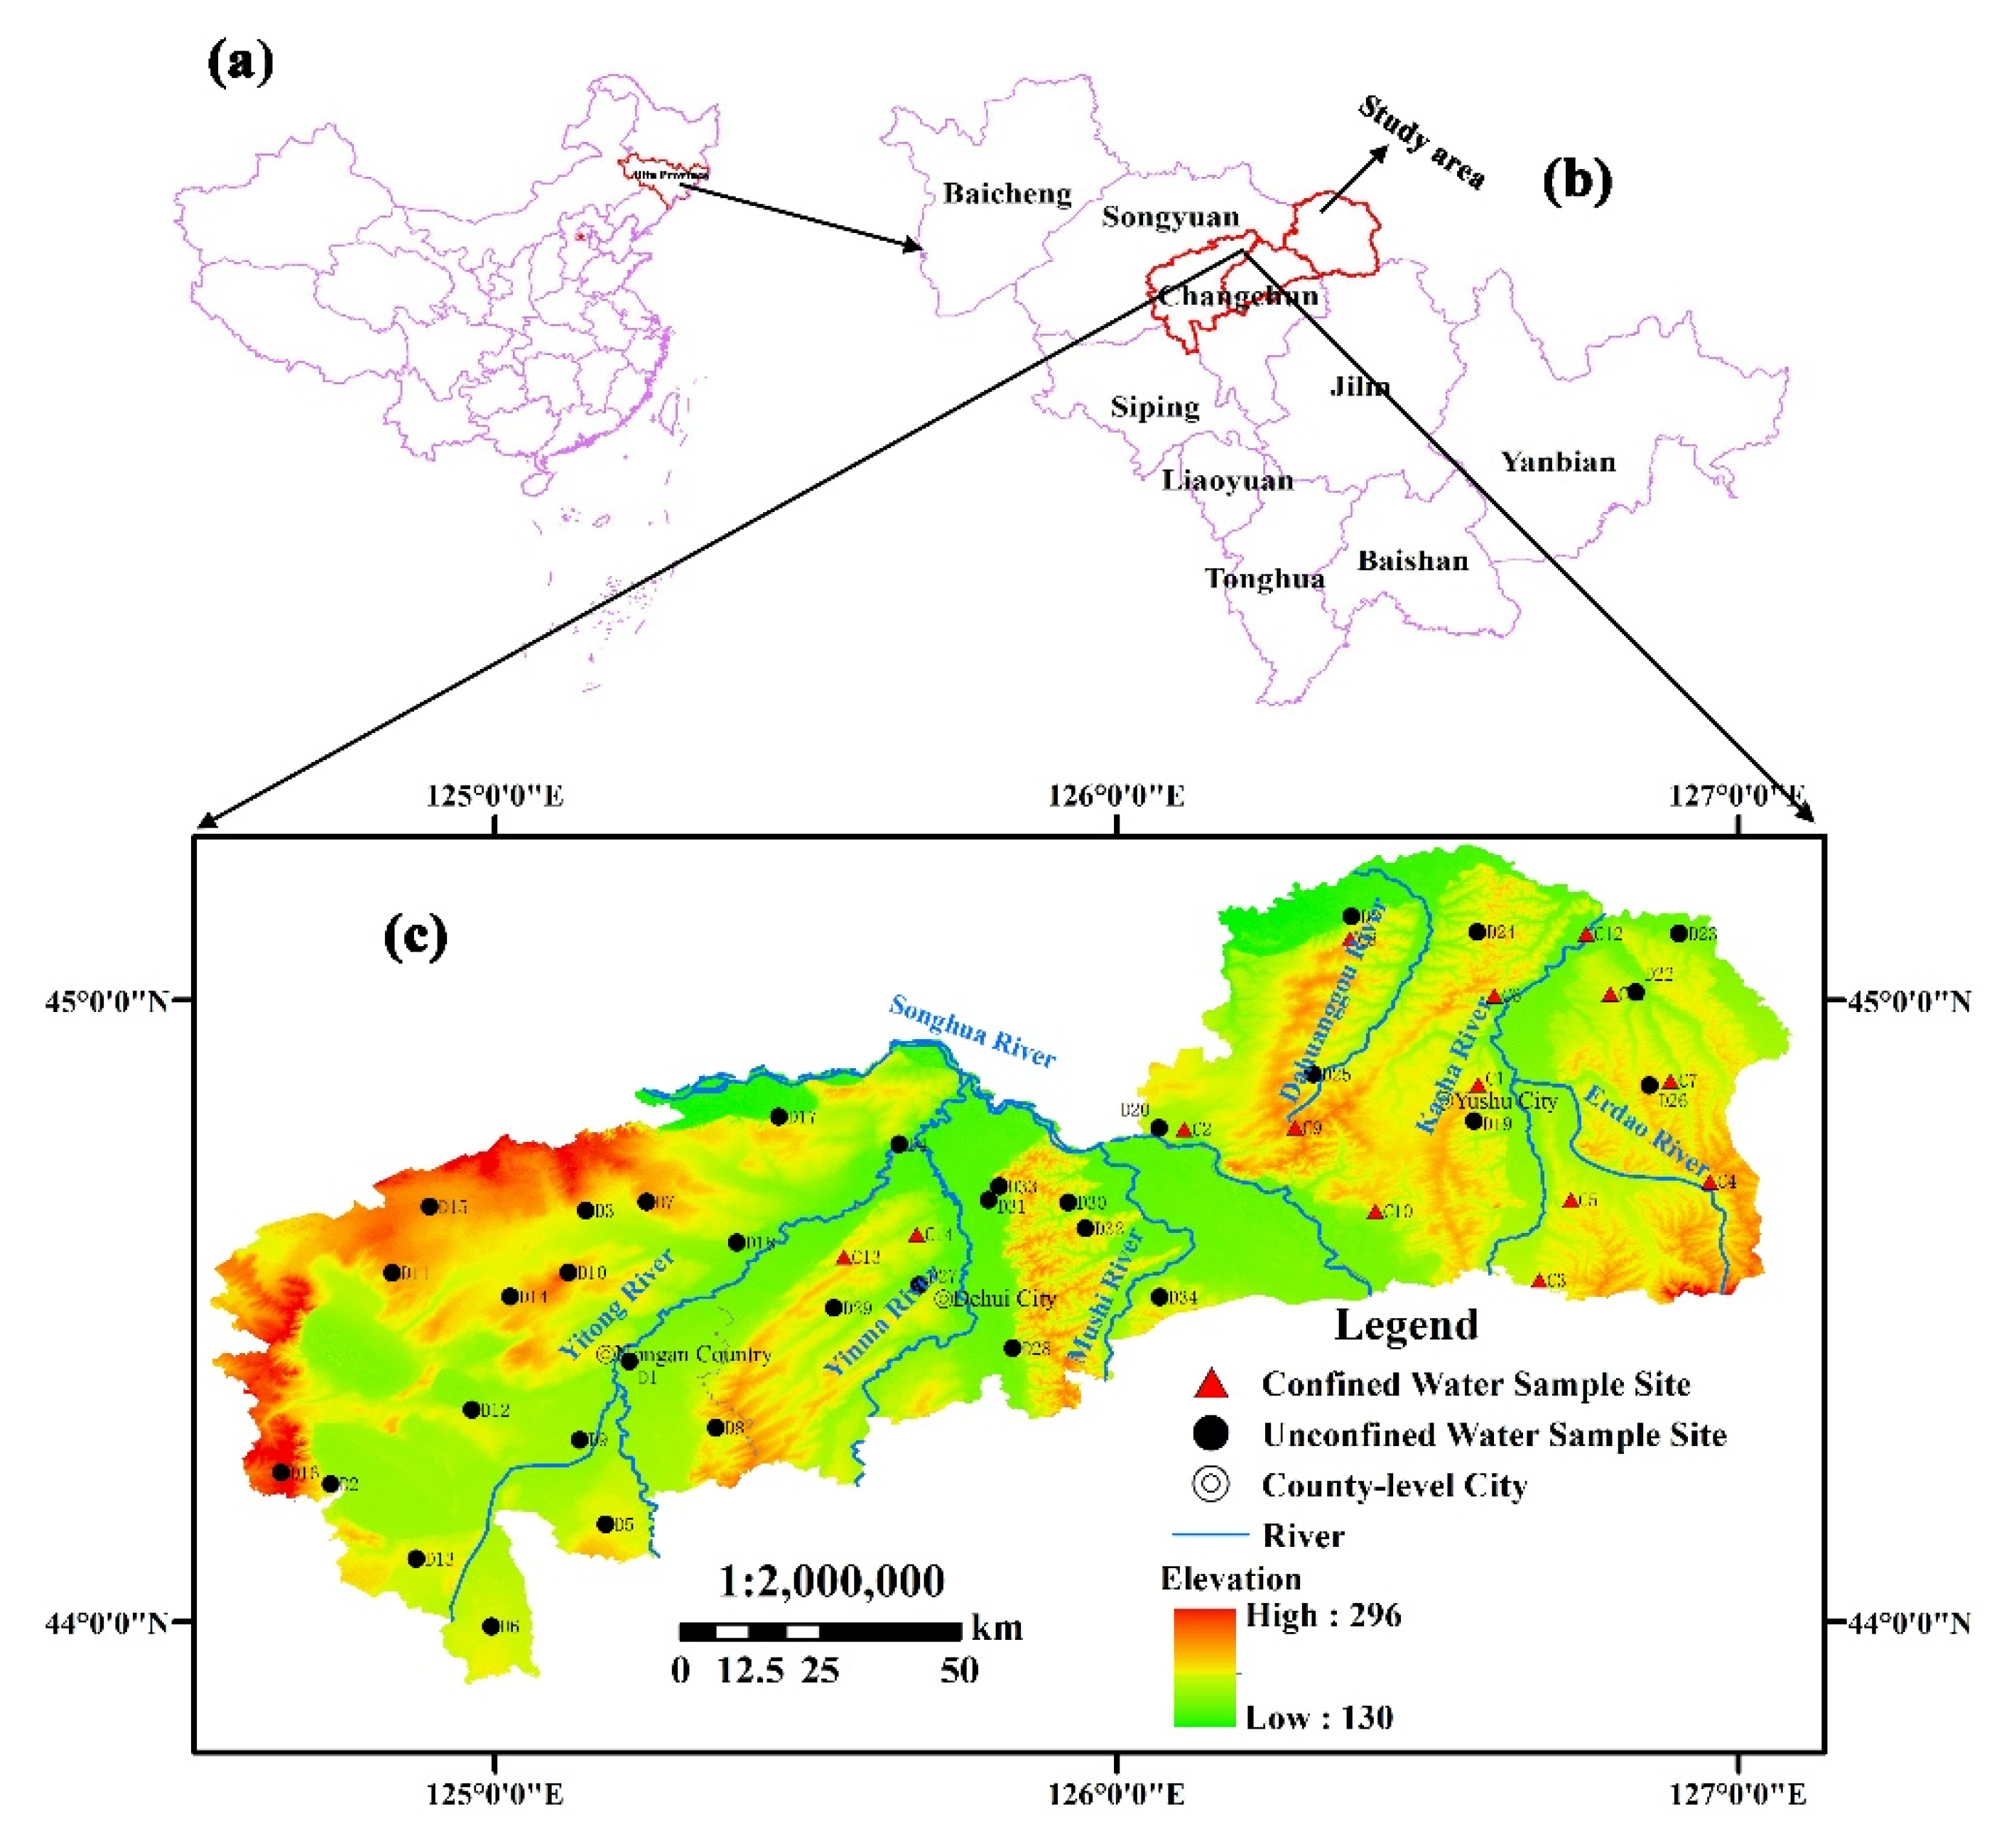
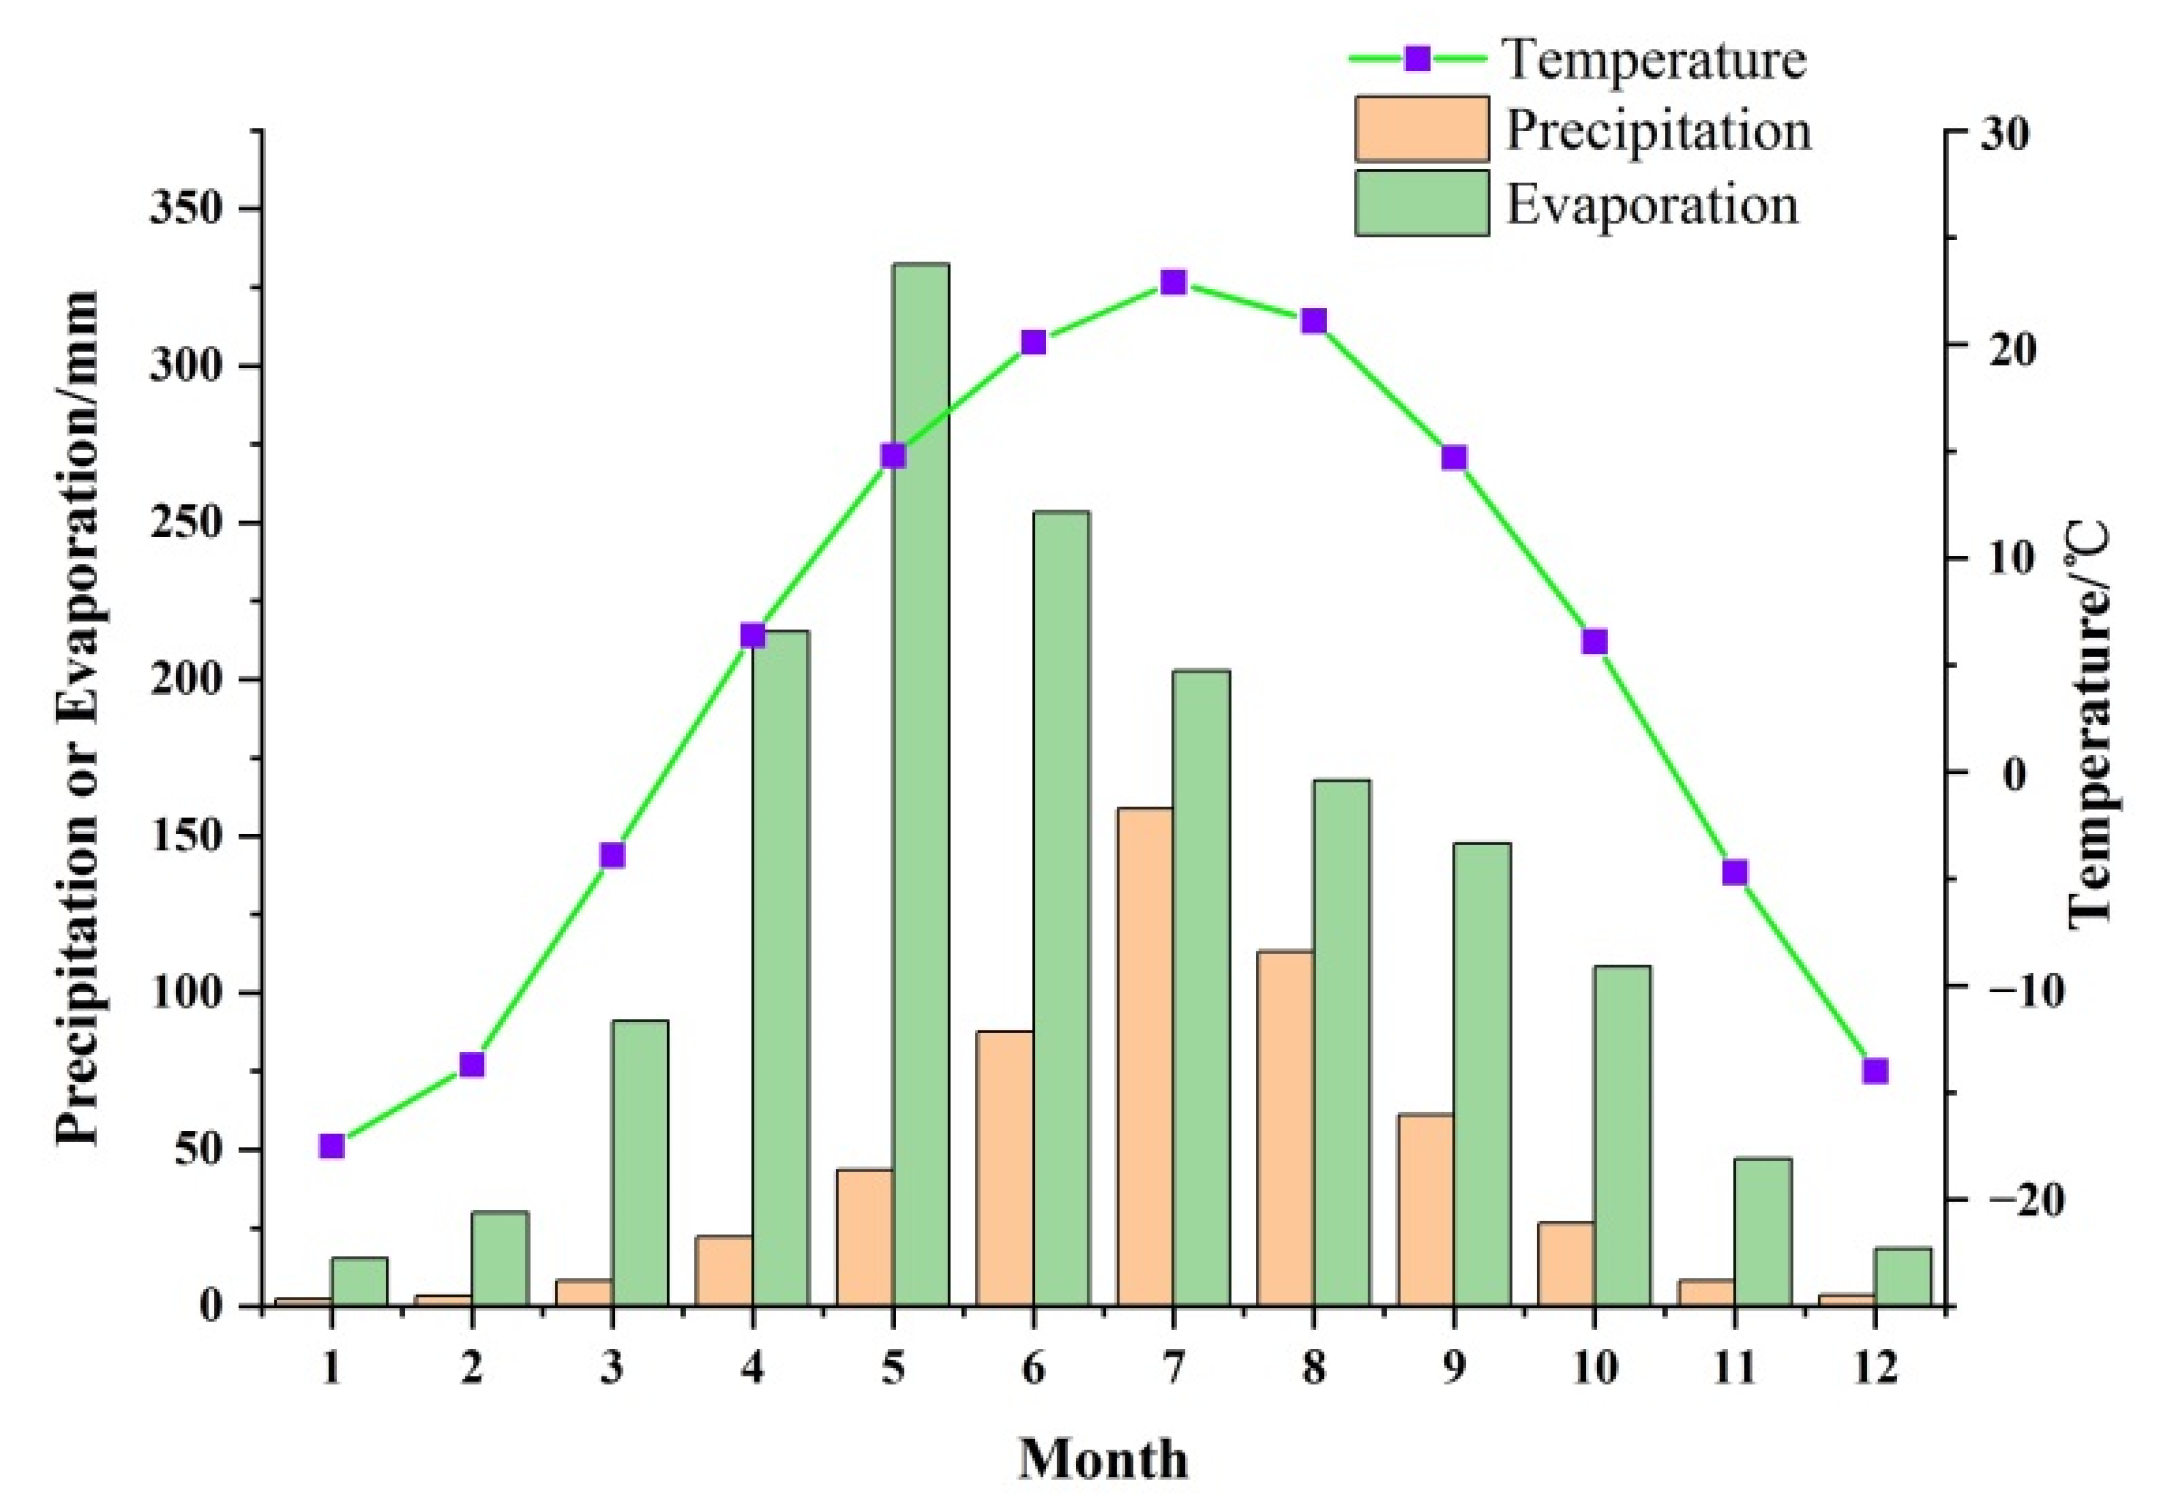
2.1. Study Area
2.2. Geology
2.3. Hydrogeology
3. Materials and Methods
3.1. Materials
3.2. Methods
3.2.1. The Traditional PIG Method
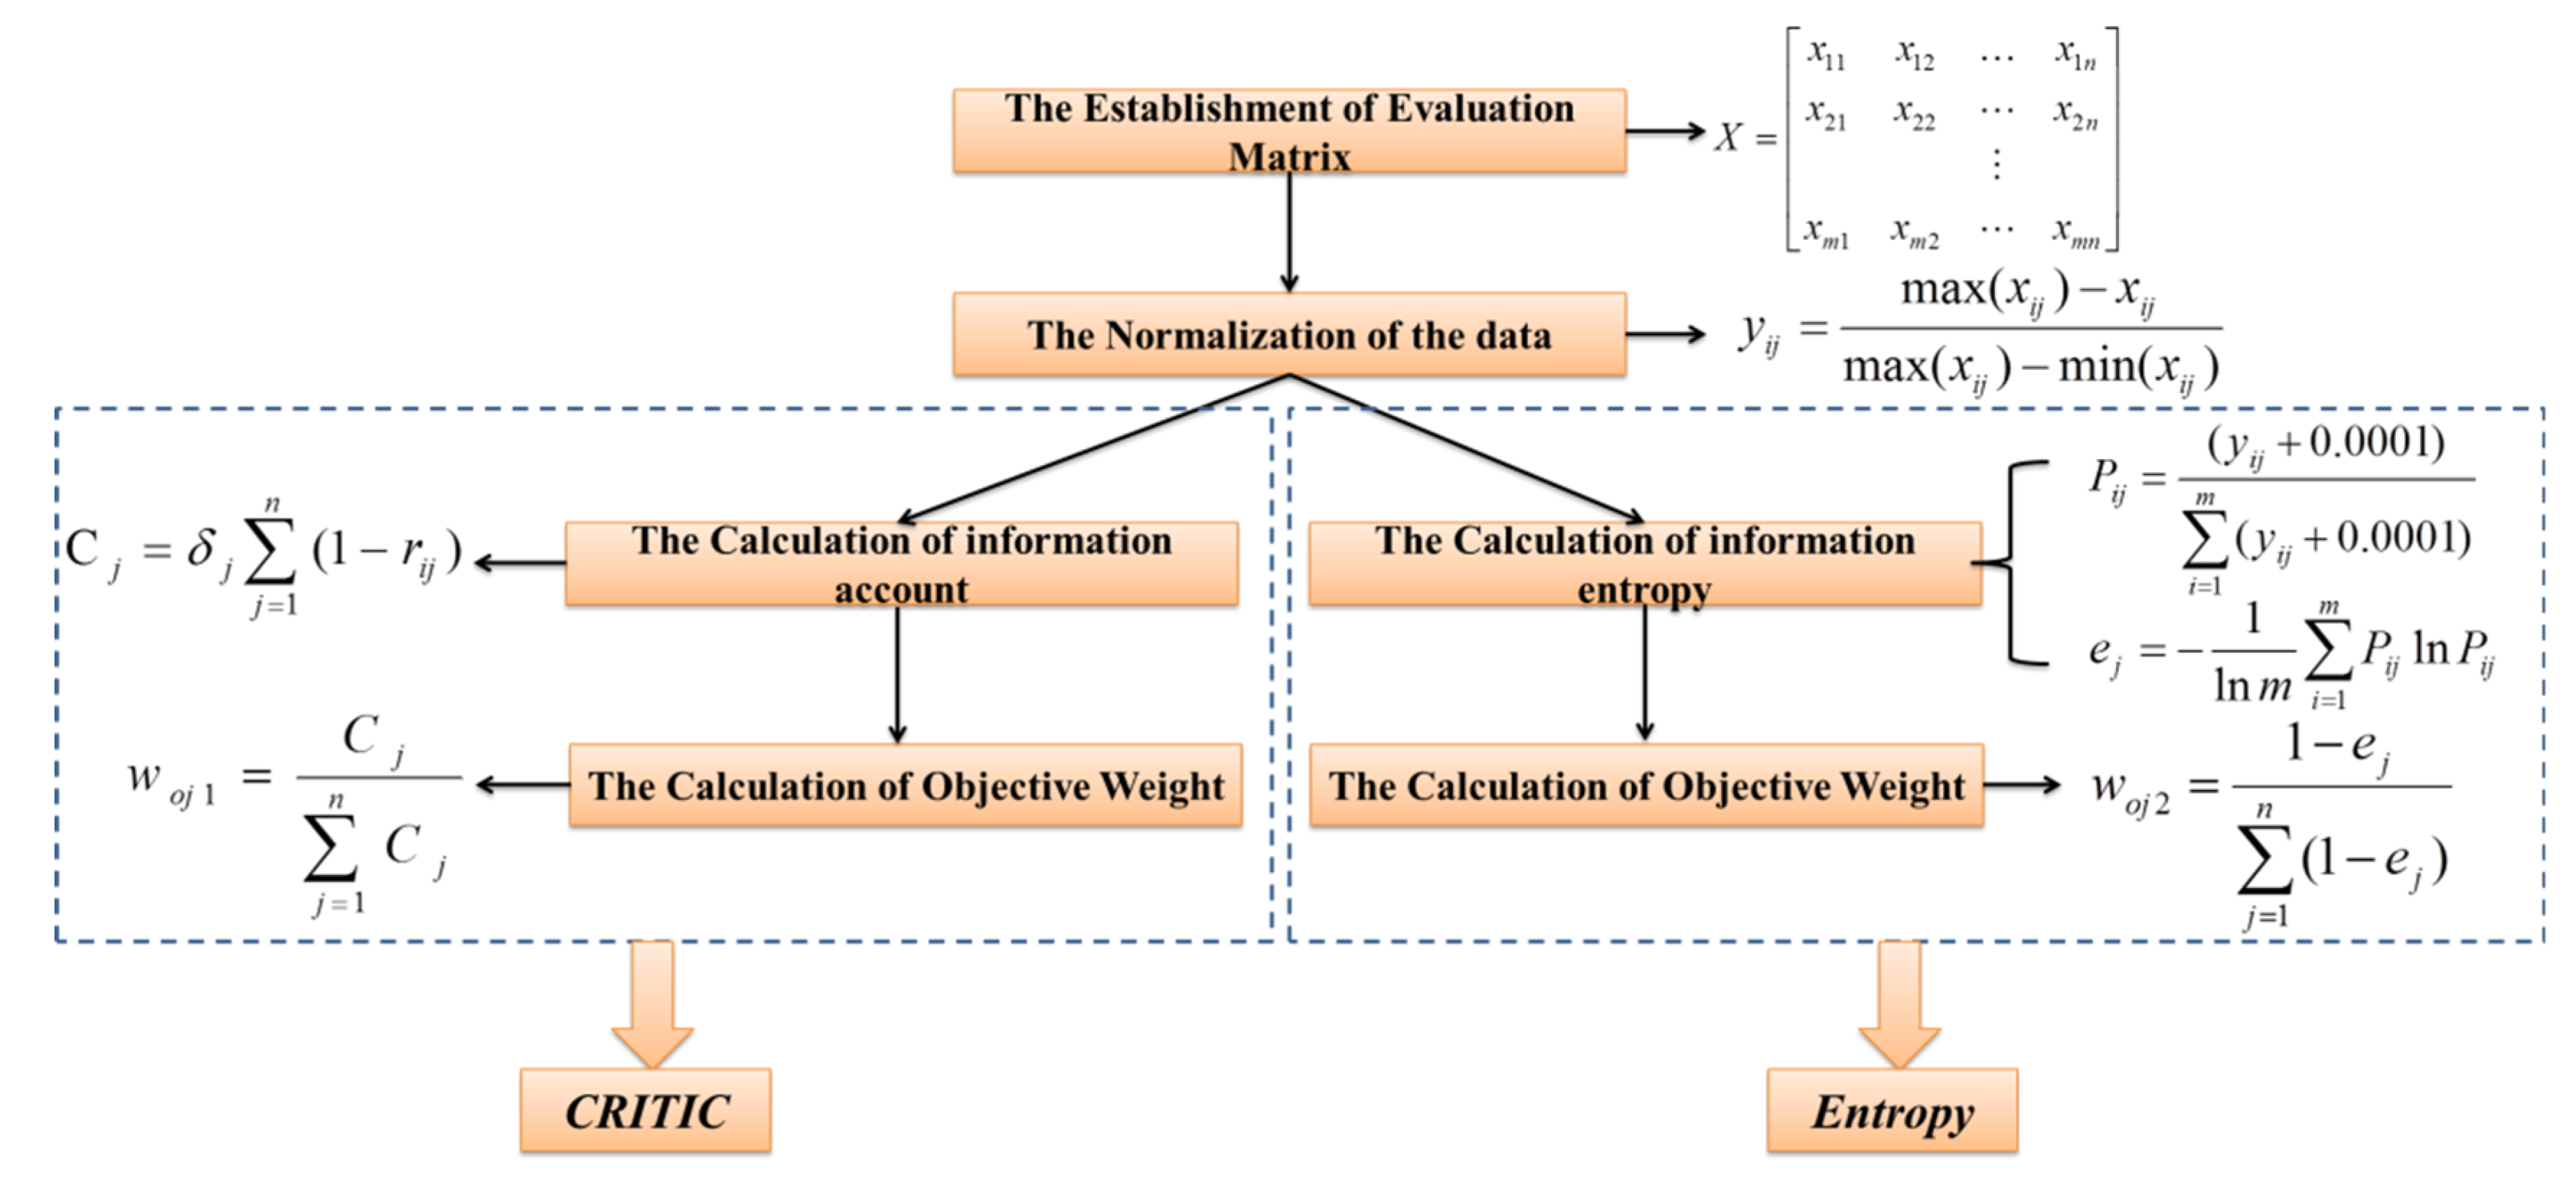
3.2.2. The Improved PIG Methods (the CRITIC-PIG Method and the Entropy-PIG Method)
4. Results and Discussion
4.1. Physicochemical Parameter
4.2. Spatial-Distribution Characteristics of TDS, TH, NO3−-N, Fe3+ and F− in the Study Area
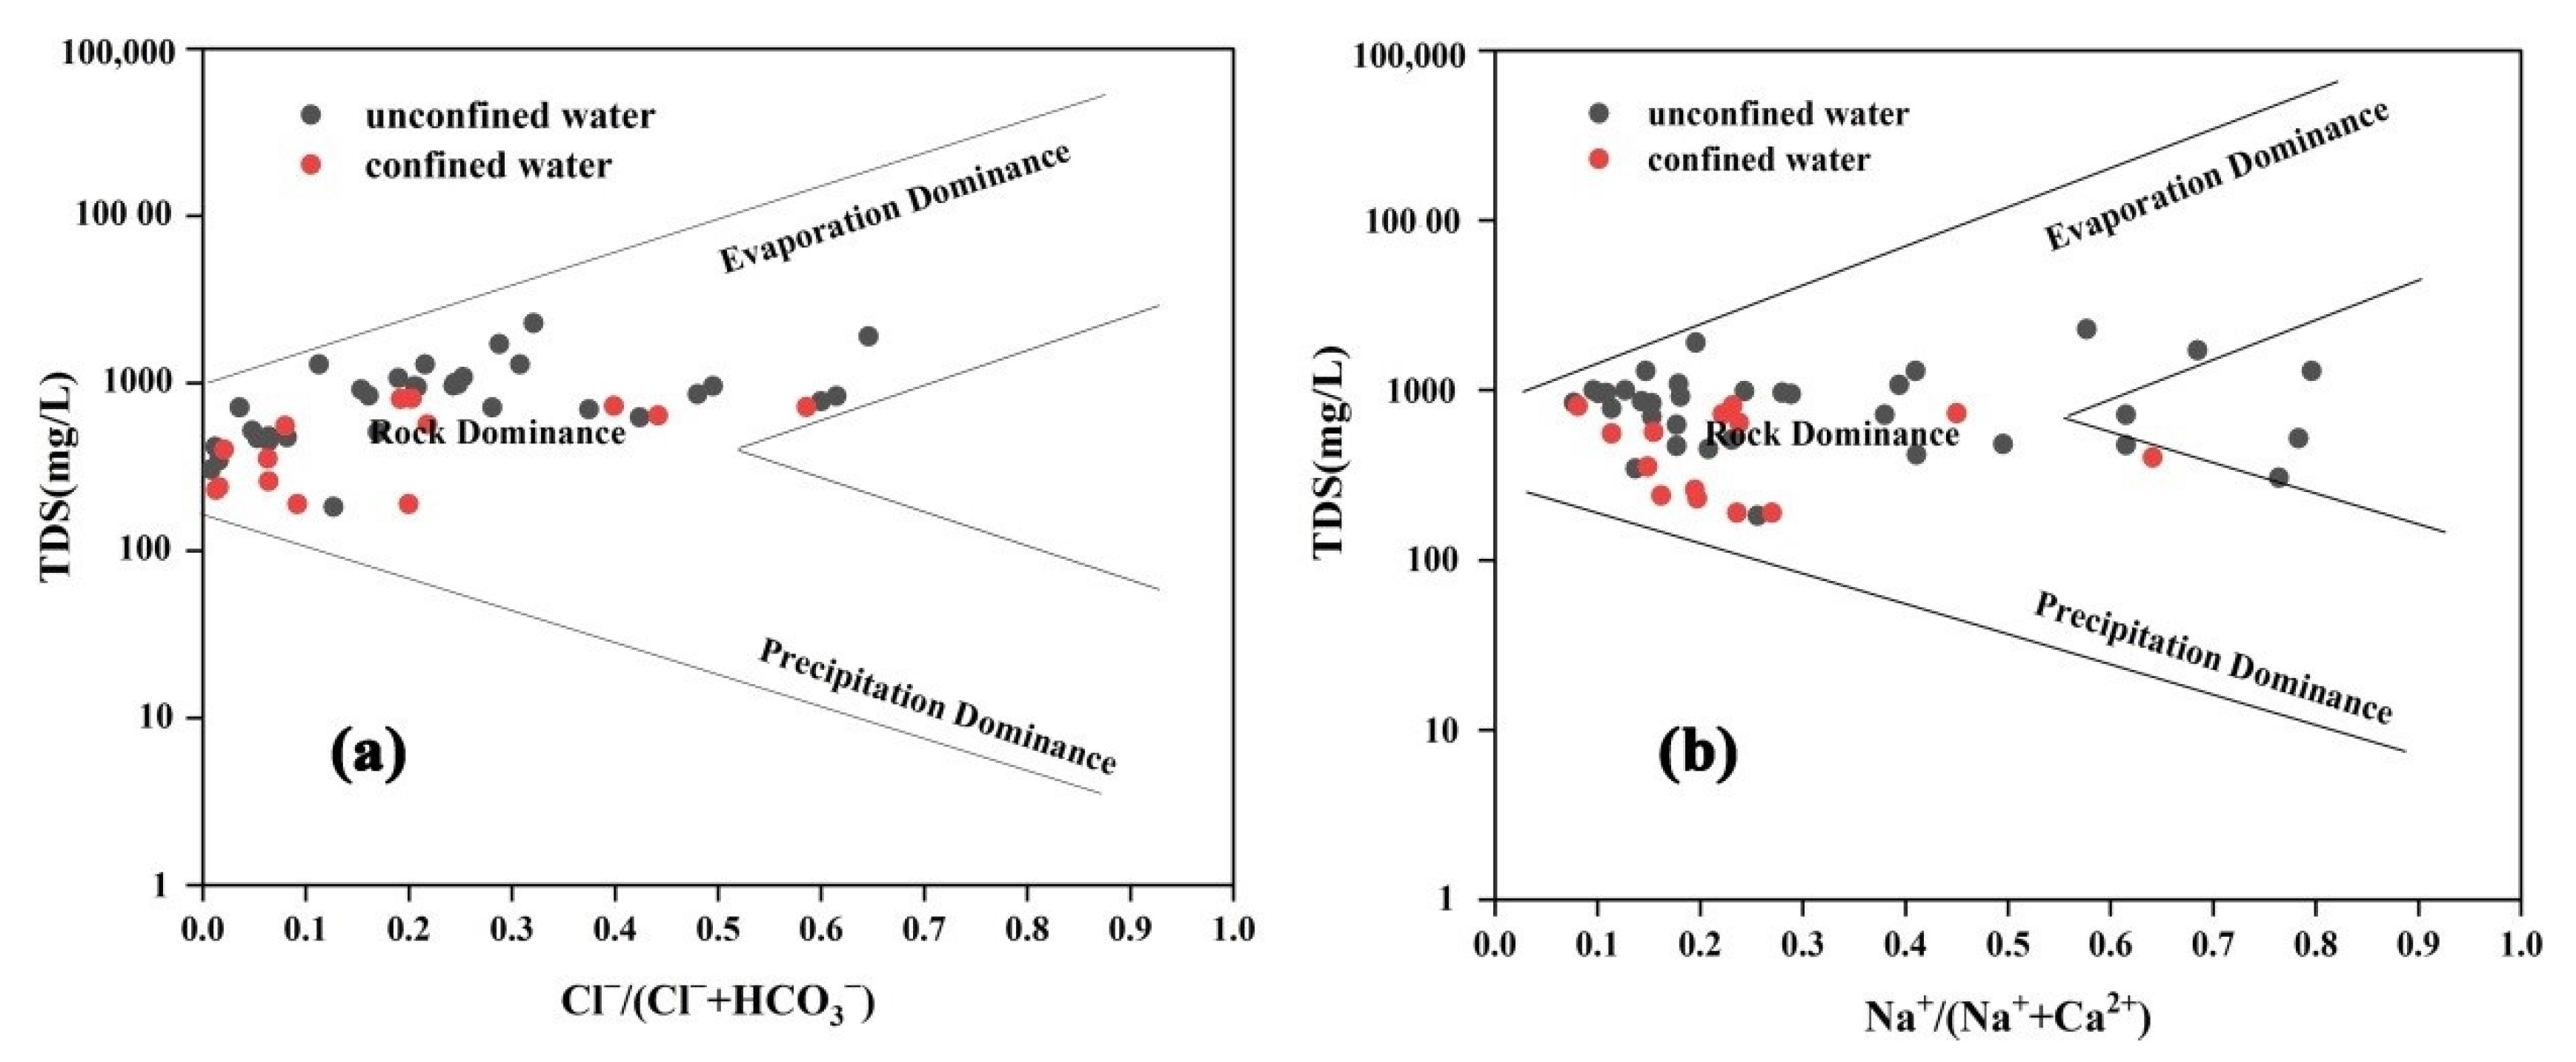
4.3. Graphical Methods
4.4. Results of PIG, CRITIC-PIG and Entropy-PIG
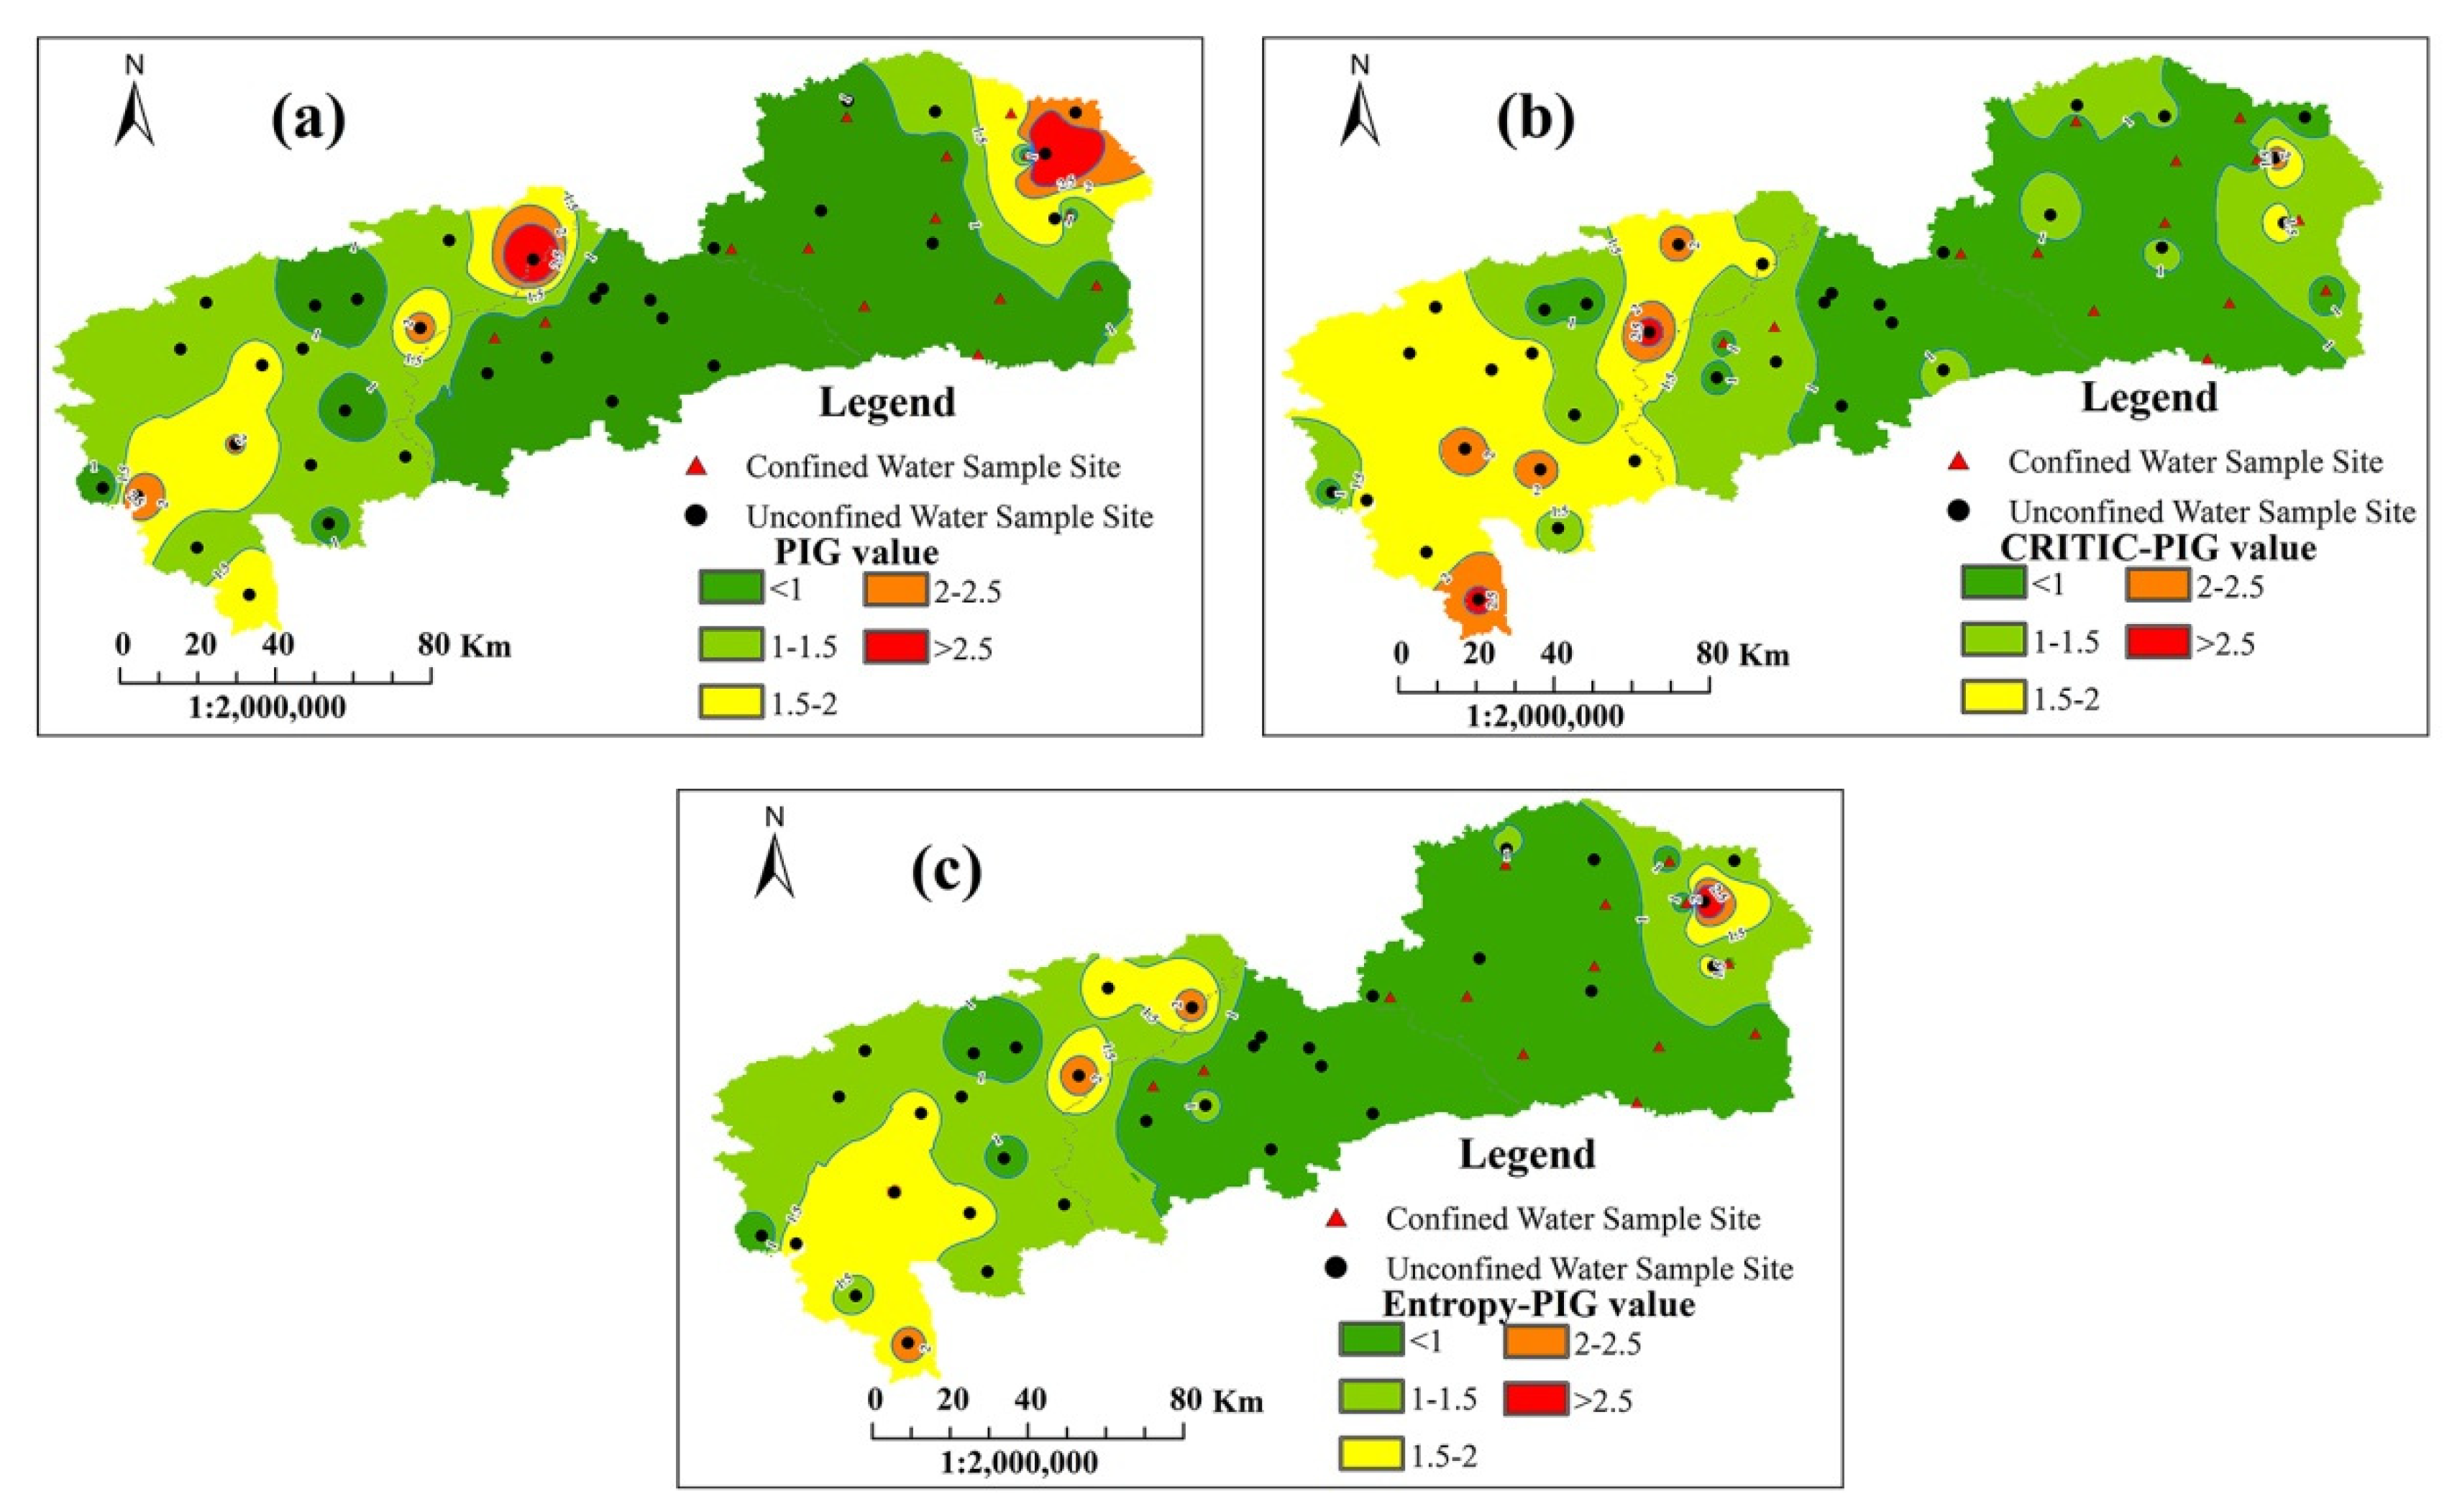
4.5. Distribution Map of Three PIG Values
4.6. Sources of Pollution
5. Conclusions
- (1)
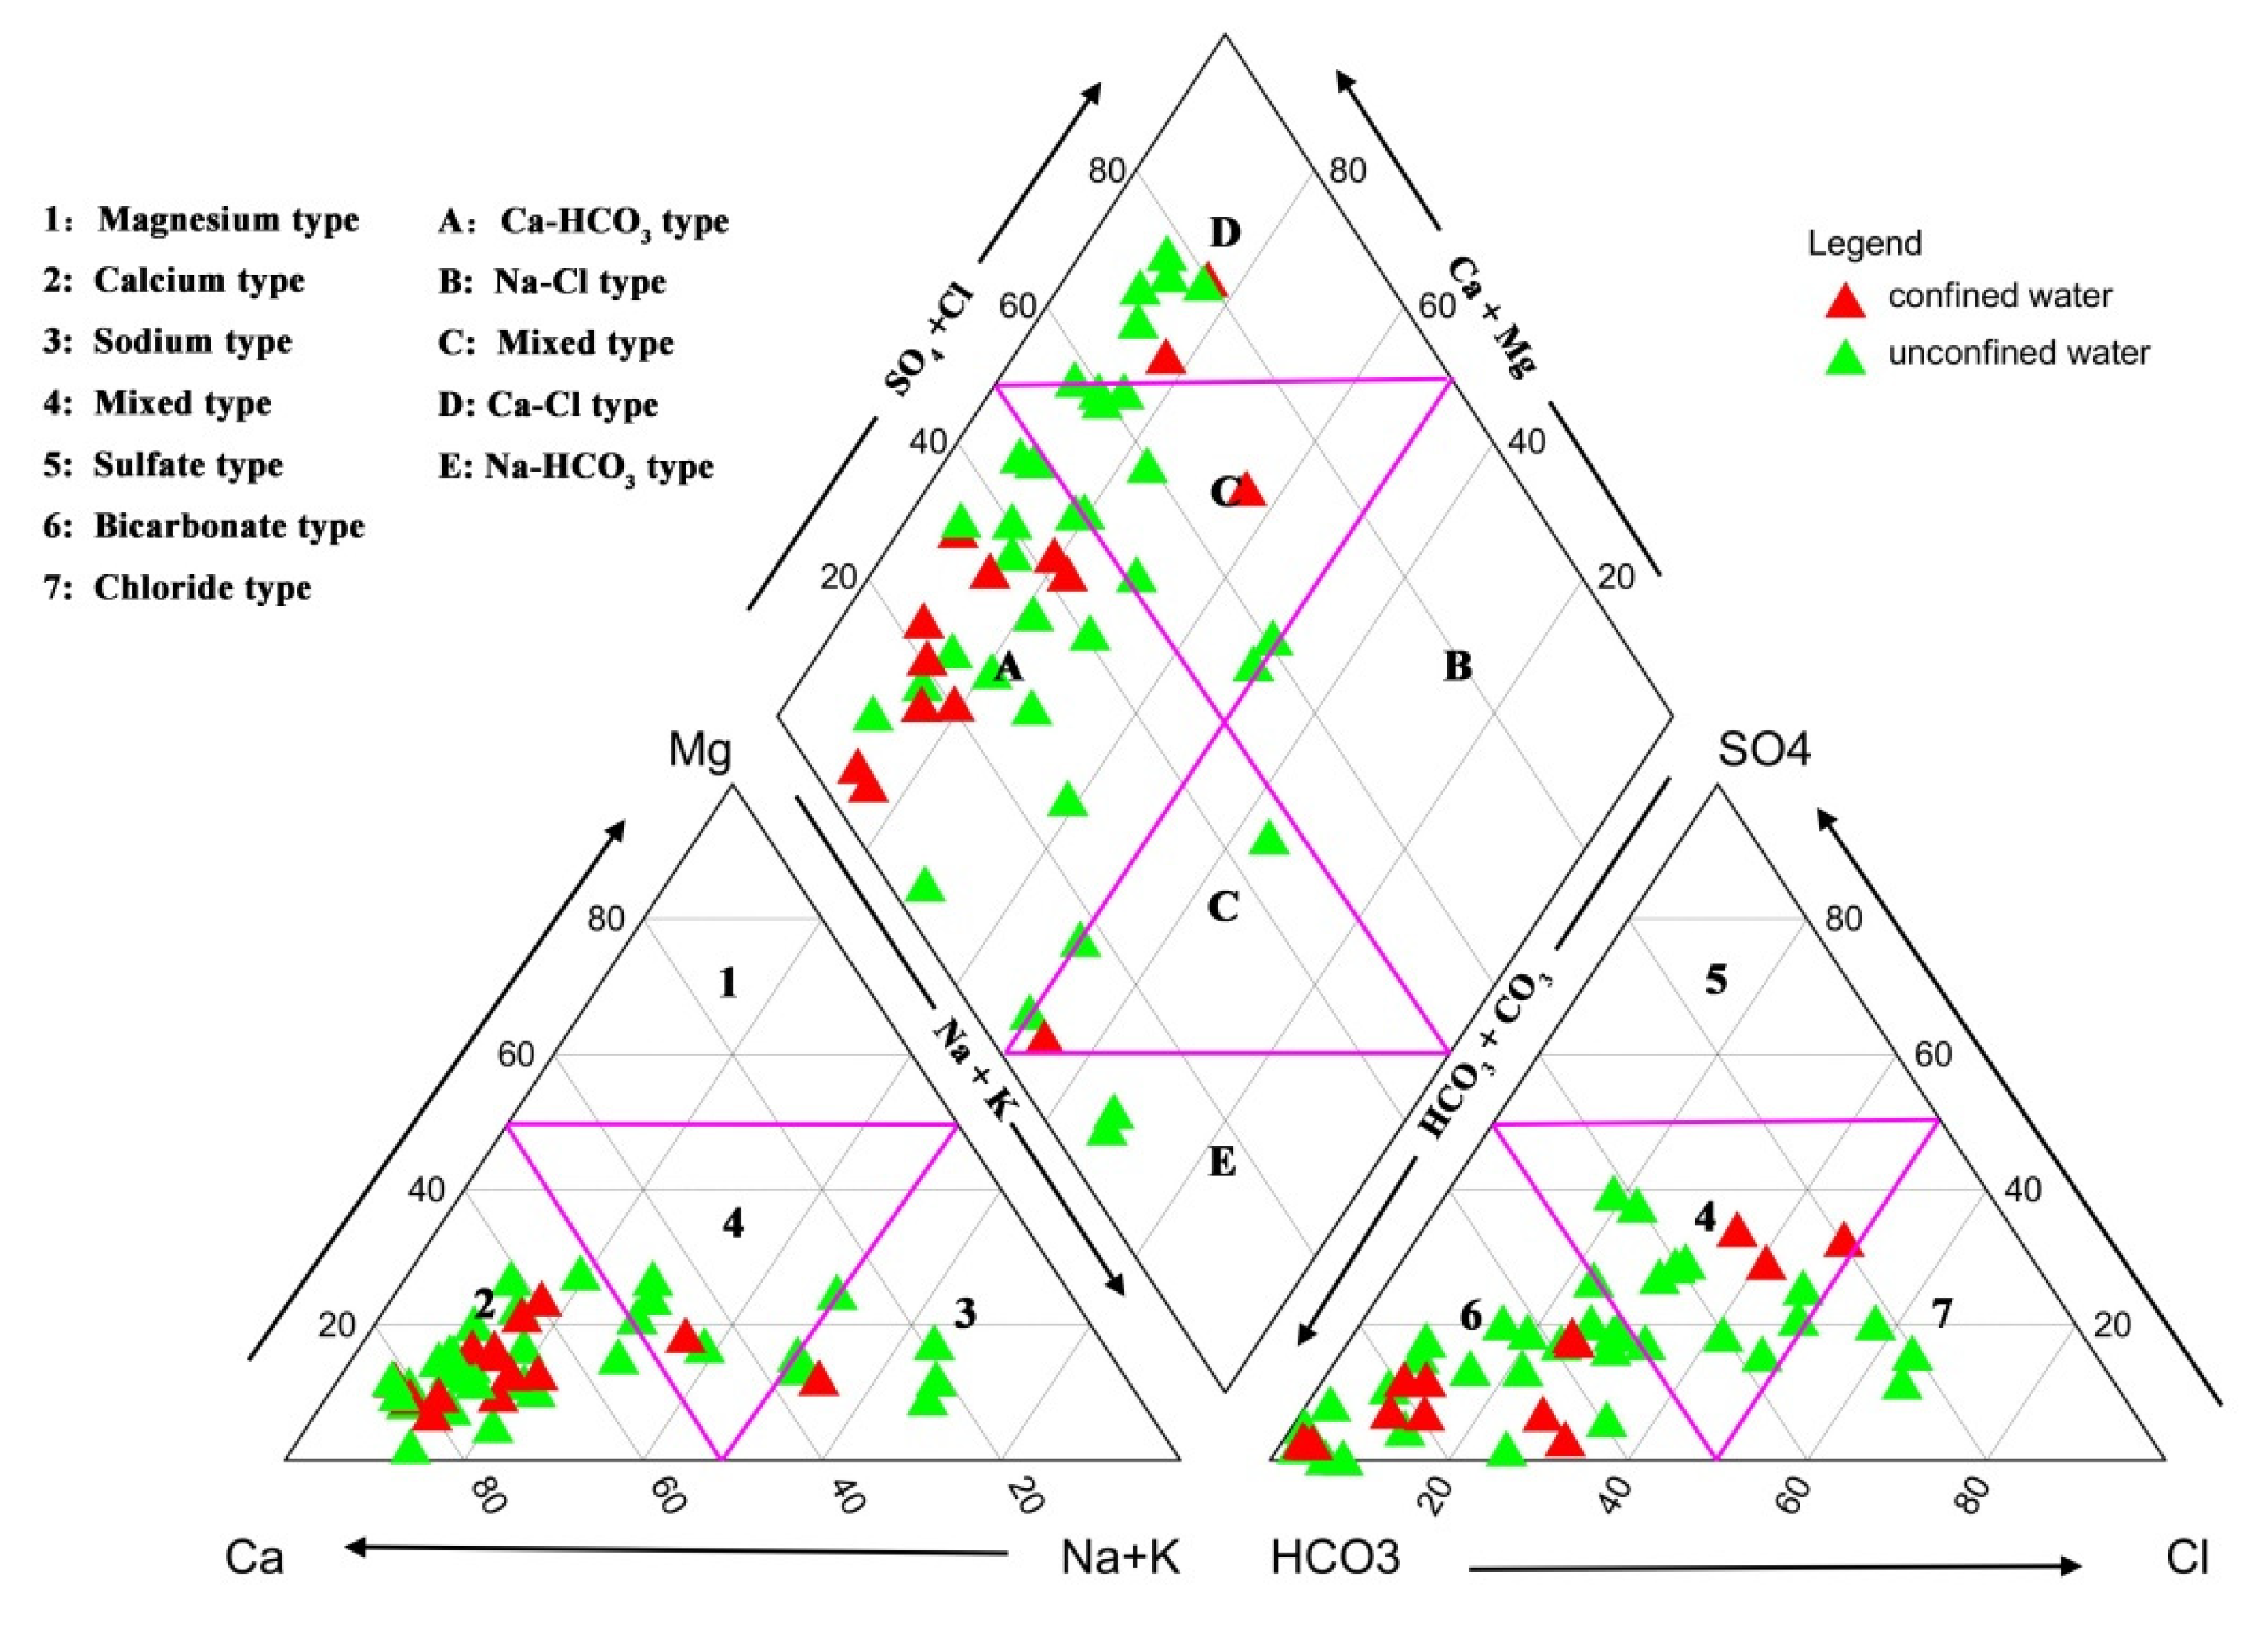
- Showing to be weakly alkaline, groundwater in the study area abounded in the HCO3-Ca type. According to the Gibbs diagrams, the chemical composition of groundwater was dominated by water–rock interaction, with a small fraction of water samples being controlled by evaporation processes.
- (2)
- The values of the PIG, CRITIC-PIG and Entropy-PIG ranged from 0.204 to 7.114, from 0.294 to 2.795 and from 0.229 to 3.985, respectively, and classified 60.4%, 47.9% and 60.4% of the water samples into insignificant pollution; 18.8%, 20.8% and 18.8% of the water samples into low pollution; 8.3%, 18.8% and 10.4% of the water samples into moderate pollution; 6.25%, 6.25% and 8.3% of the water samples into high pollution; and 6.25%, 6.25% and 2.1% of the water samples into very high pollution. In total, 52% of the water samples had the same evaluation results based on the three methods, and the same evaluation results occurred in the percentages of 56.3%, 79.2% and 62.5% between PIG and each of the two methods, and between CRITIC-PIG and Entropy-PIG, respectively. The level difference among the samples having different results using the three models was mostly one, which indicated that the results were relatively convincing.
- (3)
- Pollution came not only from geogenic sources (weathering and dissolution of rocks and minerals, evaporation) but also anthropogenic sources (agricultural activities, industrial activities and domestic waste) based on the Ow (overall water quality) index.
- (4)
- The distribution map of the three PIG values demonstrated that groundwater in Dehui City was the most suitable for drinking, with the dominance of insignificantly and lowly contaminated regions. Yushu City showed a progressive increase in the pollution level from the southwestern part to the northeast by and large, and the high-pollution areas were mainly affected by the high concentrations of Fe3+ in the northeast. Occupying a large area of lowly and moderately polluted regions, groundwater quality in Nongan County was worse than that in the other two cities. High levels of TDS, TH, NO3− and F− contributed to highly and very highly polluted groundwater in the northeastern and southern parts.
- (5)
- The results of the present research study provided an overall groundwater pollution status for drinking purposes in the north of Changchun City, which could be useful for the relevant authorities to take some protective and remedial measures for the guarantee of high-quality drinking groundwater for the people. However, due to the lack of sufficient water samples, a further groundwater quality investigation needs to be carried out in the study area, especially in those places whose PIG, CRITIC-PIG or Entropy-PIG values were over 1, aiming to obtain more accurate results.
Author Contributions
Funding
Institutional Review Board Statement
Informed Consent Statement
Data Availability Statement
Acknowledgments
Conflicts of Interest
References
- Bi, P.; Pei, L.; Huang, G.; Han, D.; Song, J. Identification of Groundwater Contamination in a Rapidly Urbanized Area on a Regional Scale: A New Approach of Multi-Hydrochemical Evidences. Int. J. Environ. Res. Public Health 2021, 18, 12143. [Google Scholar] [CrossRef] [PubMed]
- Li, J.; Michael, H.A.; Duke, J.M.; Messer, K.D.; Suter, J.F. Behavioral response to contamination risk information in a spatially explicit groundwater environment: Experimental evidence. Water Resour. Res. 2014, 50, 6390–6405. [Google Scholar] [CrossRef]
- Sebilo, M.; Mayer, B.; Nicolardot, B.; Pinay, G.; Mariotti, A. Long-term fate of nitrate fertilizer in agricultural soils. Proc. Natl. Acad. Sci. USA 2013, 110, 18185–18189. [Google Scholar] [CrossRef] [PubMed] [Green Version]
- Shaji, E.; Santosh, M.; Sarath, K.V.; Prakash, P.; Deepchand, V.; Divya, B.V. Arsenic contamination of groundwater: A global synopsis with focus on the Indian Peninsula. Geosci. Front. 2021, 12, 101079. [Google Scholar] [CrossRef]
- Shukla, S.; Saxena, A.; Khan, R.; Li, P.Y. Spatial analysis of groundwater quality and human health risk assessment in parts of Raebareli district, India. Environ. Earth Sci. 2021, 80, 800. [Google Scholar] [CrossRef]
- Jia, Y.; Xi, B.; Jiang, Y.; Guo, H.; Yang, Y.; Lian, X.; Han, S. Distribution, formation and human-induced evolution of geogenic contaminated groundwater in China: A review. Sci. Total Environ. 2018, 643, 967–993. [Google Scholar] [CrossRef] [PubMed]
- He, X.; Li, P.; Ji, Y.; Wang, Y.; Su, Z.; Vetrimurugan, E. Groundwater Arsenic and Fluoride and Associated Arsenicosis and Fluorosis in China: Occurrence, Distribution and Management. Expo. Health 2020, 12, 355–368. [Google Scholar] [CrossRef]
- Adimalla, N. Groundwater Quality for Drinking and Irrigation Purposes and Potential Health Risks Assessment: A Case Study from Semi-Arid Region of South India. Expo. Health 2019, 11, 109–123. [Google Scholar] [CrossRef]
- Adimalla, N.; Li, P.; Qian, H. Evaluation of groundwater contamination for fluoride and nitrate in semi-arid region of Nirmal Province, South India: A special emphasis on human health risk assessment (HHRA). Hum. Ecol. Risk Assess. 2019, 25, 1107–1124. [Google Scholar] [CrossRef]
- Li, P.; Li, X.; Meng, X.; Li, M.; Zhang, Y. Appraising Groundwater Quality and Health Risks from Contamination in a Semiarid Region of Northwest China. Expo. Health 2016, 8, 361–379. [Google Scholar] [CrossRef]
- Rodriguez-Lado, L.; Sun, G.; Berg, M.; Zhang, Q.; Xue, H.; Zheng, Q.; Johnson, C.A. Groundwater Arsenic Contamination Throughout China. Science 2013, 341, 866–868. [Google Scholar] [CrossRef] [PubMed]
- Wu, J.; Sun, Z. Evaluation of Shallow Groundwater Contamination and Associated Human Health Risk in an Alluvial Plain Impacted by Agricultural and Industrial Activities, Mid-West China. Expo. Health 2016, 8, 311–329. [Google Scholar] [CrossRef]
- Zhao, W.; Xiao, C.; Chai, Y.; Feng, X.; Liang, X.; Fang, Z. Application of a New Improved Weighting Method, ESO Method Combined with Fuzzy Synthetic Method, in Water Quality Evaluation of Chagan Lake. Water 2021, 13, 1424. [Google Scholar] [CrossRef]
- Gao, Y.; Qian, H.; Ren, W.; Wang, H.; Liu, F.; Yang, F. Hydrogeochemical characterization and quality assessment of groundwater based on integrated-weight water quality index in a concentrated urban area. J. Clean. Prod. 2020, 260, 121006. [Google Scholar] [CrossRef]
- Rao, N.S. PIG: A numerical index for dissemination of groundwater contamination zones. Hydrol. Process. 2012, 26, 3344–3350. [Google Scholar]
- Adimalla, N.; Qian, H.; Nandan, M.J. Groundwater chemistry integrating the pollution index of groundwater and evaluation of potential human health risk: A case study from hard rock terrain of south India. Ecotoxicol. Environ. Saf. 2020, 206, 111217. [Google Scholar] [CrossRef] [PubMed]
- El-Kholy, R.A.; Zaghlool, E.; Isawi, H.; Soliman, E.A.; Khalil, M.M.H.; El-Aassar, A.-H.M.; Said, M.M. Groundwater quality assessment using water quality index and multivariate statistical analysis case study: East Matrouh, Northwestern coast, Egypt. Environ. Sci. Pollut. Res. 2022. [Google Scholar] [CrossRef]
- Kadam, A.; Wagh, V.; Jacobs, J.; Patil, S.; Pawar, N.; Umrikar, B.; Sankhua, R.; Kumar, S. Integrated approach for the evaluation of groundwater quality through hydro geochemistry and human health risk from Shivganga river basin, Pune, Maharashtra, India. Environ. Sci. Pollut. Res. 2022, 29, 4311–4333. [Google Scholar] [CrossRef] [PubMed]
- Marghade, D.; Malpe, D.B.; Rao, N.S.; Sunitha, B. Geochemical assessment of fluoride enriched groundwater and health implications from a part of Yavtmal District, India. Hum. Ecol. Risk Assess. 2020, 26, 673–694. [Google Scholar] [CrossRef]
- Nourani, V.; Ghaneei, P.; Kantoush, S.A. Robust clustering for assessing the spatiotemporal variability of groundwater quantity and quality. J. Hydrol. 2022, 604, 127272. [Google Scholar] [CrossRef]
- Rao, N.S.; Sunitha, B.; Rambabu, R.; Rao, P.V.N.; Rao, P.S.; Spandana, B.D.; Sravanthi, M.; Marghade, D. Quality and degree of pollution of groundwater, using PIG from a rural part of Telangana State, India. Appl. Water Sci. 2018, 8, 227. [Google Scholar] [CrossRef] [Green Version]
- Sunitha, V.; Reddy, B.M. Geochemical characterization, deciphering groundwater quality using pollution index of groundwater (PIG), water quality index (WQI) and geographical information system (GIS) in hard rock aquifer, South India. Appl. Water Sci. 2022, 12, 41. [Google Scholar] [CrossRef]
- Gorgij, A.D.; Wu, J.; Moghadam, A.A. Groundwater quality ranking using the improved entropy TOPSIS method: A case study in Azarshahr plain aquifer, east Azerbaijan, Iran. Hum. Ecol. Risk Assess. 2019, 25, 176–190. [Google Scholar] [CrossRef]
- Islam, A.R.M.T.; Ahmed, N.; Bodrud-Doza, M.; Chu, R. Characterizing groundwater quality ranks for drinking purposes in Sylhet district, Bangladesh, using entropy method, spatial autocorrelation index, and geostatistics. Environ. Sci. Pollut. Res. 2017, 24, 26350–26374. [Google Scholar] [CrossRef] [PubMed]
- Liu, Z.; Zhu, H.; Cui, X.; Wang, W.; Luan, X.; Chen, L.; Cui, Z.; Zhang, L. Groundwater Quality Evaluation of the Dawu Water Source Area Based on Water Quality Index (WQI): Comparison between Delphi Method and Multivariate Statistical Analysis Method. Water 2021, 13, 1127. [Google Scholar] [CrossRef]
- Mahammad, S.; Islam, A.; Shit, P.K. Geospatial assessment of groundwater quality using entropy-based irrigation water quality index and heavy metal pollution indices. Environ. Sci. Pollut. Res. 2022. [Google Scholar] [CrossRef]
- Mogheir, Y.; de Lima, J.L.M.P.; Singh, V.P. Entropy and Multi-Objective Based Approach for Groundwater Quality Monitoring Network Assessment and Redesign. Water Resour. Manag. 2009, 23, 1603–1620. [Google Scholar] [CrossRef] [Green Version]
- Fang, H.; Lin, Z.; Fu, X. Spatial variation, water quality, and health risk assessment of trace elements in groundwater in Beijing and Shijiazhuang, North China Plain. Environ. Sci. Pollut. Res. 2021, 28, 57046–57059. [Google Scholar] [CrossRef] [PubMed]
- Li, Z.; Yang, T.; Huang, C.-S.; Xu, C.-Y.; Shao, Q.; Shi, P.; Wang, X.; Cui, T. An improved approach for water quality evaluation: TOPSIS-based informative weighting and ranking (TIWR) approach. Ecol. Indic. 2018, 89, 356–364. [Google Scholar] [CrossRef]
- Zhang, Q.; Xu, P.; Qian, H. Groundwater Quality Assessment Using Improved Water Quality Index (WQI) and Human Health Risk (HHR) Evaluation in a Semi-arid Region of Northwest China. Expo. Health 2020, 12, 487–500. [Google Scholar] [CrossRef]
- Singh, K.R.; Dutta, R.; Kalamdhad, A.S.; Kumar, B. Information entropy as a tool in surface water quality assessment. Environ. Earth Sci. 2019, 78, 15. [Google Scholar] [CrossRef]
- Zhang, Y.; Zhang, K.; Niu, Z. Reservoir-type water source vulnerability assessment: A case study of the Yuqiao Reservoir, China. Hydrol. Sci. J. 2016, 61, 1291–1300. [Google Scholar] [CrossRef]
- Yan, F.; Yi, F.; Chen, L. Improved Entropy Weighting Model in Water Quality Evaluation. Water Resour. Manag. 2019, 33, 2049–2056. [Google Scholar]
- Zhang, Z.; Xiao, C.; Yang, W.; Adeyeye, O.A.; Liang, X. Effects of the natural environment and human activities on iron and manganese content in groundwater: A case study of Changchun city, Northeast China. Environ. Sci. Pollut. Res. 2021, 28, 41109–41119. [Google Scholar] [CrossRef]
- Chai, Y.; Xiao, C.; Li, M.; Liang, X. Hydrogeochemical Characteristics and Groundwater Quality Evaluation Based on Multivariate Statistical Analysis. Water 2020, 12, 2792. [Google Scholar] [CrossRef]
- Li, M.; Liang, X.; Xiao, C.; Cao, Y.; Hu, S. Hydrochemical Evolution of Groundwater in a Typical Semi-Arid Groundwater Storage Basin Using a Zoning Model. Water 2019, 11, 1334. [Google Scholar] [CrossRef] [Green Version]
- Egbueri, J.C. Groundwater quality assessment using pollution index of groundwater (PIG), ecological risk index (ERI) and hierarchical cluster analysis (HCA): A case study. Groundw. Sustain. Dev. 2020, 10, 100292. [Google Scholar] [CrossRef]
- Naik, M.R.; Mahanty, B.; Sahoo, S.K.; Jha, V.N.; Sahoo, N.K. Assessment of groundwater geochemistry using multivariate water quality index and potential health risk in industrial belt of central Odisha, India. Environ. Pollut. 2022, 303, 119161. [Google Scholar] [CrossRef]
- Karunanidhi, D.; Aravinthasamy, P.; Deepali, M.; Subramani, T.; Bellows, B.C.; Li, P. Groundwater quality evolution based on geochemical modeling and aptness testing for ingestion using entropy water quality and total hazard indexes in an urban-industrial area (Tiruppur) of Southern India. Environ. Sci. Pollut. Res. 2021, 28, 18523–18538. [Google Scholar] [CrossRef]
- Zhang, Y.; Jia, R.; Wu, J.; Wang, H.; Luo, Z. Evaluation of Groundwater Using an Integrated Approach of Entropy Weight and Stochastic Simulation: A Case Study in East Region of Beijing. Int. J. Environ. Res. Public Health 2021, 18, 7703. [Google Scholar] [CrossRef]
- Adeyeye, O.; Xiao, C.; Zhang, Z.; Liang, X. State, source and triggering mechanism of iron and manganese pollution in groundwater of Changchun, Northeastern China. Environ. Monit. Assess. 2020, 192, 619. [Google Scholar] [CrossRef]
- Piper, A.M. A graphic procedure in the geochemical interpretation of water-analyses. Trans. Am. Geophys. Union 1944, 25, 914–923. [Google Scholar] [CrossRef]
- Gibbs, R.J. Mechanisms Controlling World Water Chemistry. Science 1970, 170, 1088–1090. [Google Scholar] [CrossRef] [PubMed]
- Gabr, M.E.; Soussa, H.; Fattouh, E. Groundwater quality evaluation for drinking and irrigation uses in Dayrout city Upper Egypt. Ain Shams Eng. J. 2021, 12, 327–340. [Google Scholar] [CrossRef]
- Thuy Thanh, N.; Kawamura, A.; Thanh Ngoc, T.; Nakagawa, N.; Amaguchi, H.; Gilbuena, R., Jr. Hydrogeochemical assessment of groundwater quality during dry and rainy seasons for the two main aquifers in Hanoi, Vietnam. Environ. Earth Sci. 2015, 73, 4287–4303. [Google Scholar]
- Mattos, J.B.; Moreira Cruz, M.J.; Fernandes De Paula, F.C.; Sales, E.F. Natural and anthropic processes controlling groundwater hydrogeochemistry in a tourist destination in northeastern Brazil. Environ. Monit. Assess. 2018, 190, 395. [Google Scholar] [CrossRef]
- Marandi, A.; Shand, P. Groundwater chemistry and the Gibbs Diagram. Appl. Geochem. 2018, 97, 209–212. [Google Scholar] [CrossRef]
- Rao, N.S.; Chaudhary, M. Hydrogeochemical processes regulating the spatial distribution of groundwater contamination, using pollution index of groundwater (PIG) and hierarchical cluster analysis (HCA): A case study. Groundw. Sustain. Dev. 2019, 9, 100238. [Google Scholar]
- Papazotos, P.; Vasileiou, E.; Perraki, M. The synergistic role of agricultural activities in groundwater quality in ultramafic environments: The case of the Psachna basin, central Euboea, Greece. Environ. Monit. Assess. 2019, 191, 317. [Google Scholar] [CrossRef]


| Aquifer System | Aquifer | Lithology of the Aquifer | Permeability (m/d) | Thickness (m) | Water Inflow (m3/d) | Type of Groundwater |
|---|---|---|---|---|---|---|
| Quaternary Porous Aquifer System | Holocene Aquifer | Medium and coarse sand, gravel sand and gravel | 30–100 | 5–20 | 500–3000 | unconfined |
| Upper Pleistocene (Guxiang Formation) Aquifer | Fine sand, sand and loss-shaped subclay | 10–30 | 10–30 | 100–500 | unconfined | |
| Middle Pleistocene (Huangshan Formation) Aquifer | Sand and loss-shaped subclay | Average | 5–20 | <100 | unconfined | |
| Sand, gravel and clay | 10–30 | 10–30 | 500–1000 | confined | ||
| Lower Pleistocene (Baitushan Formation) Aquifer | Sand, gravel and pebbles | Good | 10–60 | 500–3000 | unconfined | |
| Good | 1–30 | 100–1000 | confined | |||
| Cretaceous Fissure–Pore Aquifer System | Nenjiang Formation and Yaojia Formation Aquifer | Sandstone and mud rock | Bad | 50–80 | <100 | confined |
| Qingshankou Formation and Quantou Formation Aquifer | Sandstone, sandy conglomerate and mud rock | Bad | 50–80 | <100 |
| Chemical Parameters | Aw (Allotted Weight) | Wp (Weight Parameter) | Ds (Drinking-Water Quality Standard) | Unit |
|---|---|---|---|---|
| TDS | 5 | 0.1136 | 500 | mg/L |
| TH | 4 | 0.0909 | 300 | mg/L |
| Ca2+ | 2 | 0.0455 | 75 | mg/L |
| Mg2+ | 2 | 0.0455 | 30 | mg/L |
| Na+ | 4 | 0.0909 | 200 | mg/L |
| K+ | 1 | 0.0227 | 12 | mg/L |
| HCO3− | 3 | 0.0682 | 300 | mg/L |
| Cl− | 4 | 0.0909 | 250 | mg/L |
| SO42− | 5 | 0.1136 | 200 | mg/L |
| NO3− | 5 | 0.1136 | 45 | mg/L |
| F− | 5 | 0.1136 | 1.5 | mg/L |
| Fe3+ | 4 | 0.0909 | 0.3 | mg/L |
| Sum | 44 | 1 |
| PIG | <1 | 1–1.5 | 1.5–2 | 2–2.5 | >2.5 |
|---|---|---|---|---|---|
| Result | Insignificant Pollution | Low Pollution | Moderate Pollution | High Pollution | Very High pollution |
| Parameter | Unit | Ds | Unconfined Water | Confined Water | ||||||||
|---|---|---|---|---|---|---|---|---|---|---|---|---|
| Min | Max | Mean | S.D. | CV | Min | Max | Mean | S.D. | CV | |||
| pH | / | 6.5–8.5 | 6.7 | 8.5 | 7.5 | 0.4 | 6 | 7 | 7.8 | 7.4 | 0.3 | 4 |
| TDS | mg/L | 500 | 182 | 2280 | 880.7 | 454 | 52 | 189 | 813 | 478.1 | 238 | 50 |
| TH | mg/L | 300 | 90.8 | 1200 | 555.8 | 269 | 48 | 120 | 522 | 297.9 | 137 | 46 |
| Ca2+ | mg/L | 75 | 24.2 | 401 | 170.3 | 89 | 53 | 37.2 | 200 | 96.3 | 52 | 54 |
| Mg2+ | mg/L | 30 | 3.9 | 84.8 | 28.1 | 22 | 77 | 4.25 | 24.9 | 12.3 | 7 | 60 |
| Na+ | mg/L | 200 | 12.9 | 360 | 84.2 | 88 | 105 | 10.3 | 94.6 | 30.7 | 27 | 86 |
| K+ | mg/L | 12 | 0.268 | 106 | 4.2 | 18 | 430 | 0.396 | 11.2 | 1.6 | 3 | 178 |
| Cl− | mg/L | 300 | 2.5 | 434 | 112.8 | 89 | 79 | 3.4 | 124 | 47.3 | 42 | 88 |
| SO42− | mg/L | 250 | 1.55 | 298 | 102.3 | 86 | 84 | 5.77 | 163 | 42.8 | 46 | 108 |
| HCO3− | mg/L | 200 | 93 | 881 | 376.6 | 173 | 46 | 67.7 | 415 | 228.8 | 102 | 44 |
| NO3− | mg/L | 45 | 0.01 | 143 | 36.3 | 38 | 105 | 0.4 | 59.5 | 22.3 | 21 | 93 |
| F− | mg/L | 1.5 | 0.09 | 6.8 | 1.0 | 1.6 | 157 | 0.12 | 0.67 | 0.3 | 0.1 | 47 |
| Fe3+ | mg/L | 0.3 | 0.0045 | 20.3 | 1.6 | 4.1 | 263 | 0.0045 | 4.97 | 0.5 | 1.3 | 247 |
| Sample Number | PIG | Evaluation Result | CRITIC-PIG | Evaluation Result | Entropy-PIG | Evaluation Result |
|---|---|---|---|---|---|---|
| D1 | 0.670 | Insignificant Pollution | 1.213 | Low Pollution | 0.782 | Insignificant Pollution |
| D2 | 2.552 | Very High Pollution | 1.778 | Moderate Pollution | 1.950 | Moderate Pollution |
| D3 | 0.577 | Insignificant Pollution | 0.765 | Insignificant Pollution | 0.615 | Insignificant Pollution |
| D4 | 4.109 | Very High Pollution | 1.635 | Moderate Pollution | 2.340 | High Pollution |
| D5 | 0.891 | Insignificant Pollution | 1.329 | Low Pollution | 1.059 | Low Pollution |
| D6 | 1.841 | Moderate Pollution | 2.584 | Very High Pollution | 2.091 | High Pollution |
| D7 | 0.452 | Insignificant Pollution | 0.708 | Insignificant Pollution | 0.545 | Insignificant Pollution |
| D8 | 1.033 | Low Pollution | 1.650 | Moderate Pollution | 1.281 | Low Pollution |
| D9 | 1.453 | Low Pollution | 2.195 | High Pollution | 1.766 | Moderate Pollution |
| D10 | 1.132 | Low Pollution | 1.615 | Moderate Pollution | 1.338 | Low Pollution |
| D11 | 1.233 | Low Pollution | 1.746 | Moderate Pollution | 1.443 | Low Pollution |
| D12 | 2.050 | High Pollution | 2.153 | High Pollution | 2.028 | High Pollution |
| D13 | 1.229 | Low Pollution | 1.769 | Moderate Pollution | 1.446 | Low Pollution |
| D14 | 1.906 | Moderate Pollution | 1.785 | Moderate Pollution | 1.703 | Moderate Pollution |
| D15 | 1.033 | Low Pollution | 1.509 | Moderate Pollution | 1.226 | Low Pollution |
| D16 | 0.593 | Insignificant Pollution | 0.881 | Insignificant Pollution | 0.688 | Insignificant Pollution |
| D17 | 1.368 | Low Pollution | 2.138 | High Pollution | 1.637 | Moderate Pollution |
| D18 | 2.282 | High Pollution | 2.795 | Very High Pollution | 2.447 | High Pollution |
| D19 | 0.859 | Insignificant Pollution | 1.232 | Low Pollution | 0.983 | Insignificant Pollution |
| D20 | 0.528 | Insignificant Pollution | 0.808 | Insignificant Pollution | 0.588 | Insignificant Pollution |
| D21 | 1.037 | Low Pollution | 1.399 | Low Pollution | 1.161 | Low Pollution |
| D22 | 7.114 | Very High Pollution | 2.568 | Very High Pollution | 3.985 | Very High Pollution |
| D23 | 2.267 | High Pollution | 0.649 | Insignificant Pollution | 1.164 | Low Pollution |
| D24 | 1.070 | Low Pollution | 1.036 | Low Pollution | 0.955 | Insignificant Pollution |
| D25 | 0.856 | Insignificant Pollution | 1.204 | Low Pollution | 0.953 | Insignificant Pollution |
| D26 | 1.931 | Moderate Pollution | 1.847 | Moderate Pollution | 1.681 | Moderate Pollution |
| D27 | 0.927 | Insignificant Pollution | 1.371 | Low Pollution | 1.072 | Low Pollution |
| D28 | 0.444 | Insignificant Pollution | 0.762 | Insignificant Pollution | 0.537 | Insignificant Pollution |
| D29 | 0.570 | Insignificant Pollution | 0.884 | Insignificant Pollution | 0.679 | Insignificant Pollution |
| D30 | 0.570 | Insignificant Pollution | 0.502 | Insignificant Pollution | 0.422 | Insignificant Pollution |
| D31 | 0.561 | Insignificant Pollution | 0.776 | Insignificant Pollution | 0.524 | Insignificant Pollution |
| D32 | 0.520 | Insignificant Pollution | 0.726 | Insignificant Pollution | 0.584 | Insignificant Pollution |
| D33 | 0.447 | Insignificant Pollution | 0.747 | Insignificant Pollution | 0.507 | Insignificant Pollution |
| D34 | 0.936 | Insignificant Pollution | 1.132 | Low Pollution | 0.987 | Insignificant Pollution |
| Sample Number | PIG | Evaluation Result | CRITIC-PIG | Evaluation Result | Entropy-PIG | Evaluation Result |
|---|---|---|---|---|---|---|
| C1 | 0.204 | Insignificant Pollution | 0.294 | Insignificant Pollution | 0.229 | Insignificant Pollution |
| C2 | 0.291 | Insignificant Pollution | 0.461 | Insignificant Pollution | 0.331 | Insignificant Pollution |
| C3 | 0.282 | Insignificant Pollution | 0.443 | Insignificant Pollution | 0.326 | Insignificant Pollution |
| C4 | 0.690 | Insignificant Pollution | 0.963 | Insignificant Pollution | 0.781 | Insignificant Pollution |
| C5 | 0.630 | Insignificant Pollution | 0.850 | Insignificant Pollution | 0.716 | Insignificant Pollution |
| C6 | 0.601 | Insignificant Pollution | 0.697 | Insignificant Pollution | 0.532 | Insignificant Pollution |
| C7 | 0.819 | Insignificant Pollution | 1.190 | Low Pollution | 0.926 | Insignificant Pollution |
| C8 | 0.552 | Insignificant Pollution | 0.853 | Insignificant Pollution | 0.626 | Insignificant Pollution |
| C9 | 0.837 | Insignificant Pollution | 0.948 | Insignificant Pollution | 0.850 | Insignificant Pollution |
| C10 | 0.350 | Insignificant Pollution | 0.472 | Insignificant Pollution | 0.365 | Insignificant Pollution |
| C11 | 0.354 | Insignificant Pollution | 0.609 | Insignificant Pollution | 0.435 | Insignificant Pollution |
| C12 | 1.697 | Moderate Pollution | 0.549 | Insignificant Pollution | 0.904 | Insignificant Pollution |
| C13 | 0.622 | Insignificant Pollution | 0.925 | Insignificant Pollution | 0.718 | Insignificant Pollution |
| C14 | 0.825 | Insignificant Pollution | 1.226 | Low Pollution | 0.959 | Insignificant Pollution |
| TDS | TH | Ca2+ | Mg2+ | Na+ | K+ | HCO3− | Cl− | SO42− | NO3− | F− | Fe3+ | PIG | Pollution Level |
|---|---|---|---|---|---|---|---|---|---|---|---|---|---|
| 0.126 | 0.105 | 0.067 | 0.022 | 0.020 | 0.002 | 0.066 | 0.021 | 0.024 | 0.058 | 0.033 | 0.057 | 0.602 | Insignificant |
| 0.237 | 0.228 | 0.147 | 0.054 | 0.034 | 0.002 | 0.098 | 0.051 | 0.077 | 0.118 | 0.060 | 0.071 | 1.177 | Low |
| 0.249 | 0.198 | 0.119 | 0.048 | 0.058 | 0.002 | 0.082 | 0.072 | 0.070 | 0.135 | 0.150 | 0.661 | 1.844 | Moderate |
| 0.317 | 0.170 | 0.085 | 0.077 | 0.098 | 0.068 | 0.082 | 0.053 | 0.105 | 0.202 | 0.243 | 0.699 | 2.200 | High |
| 0.199 | 0.193 | 0.110 | 0.050 | 0.027 | 0.004 | 0.092 | 0.044 | 0.111 | 0.001 | 0.041 | 3.720 | 4.592 | Very High |
| TDS | TH | Ca2+ | Mg2+ | Na+ | K+ | HCO3− | Cl− | SO42− | NO3− | F− | Fe3+ | CRITIC-PIG | Pollution Level |
|---|---|---|---|---|---|---|---|---|---|---|---|---|---|
| 0.211 | 0.164 | 0.080 | 0.008 | 0.015 | 0.002 | 0.157 | 0.010 | 0.012 | 0.013 | 0.004 | 0.033 | 0.708 | Insignificant |
| 0.405 | 0.330 | 0.182 | 0.012 | 0.016 | 0.001 | 0.174 | 0.033 | 0.024 | 0.037 | 0.003 | 0.015 | 1.233 | Low |
| 0.497 | 0.429 | 0.205 | 0.025 | 0.038 | 0.002 | 0.268 | 0.039 | 0.046 | 0.032 | 0.012 | 0.111 | 1.704 | Moderate |
| 0.708 | 0.550 | 0.248 | 0.036 | 0.066 | 0.002 | 0.356 | 0.048 | 0.070 | 0.050 | 0.027 | 0.002 | 2.162 | High |
| 0.843 | 0.582 | 0.290 | 0.025 | 0.054 | 0.054 | 0.224 | 0.073 | 0.083 | 0.082 | 0.010 | 0.329 | 2.649 | Very High |
| TDS | TH | Ca2+ | Mg2+ | Na+ | K+ | HCO3− | Cl− | SO42− | NO3− | F− | Fe3+ | Entropy-PIG | Pollution Level |
|---|---|---|---|---|---|---|---|---|---|---|---|---|---|
| 0.084 | 0.124 | 0.142 | 0.050 | 0.018 | 0.003 | 0.078 | 0.013 | 0.028 | 0.044 | 0.018 | 0.055 | 0.657 | Insignificant |
| 0.142 | 0.246 | 0.287 | 0.100 | 0.021 | 0.002 | 0.101 | 0.026 | 0.072 | 0.099 | 0.030 | 0.115 | 1.243 | Low |
| 0.187 | 0.300 | 0.311 | 0.163 | 0.056 | 0.004 | 0.164 | 0.036 | 0.124 | 0.061 | 0.096 | 0.244 | 1.747 | Moderate |
| 0.264 | 0.306 | 0.313 | 0.184 | 0.081 | 0.068 | 0.109 | 0.058 | 0.132 | 0.204 | 0.116 | 0.392 | 2.227 | High |
| 0.153 | 0.299 | 0.319 | 0.068 | 0.010 | 0.006 | 0.114 | 0.024 | 0.206 | 0.000 | 0.014 | 2.771 | 3.985 | Very High |
Publisher’s Note: MDPI stays neutral with regard to jurisdictional claims in published maps and institutional affiliations. |
© 2022 by the authors. Licensee MDPI, Basel, Switzerland. This article is an open access article distributed under the terms and conditions of the Creative Commons Attribution (CC BY) license (https://creativecommons.org/licenses/by/4.0/).
Share and Cite
Wang, X.; Xiao, C.; Liang, X.; Li, M. Groundwater Quality Assessment in the Northern Part of Changchun City, Northeast China, Using PIG and Two Improved PIG Methods. Int. J. Environ. Res. Public Health 2022, 19, 9603. https://doi.org/10.3390/ijerph19159603
Wang X, Xiao C, Liang X, Li M. Groundwater Quality Assessment in the Northern Part of Changchun City, Northeast China, Using PIG and Two Improved PIG Methods. International Journal of Environmental Research and Public Health. 2022; 19(15):9603. https://doi.org/10.3390/ijerph19159603
Chicago/Turabian StyleWang, Xinkang, Changlai Xiao, Xiujuan Liang, and Mingqian Li. 2022. "Groundwater Quality Assessment in the Northern Part of Changchun City, Northeast China, Using PIG and Two Improved PIG Methods" International Journal of Environmental Research and Public Health 19, no. 15: 9603. https://doi.org/10.3390/ijerph19159603