Abstract
(1) Background: The main basis for the public recognition of the merits of scientists has always been the system of scientific publications and citations. Our goal is to identify and analyze the most cited articles in the Public, Environmental & Occupational Health category. (2) Methods: We searched the Web of Science for all articles published in the “Public, Environmental & Occupational Health” category up to March 2022 and selected the 100 most cited articles. We recorded the number of citations, the journal, the year of publication, quartile, impact factor, institution, country, authors, topic, type of publication and collaborations. (3) Results: 926,665 documents were analyzed. The top 100 had 401,620 citations. The journal with the most articles was the Journal of Clinical Epidemiology and the one with the highest number of citations was Medical Care. The year with the highest number of articles in the top 100 was 1998. The country with the highest percentage of publications was the USA and the most productive institution was Harvard. The most frequent keywords were bias, quality, and extension. The largest collaboration node was between the USA, Canada, Germany, Spain, Australia, France, and Sweden. (4) Conclusions: This bibliometric study on Public, Environmental & Occupational Health provides valuable information not only to identify topics of interest in the analyzed category, but also to identify the differences in the topics they study.
1. Introduction
Bibliometrics is a science that uses statistical and mathematical procedures to track the general trend of research in a specific field [1]. Various authors have targeted the participation of researchers in scientific activities, as well as differences and conditioning factors from the different fields of scientific knowledge [2]. These authors attribute different frequency and different publication practices between scientific disciplines [2]. The Web of Science (WoS) online database includes all important research papers and provides integrated analysis tools to produce representative figures, that is, it is the reference database of institutions, researchers and actors linked to science [3,4,5].
Within bibliometrics, citation analysis is one of the most used tools to assess the academic impact of an article in a specific area of knowledge [6]. The number of citations a publication receives does not necessarily reflect the quality of the research or the relevance of its authors [7], but it has been suggested that articles with the highest number of citations may have the ability to generate changes in practice, controversy, discussion and more research [6,8,9], or, as suggested by Zhu et al. [1], the number of citations can measure the article’s influence and merit. In addition, WoS search results could be exported to software for later analysis such as VOS-viewer [10], which could provide important information associated with collaboration networks between countries, institutions or authors.
Although there have been bibliometric analyses of articles in the field of food safety [11,12]; environmental health [13,14]; health promotion [15,16]; health education [17]; mental health [18,19]; sport health [20]; and occupational health [21,22], the entire category of Public, Environmental & Occupational Health has never been studied worldwide.
Few studies have a standardized measure of the wide range of dissemination activities in a scientific category that allows a detailed observation of production, collaboration and interrelation in a scientific field. No explorations have been performed based on quantitative methodologies aimed at building indicators on which to be able to empirically test the scientific productivity of the Public, Environmental & Occupational Health category.
To our knowledge, there is no study that bibliometrically analyzes high citation articles that evaluate the Public, Environmental & Occupational Health category. Therefore, this study aimed to identify and analyze the 100 most cited articles in the Public, Environmental & Occupational Health category to understand the historical perspective and promote discussion and scientific progress in this specialty.
2. Materials and Methods
2.1. Search Strategy and Eligible Criteria
Bibliometric analysis was performed on 14 March 2022. Two independent researchers, who searched the Web of Science Core Collection (Clarivate Analytics), a research platform that provides a substantial bibliographic database through of Science Citation Index Expanded (SCIE) using the search category, identified articles. The search strategy was performed through the “Public, Environmental & Occupational Health” category. We refined the research by selecting original research articles and reviews. The 100 articles with the most citations were eligible for bibliometric analysis, arranged in descending order of citation count. Any disagreement between the reviewers was discussed between them to reach a final decision. Author in descending order according to the number of citations ordered these articles.
2.2. Data Extraction
Two authors independently retrieved information from all articles. Through the Web of Science, the 100 articles with the highest number of citations were selected and exported. Later, they were exported into an Excel document where the following were recorded: the number of citations, name of the journal, year of publication, first and last author and co-authors, total number of authors, geographical location, origin and associated institute, the title of the article, type of document (article or review), abstract and corresponding author. For the analysis of authors, all the authors who participated in the study were counted. In the bibliometric analysis by country, each country that participated in the study was taken into account and the citations received were counted. Citations received by a country more than once were not counted if several authors from different institutions but from the same country had participated in the same study. The number of articles per country was counted as long as there was an author from the country in the study. If the first author was affiliated with two institutions, then the first institute was selected for inclusion.
2.3. Statical Analysis
We used IBM SPSS Statistics for Windows, Version 27.0 (Armonk, NY, USA: IBM Corp.) for correlation analysis. Correlation was determined using Pearson’s correlation coefficient (r), and when p < 0.05, the difference was considered statistically significant. We used a popular bibliometric analysis tool, VOSviewer 1.6.18 software (CWTS, Leiden, The Netherlands) [23], for cooperative network identification and keyword co-occurrence analysis. In addition, it could generate visual maps of knowledge. We also used the MapChart program [24], a platform from which a personalized map of different regions of the world was created, using colors and descriptions.
3. Results
The study flowchart is shown in Figure 1, and included studies that were published from 1900 to 2022 for the Public, Environmental & Occupational Health category of Web of Science. The search topic, after applying the strategy, produced 926,665 documents. For the analysis of the study, only articles or review articles were taken into consideration, which led to the exclusion of 294,361 documents. Of the remaining 632,304, the 100 documents with the highest number of citations were considered for the study. A total of 632,204 documents were excluded.
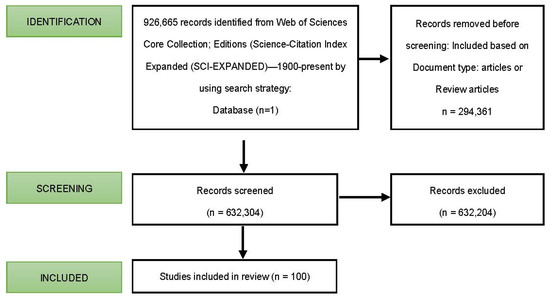
Figure 1.
Flowchart of study.
3.1. Publication Year, Citation and Bibliometric Analysis of the Keywords
The 100 most cited publications in the Public, Environmental & Occupational Health category were published between 1938 and 2020, of which 70% were published after 2018. We performed an analysis of publication trends by 6-year intervals based on a ranking of publication dates. Between 1998 and 2003, 29 documents were published, with the year 1998 (n = 11) being the year of greatest production. There has been a visible improvement in the quantity of the data, since, of the 100 articles, before 1998 a total of 29 documents were published, making a big difference with the period 1998 to 2003, when 29 articles were published (Figure 2).
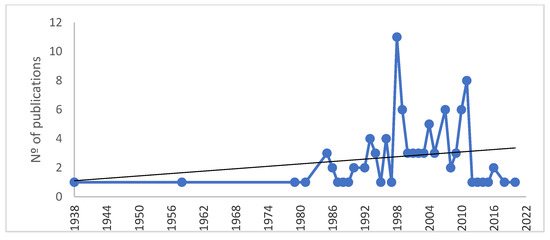
Figure 2.
Pattern of distribution of top-cited articles (number of articles per year).
The top 100 articles were cited 401,620 times in total, and the average total number of citations was 4016 citations (ranging from 1846 to 30,229). No significant correlation was found between the total number of citations and the age of the articles (r = −0.121, p = 0.229). The most cited article (30,229 citations) was “A new method of classifying prognostic co-morbidity in longitudinal-studies-development and validation” by Charlson et al. [25] published in the Journal of Chronic Diseases. Based on the number of publications in the 100 articles, and analyzing the citations per publication, 1998 was the most productive year with 11 articles (42,320 citations and an average of 3847 citations/article) in the top 100 list (Table 1).

Table 1.
The top 100 articles with most total citations in Public, Environmental & Ocupational Health category.
The oldest study included in the list was published by Miles et al. [26] in 1938 entitled “The estimation of the bactericidal power of the blood”, with 3246 citations. The last study included was published in 2020 by Wang et al. [27], the paper entitled “Immediate Psychological Responses and Associated Factors during the Initial Stage of the 2019 Coronavirus Disease (COVID-19) Epidemic among the General Population in China”, with 2485 citations, published in the International Journal of Environmental Research and Public Health (Table 1).
Eighty-six of the 100 publications were original research, and the remaining 14 were reviews. The average number of citations per article in the review works was 3285 citations/article compared to 4135 citations/article in the original works (Table 1). The most common important keywords included quality of life, comorbidity, disease, cancer, clinical-trials, bias and epidemiology, and the keywords that appeared the most were “bias” (total link strength of 14), “quality” (total link strength of 11) and “extension” (total link strength of 10), which had a strong link with “epidemiology”, “metaanalysis” and “cancer” (Figure 3).
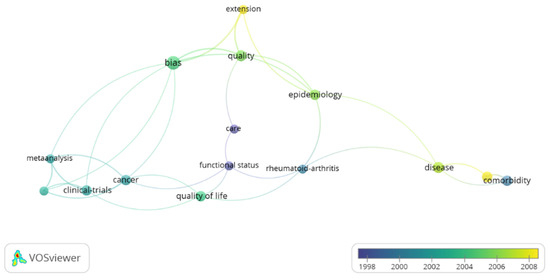
Figure 3.
The co-occurrence network of keywords. Note: The size of the nodes indicates the frequency of occurrence. The curves between the nodes represent their co-occurrence in the same publication. The smaller the distance between two nodes, the higher the number of co-occurrence of the two keywords.
3.2. Authors and Bibliometric Analysis of the Co-Authorship
A total of 487 authors contributed the 100 most cited. The number of authors in an article ranged from 1 to 26 (mean 5.53). Analysis of the 10 most productive authors based on their number of articles in the top 100, regardless of their authorship positions, showed that Ware, J.E., Altman, D.G. and Horan, T.C. were the authors with the highest number of articles.
Ware, J.E., from the USA, had a maximum of 46,062 citations with five articles listed and an h-index of 100. The average number of citations/article was 9212 citations. However, Altman, D.G. from England, published four papers, the total index of citations was 36,420 and the average per article was 9105; their h-index was 182. The third position is for the researcher Horan, T.C. from the USA, with four published documents, an h-index of 25, and with more than 13,500 total citations (Table 2).
Table 2.
The top authors with the most articles in the top 100.
The total number of citations was not related to the number of authors (r = −0.118, p = 0.058). However, the average number of citations per article was associated with the number of authors (r = 0.210, p < 0.001).
There was low collaboration between most of the main authors, creating only one cooperation research network. Authors with a minimum of three papers per author were considered for analysis. Of the 487 authors, seven reached the threshold (Figure 4). Altman, D.G. formed a collaborative network with five other researchers with a link strength of 15.
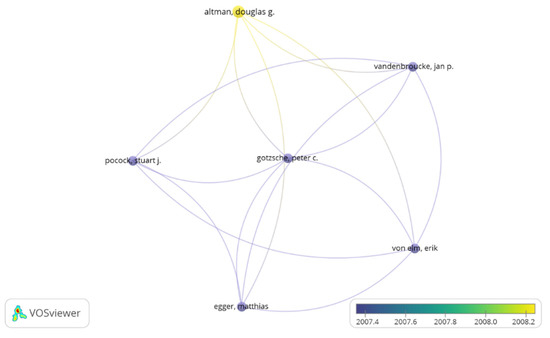
Figure 4.
The author collaboration network. Note: The collaboration map of authors reflects the scientific research cooperation between them. The circle/node signifies the authors; size of the circle/node signifies the number of articles. The lines denote the authors’ collaboration strength, and each color signifies a cluster.
3.3. Countries, Institutions and Bibliometric Analysis of the Collaboration
A total of 26 countries published the 100 most cited articles in the Public, Environmental & Occupational Health category. Table 3 shows the twelve most productive countries, with the USA being the one that contributes the most, with 65 documents, followed by England with 21 and Canada with 17 articles. These three same countries obtain also the greatest number of citations. However, the country with the highest rate of citations per article is Italy, with an average of 5151 citations/article, followed by England with an average of 4724 citations/article.
Table 3.
The top countries with the most highly cited articles.
Two collaboration nodes were established. A larger one, involving seven countries and where the USA had the most active partnership (a liaison force of 45 and collaborated on 57 documents); its major research cooperators included Canada, Germany, Spain, Australia, France, Sweden. The other node was where England (with a link strength of 37 and 20 documents) had a strong collaboration with mainly European countries such as Denmark, The Netherlands and Switzerland. We found that Italy and Norway rarely cooperated with other countries in investigations. (Figure 5).
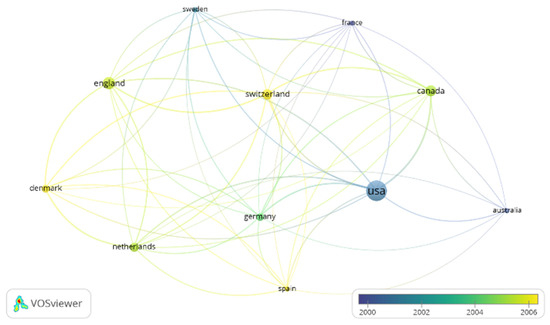
Figure 5.
The country collaboration network.
The world map revealed that the articles were mainly concentrated in North American and western Europe, and less so in Oceania. Specifically, the USA was the country with the highest production of documents, followed by England and Canada (Figure 6).
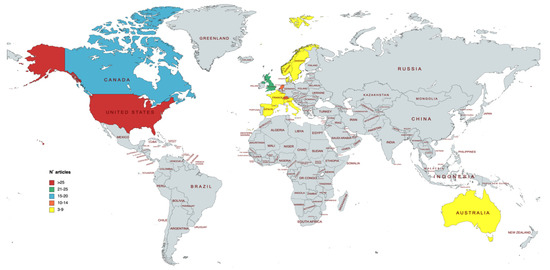
Figure 6.
The distribution map of the number of published articles worldwide for countries (MapChart).
In total, 228 institutions participated in the 100 articles. The number of institutions per article ranged between 1 and 21. The average institutional collaboration was 3.8 institutions/article. The article with 21 participating institutions was a review on toxic equivalency factors (TEFs) published in 1998 with 2592 citations. The World Health Organization, with eight articles included in this bibliometric analysis, was the institution with the greatest scientific representation (Table 4). In four of the eight papers, it was included as the main institution of the study. The total number of citations was 20,339 and the average number of citations per article was 2542 citations. The second institution was the University of Harvard in the USA with six documents and one as the main institution. The total number of citations was more than 25,000 with an average of 4209 citations per article.
Table 4.
The top institutions with the most highly cited articles.
There was a strong and significant correlation between the number of institutions and authors (r = 0.848, p < 0.001). There was a negative correlation between the total citations and the number of participating institutions (r = −0.115, p = 0.286).
In the collaboration network analysis (Figure 7), a minimum of three collaborations between institutions were established, 19 reached the threshold and three cooperation network nodes were formed. In the first of them, McMaster University cooperated with institutions such as Harvard University, University of Washington and the University of Toronto and collaborated on five articles. The University of Washington had a strong partnership and cooperation with the University of Minnesota, NCI, and Wake Forest University. Collaboration network analysis also highlighted the institutional collaboration network that the World Health Organization has with University of Toronto, Wisconsin University and US EPA, with more than seven documents shared.
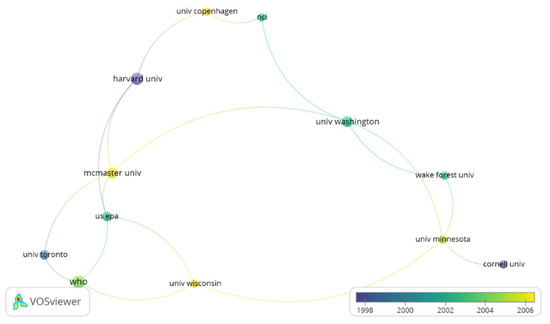
Figure 7.
The institution collaboration network.
3.4. Journal Analysis
The Web of Science “Public, Environmental & Occupational Health” category had 204 indexed journals, of which 35 made it to the top 100 most cited articles list. A total of 16 journals were in the first quartile (approximately 45%), 9 journals in the second quartile, 3 in the third quartile, and 5 were from Q4. Two journals were out of print or had changed their name. A total of 79% of the studies were published in high-impact journals (Q1 or Q2).
The IFs of the 35 journals ranged from 0.875, Malawi Medical Journal, to 59.769, MMWR Surveillance Summaries. There were up to 22 journals with an IF < 5.000, seven between 5.000 and 10.000, and four journals with an IF > 10.000.
Table 5 shows the top nine journals that published three or more articles.
Table 5.
The top journals that published the top 100 highly cited literature in Public, Environmental & Occupacional Health category.
Journal of Clinical Epidemiology was the most productive journal (n = 15), followed by Medical Care and Statistics in Medicine (n = 12). The top five journals published 54% of the articles and account for more than 59% of the total citations. The self-citation rate for the top nine journals ranged from 1.7% for the Bulletin of the World Health Organization to 10.3% for the Journal of Clinical Epidemiology. The journal with the highest number of citations was Medical Care (n = 74,189) and its mean number of citations per article was 6182 citations/article.
4. Discussion
This is the first paper that analyzes the 100 most cited papers in the Public, Environmental & Occupational Health category of Web of Science. This article identifies the authors, journals, countries, institutions, etc., with the greatest impact in this category from the beginning of the 20th century to the present. The sample size was set at 100 manuscripts to provide a manageable and significant number of articles to be analyzed, in accordance with several published works [1,6,8,9,28,29].
The period of the greatest publication of articles starts in 1998; a clear upward trend in the production of works started during the period 1989–2010, but then it disappears in the last decade. A stochastic process is observed. The Mann–Kendall trend test (Figure 3) revealed a significant positive trend towards a greater number of articles over the years starting in 1985 (p = 0.055, Kendell’s Tauβ). Our results would be in line with those found by the authors of [6,29,30]. They contrasts with recent reviews, on other topics and specialties, in which most of the most cited papers were published earlier in the 1980s [31] or later, from the year 2000 [32,33]. The socioeconomic growth of recent years may be one of the causes of the advancement in scientific research, an evolution that the dissemination and communication of science has already been experiencing as an exponential change for some time. To understand these changes, it is necessary to know how science spreads. In the professional field, one of the main ways that the research community has to disseminate its work is the publication of scientific articles; however, on the other hand, they also use social networks and all Internet options (scientific forums, blogs, etc.). These tools are also protagonists in recent years, which encourage more dissemination of science and, therefore, more knowledge of what is published [34]. Some experts believe that studies that are more recent are cited today due to the advancement in scientific dissemination [10]. It may seem surprising that the studies with the highest number of citations are recent studies; among other factors, this could be due to the appearance of scientific journals in an electronic format, facilitating access and thus favoring circulation in the scientific community [6].
Some specialists consider that research goes further, suggesting the publication of an article ends when it is read and understood by a large part of society, that is, it is not enough just to publish, it is necessary for the audience to clearly understand its content and, thus, be able to cite it [35].
The keyword co-occurrence analysis found that the words “cancer”, “quality of life”, “comorbidity”, “epidemilogy” and “disease” had the highest frequency of co-occurrence in the research in the analyzed category. Our work reflects, in part, a growing trend in public health research. Studies on quality of life, comorbidity or cancer have been the focus of research in the scientific community and specifically within the Public, Environmental & Occupational Health category [36,37]. Performing a quick bibliographic search in WoS, these terms occupy the fourth, eighth and fourteenth position, respectively, with more records among the different categories.
Metadata from all documents were used to reveal the most productive authors and the most impactful sources. The high number of authors (487) contributing to the 100 articles, with more than an average of five authors per article, made it difficult to determine the individual contribution and, consequently, the role of each author [38]. As suggested by Bruni et al. [33], traditionally, in multi-author articles, the first position is occupied by the main contributor, while the last position is reserved for the supervisor. The authors with most impact in the studied category generally held relevant positions, either as main author or as supervisor. This is becoming more common due to the influence of experimental sciences, considering the same importance to the first and last author, based on the author/director relationship. This interpretation is known as the FLAE approach, an expression of first last author emphasis [39].
The h-index quantifies the research performance of individual scientists, incorporating both the number and visibility of publications [40]. In the work, we can see an unequal distribution of the h index among the authors of the 100 articles, where the number of citations that a scientific subcommunity grants to a manuscript is undoubtedly and directly related to the number of researchers that make up such a sub-community [41]. The analyzed category is a very broad field of knowledge; therefore, the number of citations of the articles will be very different depending on the topic analyzed.
As indicated by Jung et al. [42], in a context in which there is great interest in intensifying international collaboration within scientific practice, this paper proposes an approach on how to measure and visualize international collaborative work at the institutional level. The low collaboration observed between the different authors in our work contrasts with that found in studies such as by Zhu et al. [1] or Yu et al. [10]. The joint analysis of the collaboration indexes of the relationships between the different authors of the documents allows us to make a better interpretation of the structure of international scientific collaboration networks in the category of study [43]. One of the variables handled in our work was the possibility of identifying whether there was a high level of international and potentially multinational collaboration with other institutions that could affect the visibility of the research and the frequency of citations of a category [44]. This was not the case, but we have been able to map and identify the existing collaborations within the Public, Environmental & Occupational Health field, as well as the main citation sources.
The most relevant works were mainly in North America, specifically the USA and Canada, and Western Europe. Similarly, citation analysis showed this same trend in previous studies [45,46]. This trend can be explained by several reasons, first of all, by the cumulative geographical advantage, since citations originate more frequently from institutions located in the same country as the place of residence of the author [47,48]. Second, as suggested by Wang et al. [49], the USA can count on a broad scientific community and generous science funding policies. In fact, the most productive institutions in our study are geographically located in the USA and Europe. A third reason may be that larger universities provide greater opportunities for scientists to collaborate and work on similar topics, and co-authorship may lead to higher citation rates.
Most items originated from two major advanced economies: North America and Western Europe. These are undoubtedly economically developed continents with more access to early research and they can support medical research [29]. This can be seen in the data published by WHO in a report published in 2020, in which high-income countries spend a higher percentage of GDP on R&D in the health sector [50].
The cooperative network of research institutions can reveal the distribution of research forces in the field of Public, Environmental & Occupational Health. The USA has the most extensive cooperative relationships and prefers to cooperate with Canada and some European countries. England, with the second highest number of co-authored articles, prefers to work with other European countries. Our results would be in line with those found by Song et al. [51] in the Entrepreneurship research area. In the field of science, collaborative work, institutional and disciplinary structures face the challenge of a global context. This challenge has led to the creation of initiatives such as e-Science in the United Kingdom, which was announced as a global collaboration program in key areas of science, and the development of the next generation of infrastructure. These types of initiatives show that contemporary scientific practice is characterized by being very collaborative, multidisciplinary, global work with intensive data management [52].
According to the results, more than half of the classified articles were published in only five journals, collecting more than half of the total citations. These results demonstrate that a significant number of studies concentrated on a limited core of journals, in accordance with Bradford’s law [53]. As indicated by Highhouse et al. [54], authors tend to send their work to the most prestigious journals, attracted, according to Bruni et al. [33], due to the greater visibility in the search results, as well as the greater probability of being cited.
If we look at the quartiles of the journals, works mostly appears on first and second quartile journals. As stated by Torres-Salinas and Cabezas-Calvijo [55], publication in high-impact journals generates benefits, starting with the fact that a scientist who regularly publishes in these journals will be able to advance smoothly in his scientific career and will be recognized as an expert in his field. Other authors affirm that publication in high-impact journals helps to develop one’s own criteria, increases self-esteem, strengthens the confidence of the researcher, and feeds the desire to continue researching and publishing, in addition to guaranteeing quality through arbitration, such as peer review demonstrates [35,56].
There is no doubt that the use of the JIF as an evaluation measure generates debate, but today it is a useful way to measure the prestige and importance of scientific journals in the international system, as well as for their researchers [57]. Many authors have pointed out that the JIF has some limitations such as: (a) a built-in bias that favors American journals (in the case of our study, six of the nine journals in the ranking are published in the USA), (b) scoring highly variable IF between fields and specialties within fields, (c) vulnerability to inflation due to self-citation of journals, (d) vulnerability to inflation due to the publication of review articles and meta-analyses, and, finally, (e) an arbitrary citation window that penalizes some fields or specialties within them [54,57].
Finally, we wanted to also compare the JIF without the self-citations. In this sense, the level of self-citation of the analyzed journals was relatively low, with some exceptions. The abuse of self-citations is another element that can substantially affect the JIF. The self-citation rate in the presented list was low (8.1%) compared with other studies [33,58,59]. This is a bias that many platforms have been working on for years to solve [60,61].
5. Conclusions
The work allows the identification of relevant aspects in order to encourage scientific mapping in the Public, Environmental & Occupational Health category. The analysis can help the governance of specific areas or it can outline an institution’s research. The category analyzed has very varied topics; however, it allowed us to identify the most cited authors, institutions with greater visibility, and the most notable articles.
It has also made it possible to analyze the researchers who are forming national and international collaboration networks, as well as to identify the most collaborative authors and institutions.
Currently, the publication rate of American researchers is the highest in the category studied and its institutions are among the most productive. In addition, the collaborative network of countries, institutions and authors shows the influence of European and American countries in the Public, Environmental & Occupational Health category.
Keyword analysis was an effective method to identify interesting topics among researchers and mark research trend lines.
The results of this research open up new possibilities to identify new strategies and institutional policies that allow them to consolidate their research networks.
Although there has been an exponential growth in work, greater efforts are still required from both researchers and institutions.
In this article, valuable information is provided not only to identify topics of interest in the analyzed category, but also to identify the differences on topics studied between the areas that form the category.
Author Contributions
Conceptualization, V.H.-G. and J.M.C.-T.; methodology, V.H.-G., C.J.-D. and J.M.C.-T.; formal analysis, V.H.-G. and J.R.-M.; investigation, J.M.C.-T., C.J.-D. and Á.P.-R.; data curation, V.H.-G. and J.M.C.-T.; writing—original draft preparation, V.H.-G. and J.R.-M.; writing—review and editing, V.H.-G., Á.P.-R. and J.R.-M.; visualization, J.M.C.-T. and Á.P.-R.; supervision, J.R.-M.; project administration, J.R.-M.; funding acquisition, V.H.-G., C.J.-D., Á.P.-R. and J.R.-M. All authors have read and agreed to the published version of the manuscript.
Funding
This research was funded by Human Movement Research Group: SGR-Cat 2021 grant number SGR 1463. Generalitat de Catalunya.
Institutional Review Board Statement
Not applicable.
Informed Consent Statement
Not applicable.
Data Availability Statement
The Web of Science (WoS) data can be accessed through theWoS’s official website: https://www.webofscience.com/wos/alldb/basic-search (accessed on 14 March 2022).
Conflicts of Interest
The authors declare no conflict of interest.
References
- Zhu, Y.; Zhang, C.; Wang, J.; Xie, Y.; Wang, L.; Xu, F. The top 100 highly cited articles on anterior cruciate ligaments form 2000 to 2019: A bibliometric and visualized analysis. Orthop. Traumatol. Surg. Res. 2021, 107, 8. [Google Scholar] [CrossRef] [PubMed]
- Olmos-Peñuela, J.; Castro-Martínez, E.; Fernández-Esquinas, M. Diferencias entre áreas científicas en las prácticas de divulgación de la investigación: Un estudio empírico en el CSIC. Rev. Esp. Docum. Cient. 2014, 37, e040. [Google Scholar] [CrossRef][Green Version]
- Hernández-González, V.; Pano-Rodriguez, A.; Reverter-Masia, J. Spanish doctoral theses in physical activity and sports sciences and authors’ scientific publications (LUSTRUM 2013–2017). Scientometrics 2020, 122, 661–679. [Google Scholar] [CrossRef]
- Gusenbauer, M.; Haddaway, N.R. Which academic search systems are suitable for systematic reviews or meta-analyses? Evaluating retrieval qualities of Google Scholar, PubMed, and 26 other resources. Res. Syn. Meth. 2020, 11, 181–217. [Google Scholar] [CrossRef]
- Gusenbauer, M. Search where you will find most: Comparing the disciplinary coverage of 56 bibliographic databases. Scientometrics 2022, 127, 2683–2745. [Google Scholar] [CrossRef]
- Pena-Cristobal, M.; Diniz-Freitas, M.; Monteiro, L.; Diz Dios, P.; Warnakulasuriya, S. The 100 most cited articles on oral cancer. J. Oral. Pathol. Med. 2018, 47, 333–344. [Google Scholar] [CrossRef]
- Cheek, J.; Garnham, B.; Quan, J. What’s in a number? Issues in providing evidence of impact and quality of research(ers). Qual. Health Res. 2006, 16, 423–435. [Google Scholar] [CrossRef]
- Lefaivre, K.A.; Shadgan, B.; O’Brien, P.J. 100 most cited articles in orthopaedic surgery. Clin. Orthop. Relat. Res. 2011, 469, 1487–1497. [Google Scholar] [CrossRef]
- Beatriz, T.; Rut Lucas, D.; Paredes Gallardo, V.; Alonso Arroyo, A.; Vidal-Infer, A. The 100 most-cited articles in orthodontics: A bibliometric study. Angle Orthod. 2018, 88, 785–796. [Google Scholar]
- Yu, Y.; Li, Y.; Zhang, Z.; Gu, Z.; Zhong, H.; Zha, Q.; Yang, L.; Zhu, C.; Chen, E. A bibliometric analysis using VOSviewer of publications on COVID-19. Ann. Transl. Med. 2020, 8, 816. [Google Scholar] [CrossRef]
- Lakner, Z.; Plasek, B.; Kasza, G.; Kiss, A.; Soós, S.; Temesi, Á. Towards Understanding the Food Consumer Behavior–Food Safety–Sustainability Triangle: A Bibliometric Approach. Sustainability 2021, 13, 12218. [Google Scholar] [CrossRef]
- Shen, C.; Wei, M.; Sheng, Y. A bibliometric analysis of food safety governance research from 1999 to 2019. Food Sci. Nutr. 2021, 9, 2316–2334. [Google Scholar] [CrossRef] [PubMed]
- Carvajal Tapia, A.E.; Gutiérrez Tapia, E.A. Public health, environmental and occupational health: A bibliometric study of the scientific participation of South America. Rev. Med. Chile 2019, 147, 530–536. [Google Scholar]
- Sweileh, W.M.; Zyoud, S.H.; Al-Javi, S.W.; Sawalha, A.F. Public, environmental, and occupational health research activity in Arab countries: Bibliometric, citation, and collaboration analysis. Arch. Public Health 2015, 73, 1. [Google Scholar] [CrossRef] [PubMed]
- Gagné, T.; Lapalme, J.; McQueen, D.V. Multidisciplinarity in health promotion a bibliometric analysis of current research. Health Promot. Int. 2018, 33, 610–621. [Google Scholar] [CrossRef] [PubMed]
- Tricco, A.C.; Runnels, V.; Sampson, M.; Bouchard, L. Shifts in the Use of Population Health, Health Promotion, and Public Health. Can. J. Public Health 2008, 99, 466–471. [Google Scholar] [CrossRef]
- Silveira, R.R.; Contim, D. Health education and humanized practice of nursing at intensitive care units: Bibliometric study. Rev. Pesquisa 2015, 7, 2113–2122. [Google Scholar] [CrossRef]
- Ausín, B.; Castellnaos, M.A.; González-Sanguino, C.; Heradio, R. A bibliometric análisis of 10 years of research on symptom networks in psychopathology and mental health. Psychiatry Res. 2022, 308, 114380. [Google Scholar] [CrossRef]
- Caballero-Apaza, L.M.; Vidal-Espinoza, R.; Curaca-Arroyo, S.; Gomez-Campos, R.; Callata Gallegos, Z.; Fuentes-López, J.; Cossio-Bolaños, M. Bibliometric Study of Scientific Productivity on the Impacts on Mental Health in Times of Pandemic. Medicina 2022, 58, 24. [Google Scholar] [CrossRef]
- Belfiore, P.; Ascione, A.; Di Palma, D. Technology and sport for health promotion: A bibliometric analysis. J. Hum. Sport Exer. 2020, 15, 932–942. [Google Scholar] [CrossRef]
- Bautista-Bernal, I.; Quintana-García, C.; Marchante-Lara, M. Research trends in occupational health and social responsibility: A bibliometric analysis. Saf. Sci. 2021, 137, 105167. [Google Scholar] [CrossRef]
- Vaquero-Álvarez, E.; Cubero-Atienza, A.; Ruiz-Martínez, P.; Vaquero-Abellán, M.; Redel Mecías, M.D.; Aparicio-Martínez, P. Bibliometric Study of Technology and Occupational Health in Healthcare Sector: A Worldwide Trend to the Future. Int. J. Environ. Res. Public Health 2020, 17, 6732. [Google Scholar] [CrossRef] [PubMed]
- Van Eck, N.J.; Waltman, L. Software survey: VOSiewer, a computer program for bibliometric mapping. Scientometrics 2010, 84, 523–538. [Google Scholar] [CrossRef] [PubMed]
- MapChart Software. Available online: https://www.mapchart.net/index.html (accessed on 30 March 2022).
- Charlson, M.E.; Pompei, P.; Ales, K.L.; Mackenzie, C.R. A new method of classifying prognostic co-morbidity in longitudinal-studies-development and validation. J. Chronic Dis. 1987, 40, 373–383. [Google Scholar] [CrossRef]
- Miles, A.A.; Misra, S.S.; Irwin, J.O. The estimation of the bactericidal power of the blood. J. Hyg. 1938, 38, 732–749. [Google Scholar] [CrossRef]
- Wang, C.; Pan, R.; Wan, X.; Tan, Y.; Xu, L.; Ho, C.; Ho, R.C. Immediate Psychological Responses and Associated Factors during the Initial Stage of the 2019 Coronavirus Disease (COVID-19) Epidemic among the General Population in China. Int. J. Environ. Res. Public Health 2020, 17, 1729. [Google Scholar] [CrossRef]
- Liu, B.; Liu, S.; Alastra, A.J.G.; Mahato, D.; Tayag, E.C.; Cortez, V.A.; Siddiqi, F. The 100 Most Cited vs. Most Relevant Articles in the Journal of Neurosurgery: A Bibliometric Analysis. Cureus 2019, 11, 4498. [Google Scholar] [CrossRef]
- Banerjee, F.; Khatri, N.; Kaur, A.; Elhence, A. Bibliometric Analysis of Top 100 Systematic Revieews and Meta-analyses in Orthopaedic Literature. Indian J. Orthop. 2022, 56, 762–770. [Google Scholar] [CrossRef]
- Khatra, O.; Shadgan, A.; Taunton, J.; Pakravan, A.; Shadgan, B. A bibliometric Analysis of the Top Cited Articles in Sports and Exercise Medicine. Orthop. J. Sports Med. 2021, 9, 2325967120969902. [Google Scholar] [CrossRef]
- Almutairi, O.; Albakr, A.; Al-Habib, A.; Ajlan, A. The Top-100 Most-cited Articles on Meningioma. World Neurosurg. 2017, 107, 1025–1032. [Google Scholar] [CrossRef]
- Karsli, B.; Bahadir Tekin, S. The Top 100 Most-Cited Articles on Ankle Arthroscopy: Bibliometric Analysis. J. Foot Ankle Surg. 2021, 60, 477–481. [Google Scholar] [CrossRef] [PubMed]
- Bruni, A.; Giulia Serra, F.; Gallo, V.; Deregibus, A.; Castroflorio, T. The 50 most-cited articles on clear aligner treatment: A bibliometric and visualized analysis. Am. J. Orthod. Dentofacial. Orthop. 2021, 159, e41–e48. [Google Scholar] [CrossRef] [PubMed]
- Plaza, J.A.; Primo, E.; Bojo, C. Informe del Grupo de Análisis Científico Sobre Coronavirus del ISCIII. Madrid. 2020. Available online: https://www.conprueba.es/sites/default/files/noticias/2020-05/DIFUSI%C3%93N%20Y%20COMUNICACI%C3%93N%20DE%20LA%20CIENCIA_1.pdf (accessed on 12 July 2022).
- Cáceres Castellanos, G. La Importancia de Publicar los Resultados de Investigación. Rev. Fac. Ing. 2014, 23, 7–8. Available online: http://www.scielo.org.co/scielo.php?script=sci_arttext&pid=S0121-11292014000200001 (accessed on 4 April 2022).
- Bray, F.; Ferlay, J.; Soerjonmataram, I.; Siegel, R.L.; Torre, J.A.; Jemal, A. Global cancer statistics 2018: GLOBOCAN estimates of incidence and mortality worldwide for 36 cancers in 185 countries. CA Cancer J. Clin. 2021, 68, 394–424. [Google Scholar] [CrossRef]
- Kassler, R.C.; Berglund, P.; Demier, O.; Jin, R.; Walters, E.E. Lifetime prevalence and age-of-onset distributions’ of DSM-IV disorders in the national comorbidity survey replication. Arch. Gen. Psychiatry 2005, 62, 593–602. [Google Scholar] [CrossRef]
- Mattsson, P.; Sundberg, C.J.; Laget, P. Is correspondence reflected in the author position? A bibliometric study of the relation between corresponding author and byline position. Scientometrics 2011, 87, 99–105. [Google Scholar] [CrossRef]
- Tscharntke, T.; Hochberg, M.E.; Rand, T.A.; Resh, V.H.; Krauss, J. Author Sequence and Credit for Contributions in Multiauthored Publications. PloS Biol. 2007, 5, e18. [Google Scholar] [CrossRef]
- Reverter-Masia, J.; Hernández-González, V.; Jové-Deltell, C.; Legaz-Arrese, A. Indicadores de producción de los profesores de Educación Física y Didáctica de la Expresión Corporal en España en Web of Science. Perspec. Cienci. Inform. 2013, 18, 3–23. [Google Scholar] [CrossRef]
- Ortega-Rubio, A.; Murillo-Amador, B.; Troyo-Diéguez, E.; Valdez-Cepeda, D. El índice h: Sobrevaloración de su uso en la estimación del impacto del que hacer científico en México. Terra Latinoam. 2021, 39, 895. Available online: http://www.scielo.org.mx/scielo.php?script=sci_arttext&pid=S0187-57792021000100301 (accessed on 14 March 2022). [CrossRef]
- Jung, N.; Ruiz-León, A.A. Lo local y lo global de la colaboración científica: ¿qué significa y cómo visualizarlo y medirlo? Rev. Esp. Doc. Cien. 2018, 41, e203. [Google Scholar] [CrossRef]
- Russell, J.M.; Madera Jaramillo, M.J.; Ainsworth, S. El análisis de redes en el estudio de la colaboración científica. Rev. Hisp. Anál. Redes Soc. 2009, 17, 39–47. Available online: http://revista-redes.rediris.es/html-vol17/vol17_2.htm (accessed on 2 April 2022). [CrossRef]
- Ekundayo, T.C.; Okoh, A.I. A global bibliometric analysis of Plesiomonas-related research (1990–2017). PLoS ONE 2018, 13, e0207655. [Google Scholar] [CrossRef] [PubMed]
- Alarcon, M.A.; Esparza, D.; Montoya, C.; Monje, A.; Faggion, C.M., Jr. The 300 most-cited articles in implant dentistry. Int. J. Oral Maxillofac. Implant 2017, 32, e1–e8. [Google Scholar] [CrossRef] [PubMed]
- Ogunsakin, R.E.; Ebenezer, O.; Ginindza, T.G. A Bibliometric Analysis of the Literature on Norovirus Disease from 1991–2021. Int. J. Environ. Res. Public Health 2022, 19, 2508. [Google Scholar] [CrossRef]
- Pasterkamp, G.; Rotmans, J.; de Kleijn, D.; Borst, C. Citation frequency: A biased measure of research impact significantly influenced by the geographical origin of research articles. Scientometrics 2007, 70, 153–165. [Google Scholar] [CrossRef]
- Eshraghi, A.; Abu Osman, N.A.; Gholizadeh, H.; Ali, S.; Shadgan, B. 100 top-cited scientific papers in limb prosthetics. BioMed. Eng. OnLine 2013, 12, 119. [Google Scholar] [CrossRef]
- Wang, X.; Liu, D.; Ding, K.; Wang, X. Science funding and research output: A study on 10 countries. Scientometrics 2012, 91, 591–599. [Google Scholar] [CrossRef]
- World Health Organization (WHO). Annual Report. Access to Medicines and Health Products Programme; WHO: Geneva, Switzerland, 2020. [Google Scholar]
- Song, R.; Xu, H.; Cai, L. Academic Collaboration in Entrepreneurship Research from 2009 to 2018: A Multilevel Collaboration Network Analysis. Sustainability 2019, 11, 5172. [Google Scholar] [CrossRef]
- Jirotka, M.; Lee, C.P.; Olson, G.M. Supporting scientific collaboration: Methods, tools and concepts. Comput. Supported Coop. Work. 2013, 22, 667–715. [Google Scholar] [CrossRef]
- Bradford, S.C. Sources of information on specific subjects. Engineering 1934, 137, 85–86. [Google Scholar]
- Highhouse, S.; Zickar, M.J.; Melick, S.R. Prestige and relevance of the scholarly journals: Impressions of SIOP members. Ind. Organ. Psychol. 2020, 13, 273–290. [Google Scholar] [CrossRef]
- Torres-Salinas, D.; Cabezas-Clavijo, A. Cómo Publicar en Revistas Científicas de Impacto: Consejos y Reglas Sobre Publicación Científica. EC Working Paper 31. 2013. Available online: https://digibug.ugr.es/bitstream/handle/10481/28137/C%F3mo%20Publicar%20en%20Revistas%20Cient%EDficas.pdf?sequence=1 (accessed on 22 May 2020).
- Derntl, M. Basic of research paper writing and publishing. Int. J. Technol. Enhanc. Learn. 2014, 6, 105–123. Available online: https://www.researchgate.net/profile/Arvind-Singh-21/post/How-to-publish-a-research-paper/attachment/5ae4197bb53d2f63c3c8949b/AS%3A620282041606144%401524898171221/download/paperwriting.pdf (accessed on 12 July 2022). [CrossRef]
- Hernández-González, V.; Sans-Rosell, N.; Jové-Deltell, M.C.; Reverter-Masia, J. Comparación entre Web of Science y Scopus. Estudio bibliométrico de las Revistas de Anatomía y Morfología. Int. J. Morphol. 2016, 34, 1369–1377. [Google Scholar] [CrossRef]
- Livas, C.; Delli, K. Journal self-citation rates and impact factors in dentistry, oral surgery, and medicine: A 3-year bibliometric analysis. J. Evid. Based Dent. Pract. 2018, 18, 269–274. [Google Scholar] [CrossRef]
- Ioannidis, J.P.A.; Baas, J.; Klavans, R.; Boyack, K.W. A standardized citation metrics author database annotated for scientific field. PLoS Biol. 2019, 17, e3000384. [Google Scholar] [CrossRef]
- Gonzalez-Pereira, B.; Guerrero-Bote, V.P.; Moya-Anegon, F. A new approach to the metric of journals’ scientific prestige: The SJR indicator. J. Inform. 2010, 4, 379–391. [Google Scholar] [CrossRef]
- Bergstrom, C. Eigenfactor: Measuring the value and prestige of scholarly journals. Coll. Res. Libr. News 2007, 68, 314–316. [Google Scholar] [CrossRef]


Publisher’s Note: MDPI stays neutral with regard to jurisdictional claims in published maps and institutional affiliations. |
© 2022 by the authors. Licensee MDPI, Basel, Switzerland. This article is an open access article distributed under the terms and conditions of the Creative Commons Attribution (CC BY) license (https://creativecommons.org/licenses/by/4.0/).