
Sustainable Working Life Patterns in a Swedish Twin Cohort: Age-Related Sequences of Sickness Absence, Disability Pension, Unemployment, and Premature Death during Working Life

 ,
,  , ,
, ,
Abstract
1. Introduction
1.1. Sample and Methods
- From Karolinska Institutet, the Swedish Twin Register (STR) was used to identify the study population and for background information (zygosity, sex and birthyear).
- From Statistics Sweden, the Longitudinal Integrated Database for Health Insurance and Labor Market Studies (LISA) [32] was used for sociodemographic information (educational level, degree of urbanization, marital status), unemployment and old-age pension.
- From the Swedish Social Insurance Agency, the register Micro Data for Analyses of Social Insurance (MiDAS) was used for information on sickness absence (SA) and disability pension (DP).
- From the Swedish Board of Health and Welfare, the Causes of Death Register was used for dates of death.
1.2. Sickness Insurance in Sweden
1.3. Individual Characteristics
1.4. Statistical Methods
- Sustainable working life: SA/DP 0–30 days and UE 0–90 days
- Unemployment >90 days: SA/DP 0–30 days and UE > 90 days
- Moderate SA/DP: SA/DP 30–180 days
- Almost full year of SA/DP: SA/DP 180–365 days
- Full year of SA/DP: SA/DP ≥ 365 days
- Death
- Old-age pension
2. Results
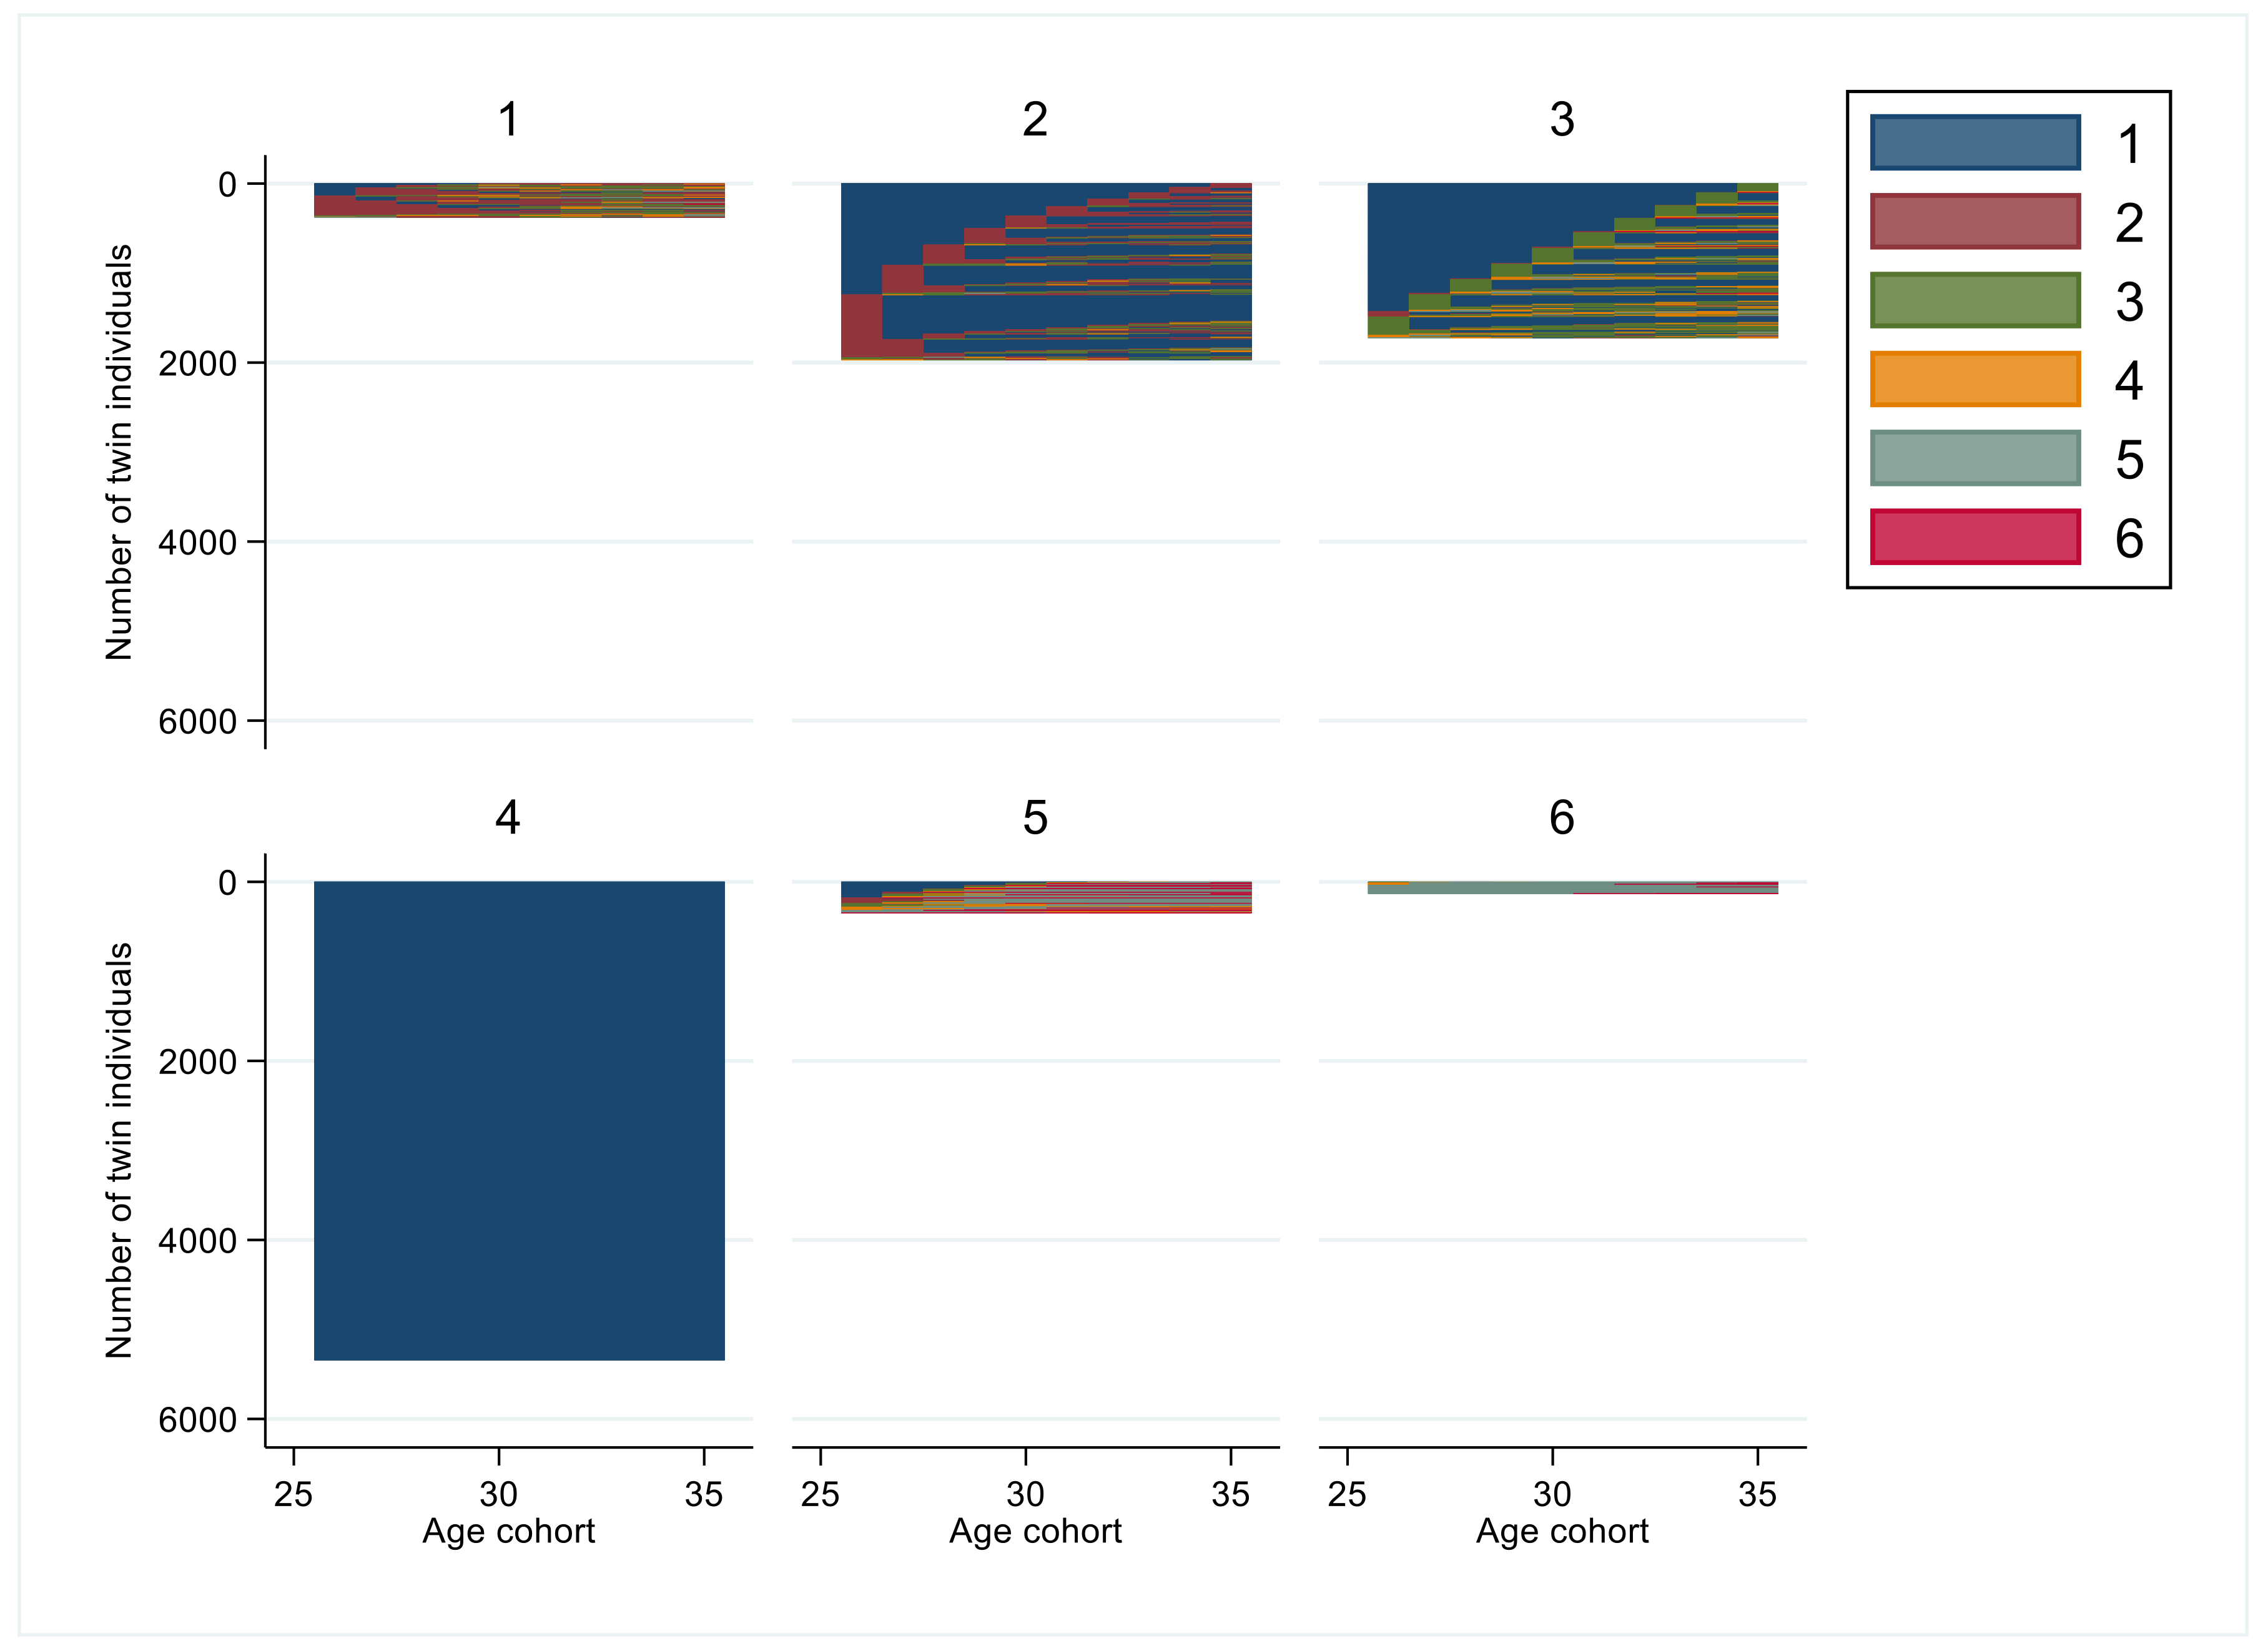
2.1. Sustainable Working Life Patterns of Age Cohort 26–35 Years
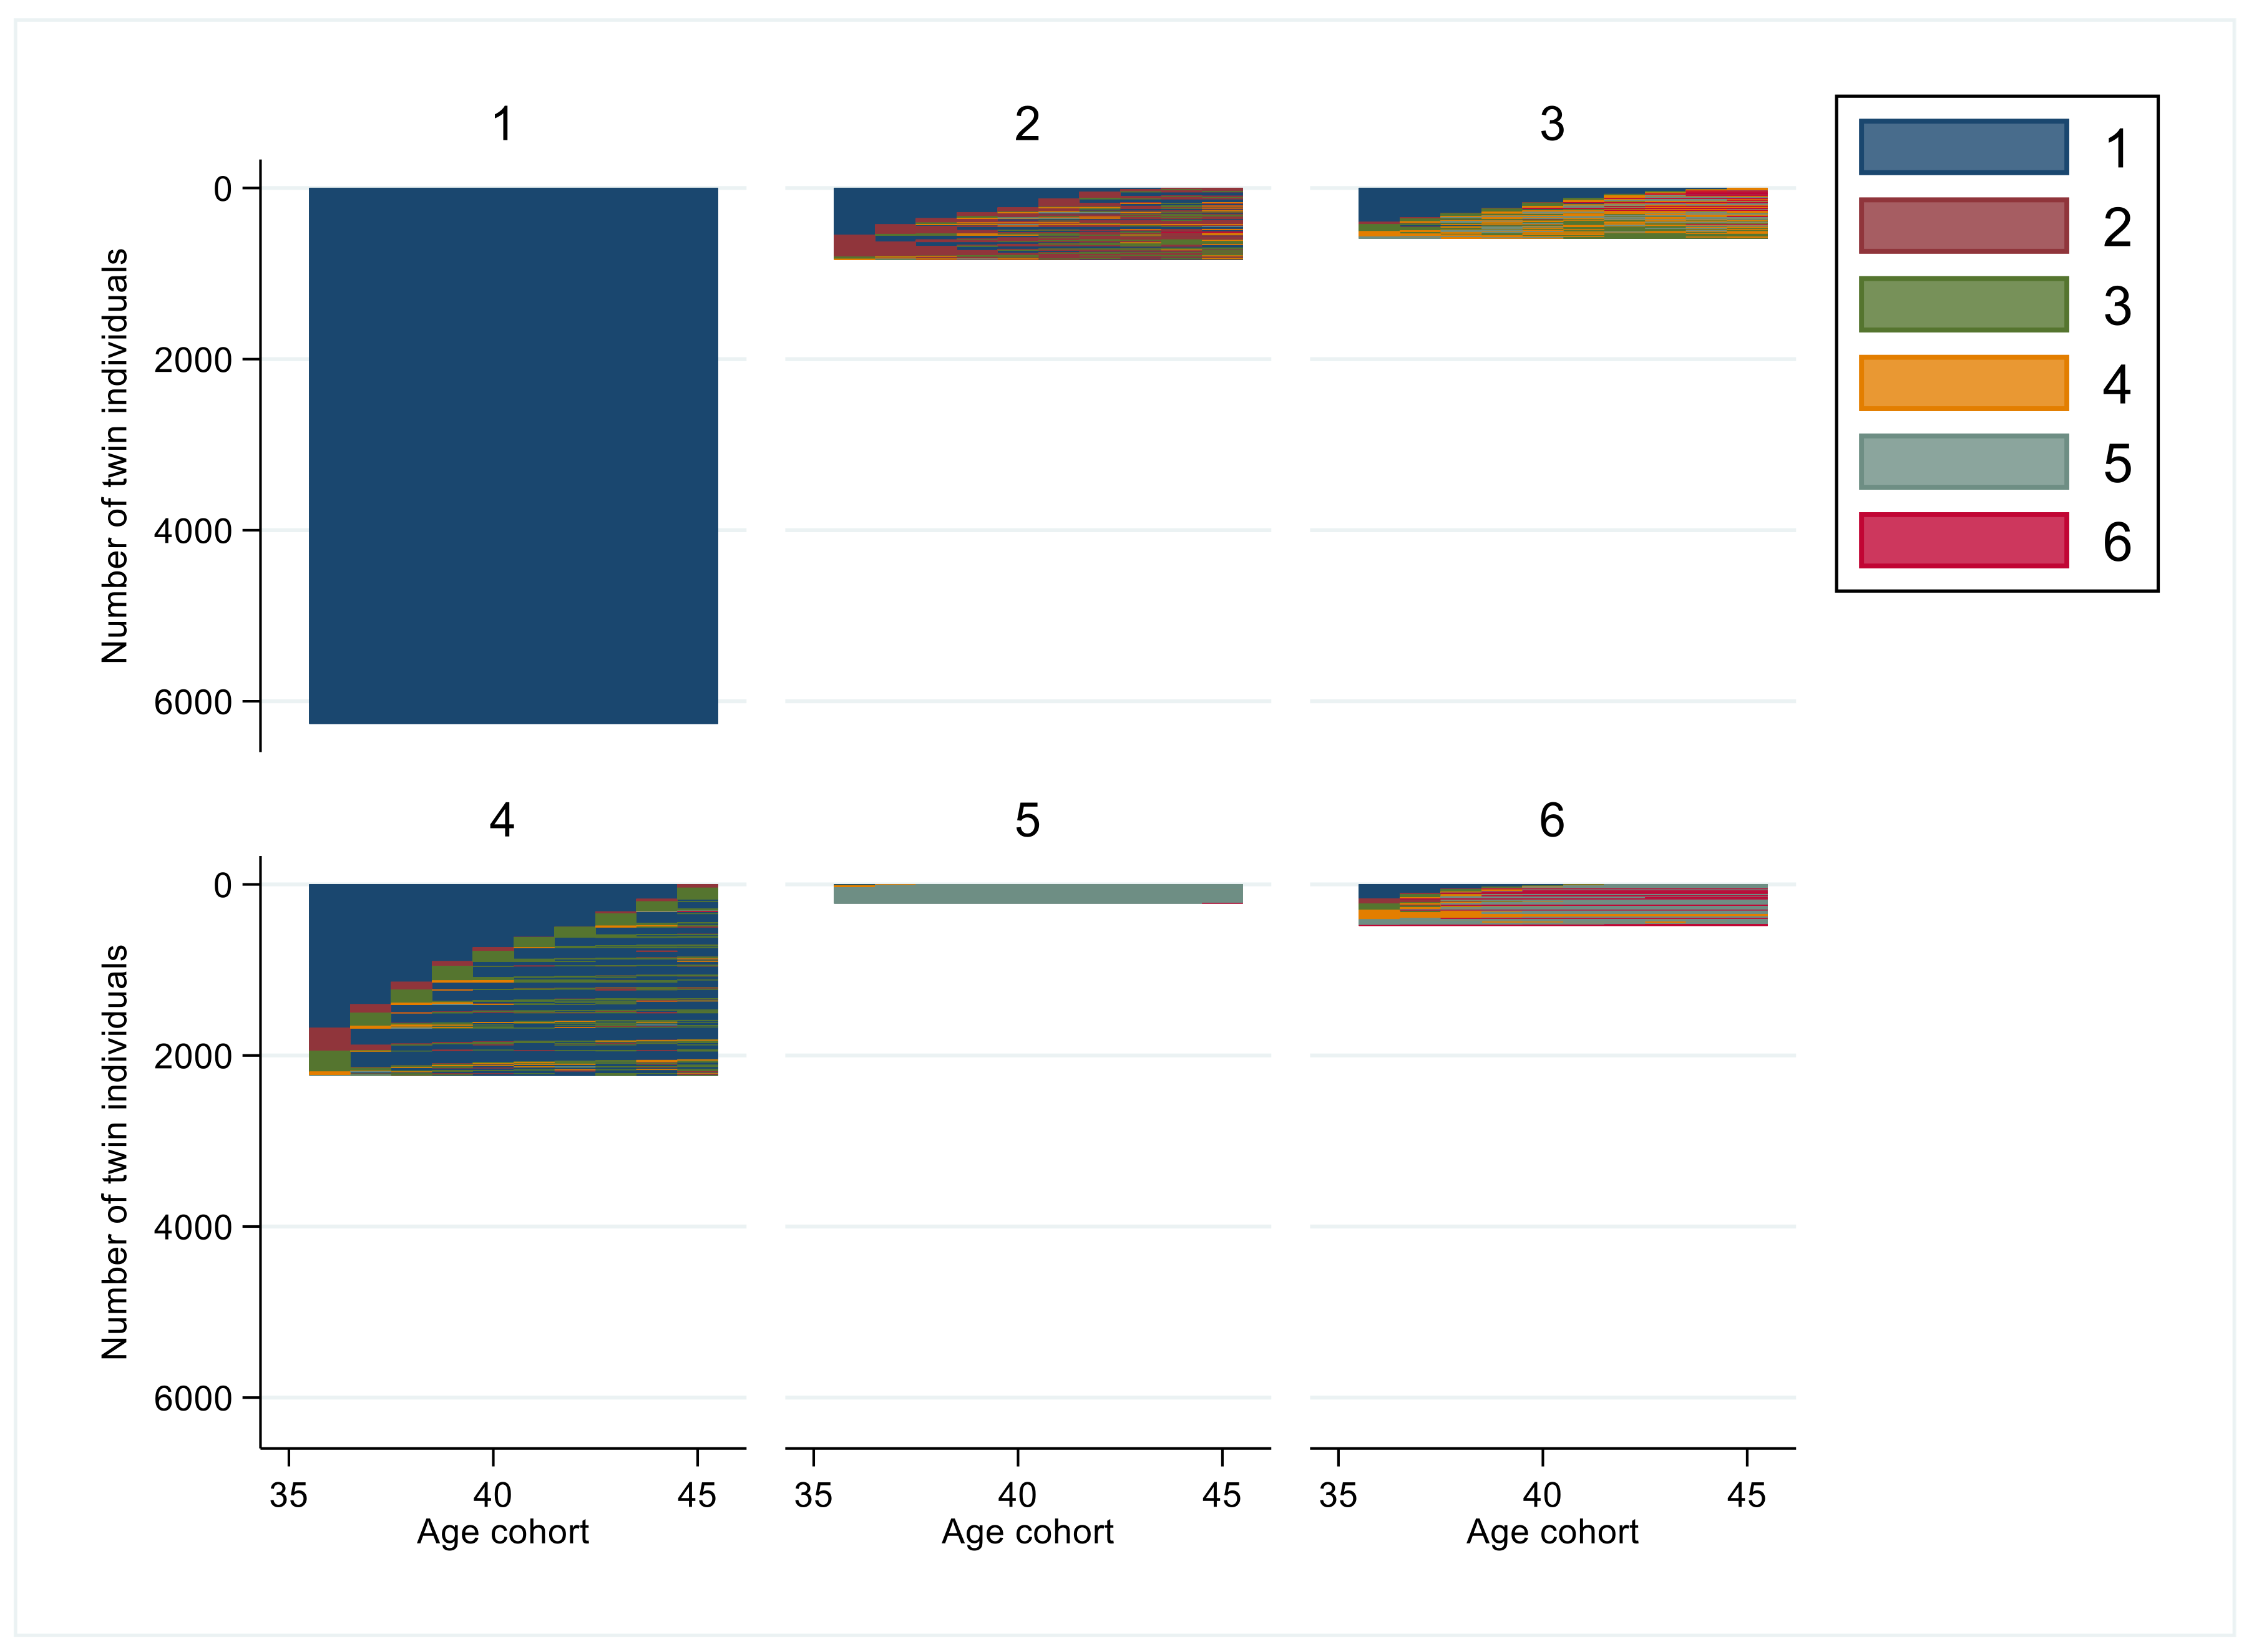
2.2. Sustainable Working Life Patterns of the Age Cohort 36–45 Years
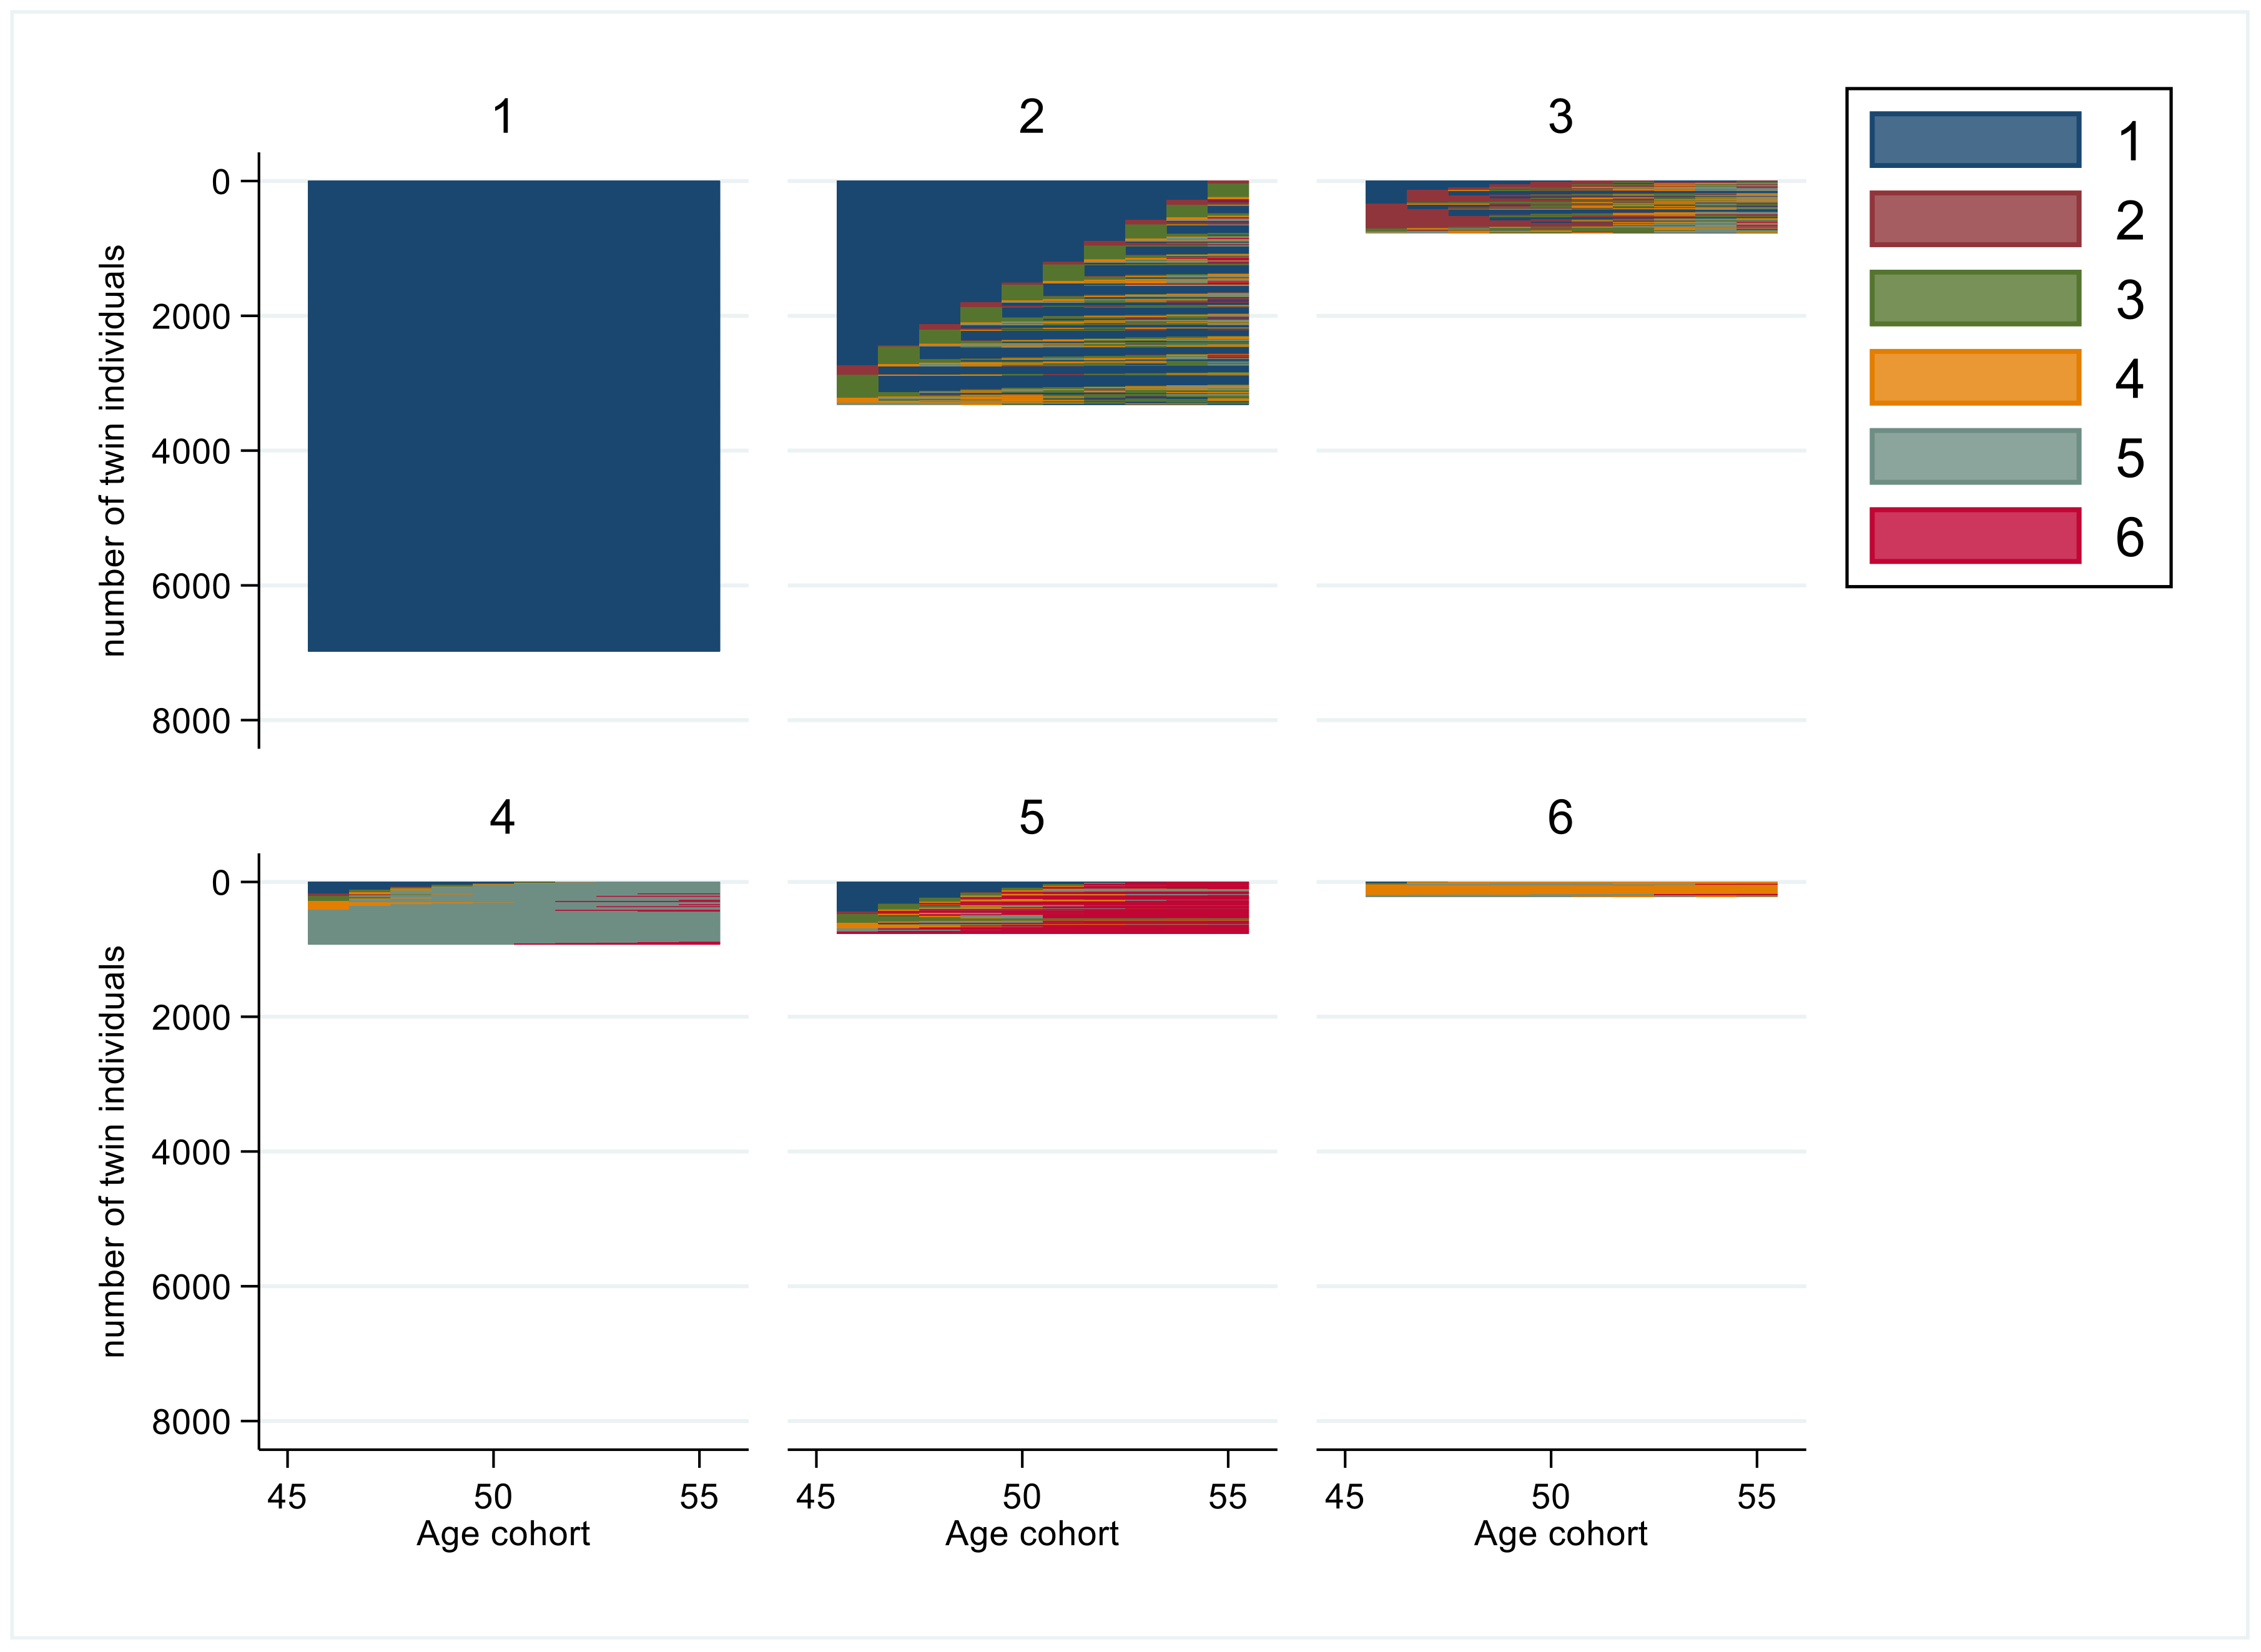
2.3. Sustainable Working Life Patterns of Age Cohort 46–55 Years
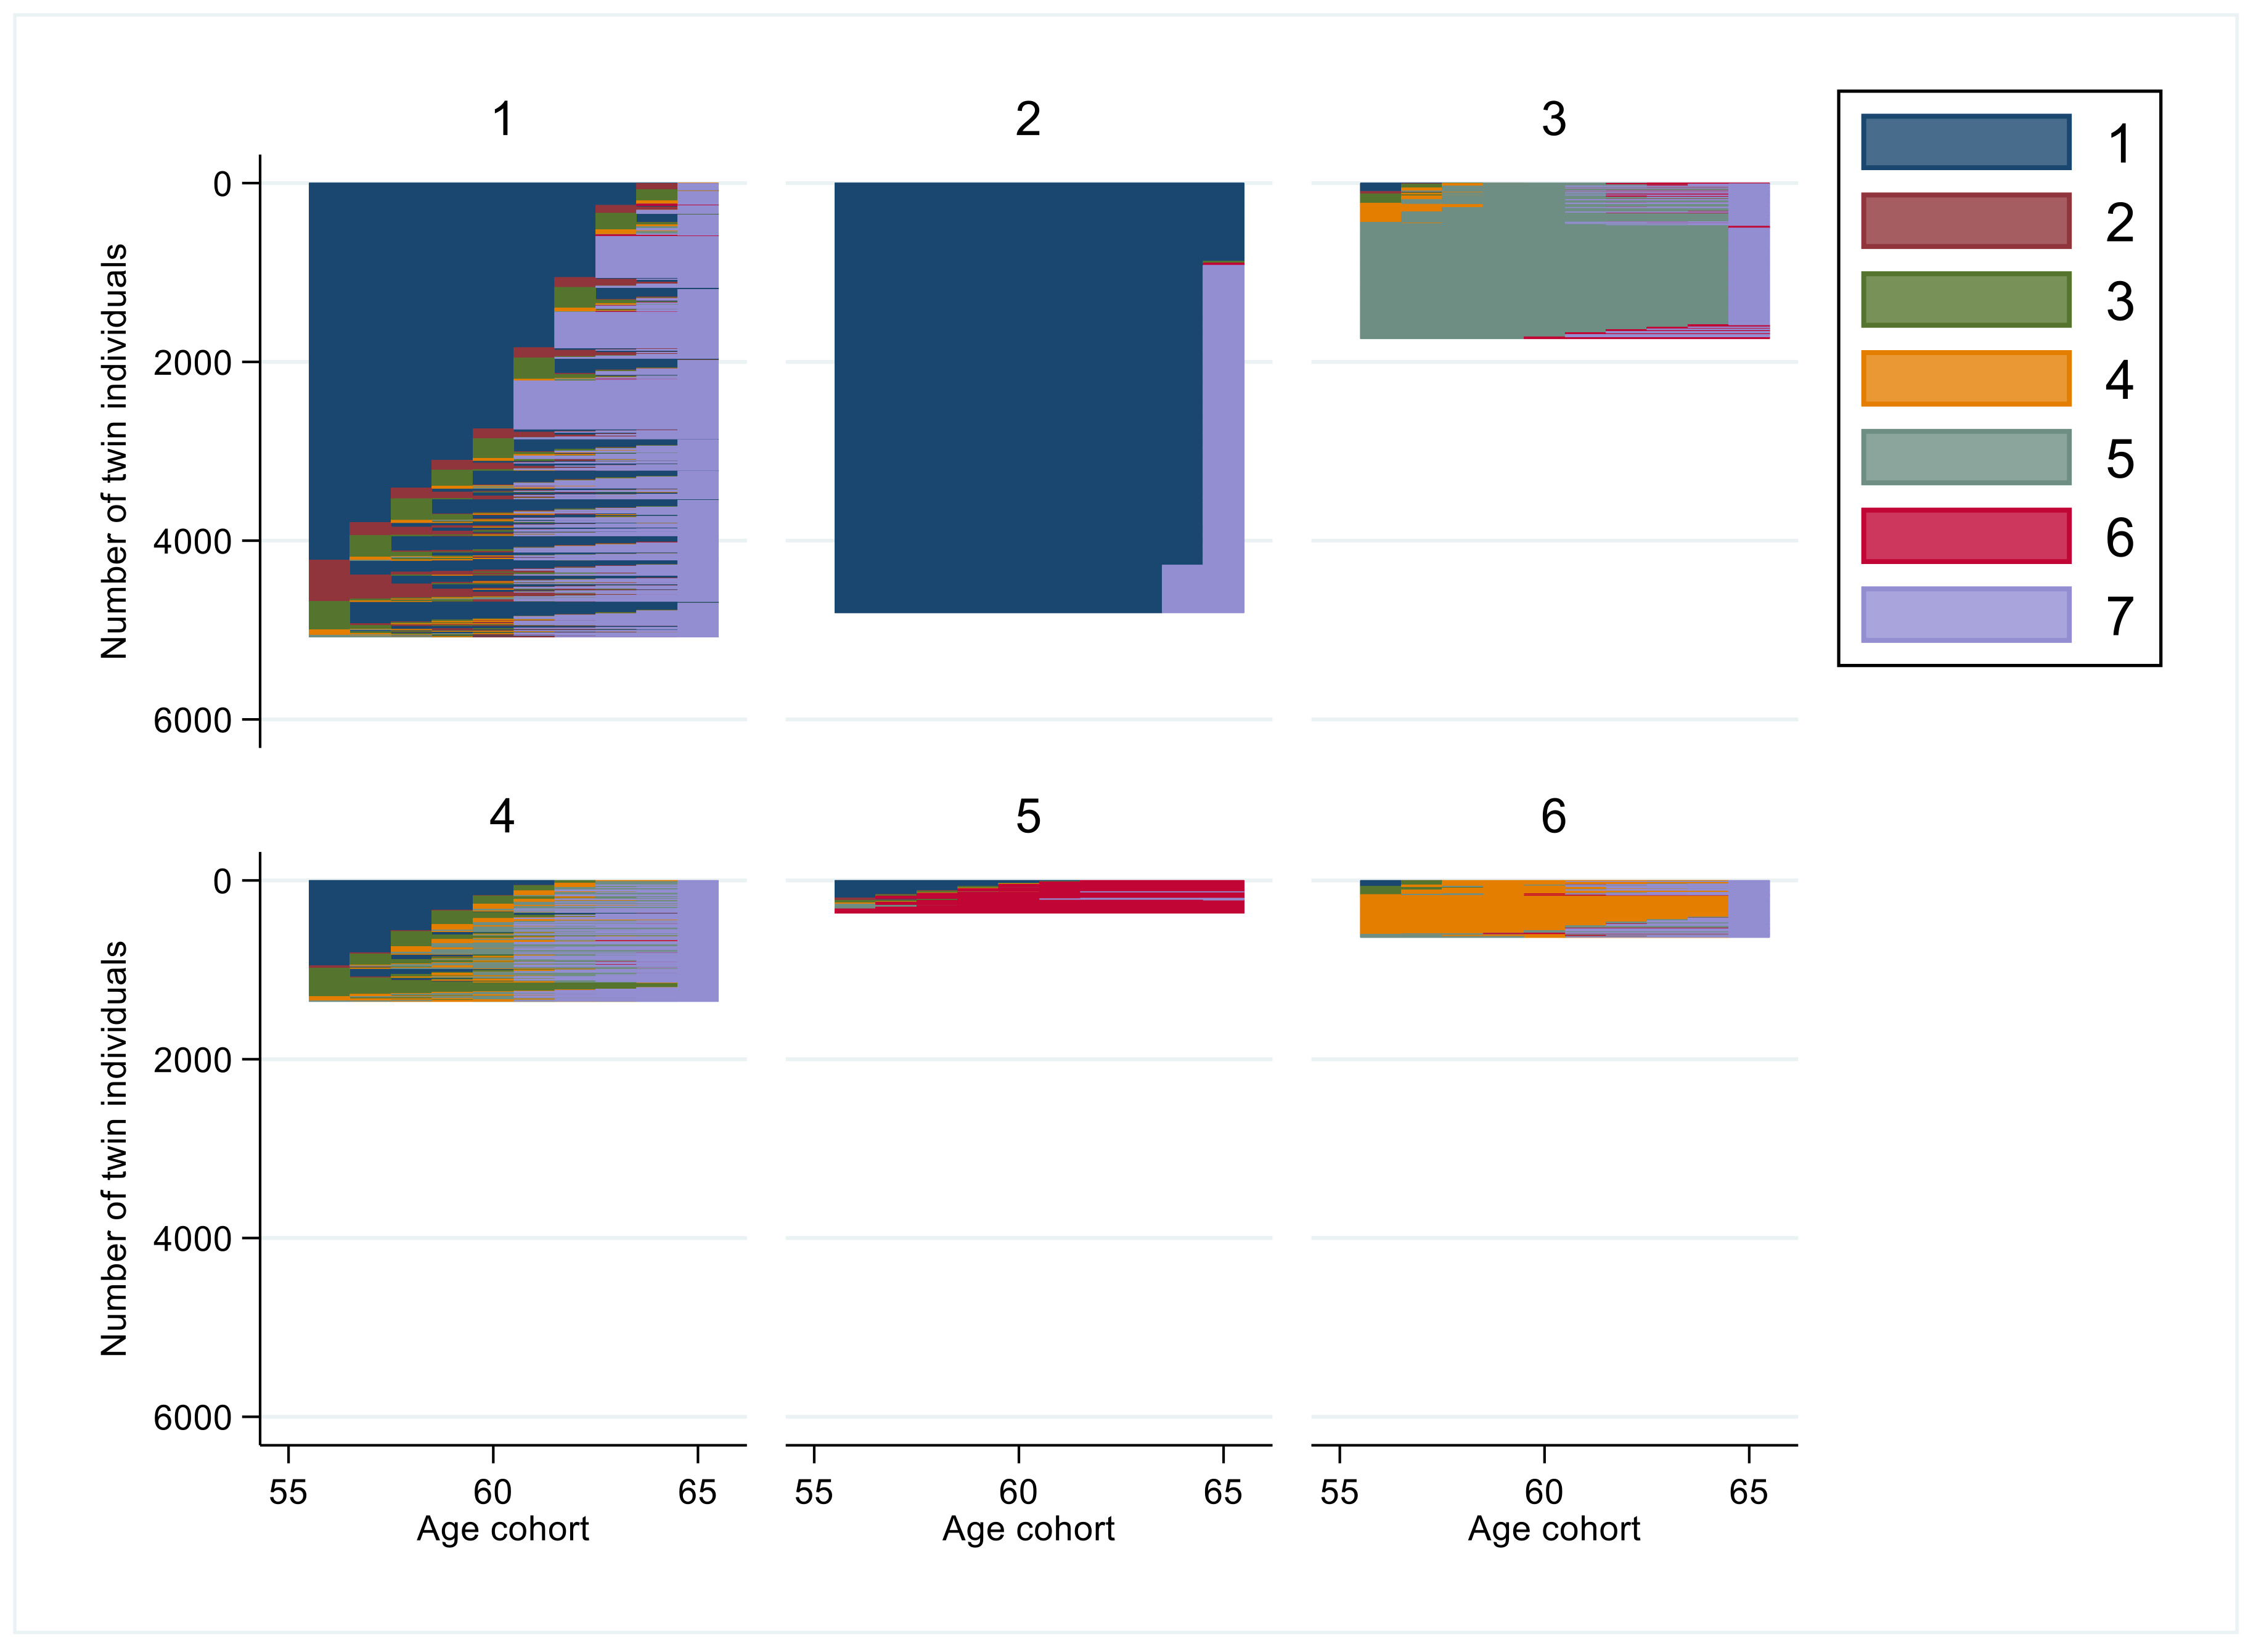
2.4. Sustainable Working Life Patterns of Age Cohort 56–65 Years
2.5. Familial Effects on Cluster Membership
3. Discussion
3.1. Sustainable Working Life Patterns of Age Cohorts
3.2. Individual Characteristics and Cluster Membership
3.3. Strengths and Limitations
4. Conclusions
Supplementary Materials
Author Contributions
Funding
Institutional Review Board Statement
Informed Consent Statement
Data Availability Statement
Acknowledgments
Conflicts of Interest
References
- Eurofound. Measuring Sustainable Work over the Life Course—Feasibility Study; European Foundation for the Improvement of Living and Working Conditions (Eurofound): Dublin, Ireland, 2018. [Google Scholar]
- Lynch, M.; Bucknall, M.; Jagger, C.; Wilkie, R. Projections of healthy working life expectancy in England to the year 2035. Nat. Aging 2022, 2, 13–18. [Google Scholar] [CrossRef]
- Shahbazian, R.; Bihagen, E. Does Your Class Give More than a Hint of Your Lifetime Earnings?: Assessing Indicators for Lifetime Earnings Over the Life Course for Sweden. Eur. Sociol. Rev. 2022, 38, 527–542. [Google Scholar] [CrossRef]
- Böckerman, P.; Ilmakunnas, P. Unemployment and Self-assessed Health: Evidence from Panel Data. Health Econ. 2009, 18, 161–179. [Google Scholar] [CrossRef] [PubMed]
- Kivimaki, M.; Head, J.; Ferrie, J.E.; Shipley, M.J.; Vahtera, J.; Marmot, M.G. Sickness absence as a global measure of health: Evidence from mortality in the Whitehall II prospective cohort study. BMJ 2003, 327, 364. [Google Scholar] [CrossRef] [PubMed]
- Eurofound. Sustainable Working Over the Life Course: Concept Paper; Publications Office of the European Union: Luxembourg, 2015. [Google Scholar]
- LoMartire, R.; Dahlström, Ö.; Björk, M.; Vixner, L.; Frumento, P.; Constan, L.; Gerdle, B.; Äng, B.O. Predictors of Sickness Absence in a Clinical Population With Chronic Pain. J. Pain 2021, 22, 1180–1194. [Google Scholar] [CrossRef] [PubMed]
- Kjeldgård, L.; Stigson, H.; Alexanderson, K.; Friberg, E. Sequence analysis of sickness absence and disability pension in the year before and the three years following a bicycle crash; a nationwide longitudinal cohort study of 6353 injured individuals. BMC Public Health 2020, 20, 1710. [Google Scholar] [CrossRef]
- Harrati, A.; Hepburn, P.; Meausoone, V.; Cullen, M.R. Characterizing Long-Term Trajectories of Work and Disability Leave: The Role of Occupational Exposures, Health, and Personal Demographics. J. Occup. Environ. Med. 2019, 61, 936–943. [Google Scholar] [CrossRef]
- Madsen, A.A. Return to work after first incidence of long-term sickness absence: A 10-year prospective follow-up study identifying labour-market trajectories using sequence analysis. Scand. J. Public Health 2020, 48, 134–143. [Google Scholar] [CrossRef]
- Lindholdt, L.; Labriola, M.; Nielsen, C.V.; Horsbol, T.A.; Lund, T. Sequence analysis to assess labour market participation following vocational rehabilitation: An observational study among patients sick-listed with low back pain from a randomised clinical trial in Denmark. BMJ Open 2017, 7, e015661. [Google Scholar] [CrossRef]
- Pedersen, P.; Lund, T.; Lindholdt, L.; Nohr, E.A.; Jensen, C.; Sogaard, H.J.; Labriola, M. Labour market trajectories following sickness absence due to self-reported all cause morbidity—A longitudinal study. BMC Public Health 2016, 16, 337. [Google Scholar] [CrossRef]
- Försäkringskassan. Barns Relativa Ålder och Funktionsnedsättning; Försäkringskassan: Stockholm, Sweden, 2016. [Google Scholar]
- Narusyte, J.; Ropponen, A.; Alexanderson, K.; Svedberg, P. Internalizing and externalizing problems in childhood and adolescence as predictors of work incapacity in young adulthood. Soc. Psychiatry Psychiatr. Epidemiol. 2017, 52, 1159–1168. [Google Scholar] [CrossRef]
- Hale, D.R.; Bevilacqua, L.; Viner, R.M. Adolescent Health and Adult Education and Employment: A Systematic Review. Pediatrics 2015, 136, 128–140. [Google Scholar] [CrossRef]
- Harkko, J.; Virtanen, M.; Kouvonen, A. Unemployment and work disability due to common mental disorders among young adults: Selection or causation? Eur. J. Public Health 2018, 28, 791–797. [Google Scholar] [CrossRef]
- Stansfeld, S.A.; Carr, E.; Smuk, M.; Clark, C.; Murray, E.; Shelton, N.; Head, J. Mid-life psychosocial work environment as a predictor of work exit by age 50. PLoS ONE 2018, 13, e0195495. [Google Scholar] [CrossRef]
- Nordstrom, K.; Hemmingsson, T.; Ekberg, K.; Johansson, G. Sickness absence in workplaces: Does it reflect a healthy hire effect? Int. J. Occup. Med. Environ. Health 2016, 29, 315–330. [Google Scholar] [CrossRef]
- Shao, Y.; Goštautaitė, B.; Wang, M.; Ng, T.W.H. Age and sickness absence: Testing physical health issues and work engagement as countervailing mechanisms in a cross-national context. Pers. Psychol. 2022, 1–33. [Google Scholar] [CrossRef]
- Rahman, S.; Mittendorfer-Rutz, E.; Dorner, T.E.; Pazarlis, K.; Ropponen, A.; Svedberg, P.; Wang, M.; Helgesson, M. Work-disability in low back pain patients with or without surgery, and the role of social insurance regulation changes in Sweden. Eur. J. Public Health 2019, 29, 524–530. [Google Scholar] [CrossRef]
- Serra, L.; Farrants, K.; Alexanderson, K.; Ubalde, M.; Lallukka, T. Trajectory analyses in insurance medicine studies: Examples and key methodological aspects and pitfalls. PLoS ONE 2022, 17, e0263810. [Google Scholar] [CrossRef]
- Ritschard, G.; Studer, M. (Eds.) Sequence Analysis and Related Approaches: Innovative Methods and Applications; Springer: Cham, Switzerland, 2018. [Google Scholar]
- Harkonmaki, K.; Silventoinen, K.; Levalahti, E.; Pitkaniemi, J.; Huunan-Seppala, A.; Klaukka, T.; Koskenvuo, M.; Kaprio, J. The genetic liability to disability retirement: A 30-year follow-up study of 24,000 Finnish twins. PLoS ONE 2008, 3, e3402. [Google Scholar] [CrossRef] [PubMed]
- Narusyte, J.; Ropponen, A.; Silventoinen, K.; Alexanderson, K.; Kaprio, J.; Samuelsson, A.; Svedberg, P. Genetic liability to disability pension in women and men: A prospective population-based twin study. PLoS ONE 2011, 6, e23143. [Google Scholar] [CrossRef]
- Gjerde, L.C.; Knudsen, G.P.; Czajkowski, N.; Gillespie, N.; Aggen, S.H.; Roysamb, E.; Reichborn-Kjennerud, T.; Tambs, K.; Kendler, K.S.; Orstavik, R.E. Genetic and environmental contributions to long-term sick leave and disability pension: A population-based study of young adult Norwegian twins. Twin Res. Hum. Genet. 2013, 16, 759–766. [Google Scholar] [CrossRef] [PubMed]
- Battie, M.C.; Videman, T.; Levalahti, E.; Gill, K.; Kaprio, J. Heritability of low back pain and the role of disc degeneration. Pain 2007, 131, 272–280. [Google Scholar] [CrossRef] [PubMed]
- Kendler, K.S.; Gatz, M.; Gardner, C.O.; Pedersen, N.L. A Swedish national twin study of lifetime major depression. Am. J. Psychiatry 2006, 163, 109–114. [Google Scholar] [CrossRef] [PubMed]
- Hettema, J.M.; Prescott, C.A.; Kendler, K.S. A population-based twin study of generalized anxiety disorder in men and women. J. Nerv. Ment. Dis. 2001, 189, 413–420. [Google Scholar] [CrossRef]
- Ropponen, A.; Wang, M.; Narusyte, J.; Silventoinen, K.; Böckerman, P.; Svedberg, P. Sustainable Working Life in a Swedish Twin Cohort-A Definition Paper with Sample Overview. Int. J. Environ. Res. Public Health 2021, 18, 5817. [Google Scholar] [CrossRef]
- Wang, M.; Svedberg, P.; Narusyte, J.; Farrants, K.; Ropponen, A. Effects of age on psychosocial working conditions and future labour market marginalisation: A cohort study of 56,867 Swedish twins. Int. Arch. Occup. Environ. Health 2021, 95, 199–211. [Google Scholar] [CrossRef]
- Mather, L.; Ropponen, A.; Mittendorfer-Rutz, E.; Narusyte, J.; Svedberg, P. Health, work and demographic factors associated with a lower risk of work disability and unemployment in employees with lower back, neck and shoulder pain. BMC Musculoskelet. Disord. 2019, 20, 622. [Google Scholar] [CrossRef]
- Ludvigsson, J.F.; Svedberg, P.; Olen, O.; Bruze, G.; Neovius, M. The longitudinal integrated database for health insurance and labour market studies (LISA) and its use in medical research. Eur. J. Epidemiol. 2019, 34, 423–437. [Google Scholar] [CrossRef]
- Zagai, U.; Lichtenstein, P.; Pedersen, N.L.; Magnusson, P.K.E. The Swedish Twin Registry: Content and Management as a Research Infrastructure. Twin Res. Hum. Genet. 2019, 22, 672–680. [Google Scholar] [CrossRef]
- Eurostat. Applying the Degree of Urbanisation. A Methodological Manual to Define Cities, Towns and Rural Areas for International Comparisons—2021 Edition; Publications Office of the European Union: Luxembourg, 2021. [Google Scholar]
- Halpin, B. Introduction to sequence analysis. In Event History Analysis with Stata, 2nd ed.; Blossfeld, H.-P., Rohwer, G., Schneider, T., Eds.; Routledge: New York, NY, USA, 2019. [Google Scholar]
- Brzinsky-Fay, C.; Kohler, U.; Luniak, M. Sequence analysis with Stata. Stata J. 2006, 6, 435–460. [Google Scholar] [CrossRef]
- Halpin, B. SADI: Sequence Analysis Tools for Stata. Stata J. 2017, 17, 546–572. [Google Scholar] [CrossRef]
- Nilsson, K. A sustainable working life for all ages—The swAge-model. Appl. Ergon. 2020, 86, 103082. [Google Scholar] [CrossRef]


| Study Cohorts (Based on Follow-Up Age Periods) | ||||||||
|---|---|---|---|---|---|---|---|---|
| 26–35 Years | 36–45 Years | 46–55 Years | 56–65 Years | |||||
| n | % | n | % | n | % | n | % | |
| Total (n of individuals in the final sample) | 9892 | 10,620 | 12,964 | 13,974 | ||||
| Zygosity | ||||||||
| MZ | 5758 | 58 | 4944 | 47 | 5188 | 40 | 5572 | 40 |
| DZ | 4134 | 42 | 5676 | 53 | 7776 | 60 | 8402 | 60 |
| Sex | ||||||||
| Men | 4562 | 46 | 5020 | 47 | 6370 | 49 | 6606 | 47 |
| Women | 5330 | 54 | 5600 | 53 | 6594 | 51 | 7368 | 53 |
| Education level | ||||||||
| Elementary (≤9 years) | 789 | 8 | 1073 | 10 | 2691 | 21 | 4499 | 32 |
| High school (10–12 years) | 5381 | 54 | 5940 | 56 | 6349 | 49 | 6157 | 44 |
| University/college (>12 years) | 3722 | 38 | 3607 | 34 | 3924 | 30 | 3318 | 24 |
| Degree of urbanization | ||||||||
| Cities (densely populated areas) | 4471 | 45 | 3943 | 37 | 4183 | 32 | 4298 | 31 |
| Towns and suburbs (intermediate density areas) | 3785 | 38 | 4511 | 42 | 5590 | 43 | 6302 | 45 |
| Rural areas (thinly populated areas) | 1636 | 17 | 2166 | 20 | 3191 | 25 | 3374 | 24 |
| Married | ||||||||
| No | 9223 | 93 | 6079 | 57 | 5517 | 43 | 5069 | 36 |
| Yes | 669 | 7 | 4541 | 43 | 7447 | 57 | 8905 | 64 |
| n | % | Years in State | Most Frequent Sequence Order | |||||||||
|---|---|---|---|---|---|---|---|---|---|---|---|---|
| 1 | 2 | 3 | 4 | 5 | 6 | 7 | Order | n | % | |||
| 26–35 years of age | ||||||||||||
| Cluster group 1 | 377 | 4 | 4.65 | 4.71 | 0.47 | 0.13 | 0.05 | 0.00 | 0.00 | 2 --> 1 --> 2 --> 1 | 65 | 17 |
| Cluster group 2 | 1971 | 20 | 8.11 | 1.70 | 0.18 | 0.02 | 0.00 | 0.00 | 0.00 | 1 --> 2 --> 1 | 794 | 40 |
| Cluster group 3 | 1726 | 17 | 8.08 | 0.20 | 1.47 | 0.21 | 0.03 | 0.01 | 0.00 | 1 --> 3 --> 1 | 766 | 44 |
| Cluster group 4 | 5341 | 54 | 10.00 | 0.00 | 0.00 | 0.00 | 0.00 | 0.00 | 0.00 | 1 | 5341 | 100 |
| Cluster group 5 | 346 | 3 | 2.89 | 0.77 | 2.08 | 2.03 | 1.92 | 0.31 | 0.00 | 1 --> 4 --> 5 | 11 | 3 |
| Cluster group 6 | 131 | 1 | 0.05 | 0.02 | 0.21 | 0.83 | 8.75 | 0.15 | 0.00 | 5 | 70 | 53 |
| Total | 9892 | 8.70 | 0.58 | 0.39 | 0.13 | 0.19 | 0.02 | 0.00 | ||||
| 36–45 years of age | ||||||||||||
| Cluster group 1 | 6261 | 59 | 10.00 | 0.00 | 0.00 | 0.00 | 0.00 | 0.00 | 0.00 | 1 | 6261 | 100 |
| Cluster group 2 | 836 | 8 | 6.53 | 3.04 | 0.34 | 0.07 | 0.01 | 0.00 | 0.00 | 1 --> 2 --> 1 | 280 | 33 |
| Cluster group 3 | 589 | 6 | 5.69 | 0.38 | 2.20 | 1.32 | 0.29 | 0.12 | 0.00 | 1 --> 4 | 28 | 5 |
| Cluster group 4 | 2233 | 21 | 8.48 | 0.42 | 1.01 | 0.08 | 0.01 | 0.00 | 0.00 | 1 --> 3 --> 1 | 853 | 38 |
| Cluster group 5 | 220 | 2 | 0.04 | 0.01 | 0.08 | 0.28 | 9.60 | 0.00 | 0.00 | 5 | 158 | 72 |
| Cluster group 6 | 481 | 5 | 1.66 | 0.55 | 1.27 | 3.39 | 2.72 | 0.41 | 0.00 | 4 | 30 | 6 |
| Total | 10,620 | 8.58 | 0.37 | 0.42 | 0.26 | 0.34 | 0.03 | 0.00 | ||||
| 46–55 years of age | ||||||||||||
| Cluster group 1 | 6978 | 54 | 10.00 | 0.00 | 0.00 | 0.00 | 0.00 | 0.00 | 0.00 | 1 | 6978 | 100 |
| Cluster group 2 | 3315 | 26 | 8.11 | 0.36 | 1.19 | 0.27 | 0.06 | 0.01 | 0.00 | 1 --> 3 --> 1 | 1107 | 33 |
| Cluster group 3 | 768 | 6 | 5.65 | 3.54 | 0.53 | 0.17 | 0.10 | 0.01 | 0.00 | 1 --> 2 --> 1 | 141 | 18 |
| Cluster group 4 | 925 | 7 | 0.64 | 0.12 | 0.37 | 0.72 | 8.03 | 0.12 | 0.00 | 5 | 433 | 47 |
| Cluster group 5 | 762 | 6 | 2.69 | 0.21 | 2.65 | 2.05 | 0.69 | 1.70 | 0.00 | 1 --> 6 | 58 | 8 |
| Cluster group 6 | 216 | 2 | 0.10 | 0.00 | 0.32 | 9.04 | 0.49 | 0.05 | 0.00 | 4 | 123 | 57 |
| Total | 12,964 | 8.00 | 0.32 | 0.52 | 0.40 | 0.64 | 0.11 | 0.00 | ||||
| 56–65 years of age | ||||||||||||
| Cluster group 1 | 5076 | 36 | 6.19 | 0.76 | 0.61 | 0.14 | 0.06 | 0.04 | 2.21 | 1 --> 7 | 1392 | 27 |
| Cluster group 2 | 4804 | 34 | 9.07 | 0.00 | 0.00 | 0.00 | 0.00 | 0.00 | 0.92 | 1 --> 7 | 3885 | 81 |
| Cluster group 3 | 1740 | 12 | 0.07 | 0.03 | 0.12 | 0.36 | 8.04 | 0.34 | 1.04 | 5 --> 7 | 1127 | 65 |
| Cluster group 4 | 1353 | 10 | 3.06 | 0.12 | 2.38 | 1.33 | 1.63 | 0.05 | 1.43 | 1 --> 4 --> 5 --> 7 | 148 | 11 |
| Cluster group 5 | 365 | 3 | 1.98 | 0.14 | 0.39 | 0.22 | 0.39 | 6.80 | 0.08 | 1 --> 6 | 105 | 29 |
| Cluster group 6 | 636 | 5 | 0.12 | 0.00 | 0.39 | 7.08 | 0.89 | 0.17 | 1.35 | 4 --> 7 | 294 | 46 |
| Total | 13,974 | 5.73 | 0.30 | 0.49 | 0.55 | 1.23 | 0.25 | 1.45 | ||||
| Age Group 26–35 Years | ||||||||||||
|---|---|---|---|---|---|---|---|---|---|---|---|---|
| Cluster Group 1 (n = 634) | Cluster Group 2 (n = 2698) | Cluster Group 3 (n = 2444) | Cluster Group 4 (n = 3674) | Cluster Group 5 (n = 548) | Cluster Group 6 (n = 190) | |||||||
| OR | 95% CI | OR | 95% CI | OR | 95% CI | OR | 95% CI | OR | 95% CI | OR | 95% CI | |
| Education level | ||||||||||||
| Elementary (≤9 years) | 1.00 | ref | 1.00 | ref | 1.00 | ref | 1.00 | ref | 1.00 | ref | 1.00 | ref |
| High school (10–12 years) | 1.28 | 0.73, 2.22 | 0.66 | 0.46, 0.95 | 1.09 | 0.76, 1.57 | 1.66 | 1.18, 2.33 | 1.32 | 0.73, 2.37 | 0.06 | 0.01, 0.26 |
| University/college (>12 years) | 0.81 | 0.37, 1.80 | 0.80 | 0.53, 1.22 | 0.78 | 0.51, 1.19 | 2.34 | 1.60, 3.42 | 0.53 | 0.25, 1.15 | 0.00 | 0.00, 0.00 |
| Degree of urbanization | ||||||||||||
| Cities (densely populated areas) | 1.00 | ref | 1.00 | ref | 1.00 | ref | 1.00 | ref | 1.00 | ref | 1.00 | ref |
| Towns and suburbs (intermediate density areas) | 0.88 | 0.50, 1.56 | 1.18 | 0.91, 1.52 | 1.15 | 0.87, 1.52 | 0.88 | 0.70, 1.09 | 0.86 | 0.43, 1.72 | 0.26 | 0.07, 1.00 |
| Rural areas (thinly populated areas) | 1.80 | 0.83, 3.91 | 0.95 | 0.66, 1.37 | 0.93 | 0.65, 1.34 | 0.93 | 0.70, 1.25 | 1.74 | 0.79, 3.83 | 0.27 | 0.01, 6.17 |
| Married | ||||||||||||
| No | 1.00 | ref | 1.00 | ref | 1.00 | ref | 1.00 | ref | 1.00 | ref | 1.00 | ref |
| Yes | 0.45 | 0.22, 0.92 | 1.19 | 0.82, 1.71 | 0.82 | 0.59, 1.15 | 1.17 | 0.86, 1.58 | 1.41 | 0.75, 2.64 | 0.04 | 0.00, 0.54 |
| Age group 36–45 years | ||||||||||||
| Cluster Group 1 (n = 4102) | Cluster Group 2 (n = 1356) | Cluster Group 3 (n = 1058) | Cluster Group 4 (n = 3326) | Cluster Group 5 (n = 332) | Cluster Group 6 (n = 766) | |||||||
| Education level | ||||||||||||
| Elementary (≤9 years) | 1.00 | ref | 1.00 | ref | 1.00 | ref | 1.00 | ref | 1.00 | ref | 1.00 | ref |
| High school (10–12 years) | 1.07 | 0.82, 1.39 | 0.84 | 0.57, 1.24 | 1.11 | 0.71, 1.73 | 1.35 | 1.02, 1.78 | 0.28 | 0.13, 0.64 | 0.85 | 0.55, 1.32 |
| University/college (>12 years) | 1.85 | 1.36, 2.51 | 0.48 | 0.29, 0.81 | 0.99 | 0.58, 1.71 | 1.06 | 0.76, 1.48 | 0.14 | 0.05, 0.43 | 0.34 | 0.18, 0.64 |
| Degree of urbanization | ||||||||||||
| Cities (densely populated areas) | 1.00 | ref | 1.00 | ref | 1.00 | ref | 1.00 | ref | 1.00 | ref | 1.00 | ref |
| Towns and suburbs (intermediate density areas) | 0.94 | 0.77, 1.14 | 1.16 | 0.80, 1.67 | 1.08 | 0.73, 1.60 | 1.13 | 0.91, 1.41 | 1.21 | 0.58, 2.52 | 0.57 | 0.34, 0.94 |
| Rural areas (thinly populated areas) | 0.69 | 0.54, 0.88 | 1.39 | 0.89, 2.16 | 1.11 | 0.69, 1.79 | 1.27 | 0.97, 1.67 | 2.28 | 0.72, 7.17 | 0.83 | 0.48, 1.44 |
| Married | ||||||||||||
| No | 1.00 | ref | 1.00 | ref | 1.00 | ref | 1.00 | ref | 1.00 | ref | 1.00 | ref |
| Yes | 1.43 | 1.24, 1.66 | 0.66 | 0.51, 0.86 | 0.88 | 0.67, 1.17 | 0.87 | 0.74, 1.02 | 0.33 | 0.18, 0.60 | 0.98 | 0.70, 1.39 |
| Age Cohort 46–55 Years | ||||||||||||
|---|---|---|---|---|---|---|---|---|---|---|---|---|
| Cluster Group 1 (n = 5252) | Cluster Group 2 (n = 4730) | Cluster group 3 (n = 1300) | Cluster Group 4 (n = 1402) | Cluster Group 5 (n = 1404) | Cluster Group 6 (n = 420) | |||||||
| OR | 95% CI | OR | 95% CI | OR | 95% CI | OR | 95% CI | OR | 95% CI | OR | 95% CI | |
| Education level | ||||||||||||
| Elementary (≤9 years) | 1.00 | ref | 1.00 | ref | 1.00 | ref | 1.00 | ref | 1.00 | ref | 1.00 | ref |
| High school (10–12 years) | 1.01 | 0.84, 1.20 | 1.17 | 0.98, 1.41 | 0.95 | 0.69, 1.31 | 0.69 | 0.51, 0.94 | 1.26 | 0.90, 1.78 | 0.82 | 0.44, 1.53 |
| University/college (>12 years) | 1.44 | 1.16, 1.80 | 1.14 | 0.91, 1.44 | 0.56 | 0.36, 0.87 | 0.34 | 0.22, 0.53 | 1.00 | 0.64, 1.55 | 0.46 | 0.20, 1.07 |
| Degree of urbanization | ||||||||||||
| Cities (densely populated areas) | 1.00 | ref | 1.00 | ref | 1.00 | ref | 1.00 | ref | 1.00 | ref | 1.00 | ref |
| Towns and suburbs (intermediate density areas) | 1.08 | 0.91, 1.27 | 1.05 | 0.88, 1.26 | 0.75 | 0.52, 1.06 | 0.79 | 0.57, 1.11 | 1.02 | 0.73, 1.43 | 1.04 | 0.48, 2.25 |
| Rural areas (thinly populated areas) | 0.97 | 0.78, 1.19 | 1.14 | 0.92, 1.42 | 0.71 | 0.48, 1.06 | 0.75 | 0.51, 1.11 | 1.07 | 0.71, 1.60 | 2.13 | 0.96, 4.75 |
| Married | ||||||||||||
| No | 1.00 | ref | 1.00 | ref | 1.00 | ref | 1.00 | ref | 1.00 | ref | 1.00 | ref |
| Yes | 1.44 | 1.28, 1.63 | 1.00 | 0.88, 1.13 | 0.71 | 0.55, 0.92 | 0.60 | 0.47, 0.75 | 0.62 | 0.49, 0.78 | 0.91 | 0.57, 1.43 |
| Age cohort 56–65 years | ||||||||||||
| Cluster Group 1 (n = 6040) | Cluster Group 2 (n = 5320) | Cluster Group 3 (n = 2456) | Cluster Group 4 (n = 2330) | Cluster Group 5 (n = 686) | Cluster Group 6 (n = 1140) | |||||||
| Education level | ||||||||||||
| Elementary (≤9 years) | 1.00 | ref | 1.00 | ref | 1.00 | ref | 1.00 | ref | 1.00 | ref | 1.00 | ref |
| High school (10–12 years) | 0.97 | 0.85, 1.12 | 1.28 | 1.09, 1.49 | 0.65 | 0.52, 0.79 | 0.99 | 0.78, 1.24 | 0.86 | 0.57, 1.30 | 1.32 | 0.96, 1.81 |
| University/college (>12 years) | 0.90 | 0.74, 1.09 | 1.70 | 1.38, 2.09 | 0.40 | 0.28, 0.57 | 1.05 | 0.76, 1.45 | 0.53 | 0.27, 1.07 | 1.18 | 0.76, 1.84 |
| Degree of urbanization | ||||||||||||
| Cities (densely populated areas) | 1.00 | ref | 1.00 | ref | 1.00 | ref | 1.00 | ref | 1.00 | ref | 1.00 | ref |
| Towns and suburbs (intermediate density areas) | 1.01 | 0.87, 1.17 | 1.01 | 0.85, 1.19 | 1.19 | 0.92, 1.53 | 0.81 | 0.63, 1.04 | 1.18 | 0.73, 1.90 | 0.98 | 0.67, 1.43 |
| Rural areas (thinly populated areas) | 0.91 | 0.75, 1.09 | 0.98 | 0.80, 1.20 | 1.30 | 0.97, 1.73 | 0.90 | 0.67, 1.21 | 1.23 | 0.67, 2.25 | 1.17 | 0.76, 1.81 |
| Married | ||||||||||||
| No | 1.00 | ref | 1.00 | ref | 1.00 | ref | 1.00 | ref | 1.00 | ref | 1.00 | ref |
| Yes | 1.16 | 1.03, 1.30 | 1.22 | 1.08, 1.39 | 0.58 | 0.48, 0.70 | 0.94 | 0.77, 1.13 | 0.50 | 0.36, 0.71 | 1.20 | 0.93, 1.56 |
Publisher’s Note: MDPI stays neutral with regard to jurisdictional claims in published maps and institutional affiliations. |
© 2022 by the authors. Licensee MDPI, Basel, Switzerland. This article is an open access article distributed under the terms and conditions of the Creative Commons Attribution (CC BY) license (https://creativecommons.org/licenses/by/4.0/).
Share and Cite
Ropponen, A.; Josefsson, P.; Böckerman, P.; Silventoinen, K.; Narusyte, J.; Wang, M.; Svedberg, P. Sustainable Working Life Patterns in a Swedish Twin Cohort: Age-Related Sequences of Sickness Absence, Disability Pension, Unemployment, and Premature Death during Working Life. Int. J. Environ. Res. Public Health 2022, 19, 10549. https://doi.org/10.3390/ijerph191710549
Ropponen A, Josefsson P, Böckerman P, Silventoinen K, Narusyte J, Wang M, Svedberg P. Sustainable Working Life Patterns in a Swedish Twin Cohort: Age-Related Sequences of Sickness Absence, Disability Pension, Unemployment, and Premature Death during Working Life. International Journal of Environmental Research and Public Health. 2022; 19(17):10549. https://doi.org/10.3390/ijerph191710549
Chicago/Turabian StyleRopponen, Annina, Pontus Josefsson, Petri Böckerman, Karri Silventoinen, Jurgita Narusyte, Mo Wang, and Pia Svedberg. 2022. "Sustainable Working Life Patterns in a Swedish Twin Cohort: Age-Related Sequences of Sickness Absence, Disability Pension, Unemployment, and Premature Death during Working Life" International Journal of Environmental Research and Public Health 19, no. 17: 10549. https://doi.org/10.3390/ijerph191710549
APA StyleRopponen, A., Josefsson, P., Böckerman, P., Silventoinen, K., Narusyte, J., Wang, M., & Svedberg, P. (2022). Sustainable Working Life Patterns in a Swedish Twin Cohort: Age-Related Sequences of Sickness Absence, Disability Pension, Unemployment, and Premature Death during Working Life. International Journal of Environmental Research and Public Health, 19(17), 10549. https://doi.org/10.3390/ijerph191710549