Abstract
We retrospectively analyzed data on the excretion of cadmium (ECd), β2-microglobulin (Eβ2M) and N-acetyl-β-D-glucosaminidase (ENAG), which were recorded for 734 participants in a study conducted in low- and high-exposure areas of Thailand. Increased Eβ2M and ENAG were used to assess tubular integrity, while a reduction in the estimated glomerular filtration rate (eGFR) was a criterion for glomerular dysfunction. ECd, Eβ2M and ENAG were normalized to creatinine clearance (Ccr) as ECd/Ccr, Eβ2M/Ccr and ENAG/Ccr to correct for interindividual variation in the number of surviving nephrons and to eliminate the variation in the excretion of creatinine (Ecr). For a comparison, these parameters were also normalized to Ecr as ECd/Ecr, Eβ2M/Ecr and ENAG/Ecr. According to the covariance analysis, a Cd-dose-dependent reduction in eGFR was statistically significant only when Ecd was normalized to Ccr as ECd/Ccr (F = 11.2, p < 0.001). There was a 23-fold increase in the risk of eGFR ≤ 60 mL/min/1.73 m2 in those with the highest ECd/Ccr range (p = 0.002). In addition, doubling of ECd/Ccr was associated with lower eGFR (β = −0.300, p < 0.001), and higher ENAG/Ccr (β = 0.455, p < 0.001) and Eβ2M/Ccr (β = 0.540, p < 0.001). In contrast, a covariance analysis showed a non-statistically significant relationship between ECd/Ecr and eGFR (F = 1.08, p = 0.165), while the risk of low eGFR was increased by 6.9-fold only among those with the highest ECd/Ecr range. Doubling of ECd/Ecr was associated with lower eGFR and higher ENAG/Ecr and Eβ2M/Ecr, with the β coefficients being smaller than in the Ccr-normalized dataset. Thus, normalization of Cd excretion to Ccr unravels the adverse effect of Cd on GFR and provides a more accurate evaluation of the severity of the tubulo-glomerular effect of Cd.
1. Introduction
Cadmium (Cd) is a toxic metal with continuing public health concern worldwide due to its toxicity to the mitochondrion, which is central to the maintenance of cell integrity and function [1,2,3]. Environmental exposure to Cd is inevitable for most people because the metal is present in almost all food types [4]. The prominence of Cd in wheat and rice-based products, as recorded by total diet studies undertaken at multiple sites and countries, is particularly concerning, as these food staples are consumed in some form by the majority of the world’s population [4]. The realization in the 1940s that the condition referred to as “itai-itai” disease was due to consumption of rice heavily contaminated with Cd brought into focus the real threat to health posed by this metal [5,6]. Itai-itai disease is the most severe form of human Cd poisoning, characterized by severe damage to the kidneys and bones, resulting in multiple bone fractures due to osteoporosis and osteomalacia [5,6].
A protein β2-microglobulin (β2M), with a molecular weight of 11,800 Da, is synthesized and shed by all nucleated cells in the body [7]. By virtue of its small mass, β2M is filtered freely by the glomeruli and is reabsorbed almost completely by the kidney’s tubular cells [8]. Cd has been shown to cause a reduction in the tubular maximum reabsorption of β2M [9], and increased β2M excretion has been used as an indicator of impaired tubular reabsorptive function for many decades. An increase in the excretion of β2M above 300 μg/g creatinine is used as an endpoint in health risk assessments of Cd in the human diet, and urinary Cd excretion levels below 5.24 µg Cd/g creatinine have been identified as body burdens that are not associated with such an increase in β2M excretion [10,11,12]. However, our previous assessment showed that β2M excretion of 100–299, 300–999 and ≥ 1000 μg/g creatinine were associated with 4.7-, 6.2- and 10.5-fold increases in the risk of an estimated glomerular filtration rate (eGFR) ≤ 60 mL/min/1.73 m2, which is commensurate with chronic kidney disease (CKD) [13]. Thus, elevated β2M excretion does not appear to be an early sign of nephrotoxicity to Cd, and the utility of β2M excretion as a toxicity criterion of Cd is questionable.
Current epidemiologic evidence suggests that environmental exposure to Cd may reduce the GFR at body burdens much lower than those associated with Cd excretion of 5.24 µg/g creatinine [14,15,16,17]. Reductions in GFR due to Cd nephropathy have often been attributed to glomerular injury. However, sufficient tubular injury can indeed disable glomerular filtration and ultimately leads to nephron atrophy, glomerulosclerosis, and interstitial inflammation and fibrosis [18]. Current evidence also suggests that a common practice of normalizing Cd excretion (ECd) to creatinine excretion (Ecr) underestimate the severity of Cd toxicity in kidneys, while normalizing ECd to creatinine clearance (Ccr) could provide a more accurate measure of the nephrotoxicity of Cd [19,20].
The present study had two major aims: firstly, to ascertain the associations of Cd exposure with the risks of adverse effects on kidney glomerular and tubular function, and, secondly, to compare the impacts of normalizing ECd, Eβ2M and ENAG to Ecr and Ccr on estimations of Cd toxicity in the kidneys. Kidney dysfunction was indicated by a reduction in eGFR and increased Eβ2M and ENAG.
2. Materials and Methods
2.1. Study Subjects
We assembled archived data from 289 men and 445 women who were drawn from Bangkok (a low-exposure area) between 2001 and 2003 and from subsistence farming areas of Mae Sot District (a high-exposure area) in Thailand between 2004 and 2005 [21]. A wide range of Cd exposure levels among the participants enabled an evaluation of the dose–response relationships. The study protocol was approved by the Institutional Ethical Committee of Chulalongkorn University and the Mae Sot Hospital Ethical Committee. At the time of recruitment, all participants had lived at their current addresses for at least 30 years, and all gave informed consent to participate. Exclusion criteria were pregnancy, breastfeeding, a history of metalwork, and a hospital record or physician’s diagnosis of an advanced chronic disease. Smoking, diabetes, hypertension, regular use of medications, educational level, occupation and family health history were ascertained by a questionnaire. Diabetes was defined as fasting plasma glucose levels ≥ 126 mg/dL or a physician’s prescription of anti-diabetic medications. Hypertension was defined as systolic blood pressure ≥ 140 mmHg, diastolic blood pressure ≥ 90 mmHg, and/or a physician’s diagnosis and prescription of anti-hypertensive medications.
2.2. Collection of Biological Specimens and Analyses
Second morning urine samples were collected after an overnight fast, and whole blood samples were obtained within 3 hours after the urine samples were collected. The simultaneous collection of blood and urine samples was required to normalize the excretion of Cd, β2M and NAG to Ccr. Aliquots of urine, whole blood and plasma were stored at −20 °C or −80 °C for later analysis. The assay for urine and plasma concentrations of creatinine ([cr]u and [cr]p) was based on the Jaffe reaction. The urinary NAG assay was based on colorimetry (NAG test kit, Shionogi Pharmaceuticals, Sapporo, Japan). The urinary β2M assay was based on the latex immunoagglutination method (LX test, Eiken 2MGII; Eiken and Shionogi Co., Tokyo, Japan).
For the group from the area polluted by Cd, [Cd]u was determined by atomic absorption spectrophotometry (Shimadzu Model AA-6300, Kyoto, Japan). Urine standard reference material No. 2670 (National Institute of Standards, Washington, DC, USA) was used for quality assurance and control purposes. None of the urine samples from this group was found to have a [Cd]u below the detection limit.
For the group from the low-exposure area, [Cd]u was determined by inductively-coupled plasma mass spectrometry (ICP/MS, Agilent 7500, Agilent Technologies, Santa Clara, CA, USA) because it had the high sensitivity required to measure very low Cd concentrations. Multi-element standards (EM Science, EM Industries, Inc., Newark, NJ, USA) were used to calibrate the Cd analyses. The accuracy and precision of those analyses were ascertained with reference urine (Lyphochek®, Bio-Rad, Sydney, Australia). The Cd concentration assigned to samples with Cd below the detection limit was the detection limit of 0.05 µg/L divided by the square root of 2 [22].
2.3. Estimated Glomerular Filtration Rate (eGFR)
In theory, the GFR reflects the number of surviving nephrons × the average GFR per nephron, and is indicative of nephron function [23,24]. In practice, the GFR is estimated from various equations, and is reported as eGFR. We used CKD-EPI equations to calculate the eGFR values because they are considered to be the most accurate equations and have been validated with inulin clearance [25].
Male eGFR = 141 × [serum creatinine/0.9]y × 0.993age, where y = −0.411 if serum creatinine ≤ 0.9 mg/dL or −1.209 if serum creatinine > 0.9 mg/dL.
Female eGFR = 144 × [serum creatinine/0.7]y × 0.993age, where y = −0.329 if serum creatinine ≤ 0.7 mg/dL or −1.209 if serum creatinine > 0.7 mg/dL.
CKD was defined as eGFR ≤ 60 mL/min/1.73 m2, and CKD Stages 1, 2, 3a, 3b, 4 and 5 corresponded to eGFR values of 90–119, 60–89, 45–59, 30–44, 15–29 and <15 mL/min/1.73 m2, respectively [23].
2.4. Normalization of Excretion of Cd, β2M and NAG to Ecr and Ccr
Ex was normalized to Ecr as [x]u/[cr]u, where x = Cd, β2M or NAG; [x]u = urine concentration of x (mass/volume); and [cr]u = urine creatinine concentration (mg/dL). The ratio [x]u/[cr]u was expressed in μg/g of creatinine.
Ex was normalized to Ccr as Ex/Ccr = [x]u[cr]p/[cr]u, where x = Cd, β2M or NAG; [x]u = urine concentration of x (mass/volume); [cr]p = plasma creatinine concentration (mg/dL); and [cr]u = urine creatinine concentration (mg/dL). Ex/Ccr was expressed as the excretion of x per volume of filtrate [26]. It is noteworthy that simultaneous collection of blood and urine samples is a prerequisite for Ccr normalization.
2.5. Statistical Analysis
Data were analyzed with IBM SPSS Statistics 21 (IBM Inc., New York, NY, USA). The distributions of eGFR and the excretion of Cd, β2M and NAG were examined for skewness, and those showing rightward skewing were subjected to logarithmic transformation before analysis. The departure of a given variable from a normal distribution was assessed with the one-sample Kolmogorov–Smirnov test. The Mann–Whitney U-test was used to compare mean differences between two groups. The Chi-square test was used to determine differences in percentage and prevalence data. A multivariable regression model analysis was used to evaluate the associations of Cd excretion rates and the dependent variables, which included eGFR and excretion of β2M and NAG. Multivariable logistic regression analysis was used to determine the prevalence odds ratio (POR) for dichotomized outcomes. The mean eGFR values adjusted for covariates and their interaction in groups of subjects were obtained by univariate/covariance analysis with Bonferroni correction in multiple comparisons. For each analysis, p-values ≤ 0.05 for two-tailed tests were assumed to indicate statistical significance.
3. Results
3.1. Demographic Characteristics of the Study Subjects
As the data in Table 1 indicate, 27.2% of the subjects included in the present analysis were residents of a low-exposure area.

Table 1.
Characteristics of the study subjects, stratified by sex.
The mean age of men and women was similar, and the overall mean age was 48.1 years. Smoking status was classified as those who were current smokers and those who had stopped smoking for less than 10 years. The percentage of smokers was higher in men (69.5%) than in women (22.5%), but the percentage of those with diabetes and low eGFR in men and women did not differ. Mean ECd in smokers was 2.4-fold higher than that of non-smokers (3.80 vs. 1.63 µg/L, p < 0.001). The mean plasma and urinary creatinine concentrations were higher in men than in women (p < 0.001). Conversely, the mean urinary NAG concentrations were higher in women than in men (p = 0.045). The mean urinary concentrations of β2M and Cd in men and women did not differ. The mean Eβ2M/Ecr, mean ENAG/Ecr and mean ECd/Ecr were higher in women than in men (p < 0.05). In contrast, the mean Eβ2M/Ccr, mean ENAG/Ccr and mean ECd/Ccr in women and men did not differ.
3.2. Effects of Residential Location and Smoking Habit on Cadmium Excretion Levels
As the data in Table 2 indicate, mean age and the percentages of smokers and those with hypertension among residents of a Cd-contaminated area were all higher than in those who lived in Bangkok. None of the residents of a low-exposure area had diabetes or low eGFR. Half and 23.5% of the subjects from the high- and low-exposure areas were smokers, respectively. The mean ECd for non-smokers in the high-exposure area was 24.9-fold higher than that of non-smokers from a low-exposure area (5.22 vs. 0.21 µg/L, p <0.001). The mean ECd for smokers from a high-exposure area was higher than that of smokers from a low-exposure area by 18.3-fold (5.87 vs. 0.32 µg/L, p <0.001).
Table 2.
Characteristics of study subjects, stratified by residential location.
The mean BMI in the low- and high-exposure groups was similar (p = 0.703). In contrast, the mean eGFR was 18.6% higher in the low-exposure group compared with the high-exposure group (p < 0.001). The means of all other measured continuous variables were higher in residents of a Cd-contaminated area than in those who lived in a low-exposure area.
3.3. Associations of ECd/Ecr vs. ECd/Ccr with eGFR, β2M and NAG
As the data in Table 3 indicate, a set of seven independent variables, including age, ECd/Ecr, BMI, sex, hypertension, Type 2 diabetes and smoking, were examined for their associations with the three markers of kidney effects: eGFR deterioration, and increases in β2M and NAG excretion.
Table 3.
Associations of the markers of kidney effects with ECd/Ecr.
In the regression model analysis (Table 3), age, ECd/Ecr, sex, hypertension, diabetes and smoking accounted for 48.5% of the variation in eGFR (p < 0.001), 22.2% of the variation in ENAG/Ecr (p < 0.001) and 34.7% of the variation in Eβ2M/Ecr (p < 0.001). Doubling of ECd/Ecr was associated with lower eGFR values (β = −0.142, p < 0.001), higher ENAG/Ecr (β = 0.390, p < 0.001) and higher Eβ2MG/Ecr (β = 0.499, p < 0.001).
In an equivalent regression model analysis with the excretion data normalized to Ccr (Table 4), age, ECd/Ccr, sex, hypertension, diabetes and smoking accounted for 52.9% of the variation in eGFR (p < 0.001), 25.7% of the variation in ENAG/Ccr (p < 0.001) and 38.3% of the variation in Eβ2M/Ccr (p <0.001). Doubling of ECd/Ccr was associated with lower eGFR values (β = −0.300, p < 0.001), higher ENAG/Ccr (β = 0.455, p < 0.001) and higher Eβ2M/Ccr (β = 0.540, p < 0.001).
Table 4.
Associations of the markers of kidney effects with ECd/Ccr.
3.4. Associations of Cadmium Excretion with Elevated Risks of Nephrotoxicity
Through a logistic regression analysis (Table 5), Cd-dose-dependent effects were seen between ECd/Ecr and the risks of low eGFR, ENAG/Ecr ≥ 4 units/g creatinine and Eβ2M/Ecr ≥ 300 µg/g creatinine. A risk of low eGFR was increased by 6.91-fold when the ECd/Ecr level rose to 5.77 µg/g creatinine or higher (p = 0.011).
Table 5.
Dose–response analysis of ECd/Ecr and the risk of adverse effects on the kidneys.
ECd/Ecr 1.84–5.76 µg/g creatinine was associated with 2.38- and 5.41-fold increases in the risk of abnormal ENAG/Ecr (p < 0.001) and Eβ2M/Ecr (p <0.001), respectively.
In an equivalent logistic regression analysis with the excretion data normalized to Ccr (Table 6), Cd-dose-dependent effects were seen between Cd and the risks of low eGFR, ENAG/Ccr ≥ 4 units/L filtrate and Eβ2M/Ccr ≥ 300 µg/L filtrate. A risk of low eGFR was increased by 23-fold at ECd/Ccr levels ≥ 44.6 ng/L filtrate (p = 0.002). ECd/Ccr 19.5–44.5 ng/L filtrate was associated with 2.69- and 2.84-fold increases in the risk of abnormal ENAG/Ccr (p < 0.001) and Eβ2M/Ccr (p <0.001), respectively.
Table 6.
Dose–response analysis of ECd/Ccr and the risk of adverse effects on the kidneys.
3.5. Comparing eGFR Reductions and Increases in ENAG and Eβ2M among Subjects
To further evaluate the effect of normalizing the excretion of Cd, NAG and β2M to Ecr or Ccr, we compared the mean eGFR, mean NAG excretion and mean β2M excretion together with the variances (the upper and lower bounds of the 95% confidence interval for each mean) in groups of subjects stratified by ECd/Ecr or ECd/Ccr levels. We used a univariate analysis of variance to derive those figures and, with full factorial models, the means were adjusted for covariates that included age, BMI, diabetes, sex, smoking, hypertension and their interactions. Data from 709 subjects were analyzed because the BMI data for 25 subjects were missing.
ECd/Ecr Levels 1, 2 and 3 correspond to ECd/Ecr 0.04–1.83, 1.84–5.76 and 5.77–57.7 µg/g creatinine, respectively. The number of subjects with ECd/Ecr Levels 1, 2 and 3 was 221, 239 and 249, respectively. ECd/Ccr Levels 1, 2 and 3 correspond to ECd/Ccr 0.3–19.4, 19.6–44.5 and 44.6–800 ng/L filtrate, respectively. The number of subjects with ECd/Ecr Levels 1, 2 and 3 was 265, 174 and 270, respectively.
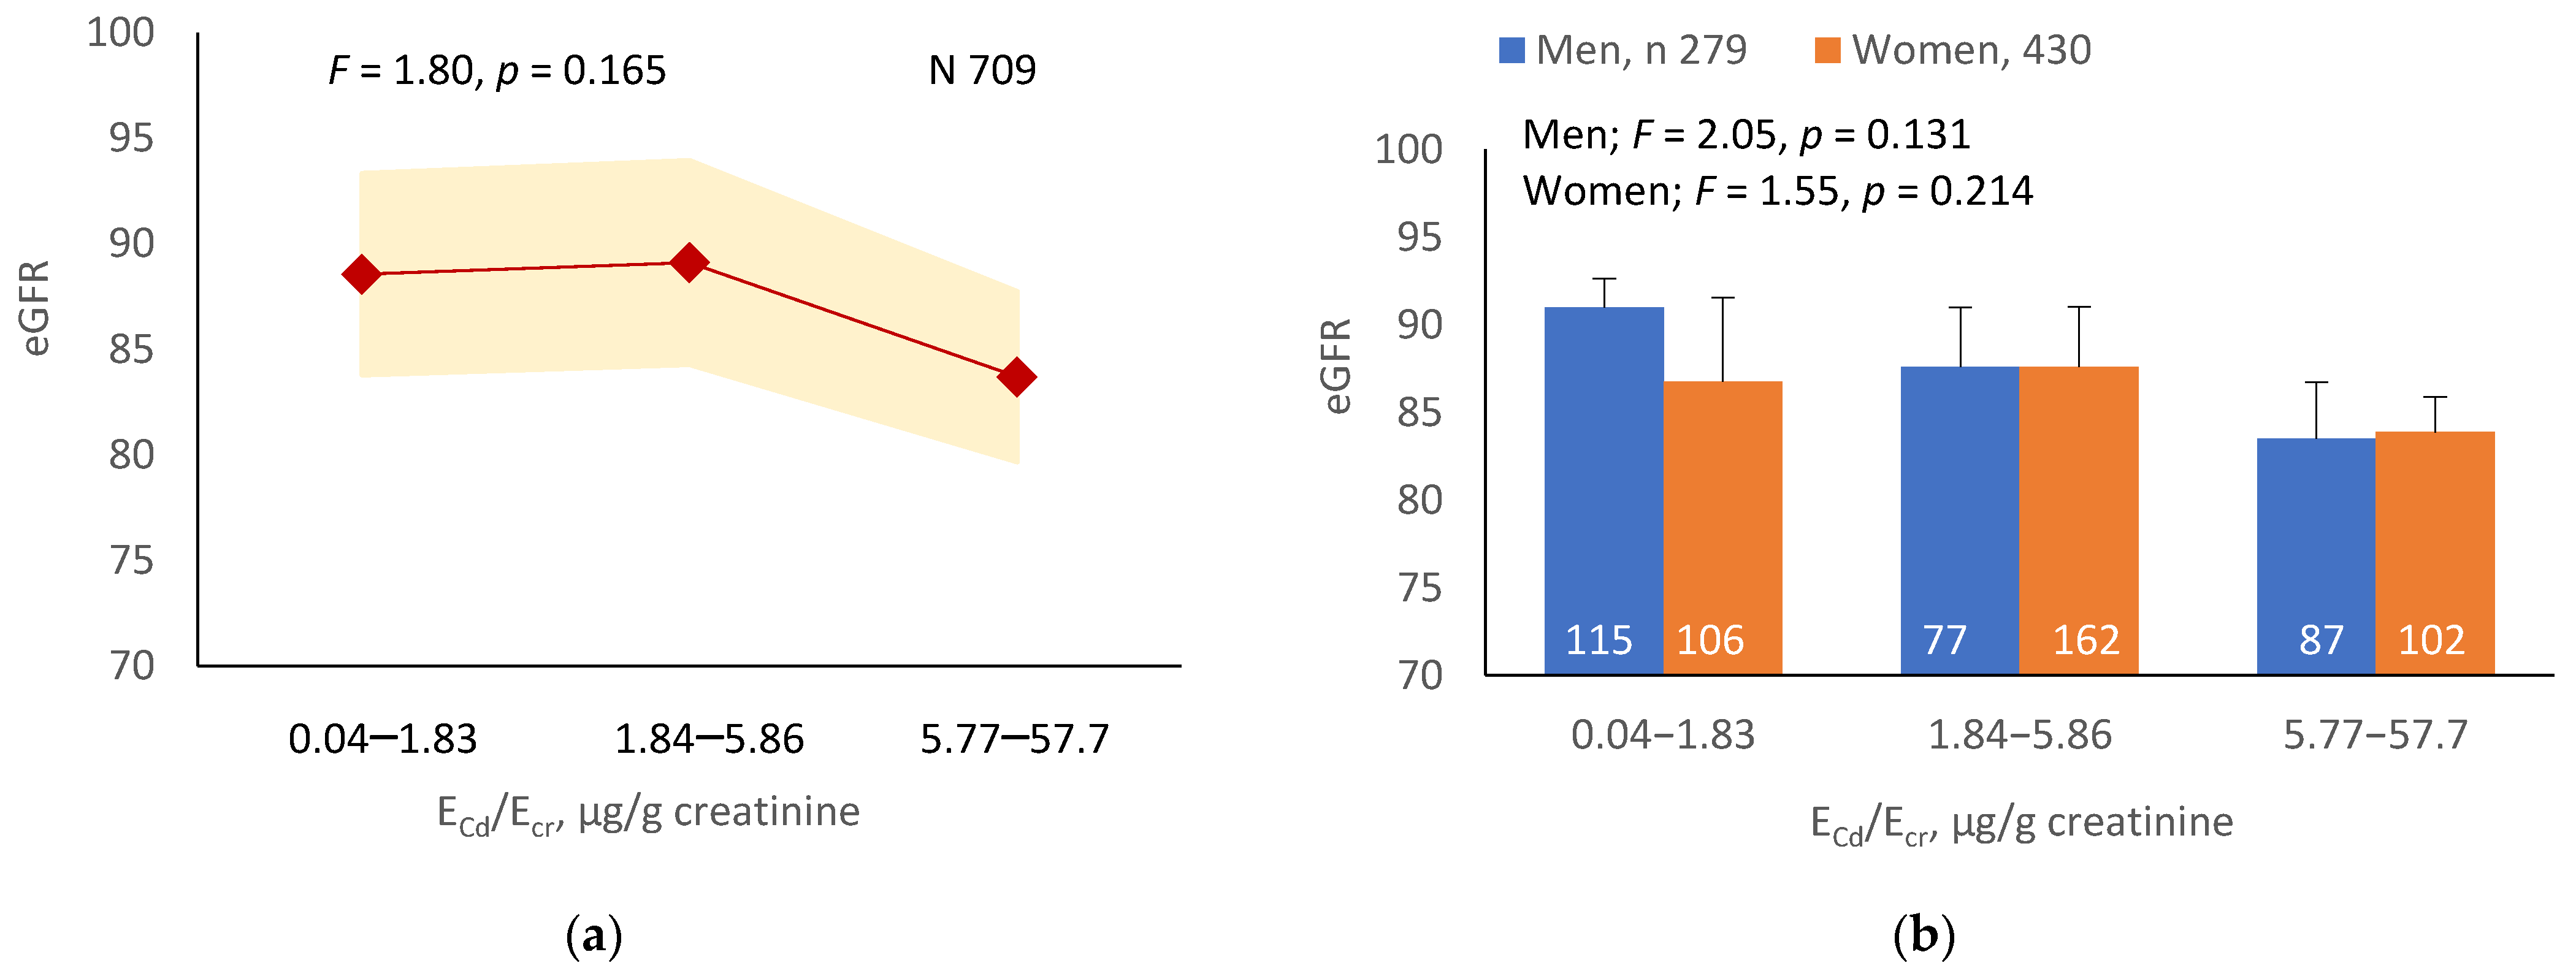
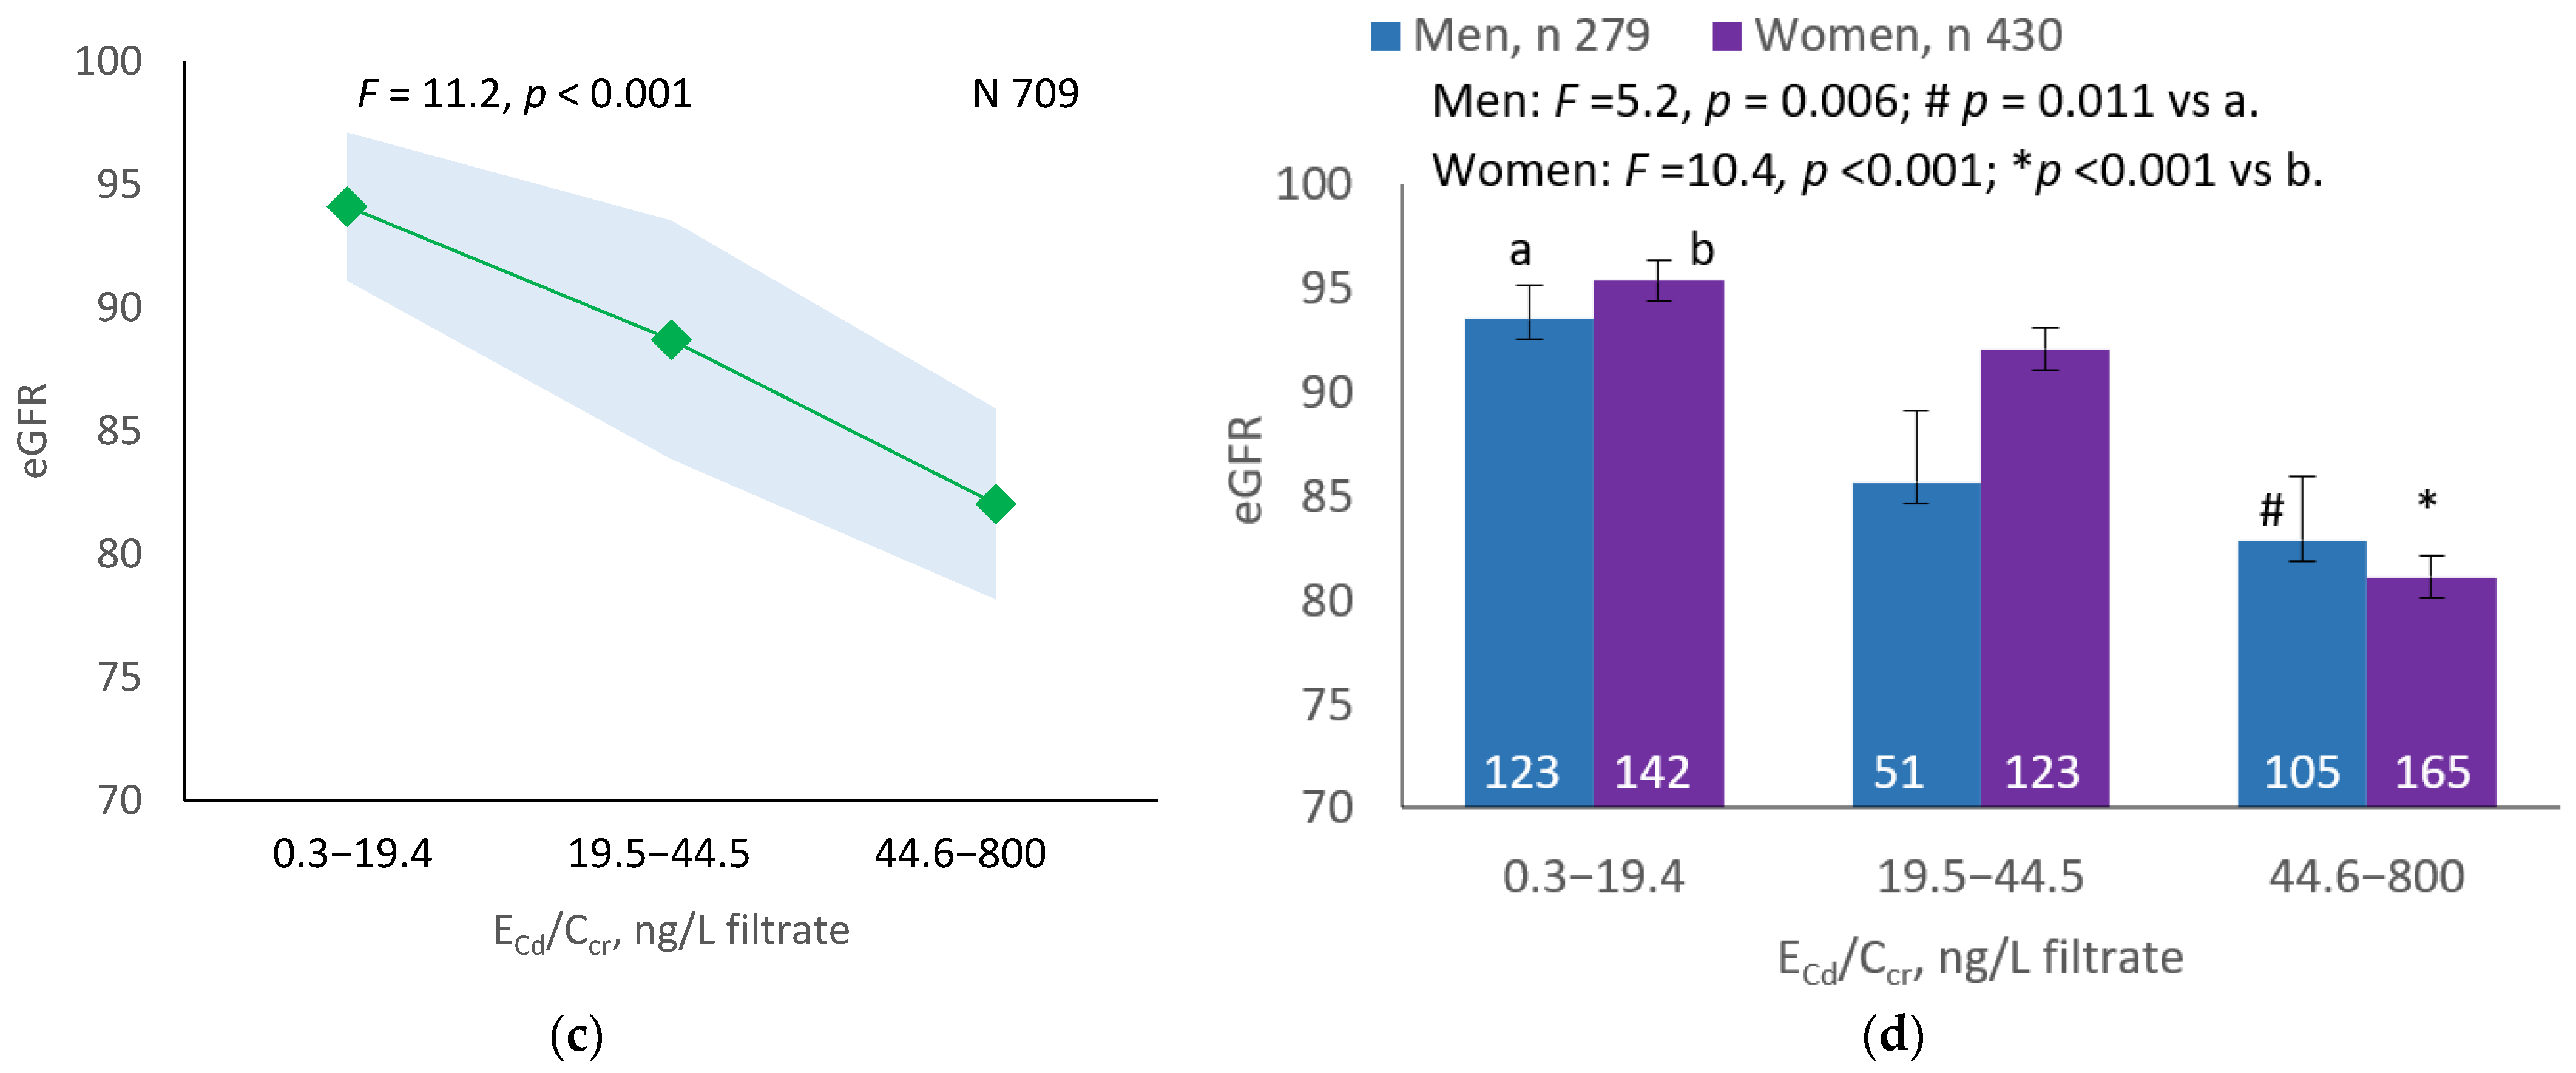
3.5.1. Cadmium-Dose-Dependent Reductions in eGFR
As Figure 1a,b indicates, the mean eGFRs for each ECd/Ecr level were not statistically different (p = 0.165). In contrast, the mean eGFR was the highest for ECd/Ccr Level 1, intermediate for Level 2 and lowest for Level 3 (p < 0.001) (Figure 1c). This Cd-dose-related eGFR reduction was evident in men and women (Figure 1d).
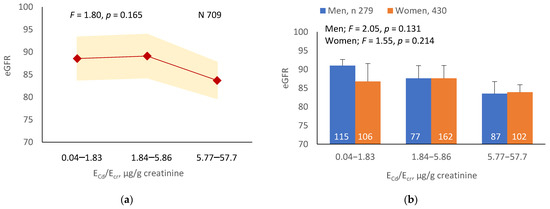
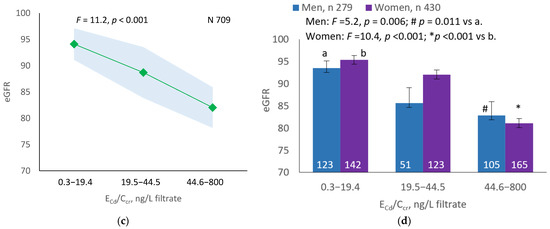
Figure 1.
Cadmium-dose-dependent reductions in eGFR. The color-coded area graphs depict eGFR means with variances in subjects with ECd/Ecr Levels 1, 2 and 3 (a) and in subjects with ECd/Ccr Levels 1, 2 and 3 (c). The bar graphs show the eGFR means in men and women with ECd/Ecr Levels 1, 2 and 3 (b) and the eGFR means in men and women with ECd/Ccr Levels 1, 2 and 3 (d). Where appropriate, statistical comparisons are made within each sex between eGFR means in bars a and b. The GM (SD) values of ECd/Ecr at Levels 1, 2 and 3 are 0.51 (0.50), 3.43 (1.10), and 0.94 (7.33) µg/g creatinine, with the corresponding number of subjects being 221, 239, and 249, respectively. The GM (SD) values of ECd/Ccr at Levels 1, 2 and 3 are 5.18 (5.72), 29.6 (6.73) and 97.3 (97.7) ng/L filtrate, with the corresponding number of subjects being 265, 174 and 270, respectively.
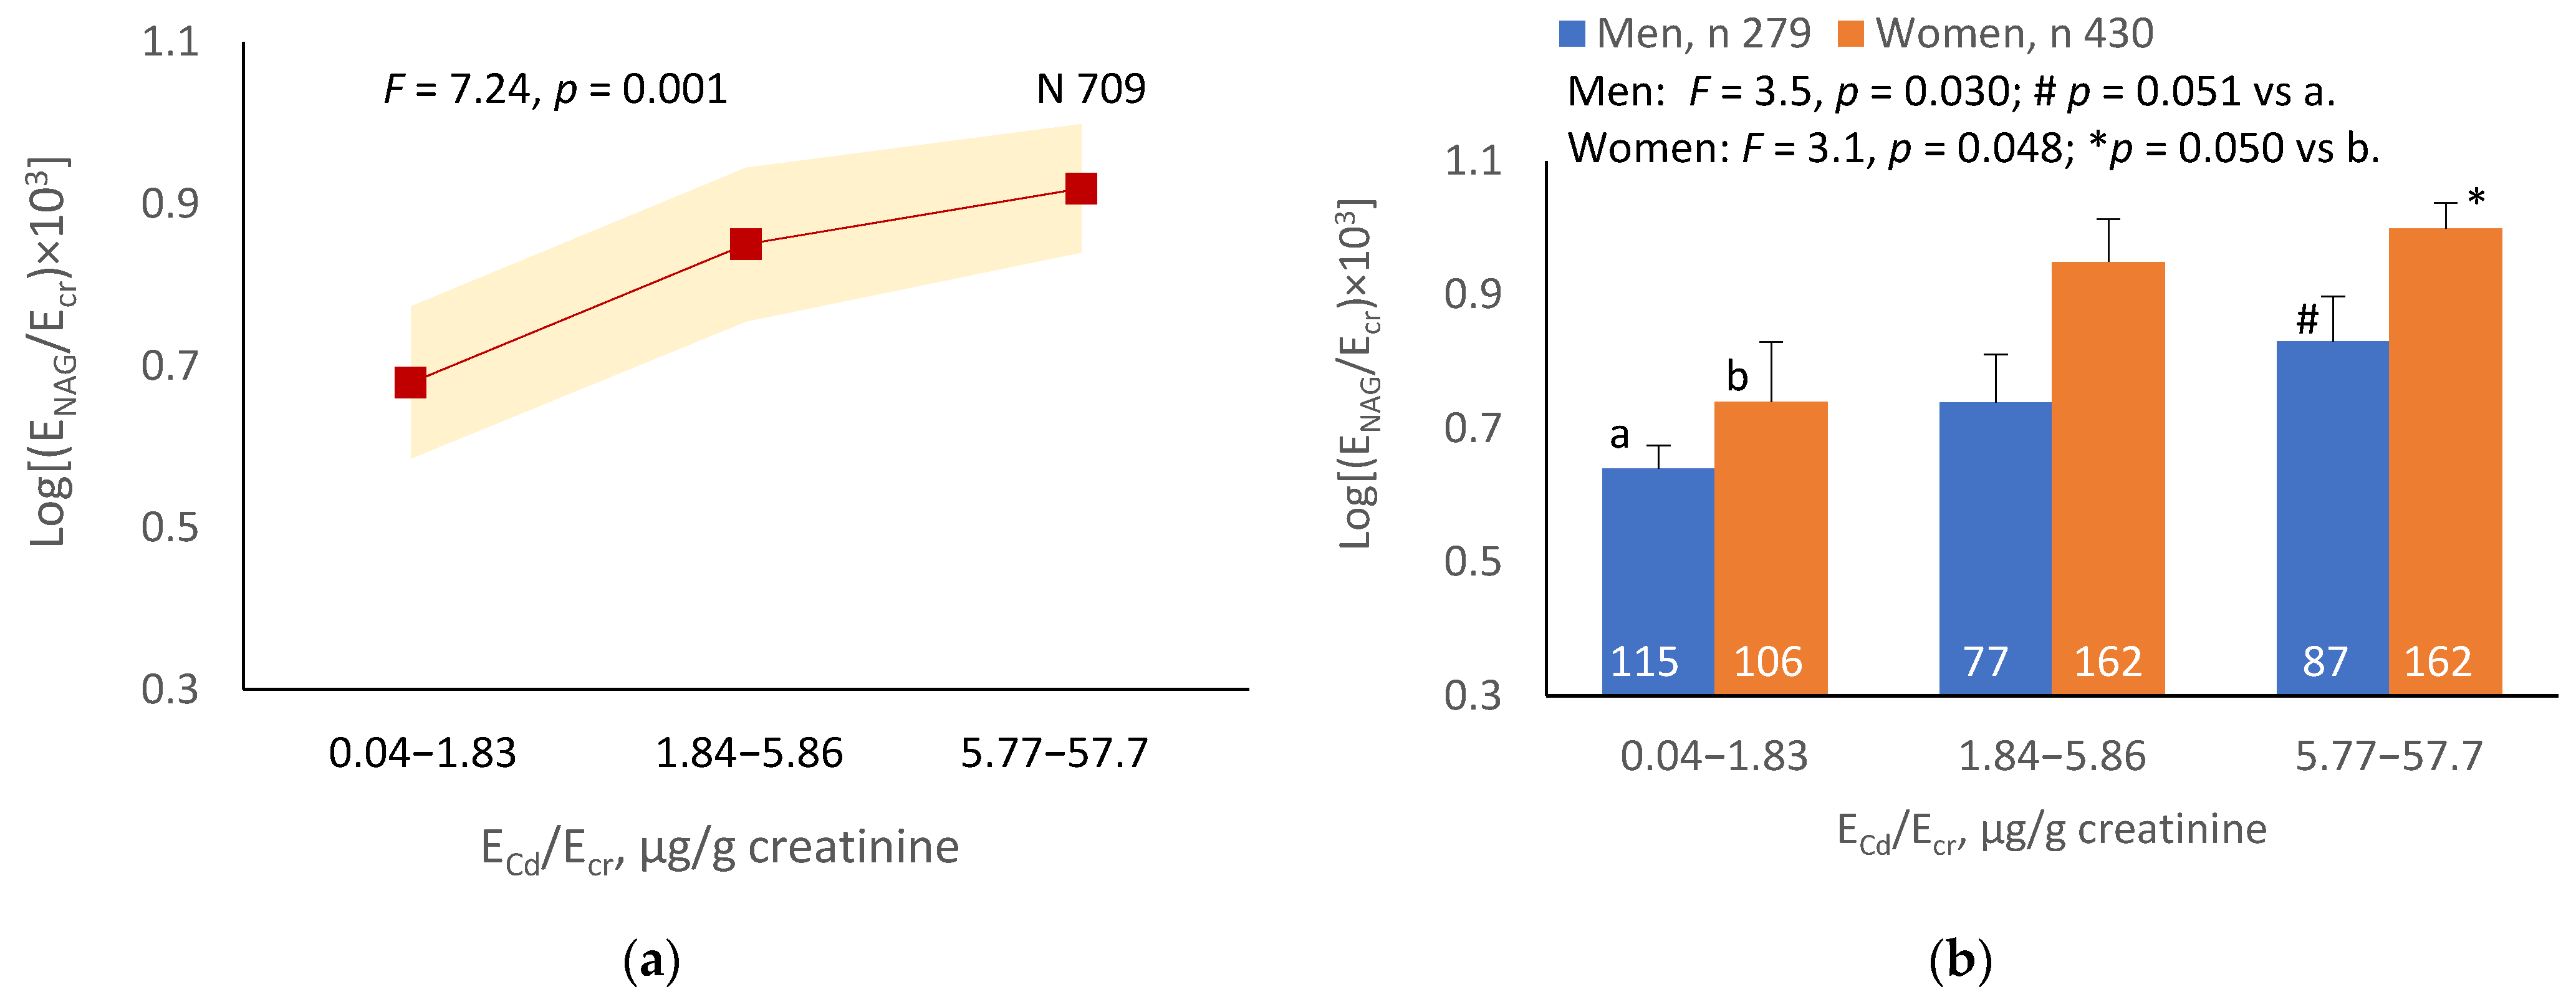
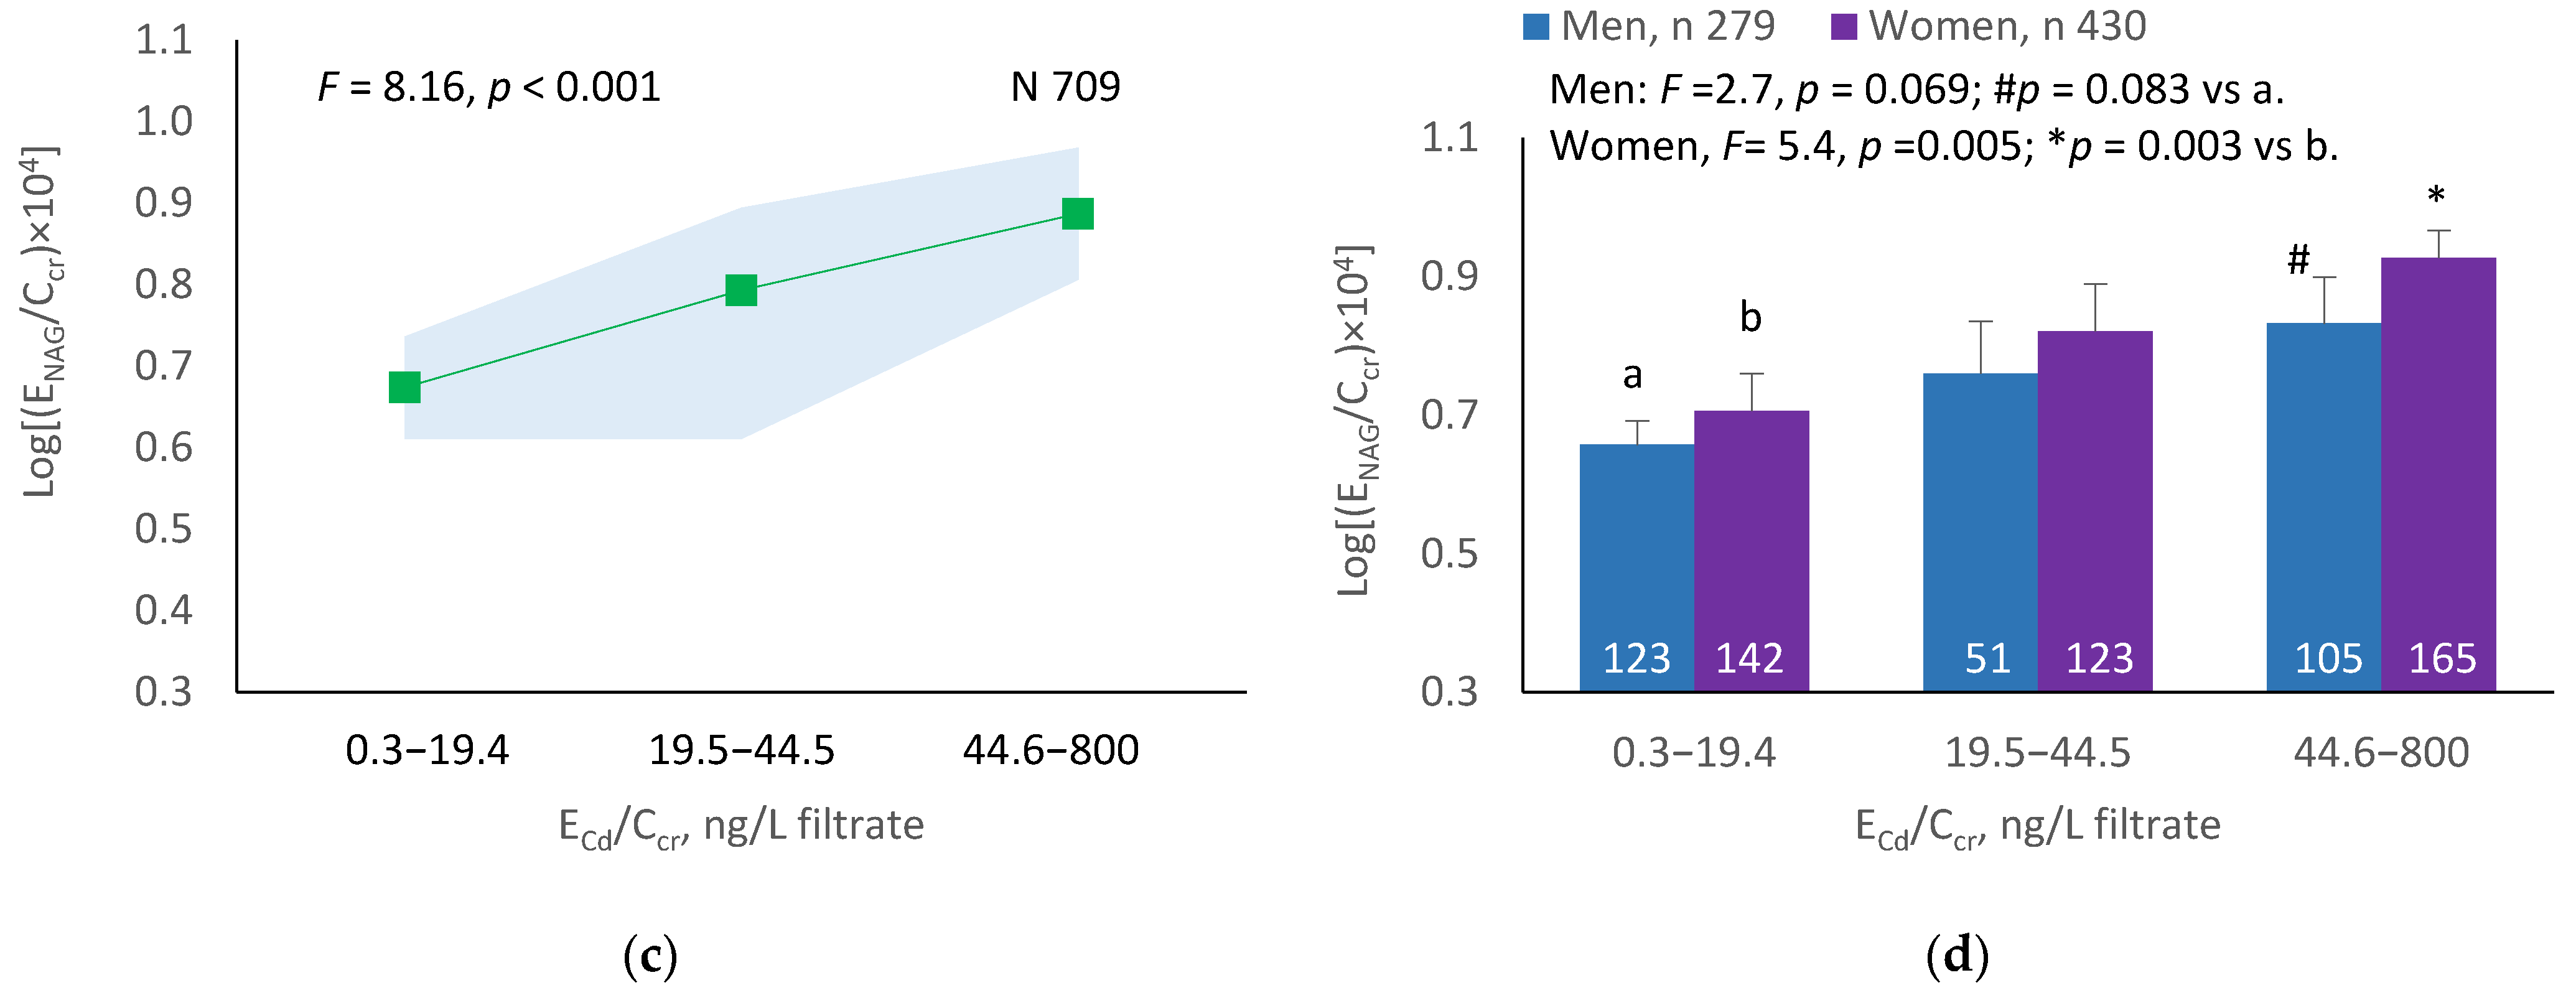
3.5.2. Cadmium-Dose-Dependent Increases in NAG Excretion
The mean NAG excretion was highest at ECd/Ecr Level 1, intermediate at Level 2 and lowest at Level 3 (p = 0.001) (Figure 2a). In men and women, the mean Eβ2M/Ecr was higher in those with ECd/Ecr Level 3, compared with ECd/Ecr Level 1 (Figure 2b). Similarly, the mean ENAG/Ecr was lowest at ECd/Ccr Level 1, intermediate at Level 2 and highest at Level 3 (p < 0.001) (Figure 2c), and the mean ENAG/Ecr was higher in men and women who had ECd/Ccr Level 3, compared those who had ECd/Ccr Level 1 (Figure 2d).
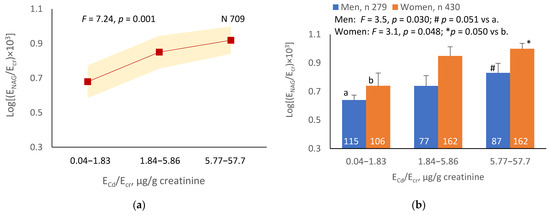

Figure 2.
Cadmium-dose-related increases in NAG excretion. The color-coded area graphs depict NAG excretion means as log[(ENAG/Ecr) × 103] values with variances for subjects with ECd/Ecr Levels 1, 2 and 3 (a) and NAG excretion means as log[(ENAG/Ccr) × 104] with variances in subjects with ECd/Ccr Levels 1, 2 and 3 (c). The bar graphs show NAG excretion means as log[(ENAG/Ecr) × 103] values in men and women with ECd/Ecr Levels 1, 2, and 3 (b) and NAG excretion means as log[(ENAG/Ccr) × 104] in men and women with ECd/Ccr Levels 1, 2 and 3 (d). Where appropriate, statistical comparisons are made within each sex between NAG excretion means in bars a and b. The GM (SD) values of ECd/Ecr at Levels 1, 2 and 3 are 0.51 (0.50), 3.43 (1.10) and 10.94 (7.33) µg/g creatinine, with the corresponding number of subjects being 221, 239 and 249, respectively. The GM (SD) values of ECd/Ccr at Levels 1, 2 and 3 are 5.18 (5.72), 29.6 (6.73) and 97.3 (97.7) ng/L filtrate, with the corresponding number of subjects being 265, 174 and 270, respectively.
3.5.3. Cadmium-Dose-Dependent Increases in β2M Excretion
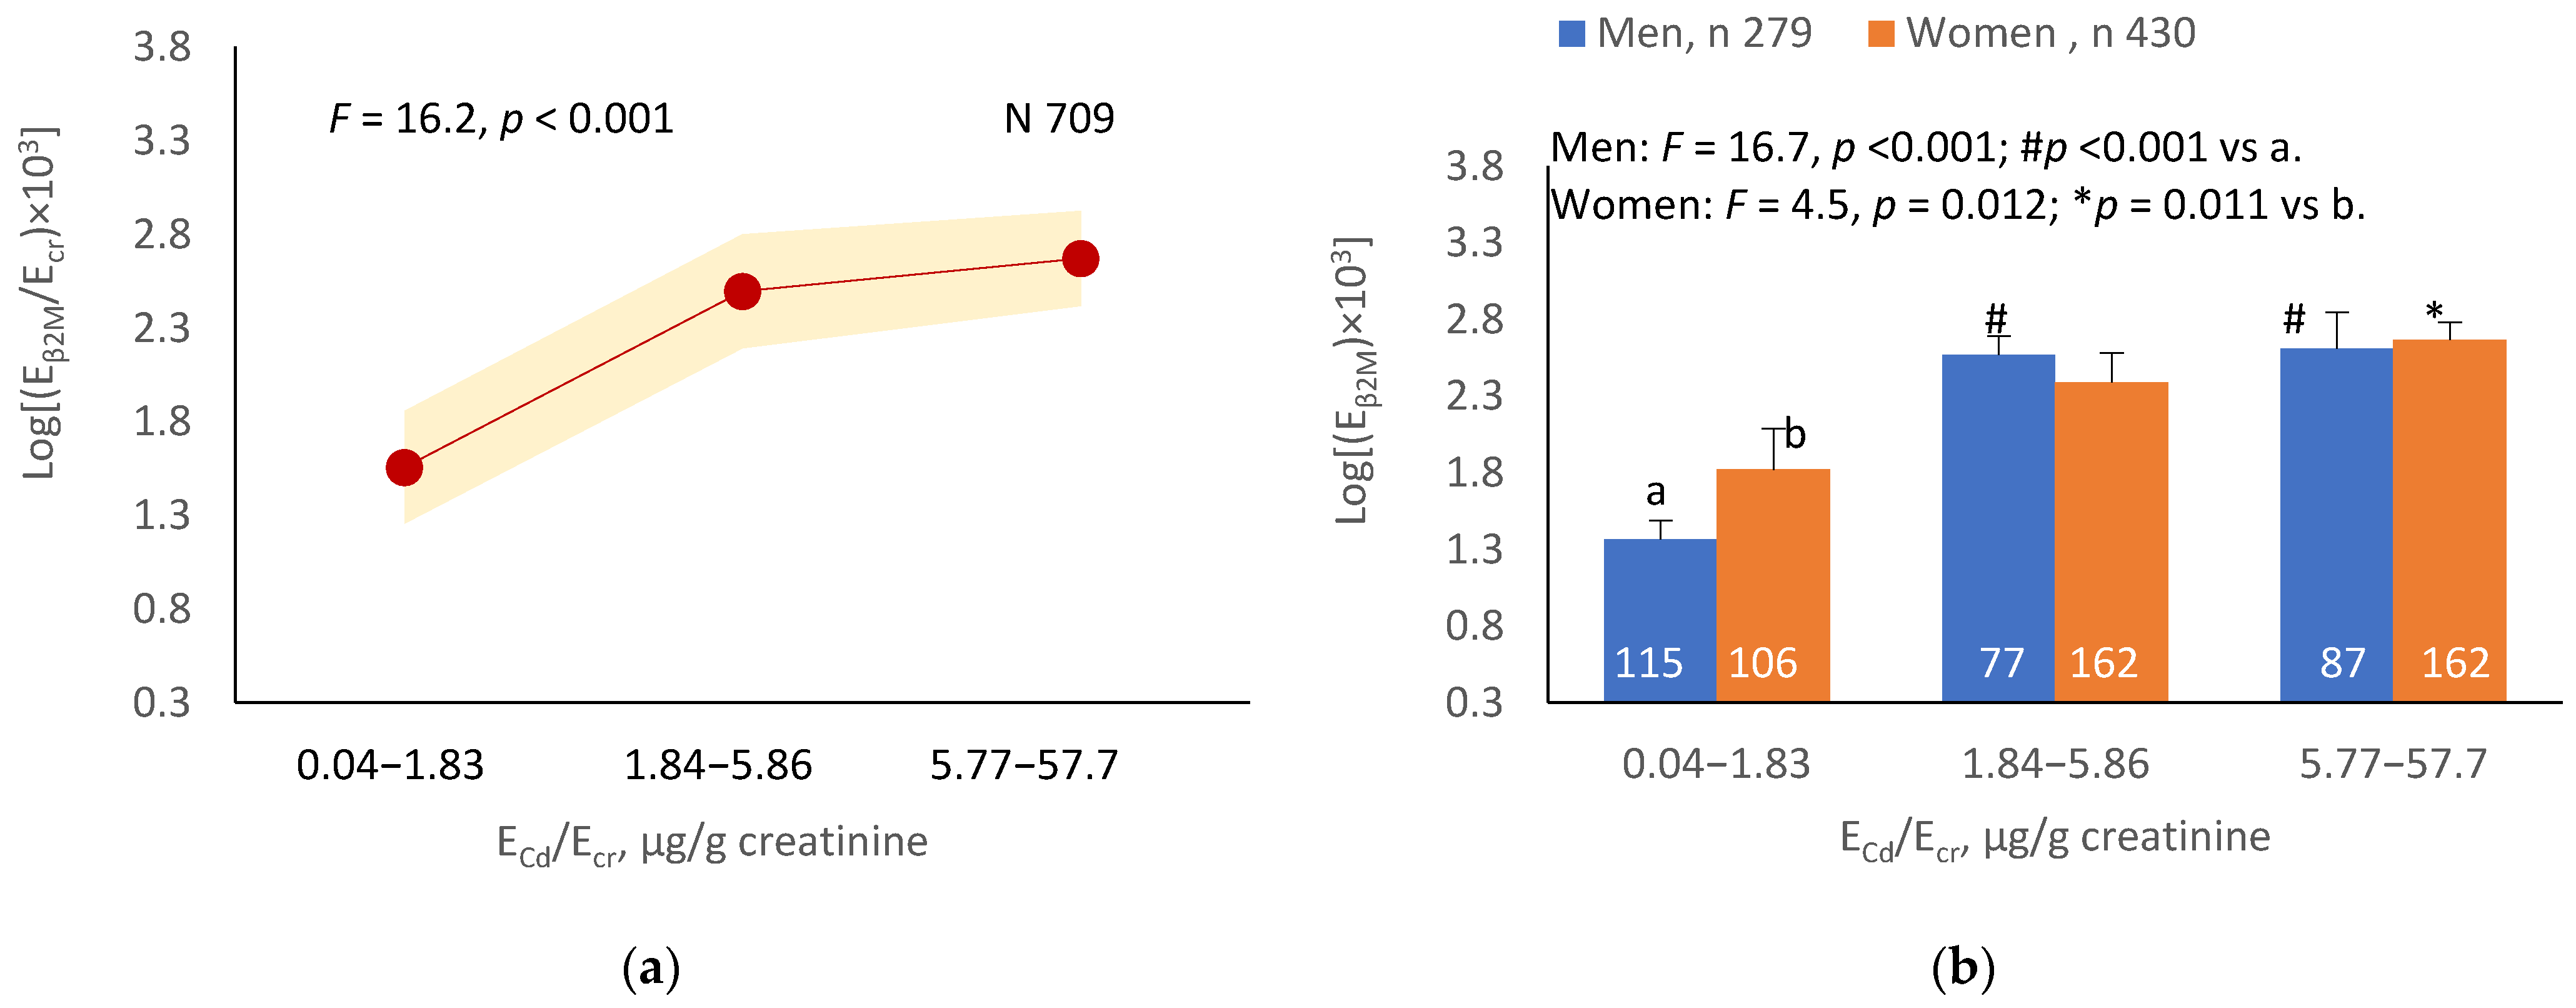
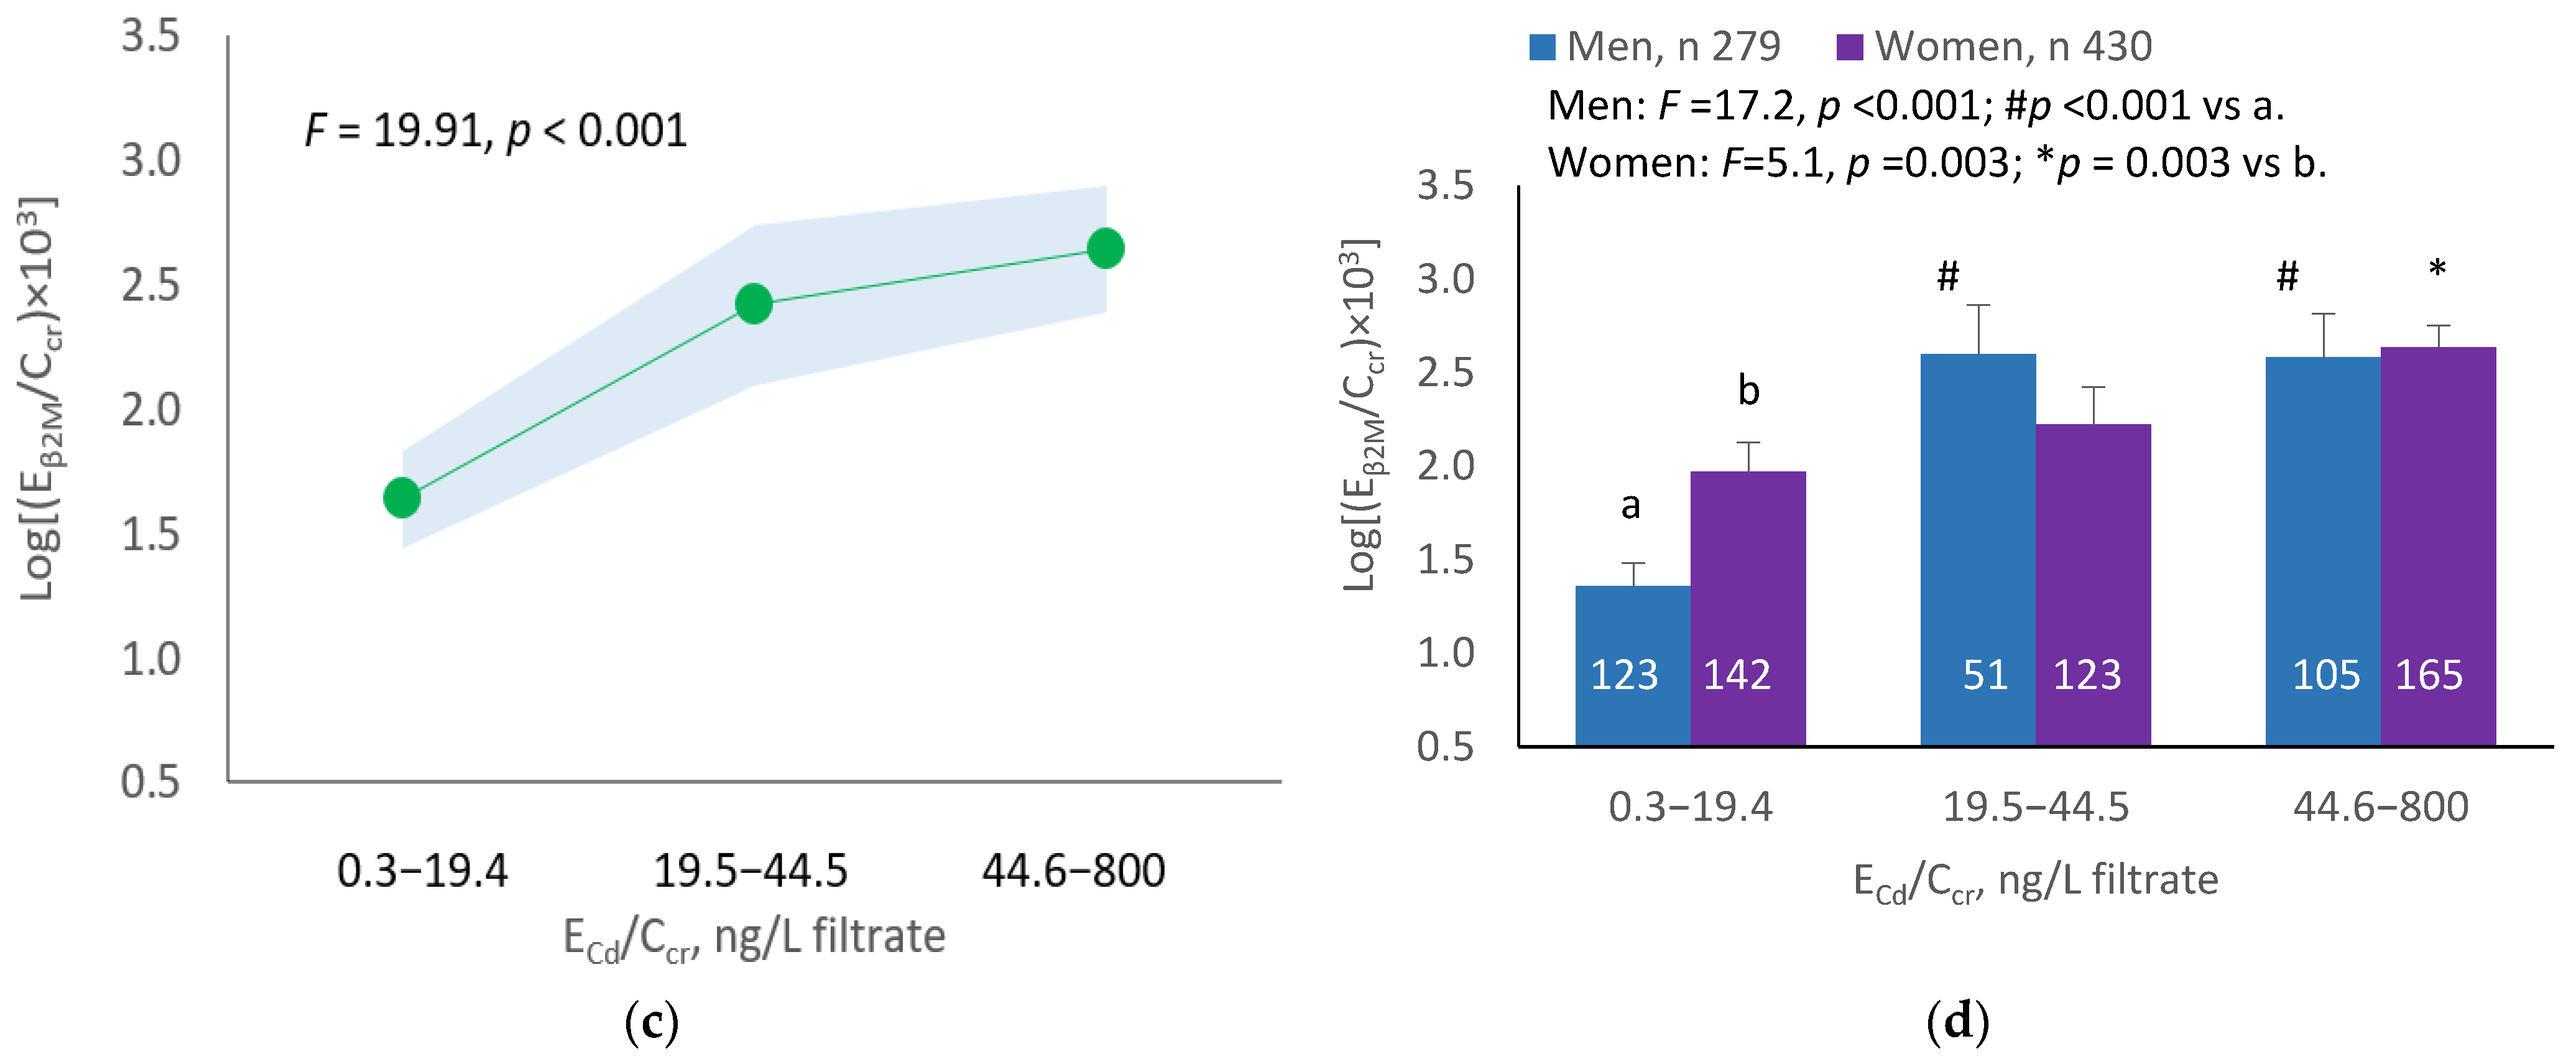
The mean Eβ2M/Ecr was highest at ECd/Ecr Level 1, intermediate at Level 2 and lowest at Level 3 (p < 0.001) (Figure 3a). In men, the mean Eβ2M/Ecr was higher in those with ECd/Ecr Levels 2 and 3, compared with ECd/Ecr Level 1 (Figure 3b). In women, the mean Eβ2M/Ecr at Level 3 of ECd/Ecr was higher than at Level 1 (Figure 3b). Similarly, the mean Eβ2M/Ecr was highest at ECd/Ccr Level 1, intermediate at Level 2 and lowest at Level 3 (p < 0.001) (Figure 3c), and the mean Eβ2M/Ecr was higher in men with ECd/Ccr Levels 2 and 3, compared with Level 1 (Figure 3d). In women, only the mean Eβ2M/Ecr at Level 3 was higher than at Level 1 (Figure 3d).

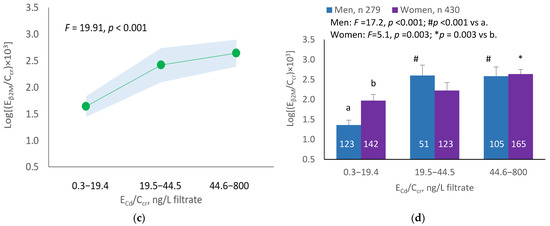
Figure 3.
Cadmium-dose-related increases in β2MG excretion. The color-coded area graphs depict β2M excretion means as log[(Eβ2M/Ecr) × 103] values with variances for subjects with ECd/Ecr Levels 1, 2 and 3 (a) and β2M excretion means as log[(Eβ2M/Ccr) × 104] values with variances for subjects with ECd/Ccr Levels 1, 2 and 3 (c). The bar graphs show β2M excretion means as log[(Eβ2M/Ecr) × 103] values in men and women with ECd/Ecr Levels 1, 2 and 3 (b) and β2M excretion means as log[(Eβ2M/Ccr) × 104] values in men and women with ECd/Ccr Levels 1, 2 and 3 (d). Where appropriate, statistical comparisons are made within each sex between mean β2M excretion as log[(Eβ2M/Ecr) × 103] or log[(Eβ2M/Ccr) × 104] in bars a and b. The GM (SD) values of ECd/Ecr at Levels 1, 2 and 3 are 0.51 (0.50), 3.43 (1.10) and 10.94 (7.33) µg/g creatinine, with the corresponding number of subjects being 221, 239 and 249, respectively. The GM (SD) values of ECd/Ccr at Levels 1, 2 and 3 are 5.18 (5.72), 29.6 (6.73) and 97.3 (97.7) ng/L filtrate, with the corresponding number of subjects being 265, 174 and 270, respectively.
4. Discussion
Normalization of urinary concentrations of excreted Cd, excreted β2M and excreted NAG to Ccr strengthened the associations of Cd with all three indicators of kidney dysfunction, decreased eGFR, and increased Eβ2M and ENAG. Normalization by Ccr increased the proportions of accountable variations in all three effect indicators with adjustment for a set of covariates, including age and BMI (Table 3 vs. Table 4). Because normalizing ECd and other nephrotoxic indicators to Ccr corrected for interindividual variation in the number of surviving nephrons and eliminated the variation in Ecr, the severity of Cd nephrotoxicity or the effect size of Cd could be assessed with a sufficiently high degree of statistical certainty.
In comparison, although normalization by Ecr corrected for urine dilution, this practice introduced an additional variation that was unrelated to Cd exposure or GFR. For example, Ecr in women was universally lower than in men due to their lower muscle mass, which is a determinant of Ecr, and ECd/Ecr was consequently higher in women than in men. As the data in Table 1 indicate, the mean ECd/Ecr, the mean Eβ2MG/Ecr and the mean ENAG/Ecr were all higher in women than in men. In contrast, neither of these parameters was statistically different when excretion was normalized to Ccr.
A notable effect of adding the variance in the dataset with the conventional method of normalizing ECd, Eβ2M and ENAG to Ecr is demonstrable by covariance analysis. The effect on eGFR was insignificant when [Cd]u was normalized to Ecr (Figure 1a,b). In contrast, a Cd-dose-dependent reduction in eGFR was seen in all subjects, men and women when ECd was normalized to Ccr (Figure 1c,d). In addition, there was a 23-fold increase in the risk of low eGFR among subjects with ECd/Ccr at the highest level (≥44.6 ng/L filtrate, equivalent to ≥0.0446 µg/L filtrate) in a logistic regression analysis (Table 6). Only a 6.9-fold increase in the risk of low eGFR was seen among those with ECd/Ecr at the highest level (≥5.77 µg/g creatinine) (Table 5).
As a consequence of the normalization of ECd to Ecr, the impact of Cd on GFR was not realized. In a systematic review and meta-analysis of data from 28 studies [23], a 1.35-fold increase in the risk of proteinuria was seen when comparing the highest vs. lowest category of Cd dose metrics, while an increase in the risk of a reduced eGFR was statistically insignificant (p = 0.10). The statistically non-significant association between ECd and eGFR was likely due to a confounding effect of normalizing urinary Cd levels to the excretion of creatinine as ECd/Ecr, which was used by studies included in the meta-analysis by Jalili et al. [27]. An erroneous conclusion that Cd was not associated with a progressive reduction in GFR was also made in another systematic review by Byber et al. [28].
Our previous quantitative analysis of ECd in relation to ENAG suggested that Cd inflicts tubular cell injury at low intracellular concentrations, and that the toxicity intensifies as the concentration of Cd rises [19]. Inflammation and fibrosis follow, nephrons are lost, and the GFR falls [19]. In a recent histopathological examination of kidney biopsies from healthy kidney transplant donors [29], the degree of tubular atrophy was positively associated with the level of Cd accumulation. Tubular atrophy was observed at relatively low Cd levels (median: 13 µg/g wet tissue weight) [29].
The results of the present study confirm an inverse association between ECd and eGFR, which became apparent only after normalizing ECd to Ccr, as reported previously by us [20]. They also confirm a positive association between ECd and ENAG, an indicator of the injury to tubular cells by Cd. However, the effect of Cd accumulation in tubular cells on tubular reabsorptive dysfunction, indicated by an increase in EB2M, was not examined in our previous study. In effect, the present work provides evidence for the concurrent effects of chronic Cd exposure on eGFR, tubular injury and impaired tubular reabsorptive function in a Cd-dose-dependent manner.
It is noteworthy that ECd has been associated with tubular dysfunction in numerous studies, but only a few studies have simultaneously considered the tubular and glomerular effects of Cd. For example, in a study of 208 Guatemalan sugarcane cutters, higher ECd was associated with lower eGFR (β: −4.23) and higher excretion of neutrophil gelatinase-associated lipocalin, another marker of kidney tubular cell injury (β: 2.92) [30]. Both tubular and glomerular effects were observed in a study of Swedish women, where urinary Cd 0.67 µg/g creatinine was positively associated with ENAG while ECd 0.87 µg/g creatinine was inversely associated with eGFR [31].
Like NAG, kidney injury molecule 1 (KIM1), which is detectable in urine, originates from the tubular cells, and its excretion is correlated with that of Cd [32]. Excretion of KIM1 (EKIM1) has been used to quantify the injury to kidney tubular cells associated with Cd exposure [32,33,34]. KIM1 is found in the urine only after tubular injury has occurred [32,35]. An association between the excretion of Cd and KIM1 was noted in Taiwanese subjects with CKD after adjusting for covariates [16]. No correlation was found between excretion of Cd and protein, thereby suggesting that urinary KIM1 levels could serve as an early warning sign of kidney injury due to low-dose Cd exposure. In a cross-sectional study of 260 men and 440 women who were residents of a Cd-contaminated area of Thailand, EKIM1 was found to be more sensitive than ENAG and Eβ2MG for assessing the tubular effects of Cd [36].
Low environmental Cd exposure has consistently been associated with a reduction in eGFR among participants in various National Health and Nutrition Examination Survey cycles undertaken in the U.S. between 1999 and 2016 [14,37,38,39]. The geometric mean, and the 50th, 75th, 90th and 95th percentile values for urinary Cd levels in the representative U.S. general population were 0.210, 0.208, 0.412, 0.678 and 0.949 µg/g creatinine, and the corresponding values for blood Cd were 0.304, 0.300, 0.500, 1.10 and 1.60 µg/L, respectively [40]. According to these figures, environmental Cd exposure levels in the U.S. could be considered to be low. Cd exposure, measured as ECd, was associated with eGFR reductions in studies from Taiwan, Myanmar and Thailand [16,17,41].
Blood Cd levels of 1.74 μg/L and 2.08 μg/L were associated with low eGFR in two Korean population studies [42,43]. These blood Cd levels were approximately fourfold higher than the blood Cd levels found to be associated with low eGFR in a representative U.S. population [37,38,39]. An inverse association was seen between blood Cd and eGFR in another study of 1984 Koreans aged ≥19 years [44]. Although studies from various countries report disparate levels of environmental exposure to Cd, they are broadly consistent in that they have found that the exposure levels associated with an increased risk of low eGFR do not exceed a prescribed Cd toxicity threshold level of 5.24 µg/g creatinine. This Cd toxicity threshold level was derived from a risk assessment model that assumes β2M excretion above ≥300 µg/g creatinine as an endpoint [10.11].
The data in the present study strongly argue that a Cd-induced reduction in eGFR could be a suitable nephrotoxicity endpoint for health risk calculations. This endpoint is clinically relevant and is more sensitive to Cd toxicity than Eβ2M. In clinical trials, successful treatment of CKD is judged by the attenuation of a decline in eGFR [23,45].
5. Conclusions
The impact of Cd exposure on GFR has long been underestimated due to the common practice of normalizing ECd to Ecr. Consequently, the effects of environmental exposure to Cd on GFR and CKD risk have not been addressed adequately. The established nephrotoxicity threshold level for Cd is outdated and is not protective of human health. As a starting point, the comparability of guidelines between populations could be improved by universal acceptance of a consistent normalization of excretion of Cd to Ccr that circumvents the effect of muscle mass on creatinine excretion and gives a more accurate assessment of Cd nephropathy. It would also be beneficial if a reduction in eGFR was accepted as a critical effect for Cd toxicity suitable for health risk calculations, since reduced eGFR is more clinically relevant and more sensitive than a rise in excreted β2M.
Author Contributions
Conceptualization, S.S.; methodology, S.S.; formal analysis, S.S.; investigation, S.S.; resources, G.C.G. and D.A.V.; writing—original draft preparation, S.S.; writing—review and editing, G.C.G. and D.A.V.; project administration, S.S. All authors have read and agreed to the published version of the manuscript.
Funding
This research received no external funding.
Institutional Review Board Statement
This study analyzed archived data taken from a published report [17]. Ethical review and approval were not applicable.
Informed Consent Statement
All participants took part in the study after giving informed consent.
Data Availability Statement
All data are contained within this article.
Acknowledgments
This work was supported by resources from the Kidney Disease Research Collaborative, and the Department of Nephrology, Princess Alexandra Hospital.
Conflicts of Interest
The authors declare no conflict of interest.
References
- Nordberg, M.; Nordberg, G.F. Metallothionein and cadmium toxicology-historical review and commentary. Biomolecules 2022, 12, 360. [Google Scholar] [CrossRef] [PubMed]
- Genchi, G.; Sinicropi, M.S.; Lauria, G.; Carocci, A.; Catalano, A. The effects of cadmium toxicity. Int. J. Environ. Res. Public Health 2020, 17, 3782. [Google Scholar] [CrossRef]
- Thévenod, F.; Lee, W.K.; Garrick, M.D. Iron and cadmium entry into renal mitochondria: Physiological and toxicological implications. Front. Cell Dev. Biol. 2020, 8, 848. [Google Scholar] [CrossRef] [PubMed]
- Satarug, S.; Vesey, D.A.; Gobe, G.C. Current health risk assessment practice for dietary cadmium: Data from different countries. Food Chem. Toxicol. 2017, 106, 430–445. [Google Scholar] [CrossRef] [PubMed]
- Aoshima, K. Epidemiology of renal tubular dysfunction in the inhabitants of a cadmium-polluted area in the Jinzu River basin in Toyama Prefecture. Tohoku J. Exp. Med. 1987, 152, 151–172. [Google Scholar] [CrossRef]
- Horiguchi, H.; Aoshima, K.; Oguma, E.; Sasaki, S.; Miyamoto, K.; Hosoi, Y.; Katoh, T.; Kayama, F. Latest status of cadmium accumulation and its effects on kidneys, bone, and erythropoiesis in inhabitants of the formerly cadmium-polluted Jinzu River Basin in Toyama, Japan, after restoration of rice paddies. Int. Arch. Occup. Environ. Health 2010, 83, 953–970. [Google Scholar] [CrossRef]
- Argyropoulos, C.P.; Chen, S.S.; Ng, Y.H.; Roumelioti, M.E.; Shaffi, K.; Singh, P.P.; Tzamaloukas, A.H. Rediscovering beta-2 microglobulin as a biomarker across the spectrum of kidney diseases. Front. Med. 2017, 4, 73. [Google Scholar] [CrossRef]
- Portman, R.J.; Kissane, J.M.; Robson, A.M. Use of B2-microglobulin to diagnose tubulo-interstitial renal lesions in children. Kidney Int. 1986, 30, 91–98. [Google Scholar] [CrossRef]
- Gauthier, C.; Nguyen-Simonnet, H.; Vincent, C.; Revillard, J.-P.; Pellet, M.V. Renal tubular absorption of beta 2 micro-globulin. Kidney Int. 1984, 26, 170–175. [Google Scholar] [CrossRef]
- JECFA. Proceedings of the Joint FAO/WHO Expert Committee on Food Additives and Contaminants, Seventy-Third Meeting, Geneva, Switzerland, 8–17 June 2010; Summary and Conclusions; JECFA/73/SC; Food and Agriculture Organization of the United Nations: Rome, Italy; World Health Organization: Geneva, Switzerland, 2011; Available online: https://apps.who.int/iris/handle/10665/44521 (accessed on 31 July 2022).
- Wong, C.; Roberts, S.M.; Saab, I.N. Review of regulatory reference values and background levels for heavy metals in the human diet. Regul. Toxicol. Pharmacol. 2022, 130, 105122. [Google Scholar] [CrossRef]
- Moffett, D.B.; Mumtaz, M.M.; Sullivan, D.W., Jr.; Whittaker, M.H. Chapter 13, General Considerations of Dose-Effect and Dose-Response Relationships. In Handbook on the Toxicology of Metals, 5th ed.; Volume I: General Considerations; Nordberg, G., Costa, M., Eds.; Academic Press: Cambridge, MA, USA, 2022; pp. 299–317. [Google Scholar]
- Satarug, S.; Vesey, D.A.; Nishijo, M.; Ruangyuttikarn, W.; Gobe, G.C. The inverse association of glomerular function and urinary β2-MG excretion and its implications for cadmium health risk assessment. Environ. Res. 2019, 173, 40–47. [Google Scholar] [CrossRef] [PubMed]
- Ferraro, P.M.; Costanzi, S.; Naticchia, A.; Sturniolo, A.; Gambaro, G. Low level exposure to cadmium increases the risk of chronic kidney disease: Analysis of the NHANES 1999–2006. BMC Public Health 2010, 10, 304. [Google Scholar] [CrossRef] [PubMed]
- Satarug, S.; Boonprasert, K.; Gobe, G.C.; Ruenweerayut, R.; Johnson, D.W.; Na-Bangchang, K.; Vesey, D.A. Chronic exposure to cadmium is associated with a marked reduction in glomerular filtration rate. Clin. Kidney J. 2018, 12, 468–475. [Google Scholar] [CrossRef]
- Tsai, K.F.; Hsu, P.C.; Lee, C.T.; Kung, C.T.; Chang, Y.C.; Fu, L.M.; Ou, Y.C.; Lan, K.C.; Yen, T.H.; Lee, W.C. Association between enzyme-linked immunosorbent assay-measured kidney injury markers and urinary cadmium levels in chronic kidney disease. J. Clin. Med. 2021, 11, 156. [Google Scholar] [CrossRef] [PubMed]
- Win-Thu, M.; Myint-Thein, O.; Win-Shwe, T.-T.; Mar, O. Environmental cadmium exposure induces kidney tubular and glomerular dysfunction in the Myanmar adults. J. Toxicol. Sci. 2021, 46, 319–328. [Google Scholar] [CrossRef]
- Schnaper, H.W. The tubulointerstitial pathophysiology of progressive kidney disease. Adv. Chron. Kidney Dis. 2017, 24, 107–116. [Google Scholar] [CrossRef]
- Satarug, S.; Vesey, D.A.; Ruangyuttikarn, W.; Nishijo, M.; Gobe, G.C.; Phelps, K.R. The source and pathophysiologic significance of excreted cadmium. Toxics 2019, 7, 55. [Google Scholar] [CrossRef]
- Satarug, S.; Vesey, D.A.; Nishijo, M.; Ruangyuttikarn, W.; Gobe, G.C.; Phelps, K.R. The effect of cadmium on GFR is clarified by normalization of excretion rates to creatinine clearance. Int. J. Mol. Sci. 2021, 22, 1762. [Google Scholar] [CrossRef]
- Satarug, S.; Swaddiwudhipong, W.; Ruangyuttikarn, W.; Nishijo, M.; Ruiz, P. Modeling cadmium exposures in low- and high-exposure areas in Thailand. Environ. Health Perspect. 2013, 121, 531–536. [Google Scholar] [CrossRef]
- Hornung, R.W.; Reed, L.D. Estimation of average concentration in the presence of nondetectable values. Appl. Occup. Environ. Hyg. 1990, 5, 46–51. [Google Scholar] [CrossRef]
- Levey, A.S.; Becker, C.; Inker, L.A. Glomerular filtration rate and albuminuria for detection and staging of acute and chronic kidney disease in adults: A systematic review. JAMA 2015, 313, 837–846. [Google Scholar] [CrossRef] [PubMed]
- Soveri, I.; Berg, U.B.; Björk, J.; Elinder, C.G.; Grubb, A.; Mejare, I.; Sterner, G.; Bäck, S.E.; SBU GFR Review Group. Measuring GFR: A systematic review. Am. J. Kidney Dis. 2014, 64, 411–424. [Google Scholar] [CrossRef] [PubMed]
- White, C.A.; Allen, C.M.; Akbari, A.; Collier, C.P.; Holland, D.C.; Day, A.G.; Knoll, G.A. Comparison of the new and traditional CKD-EPI GFR estimation equations with urinary inulin clearance: A study of equation performance. Clin. Chim. Acta 2019, 488, 189–195. [Google Scholar] [CrossRef] [PubMed]
- Phelps, K.R.; Gosmanova, E.O. A generic method for analysis of plasma concentrations. Clin. Nephrol. 2020, 94, 43–49. [Google Scholar] [CrossRef]
- Jalili, C.; Kazemi, M.; Cheng, H.; Mohammadi, H.; Babaei, A.; Taheri, E.; Moradi, S. Associations between exposure to heavy metals and the risk of chronic kidney disease: A systematic review and meta-analysis. Crit. Rev. Toxicol. 2021, 51, 165–182. [Google Scholar] [CrossRef]
- Byber, K.; Lison, D.; Verougstraete, V.; Dressel, H.; Hotz, P. Cadmium or cadmium compounds and chronic kidney disease in workers and the general population: A systematic review. Crit. Rev. Toxicol. 2016, 46, 191–240. [Google Scholar] [CrossRef]
- Butler-Dawson, J.; James, K.A.; Krisher, L.; Jaramillo, D.; Dally, M.; Neumann, N.; Pilloni, D.; Cruz, A.; Asensio, C.; Johnson, R.J.; et al. Environmental metal exposures and kidney function of Guatemalan sugarcane workers. J. Expo. Sci. Environ. Epidemiol. 2022, 32, 461–471. [Google Scholar] [CrossRef]
- Akesson, A.; Lundh, T.; Vahter, M.; Bjellerup, P.; Lidfeldt, J.; Nerbrand, C.; Samsioe, G.; Strömberg, U.; Skerfving, S. Tubular and glomerular kidney effects in Swedish women with low environmental cadmium exposure. Environ. Health Perspect. 2005, 113, 1627–1631. [Google Scholar] [CrossRef]
- Barregard, L.; Sallsten, G.; Lundh, T.; Mölne, J. Low-level exposure to lead, cadmium and mercury, and histopathological findings in kidney biopsies. Environ. Res. 2022, 211, 113119. [Google Scholar] [CrossRef]
- Prozialeck, W.C.; Vaidya, V.S.; Liu, J.; Waalkes, M.P.; Edwards, J.R.; Lamar, P.C.; Bernard, A.M.; Dumont, X.; Bonventre, J.V. Kidney injury molecule-1 is an early biomarker of cadmium nephrotoxicity. Kidney Int. 2007, 72, 985–993. [Google Scholar] [CrossRef] [Green Version]
- Zhang, Y.R.; Wang, P.; Liang, X.X.; Tan, C.S.; Tan, J.B.; Wang, J.; Huang, Q.; Huang, R.; Li, Z.X.; Chen, W.C.; et al. Associations between urinary excretion of cadmium and renal biomarkers in non-smoking females: A cross-sectional study in rural areas of South China. Int. J. Environ. Res. Public Health 2015, 12, 11988–12001. [Google Scholar] [CrossRef] [PubMed]
- Pennemans, V.; De Winter, L.M.; Munters, E.; Nawrot, T.S.; Van Kerkhove, E.; Rigo, J.M.; Reynders, C.; Dewitte, H.; Carleer, R.; Penders, J.; et al. The association between urinary kidney injury molecule 1 and urinary cadmium in elderly during long-term, low-dose cadmium exposure: A pilot study. Environ. Health 2011, 10, 77. [Google Scholar] [CrossRef] [PubMed]
- Prozialeck, W.C.; Edwards, J.R.; Lamar, P.C.; Liu, J.; Vaidya, V.S.; Bonventre, J.V. Expression of kidney injury molecule-1 (Kim-1) in relation to necrosis and apoptosis during the early stages of Cd-induced proximal tubular injury. Toxicol. Appl. Pharmacol. 2009, 238, 306–314. [Google Scholar] [CrossRef] [PubMed]
- Ruangyuttikarn, W.; Panyamoon, A.; Nambunmee, K.; Honda, R.; Swaddiwudhipong, W.; Nishijo, M. Use of the kidney injury molecule-1 as a biomarker for early detection of renal tubular dysfunction in a population chronically exposed to cadmium in the environment. SpringerPlus 2013, 2, 533. [Google Scholar] [CrossRef]
- Navas-Acien, A.; Tellez-Plaza, M.; Guallar, E.; Muntner, P.; Silbergeld, E.; Jaar, B.; Weaver, V. Blood cadmium and lead and chronic kidney disease in US adults: A joint analysis. Am. J. Epidemiol. 2009, 170, 1156–1164. [Google Scholar] [CrossRef]
- Lin, Y.S.; Ho, W.C.; Caffrey, J.L.; Sonawane, B. Low serum zinc is associated with elevated risk of cadmium nephrotoxicity. Environ. Res. 2014, 134, 33–38. [Google Scholar] [CrossRef]
- Madrigal, J.M.; Ricardo, A.C.; Persky, V.; Turyk, M. Associations between blood cadmium concentration and kidney function in the U.S. population: Impact of sex, diabetes and hypertension. Environ. Res. 2018, 169, 180–188. [Google Scholar] [CrossRef]
- Crinnion, W.J. The CDC fourth national report on human exposure to environmental chemicals: What it tells us about our toxic burden and how it assists environmental medicine physicians. Altern. Med. Rev. 2010, 15, 101–108. [Google Scholar]
- Satarug, S.; Gobe, G.C.; Ujjin, P.; Vesey, D.A. A comparison of the nephrotoxicity of low doses of cadmium and lead. Toxics 2020, 8, 18. [Google Scholar] [CrossRef]
- Myong, J.-P.; Kim, H.-R.; Baker, D.; Choi, B. Blood cadmium and moderate-to-severe glomerular dysfunction in Korean adults: Analysis of KNHANES 2005-2008 data. Int. Arch. Occup. Environ. Health 2012, 85, 885–893. [Google Scholar] [CrossRef]
- Chung, S.; Chung, J.H.; Kim, S.J.; Koh, E.S.; Yoon, H.E.; Park, C.W.; Chang, Y.S.; Shin, S.J. Blood lead and cadmium levels and renal function in Korean adults. Clin. Exp. Nephrol. 2014, 18, 726–734. [Google Scholar] [CrossRef] [PubMed]
- Park, Y.; Lee, S.J. Association of blood heavy metal levels and renal function in Korean adults. Int. J. Environ. Res. Public Health 2022, 19, 6646. [Google Scholar] [CrossRef] [PubMed]
- Kalantar-Zadeh, K.; Jafar, T.H.; Nitsch, D.; Neuen, B.L.; Perkovic, V. Chronic kidney disease. Lancet 2021, 398, 786–802. [Google Scholar] [CrossRef]
Publisher’s Note: MDPI stays neutral with regard to jurisdictional claims in published maps and institutional affiliations. |
© 2022 by the authors. Licensee MDPI, Basel, Switzerland. This article is an open access article distributed under the terms and conditions of the Creative Commons Attribution (CC BY) license (https://creativecommons.org/licenses/by/4.0/).