
Multi-Dimensional Comparison of the Impact Mechanism of the Self-Rated Health Status of Urban and Rural Residents in Chinese Social Environments


Abstract
:1. Introduction
2. Materials and Methods
2.1. Data Source and Processing
2.1.1. Individual Data
- Data source
- 2.
- Data processing
- (1)
- Dependent variable. The dependent variable came from the survey of SRHS in CGSS, using a five-point scale. To ensure concise and comparable data, we converted the scale into a binary format, namely “healthy” (indicated by 1) and “unhealthy” (indicated by 0) (Table 1). “Very healthy”, “relatively healthy”, and “average” on the original scale were classified as “healthy”, and “unhealthy” and “very unhealthy” were classified as “unhealthy”.
- (2)
- Independent variable. At the individual level, we included information such as location, personal and family attributes, income level, work status, social security, physical exercise, happiness, and information sources (Table 1). First, location is a sign of the connection between levels of the multi-layer model that includes both urban and rural differences and inter-provincial differences. Second, at the individual level, we added two indicators—happiness and information sources—in addition to education, marriage, income, work, insurance, and exercise, used in previous studies. Happiness is a subjective feeling, such as SRHS, but a close relationship between the two constructs has been agreed by scholars [28]. The information source indicator was mainly used to reflect the ubiquitous role of the Internet in ensuring that people can conveniently access knowledge and consultations about their health. This access to information ultimately serves to improve daily living habits and detect changes in individuals’ health status as early as possible [29]. Finally, as for the dependent variable, we simplified some of the measurement options for some of the independent variables. This was done in two ways: by transforming responses into binary data, and reducing categorical items such as educational level. Where key information in the questionnaire was missing, these data were deleted. After removing incomplete data, a total of 27,894 sample data remained. Further inspection of data distribution showed that the distribution of sample data across provinces was consistent for the different years, with a mean percentage of 3.57% for each province in each year. Therefore, the missing values had no significant effect on the study.
2.1.2. Provincial Data
- Data source
- 2.
- Data processing
2.2. Methods
3. Results
3.1. Spatial Analysis
- (1)
- Chinese residents’ levels of SRHS had declined. From 2010 to 2017, the sample quantity increased, but the structure remained the same. In 2013, the ratio of rural to urban data was 1.5:8.5, and for the other two years, the ratio was 2:8 (rural to urban). The change in standard deviation shows that the SRHS difference among Chinese residents expanded, especially for rural residents whose annual standard deviation was larger than the full sample level. The proportion of healthy groups of Chinese residents declined but remained at a relatively high level (Table 3). The health status of urban residents was relatively stable, whereas the proportion of unhealthy rural residents had increased significantly, providing the main reason for the decline of the overall health level.
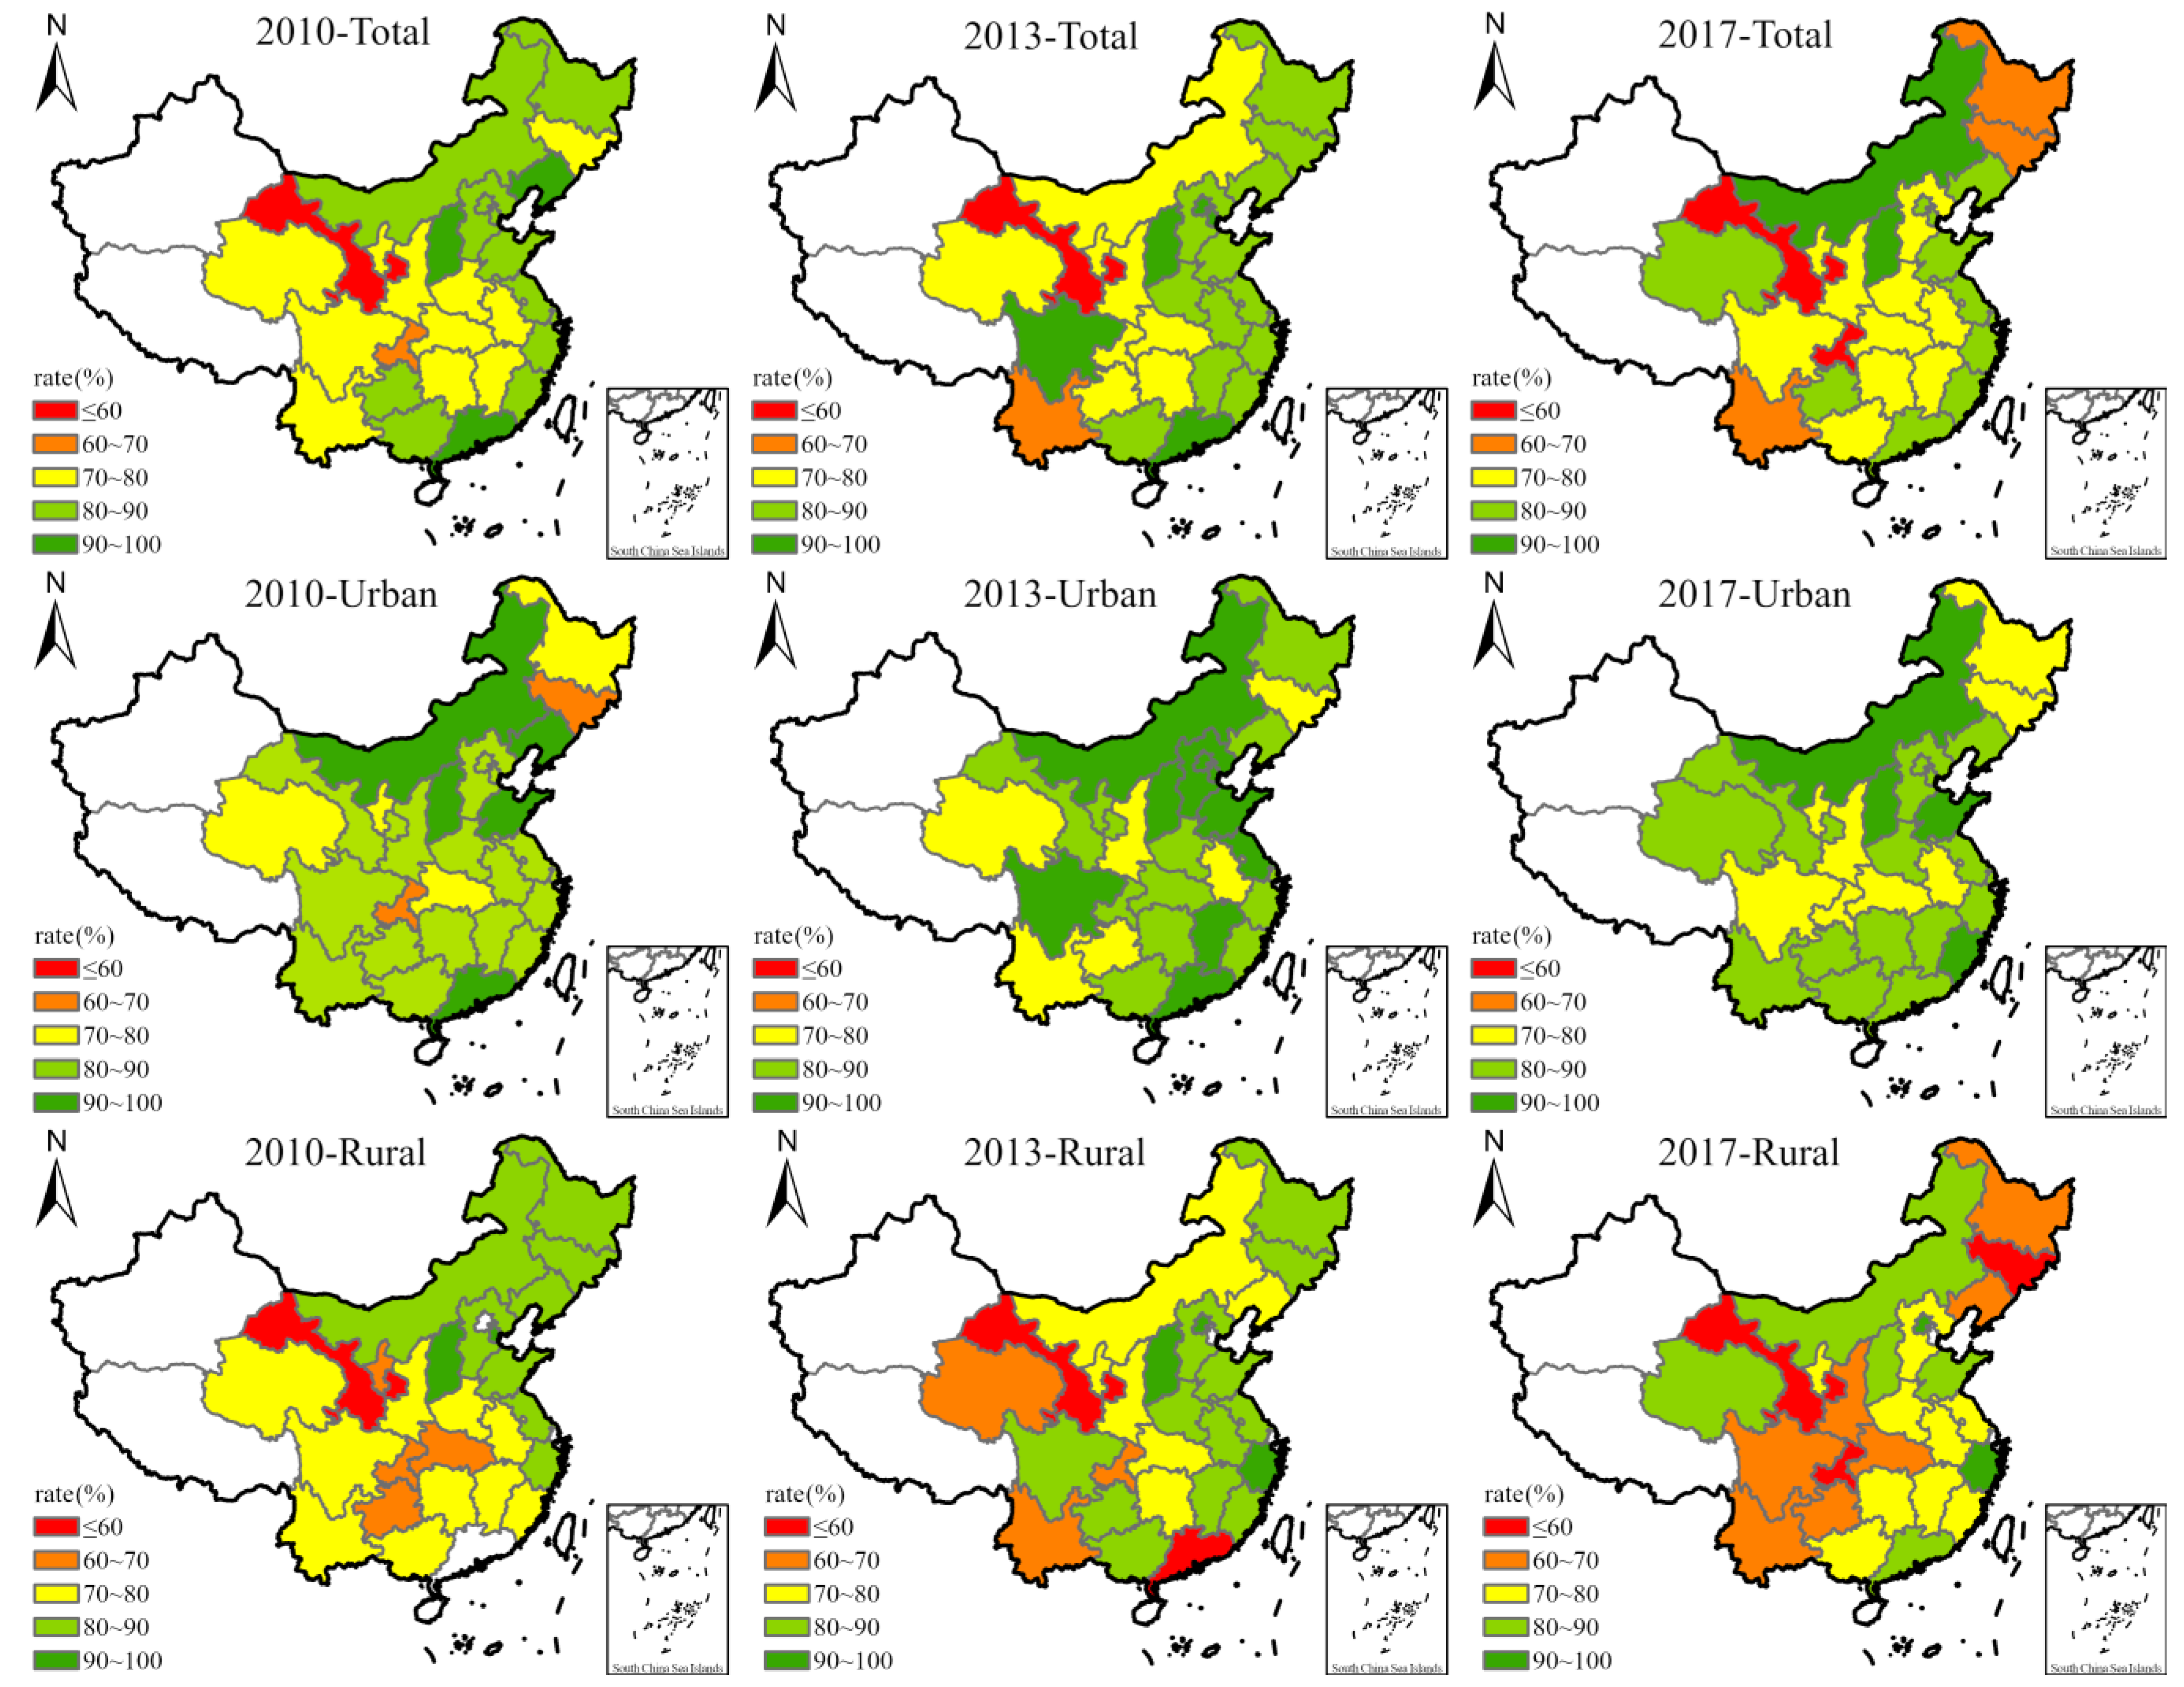
- (2)
- The SRHS showed significant spatial gradient distribution characteristics. The health status of people in the eastern coastal areas was relatively higher than those in other areas, and the healthy ratio consistently remained above 80% (Figure 1). In the central region, except for Shanxi, the health level was relatively high, but other provinces reported mid-levels of health. The western region had poor health status—the proportion of healthy people in Gansu never exceeded 60%, possibly related to the outdated public services in that region. The health levels of Heilongjiang and Jilin in Northeast China declined each year, which may be related to the serious population outflow and increased aging population in Northeast China. When the sample was divided into urban and rural groups, the spatial gradient of health status became more obvious, especially the health status of rural residents. Urban residents’ health status was generally high, and the areas with lower health levels gradually shrank. Rural residents showed the opposite trend. The proportion of unhealthy groups and regions continue to expand, and the health status of rural residents in the northwest, southwest, and northeast regions was poor.
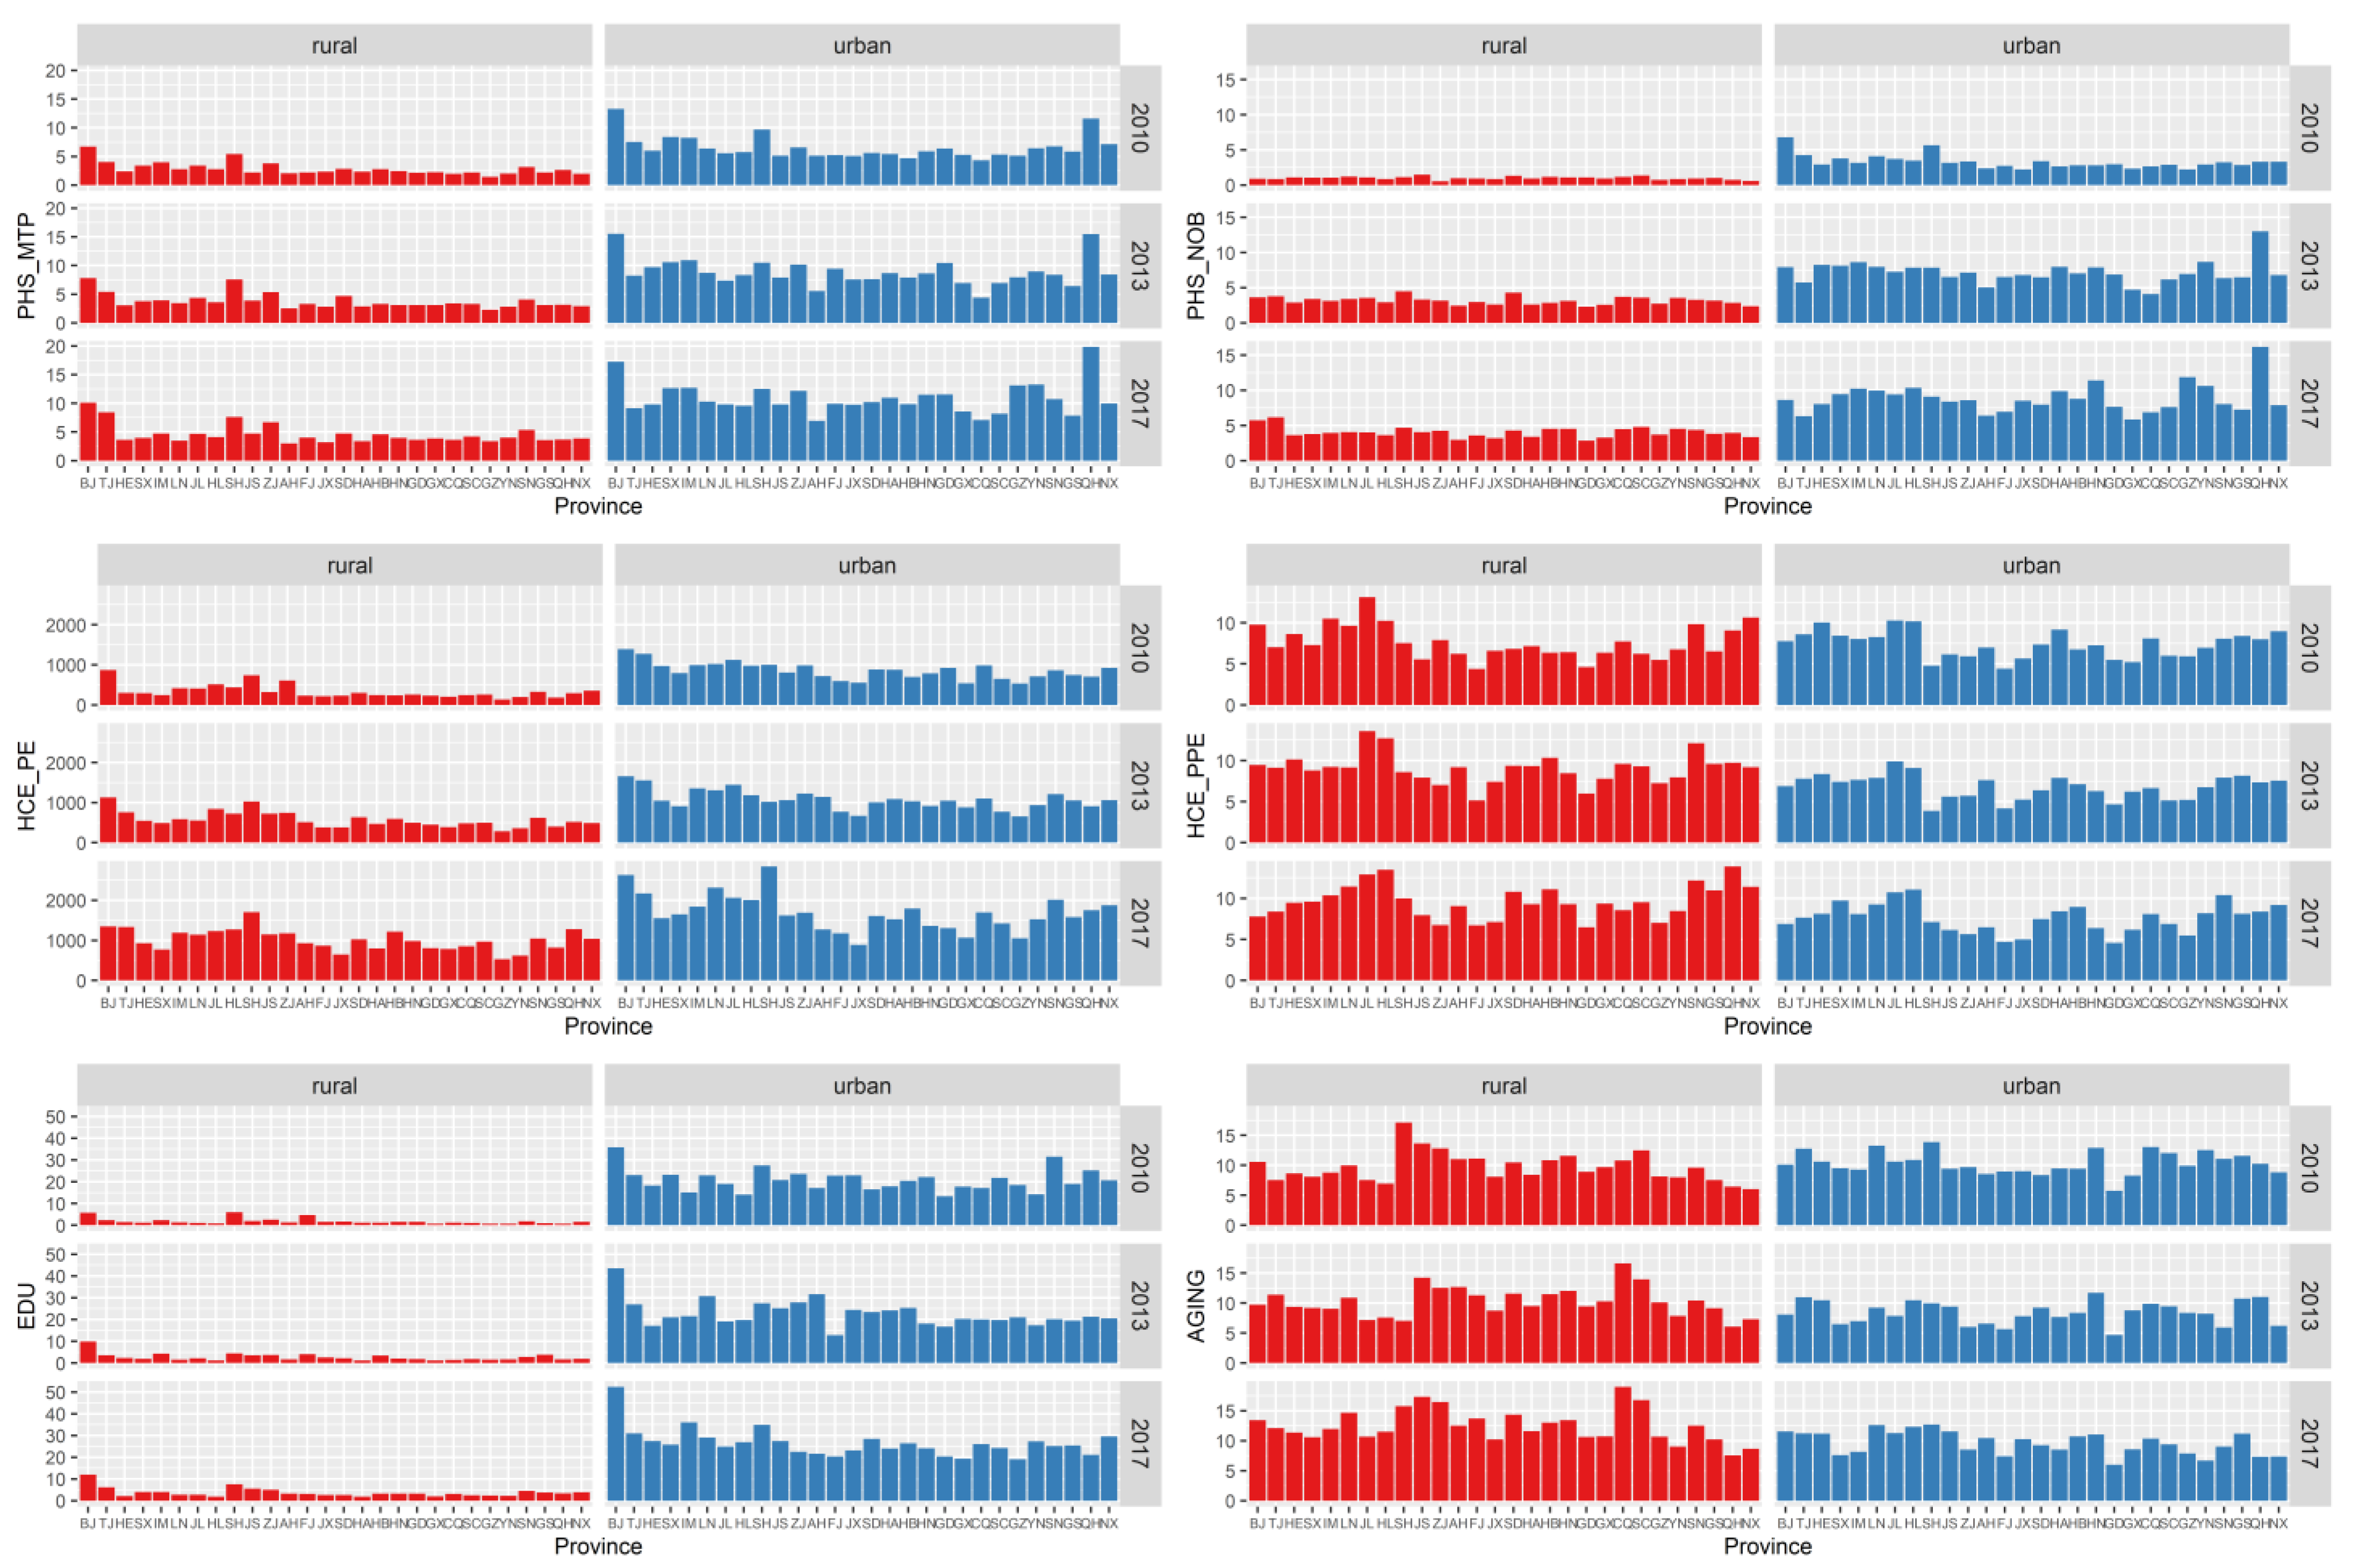
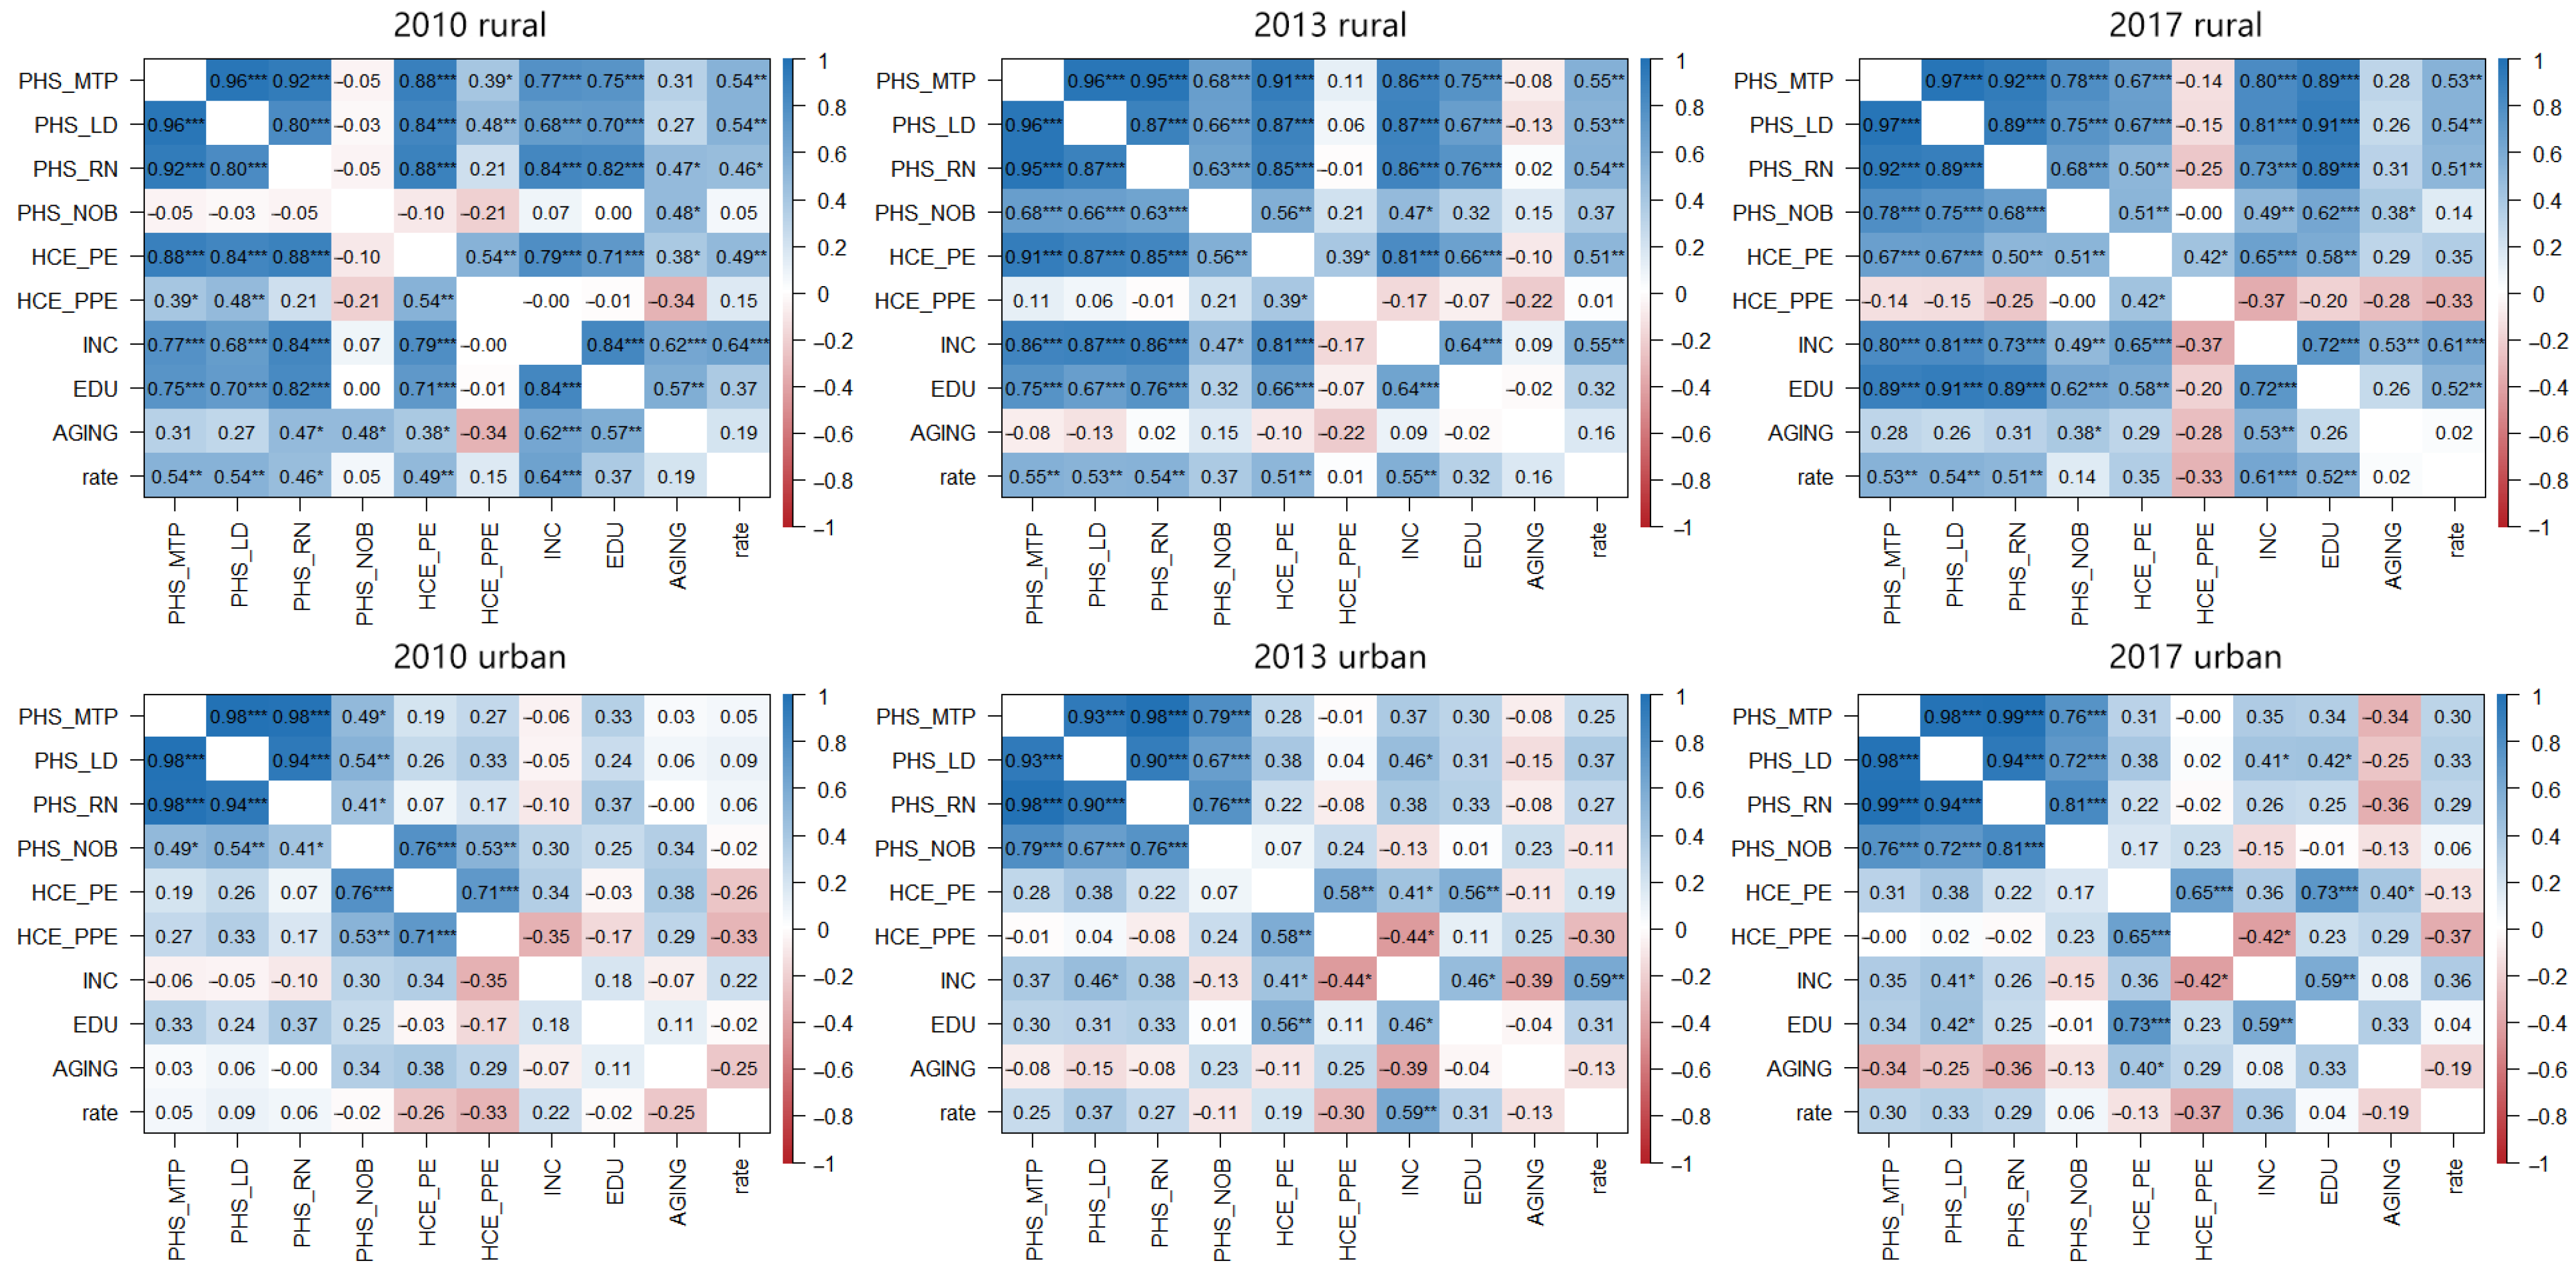
- (3)
- There were obvious shortcomings in rural public services. Further comparison of the social environment of provincial-level regions showed little difference between urban and rural aging and the proportion of health and medical consumption. However, there was a large gap between urban and rural medical staff and the number of hospital beds, health and medical consumption expenditure, and education level (Figure 2). Correlation analysis also showed that the level of medical services, income, medical expenses, and education levels in rural areas were significantly correlated, but the correlations between these factors in urban areas were not significant (Figure 3). In fact, by the end of 2016, the urbanization rate in China was 57.35%, and the urbanization rate in eight provinces did not exceed 50%, including provinces with poor health levels such as Gansu, Sichuan, Yunnan, and Guizhou. Therefore, given the large rural population, rural public services had obvious shortcomings. The strength and changing trend of these specific influences required further testing by HLM analysis.
3.2. Cross Analysis
- (1)
- Married men reported better health. Although the average life expectancy of Chinese women was significantly higher than that of men (According to the China Statistical Yearbook, the average life expectancy of Chinese men in 2015 was 73.64 years, whereas the average life expectancy of Chinese women was 79.43 years.), the results showed that men’s health was better than women’s in urban and rural areas (Table 4). The gap between the two was not obvious in cities, but more prominent in rural areas. This finding may be related to the fact that there are more women left behind in rural areas who must undertake multiple tasks such as agricultural production, children’s education, and elderly care. As a result, the health rate of unmarried women in rural areas was below 70%, dropping to 66.08% in 2017. Correspondingly, the mutual support of family members was a strong guarantee of health, and the health of the married population was better. Although physical fitness brought health benefits, there was no significant difference linked to whether BMI was above the norm.
- (2)
- Public officials working full-time on non-farm jobs were in better health. Differences in health status caused by occupational attributes were the most prominent. More than 90% of residents engaged in non-farm work in urban or rural areas were consistently healthy (Table 4). Farm workers face long-term physical demands and part-time work compresses leisure and exercise time. These workers usually have a relatively low income level and poor health. Working in a government department (usually publicly owned) is associated with relatively sound social security and employee welfare systems, and urban public officials generally had better health in terms of job attributes. Higher-level (urban) departments in China typically pay better salaries than lower-level (rural) departments. Examining medical insurance participation showed no significant difference in the impact of medical insurance on SRHS—medical insurance did not negatively affect health, but rather reflects China’s very high participation rate. Survey data showed that over 90% of urban and rural residents had medical insurance, most likely because of China’s targeted poverty alleviation strategy since 2013, with its core policy of basic medical insurance. The wide medical insurance coverage has led to a significant improvement in the medical security level of the rural population.
- (3)
- Happiness was a strong support for physical and mental health. Of all individual-level attributes, happiness had the most significant impact on SRHS. Even in 2017, the proportion of unhealthy rural residents who considered life unhappy exceeded 50% (Table 4). Regardless of urban or rural residence, the health status of the unhappy population was relatively poor and showed a worsening trend. Happiness and SRHS may be mutually causal. Both are the result of self-assessment, and the physical and economic burdens caused by other factors (e.g., diseases) also affect perception of happiness.
- (4)
- Moderate exercise was good for health. Although physical exercise can improve immunity and maintain physical function, the intensity of exercise varies from person to person, and more exercise is not always better. The results of the survey showed that people who performed high-intensity physical exercise several times per month had the best SRHS (Table 4); among them, the health rate of rural residents was consistently above 80%, and that of urban residents consistently at 90%.
- (5)
- New media promoted the efficient dissemination of health knowledge. The ‘2010 Chinese Language Life Status Report’ issued by the Chinese Ministry of Education pointed out that 2010 was the first year of Weibo and the Internet ecology with Weibo as the carrier. With its fast information transmission and strong fidelity, Weibo quickly occupied an important position in people’s lives. In 2013, the launch of the “4G” network and the widespread popularity of smartphones prompted Chinese residents to enter the era of high-speed communication amid the rapid development of mobile terminal software and hardware. Every resident can now use a smartphone to get real-time health information through Weibo and other applications, greatly improving people’s awareness of health management and disease prevention. The survey data strongly showed the important influence of technological innovation. The SRHS of people who used new media as the main source of information reached an excellent level in the initial stages (2010 and 2013), but it declined significantly in 2017 (Table 4). After the explosion of the information scale, the proportion of false information also increased significantly, possibly impacting people’s judgments. The increased dependence on mobile phones has also produced many negative habits that affect people’s health.
3.3. HLM Analysis
- (1)
- The impact of the individual level on the SRHS of urban and rural residents was the same. The individual level contained 19 variables, and 12 of these showed a significant impact on the SRHS, covering all categories except social security (Table 5). Among them, age, work experience, and happiness had significant effects on urban and rural residents each year; education and family income were consistently important factors for rural residents, whereas exercise frequency was consistently important for urban residents. The remaining variables differed greatly between urban and rural areas across years. The influence of each variable on SRHS was consistent with the previous analysis, that is, people with good health status were mainly young and well-educated, engaged in non-farm work with a high family income, exercising regularly, actively receiving the latest information, and with a strong sense of happiness.
- (2)
- The impact of the provincial level on the SRHS of urban and rural residents varied greatly. The provincial level contained 14 variables, and five showed a significant impact on SRHS, covering all categories at the provincial level except population structure (Table 5). No variable had a significant impact both in urban and rural areas. Among them, medical technical persons, licensed doctors, and the public green area had a significant impact on rural residents, and medical expenses and their proportions had a significant impact on urban residents. All variables were only significant in 1 year except for the proportion of medical expenses, which always had a negative effect.
- (3)
- The changing trend in the influence of each variable reflected the difference in demand between urban and rural residents. At the individual level, the influence of education on rural residents gradually increased, reflecting the general improvement in the quality of the rural labor force (Table 5). The influence on urban residents had declined, which may be related to the greater mental pressure faced by groups with higher education. The influence of work experience on rural residents declined, possibly related to the common part-time work pattern (linked to seasonal farming work) of rural residents. The influence of happiness on rural residents also decreased, but its influence on urban residents is increasing—perhaps linked to the pursuit of a high-quality life by urban residents. The influence of BMI and information sources were only highlighted in the first 2 years, indicating that most people already had awareness of body management as a key factor affecting future health. At the provincial level, rural areas had changed from supplementing medical resources in the early stages to constructing public green areas in the later years, and overall health-related infrastructure had improved. The infrastructure in urban areas was relatively sound, but urban residents had long faced the problem of a high proportion of medical expenses. In the process of gradually improving the infrastructure in rural areas, rural residents are also likely to face similar problems. The cost of medical insurance in China has nearly doubled from CNY 180 in 2017 to CNY 350 in 2022—for all residents. For rural residents with an annual per capita income of less than CNY 20,000, that burden is very heavy.
4. Discussion
- (1)
- Narrowing the gap between urban and rural areas is key to improving regional health. The vast gap between urban and rural areas—whether at the individual or provincial level—and the overall shortcomings of rural areas significantly affect the health level of China and its regions. More concerning, the gap between urban and rural areas has not narrowed significantly [34] and the health of rural residents continues to deteriorate. In the process of improving the health of rural residents by increasing their income, a population migration route from rural areas in undeveloped provinces to cities in undeveloped provinces to cities in developed provinces has gradually formed, making urban-rural differences deeply bound to provincial differences [35]. The fact that the spatial pattern of health rate was consistent with the pattern of China’s social and economic development illustrates this point. The resulting cumulative effect has caused an imbalance in the regional high-quality labor force and also enhanced people’s sensitivity to the social environment, magnifying the influence of the social environment on health in regional comparisons.
- (2)
- Multiple challenges in improving rural health. We incorporated all the variables in this paper—and their influences—into a unified framework (Figure 4). Urban and rural differences are significant, along with regional differences. This verifies the necessity of analyzing the impact mechanism of SRHS from different levels and scales, such as urban and rural areas and provincial regions. The performance of the variables suggests an underlying reason for the differences in work attributes, living customs, social welfare, and other aspects caused by the functional orientation of urban and rural areas [36]. The nature of their work and living customs means that rural residents, especially farmers engaged in agricultural production, have significantly higher exposure risks to environmental pollution than urban residents [37]. Therefore, rural residents are more sensitive to differences in the social environment and eager to change their working and leisure environments to places comparable with those in cities. However, economic development concentrates in cities and rural areas are faced with the contradiction of strong demand but insufficient investment [38]. Although urban and rural integration is key to achieving rural revitalization, a one-way flow from the countryside to the city is more common. This uni-directional movement may have obvious effects of improved health for individuals but has a minimal impact on promoting regional health. This reminds us that although health is a manifestation of individual conditions, improving health requires transformation of the individual—and more importantly—of the social environment. Therefore, in response to the problems of happiness, green space, and the widespread aging of rural areas that rural residents care about, improvement measures are needed in the following areas. First, we should carry forward traditional culture and make full use of the rural stage. While enhancing the sense of local identity and belonging, this would also support the health of the villagers. Second, with rural “left-behind” women as the main labor force, a new mode of home-based care for the elderly should be explored in rural areas under the unified arrangement and supervision of village committees. The third is to deepen the hierarchical diagnosis and treatment system. This would ensure that common and chronic diseases are treated conveniently and efficiently in the county, ultimately improving rural residents’ willingness to seek medical treatment.
5. Conclusions
- (1)
- The SRHS of Chinese residents showed a temporal trend of gradual decline in overall level, a spatial gradient pattern with gradual deterioration in the east, the middle regions, and the west, and a regional difference where rural regions were generally less developed. Multi-dimensional comparative analysis provided a more comprehensive and in-depth understanding of the impact mechanism of SRHS, and strengthened understanding that narrowing the gap between urban and rural areas in China is key to improving regional health.
- (2)
- The performance of variables such as happiness, information sources, and leisure space reflects how SRHS is tilting toward mental health. Medical insurance coverage in China has risen to a high level and the influence of social environmental pressure on health has gradually become dominant. In the future, it is necessary to increase the investment in the mental health industry while continuing to improve infrastructure construction and promote the development of the health industry.
- (3)
- Spatial patterns and urban-rural differences indicate that regional health levels are consistent with socioeconomic development stages. Migrating to developed areas with a better social environment can only improve personal health in the short term, and such individuals will still face high costs of urban medical services in the future. Only by further eliminating the differences in the sensitivity of urban and rural residents to the social environment and by grading the allocation of medical service resources can regional health levels be truly improved.
Author Contributions
Funding
Institutional Review Board Statement
Informed Consent Statement
Data Availability Statement
Acknowledgments
Conflicts of Interest
References
- Chen, M.; Zhou, Y.; Huang, X.; Ye, C. The Integration of New-Type Urbanization and Rural Revitalization Strategies in China: Origin, Reality and Future Trends. Land 2021, 10, 207. [Google Scholar] [CrossRef]
- Dorelien, A.; Xu, H. Estimating Rural-Urban Disparities in Self-Rated Health in China: Impact of Choice of Urban Definition. Demogr. Res. 2020, 43, 1429–1460. [Google Scholar] [CrossRef]
- Jylh, M. What Is Self-Rated Health and Why Does It Predict Mortality? Towards a Unified Conceptual Model. Soc. Sci. Med. 2009, 69, 307–316. [Google Scholar] [CrossRef]
- Vonneilich, N.; Jöckel, K.-H.; Erbel, R.; Klein, J.; Dragano, N.; Siegrist, J.; von dem Knesebeck, O. The Mediating Effect of Social Relationships on the Association between Socioeconomic Status and Subjective Health—Results from the Heinz Nixdorf Recall Cohort Study. BMC Public Health 2012, 12, 285. [Google Scholar] [CrossRef] [PubMed]
- Cui, X.; Chang, C.-T. How Income Influences Health: Decomposition Based on Absolute Income and Relative Income Effects. Int. J. Environ. Res. Public Health 2021, 18, 10738. [Google Scholar] [CrossRef] [PubMed]
- Woo, J.; Yu, R.; Cheung, K.; Lai, E.T.C. How Much Money Is Enough? Poverty and Health in Older People. J. Nutr. Health Aging 2020, 24, 1111–1115. [Google Scholar] [CrossRef]
- Vanzella-Yang, A.; Veenstra, G. Family Income and Health in Canada: A Longitudinal Study of Stability and Change. BMC Public Health 2021, 21, 333. [Google Scholar] [CrossRef]
- Schellekens, J.; Ziv, A. The Role of Education in Explaining Trends in Self-Rated Health in the United States, 1972–2018. Demogr. Res. 2020, 42, 383–398. [Google Scholar] [CrossRef]
- Lamidi, E.O. Trends in Self-Rated Health by Union Status and Education, 2000–2018. SSM Popul. Health 2020, 11, 100616. [Google Scholar] [CrossRef]
- Park, M.Y.; Park, J.; Myong, J.-P.; Kim, H.-R.; Lee, D.-W.; Kang, M.-Y. Poor Worker’s Long Working Hours Paradox: Evidence from the Korea National Health and Nutrition Examination Survey. Ann. Occup. Environ. Med. 2022, 34, e2. [Google Scholar] [CrossRef]
- Honjo, K.; Iso, H.; Ikeda, A.; Yamagishi, K.; Saito, I.; Kato, T.; Yasuda, N.; Aoyagi, K.; Arima, K.; Sakata, K.; et al. Cross-Sectional Association between Employment Status and Self-Rated Health among Middle-Aged Japanese Women: The Influence of Socioeconomic Conditions and Work-Life Conflict. J. Epidemiol. 2020, 30, 396–403. [Google Scholar] [CrossRef] [PubMed]
- He, L.; Zhang, Z.; Wang, J.; Wang, Y.; Li, T.; Yang, T.; Liu, T.; Wu, Y.; Zhang, S.; Zhang, S.; et al. Effects of Serving as a State Functionary on Self-Rated Health: Empirical Evidence from China. Front. Public Health 2022, 10, 757036. [Google Scholar] [CrossRef] [PubMed]
- Gu, J.; Ming, X. The Influence of Living Conditions on Self-Rated Health: Evidence from China. Int. J. Environ. Res. Public Health 2021, 18, 9200. [Google Scholar] [CrossRef] [PubMed]
- Nie, X.; Li, Y.; Li, C.; Wu, J.; Li, L. The Association Between Health Literacy and Self-Rated Health Among Residents of China Aged 15–69 Years. Am. J. Prev. Med. 2021, 60, 569–578. [Google Scholar] [CrossRef] [PubMed]
- Guan, J. Does School-Based Private Health Insurance Improve Students’ Health Status? Evidence from China. Ekon. Istraz. 2021, 34, 469–483. [Google Scholar] [CrossRef]
- Shi, H.; Gao, L.; Wang, G. How Does Media Use Promote the Purchase of Private Medical Insurance? A Moderated Mediation Model. Front. Psychol. 2022, 13, 894195. [Google Scholar] [CrossRef]
- Macintyre, S.; Ellaway, A.; Cummins, S. Place Effects on Health: How Can We Conceptualise, Operationalise and Measure Them? Soc. Sci. Med. 2002, 55, 125–139. [Google Scholar] [CrossRef]
- Pinder, R.; Kessel, A.; Green, J.; Grundy, C. Exploring Perceptions of Health and the Environment: A Qualitative Study of Thames Chase Community Forest. Health Place 2009, 15, 349–356. [Google Scholar] [CrossRef]
- Chen, Y.; Stephens, M.; Jones, C.A. Does Residents’ Satisfaction with the Neighbourhood Environment Relate to Residents’ Self-Rated Health? Evidence from Beijing. Int. J. Environ. Res. Public Health 2019, 16, 5051. [Google Scholar] [CrossRef]
- Liu, F.; Tian, Y.; Jim, C.; Wang, T.; Luan, J.; Yan, M. Residents’ Living Environments, Self-Rated Health Status and Perceptions of Urban Green Space Benefits. Forests 2022, 13, 9. [Google Scholar] [CrossRef]
- Gunko, R.; Rapeli, L.; Vuorisalo, T.; Scheinin, M.; Karell, P. Does Water Quality Matter for Life Quality? A Study of the Impact of Water Quality on Well-Being in a Coastal Community. Environ. Manag. 2022, 70, 464–474. [Google Scholar] [CrossRef]
- Erin, M.H.; Shepherd, D.; Welch, D.; Dirks, K.N.; Mcbride, D. Perceptions of Neighborhood Problems and Health-Related Quality of Life. J. Community Psychol. 2012, 40, 814–827. [Google Scholar] [CrossRef]
- Fu, D.; Liu, L.; Zhang, X.; Yu, C.; Luo, H.; Li, N. The Relationship between Urban and Rural Health Insurance and the Self-Rated Health of Migrant Workers in Southwest China. BMC Health Serv. Res. 2021, 21, 614. [Google Scholar] [CrossRef]
- Huang, B.; Huang, C.; Feng, Z.; Pearce, J.R.; Zhao, H.; Pan, Z.; Liu, Y. Association between Residential Greenness and General Health among Older Adults in Rural and Urban Areas in China. Urban For. Urban Green. 2021, 59, 126907. [Google Scholar] [CrossRef]
- Liu, Z.; Zheng, H.; Wu, Y.; Wang, S.; Liu, Y.; Hu, S. Self-Rated Healthy Life Expectancy Changes in Jiangxi Province of China by Gender and Urban-Rural Differences, 2013–2018. Front. Public Health 2021, 8, 596249. [Google Scholar] [CrossRef] [PubMed]
- Xia, Y.; Ma, Z. Social Integration, Perceived Stress, Locus of Control, and Psychological Wellbeing among Chinese Emerging Adult Migrants: A Conditional Process Analysis. J. Affect. Disord. 2020, 267, 9–16. [Google Scholar] [CrossRef] [PubMed]
- Li, J.; Lai, D.W.L.; Chappell, N.L. The Older, the Happier?: A Cross-Sectional Study on the “Paradox of Aging” in China. Res. Aging 2022, 44, 34–43. [Google Scholar] [CrossRef]
- Wang, W.; Sun, Y.; Chen, Y.; Bu, Y.; Li, G. Health Effects of Happiness in China. Int. J. Environ. Res. Public Health 2022, 19, 6686. [Google Scholar] [CrossRef]
- Parandeh Afshar, P.; Keshavarz, F.; Salehi, M.; Fakhri Moghadam, R.; Khajoui, E.; Nazari, F.; Dehghan, M. Health Literacy and Media Literacy: Is There Any Relation? Community Health Equity Res. Policy 2022, 42, 195–201. [Google Scholar] [CrossRef]
- Zhang, Z.; Muthu, B.; Sivaparthipan, C. The Necessary of Constructing Preventive Health Intervention Policy under the Trend of Deep Aging in China. J. Ambient. Intell. Humaniz. Comput. 2021, 12, 3539–3547. [Google Scholar] [CrossRef]
- Lyhne, C.N.; Nielsen, C.; Kristiansen, S.T.; Bjerrum, M.B. “Work Is a Motivator in Life” Strategies in Managing Work Participation among Highly Educated Employees with Depression. Work 2021, 69, 1063–1073. [Google Scholar] [CrossRef] [PubMed]
- Williams, B.L.; Pennock-Roman, M.; Suen, H.K.; Magsumbol, M.S.; Ozdenerol, E. Assessing the Impact of the Local Environment on Birth Outcomes: A Case for HLM. J. Expo. Sci. Environ. Epidemiol. 2007, 17, 445–457. [Google Scholar] [CrossRef] [PubMed]
- Wang, J. Hours Underemployment and Employee Turnover: The Moderating Role of Human Resource Practices. Int. J. Hum. Resour. Manag. 2018, 29, 1565–1587. [Google Scholar] [CrossRef]
- Fang, X.; Qin, C. Evaluating the Development Gap between China’s Urban and Rural Areas and Learning from Foreign Experience. Issues Agric. Econ. 2021, 32–41. [Google Scholar] [CrossRef]
- Xia, J.; Kong, X. The Evolution, Orientation and Two-way Interaction of Rural and Urban Mobility of Agricultural Labor Force in China. Econ. Probl. 2021, 9–15. [Google Scholar] [CrossRef]
- Bai, M.; Yuan, P. Restrictive Factors and Promotion Paths of Farmers’ Comprehensive Development in the Process of Modernization. Reform 2021, 116–126. [Google Scholar]
- Wang, L.; Dong, Z. The normative path of country’s rural environmental risk governance from the perspective of rural revitalization in China: Reflection from the perspective of urban and rural division and collaborative co-governance evolution. Rural. Econ. 2021, 82–90. [Google Scholar]
- Wang, X.; Shen, X.; Kang, X. Empirical Analysis and Innovation Path of Constructing Two-way Flow Mechanism of Urban and Rural Factors: A Perspective of Capital Factors. Fisc. Sci. 2022, 34–48. [Google Scholar] [CrossRef]
- Bi, J.; Chen, J.; Sun, X.; Nie, X.; Liu, Y.; Luo, R.; Zhao, X. The Development and Evaluation of a Sub-Health Self-Rating Scale for University Students in China. BMC Public Health 2019, 19, 330. [Google Scholar] [CrossRef]
- Wang, J.; Zhang, R. COVID-19 in Rural China: Features, Challenges and Implications for the Healthcare System. J. Multidiscip. Healthc. 2021, 14, 1045–1051. [Google Scholar] [CrossRef]


| Class | Index | Abbreviation | Item/Description |
|---|---|---|---|
| healthy | self-rated health status | SRHS | healthy/unhealthy (1/0) |
| location | province | - | 28 provinces |
| region | - | urban/rural | |
| attribute | sex | SEX | male/female (1/0) |
| age | AGE | ||
| education | EDU1 | semi-illiterate/primary school/junior middle school/high school/college/undergraduate/graduate and above (1/2/3/4/5/6/7) | |
| marriage | MAR | with a lover/without a lover (1/0) | |
| height | HIT | the unit is the centimeter | |
| weight | WIT | the unit is the kilogram | |
| BMI | BMI | 1, WIT/(HIT/100)^2 ≤ 24; 0, WIT/(HIT/100)^2 > 24 | |
| income | personal annual income | PAI | the unit is CNY |
| household annual income | HAI | the unit is CNY | |
| employment | work experience | WE | non-farm work/never work or farm work (1/0) |
| type of work | TOW | full-time/part-time (1/0) | |
| type of company | TOC | government/non-government (1/0) | |
| type of company ownership | TOCO | public ownership/private ownership (1/0) | |
| work hours | WH | the unit is the hour | |
| social security | public medical insurance | PMI | participate/did not participate (1/0) |
| commercial medical insurance | CMI | participate/did not participate (1/0) | |
| physical training | frequency of physical exercise | FOPE | never/several times a year/several times a month/several times a week/every day (1/2/3/4/5) |
| happiness | recognition of life happiness | ROLH | happiness/unhappiness (1/0) |
| information sources | the main source of information | MS | internet media/traditional media (1/0) |
| Class | Index | Abbreviation | Unit |
|---|---|---|---|
| public health services | medical technical personnel per 1000 persons | PHS_MTP | person |
| licensed (assistant) doctors per 1000 persons | PHS_LD | person | |
| registered nurses per 1000 persons | PHS_RN | person | |
| number of beds in health care institutions per 1000 persons | PHS_NOB | unit | |
| health care and medical service expenditure | per capita consumption expenditure of health care and medical services | HCE_PE | CNY |
| proportion of per capita health care and medical services expenditure in consumer expenditure | HCE_PPE | % | |
| population structure | the proportion of the population with a college degree or above | EDU2 | % |
| the proportion of the population aged 65 and above | AGING | % | |
| public facilities | the coverage rate of the population with access to tap water | PF_WA | % |
| per capita public green areas | PF_GN | m2 | |
| domestic garbage harmless treatment rate | PF_GA | % | |
| cumulative proportion of tap water beneficiaries | PF_PWA | % | |
| the proportion of national investment in rural toilet improvement in total investment | PF_ITO | % | |
| sanitary toilet penetration | PF_STO | % |
| Year | Total | Rural | Urban | ||||||
|---|---|---|---|---|---|---|---|---|---|
| Number of Samples | Std | Healthy (%) | Number of Samples | Std | Healthy (%) | Number of Samples | Std | Healthy (%) | |
| 2010 | 8510 | 0.39 | 81.36 | 1586 | 0.43 | 75.22 | 6924 | 0.35 | 85.61 |
| 2013 | 8674 | 0.36 | 84.30 | 1362 | 0.40 | 80.22 | 7312 | 0.32 | 88.63 |
| 2017 | 10710 | 0.40 | 79.44 | 2202 | 0.46 | 68.96 | 8508 | 0.35 | 85.51 |
| Index | Region | Item | 2010 | 2013 | 2017 | |||
|---|---|---|---|---|---|---|---|---|
| Unhealthy | Healthy | Unhealthy | Healthy | Unhealthy | Healthy | |||
| SEX | rural | female | 30.17 | 69.83 | 22.05 | 77.95 | 33.92 | 66.08 |
| male | 19.44 | 80.56 | 17.61 | 82.39 | 28.12 | 71.88 | ||
| urban | female | 15.36 | 84.64 | 12.49 | 87.51 | 16.35 | 83.65 | |
| male | 13.37 | 86.63 | 10.31 | 89.69 | 12.41 | 87.59 | ||
| BMI | rural | >24 | 19.93 | 80.07 | 17.59 | 82.41 | 30.54 | 69.46 |
| ≤24 | 26.32 | 73.68 | 20.61 | 79.39 | 31.28 | 68.72 | ||
| urban | >24 | 16.36 | 83.64 | 12.92 | 87.08 | 17.40 | 82.60 | |
| ≤24 | 13.27 | 86.73 | 10.53 | 89.47 | 12.87 | 87.13 | ||
| MAR | rural | unmarried | 31.45 | 68.55 | 22.51 | 77.49 | 35.83 | 64.17 |
| married | 23.76 | 76.24 | 19.31 | 80.69 | 30.04 | 69.96 | ||
| urban | unmarried | 16.27 | 83.73 | 15.81 | 84.19 | 15.76 | 84.24 | |
| married | 13.94 | 86.06 | 10.16 | 89.84 | 14.10 | 85.90 | ||
| WE | rural | farm work | 28.40 | 71.60 | 25.30 | 74.70 | 36.08 | 63.92 |
| non-farm work | 5.61 | 94.39 | 6.48 | 93.52 | 9.92 | 90.08 | ||
| urban | farm work | 23.63 | 76.37 | 20.22 | 79.78 | 23.26 | 76.74 | |
| non-farm work | 5.91 | 94.09 | 4.77 | 95.23 | 5.54 | 94.46 | ||
| TOW | rural | part-time | 27.76 | 72.24 | 24.29 | 75.71 | 35.12 | 64.88 |
| full-time | 5.22 | 94.78 | 6.13 | 93.87 | 9.22 | 90.78 | ||
| urban | part-time | 22.80 | 77.20 | 19.42 | 80.58 | 22.10 | 77.90 | |
| full-time | 5.36 | 94.64 | 4.46 | 95.54 | 5.28 | 94.72 | ||
| TOC | rural | non-government | 25.10 | 74.90 | 20.20 | 79.80 | 31.50 | 68.50 |
| government | 7.69 | 92.31 | 7.04 | 92.96 | 5.71 | 94.29 | ||
| urban | non-government | 15.66 | 84.34 | 12.25 | 87.75 | 15.36 | 84.64 | |
| government | 5.94 | 94.06 | 4.44 | 95.56 | 6.10 | 93.90 | ||
| TOCO | rural | private ownership | 25.42 | 74.58 | 20.54 | 79.46 | 31.70 | 68.30 |
| public ownership | 6.09 | 93.91 | 5.68 | 94.32 | 6.00 | 94.00 | ||
| urban | private ownership | 16.50 | 83.50 | 13.20 | 86.80 | 15.81 | 84.19 | |
| public ownership | 5.77 | 94.23 | 4.12 | 95.88 | 5.66 | 94.34 | ||
| PMI | rural | non-participate | 23.74 | 76.26 | 16.82 | 83.18 | 31.97 | 68.03 |
| participate | 24.87 | 75.13 | 20.01 | 79.99 | 30.97 | 69.03 | ||
| urban | non-participate | 13.13 | 86.87 | 11.95 | 88.05 | 15.74 | 84.26 | |
| participate | 14.59 | 85.41 | 11.29 | 88.71 | 14.38 | 85.62 | ||
| ROLH | rural | unhappiness | 46.62 | 53.38 | 40.90 | 59.10 | 53.86 | 46.14 |
| happiness | 21.83 | 78.17 | 17.70 | 82.30 | 28.16 | 71.84 | ||
| urban | unhappiness | 33.85 | 66.15 | 27.61 | 72.39 | 36.88 | 63.13 | |
| happiness | 12.78 | 87.22 | 10.00 | 90.00 | 12.79 | 87.21 | ||
| MS | rural | traditional media | 25.57 | 74.43 | 21.74 | 78.26 | 37.29 | 62.71 |
| internet media | 0.89 | 99.11 | 3.70 | 96.30 | 10.17 | 89.83 | ||
| urban | traditional media | 16.90 | 83.10 | 14.75 | 85.25 | 23.42 | 76.58 | |
| internet media | 3.99 | 96.01 | 3.49 | 96.51 | 6.03 | 93.97 | ||
| Level | Variable | Rural | Urban | ||||
|---|---|---|---|---|---|---|---|
| 2010 | 2013 | 2017 | 2010 | 2013 | 2017 | ||
| Individual | (Intercept) | 0.870 | 0.298 | −0.493 | 2.407 *** | 4.048 *** | 1.497 *** |
| SEX | 0.648 *** | ||||||
| AGE | −0.048 *** | −0.032 *** | −0.032 *** | −0.038 *** | −0.038 *** | −0.032 *** | |
| EDU | 0.151 ** | 0.145 ** | 0.216 *** | 0.165 *** | 0.153 *** | ||
| MAR | 0.314 * | ||||||
| BMI | 0.237 ** | 0.305 *** | |||||
| scale (PAI) | 0.243 * | 0.490 *** | |||||
| scale (HAI) | 0.250 *** | 0.455 *** | 0.378 *** | 0.241 ** | 0.364 *** | ||
| WE | 0.807 *** | 0.447 ** | 0.400 ** | 0.797 *** | 0.874 *** | 0.843 *** | |
| WH | 0.011 *** | 0.001 * | |||||
| FOPE | 0.133 ** | 0.112 *** | 0.168 *** | 0.208 *** | 0.170 *** | ||
| ROLH | 1.152 *** | 1.069 *** | 1.032 *** | 1.160 *** | 1.057 *** | 1.302 *** | |
| MS | 0.552 * | 0.425 ** | 0.293 ** | ||||
| Provincial | PHS_MTP | 0.429 * | |||||
| PHS_LD | 0.629 * | ||||||
| scale (HCE_PE) | 0.588 *** | ||||||
| HCE_PPE | −0.118 * | −0.268 ** | −0.095 * | ||||
| PF_GN | 0.122 *** | ||||||
| Statistical Test | Marginal R2 | 0.327 | 0.321 | 0.382 | 0.298 | 0.341 | 0.311 |
| Conditional R2 | 0.359 | 0.378 | 0.399 | 0.320 | 0.389 | 0.331 | |
| AIC | 3246.525 | 3688.404 | 4054.724 | 3441.388 | 2415.210 | 4616.306 | |
| BIC | 3308.070 | 3758.858 | 4136.308 | 3500.099 | 2478.650 | 4684.528 | |
Publisher’s Note: MDPI stays neutral with regard to jurisdictional claims in published maps and institutional affiliations. |
© 2022 by the authors. Licensee MDPI, Basel, Switzerland. This article is an open access article distributed under the terms and conditions of the Creative Commons Attribution (CC BY) license (https://creativecommons.org/licenses/by/4.0/).
Share and Cite
Yu, C.; Zhang, X.; Gao, J. Multi-Dimensional Comparison of the Impact Mechanism of the Self-Rated Health Status of Urban and Rural Residents in Chinese Social Environments. Int. J. Environ. Res. Public Health 2022, 19, 10625. https://doi.org/10.3390/ijerph191710625
Yu C, Zhang X, Gao J. Multi-Dimensional Comparison of the Impact Mechanism of the Self-Rated Health Status of Urban and Rural Residents in Chinese Social Environments. International Journal of Environmental Research and Public Health. 2022; 19(17):10625. https://doi.org/10.3390/ijerph191710625
Chicago/Turabian StyleYu, Chao, Xinyi Zhang, and Junbo Gao. 2022. "Multi-Dimensional Comparison of the Impact Mechanism of the Self-Rated Health Status of Urban and Rural Residents in Chinese Social Environments" International Journal of Environmental Research and Public Health 19, no. 17: 10625. https://doi.org/10.3390/ijerph191710625