
General Mapping of the Environmental Performance in Climate Change Mitigation of Spanish Universities through a Standardized Carbon Footprint Calculation Tool

 , ,
, ,  and
and
Abstract
:1. Introduction
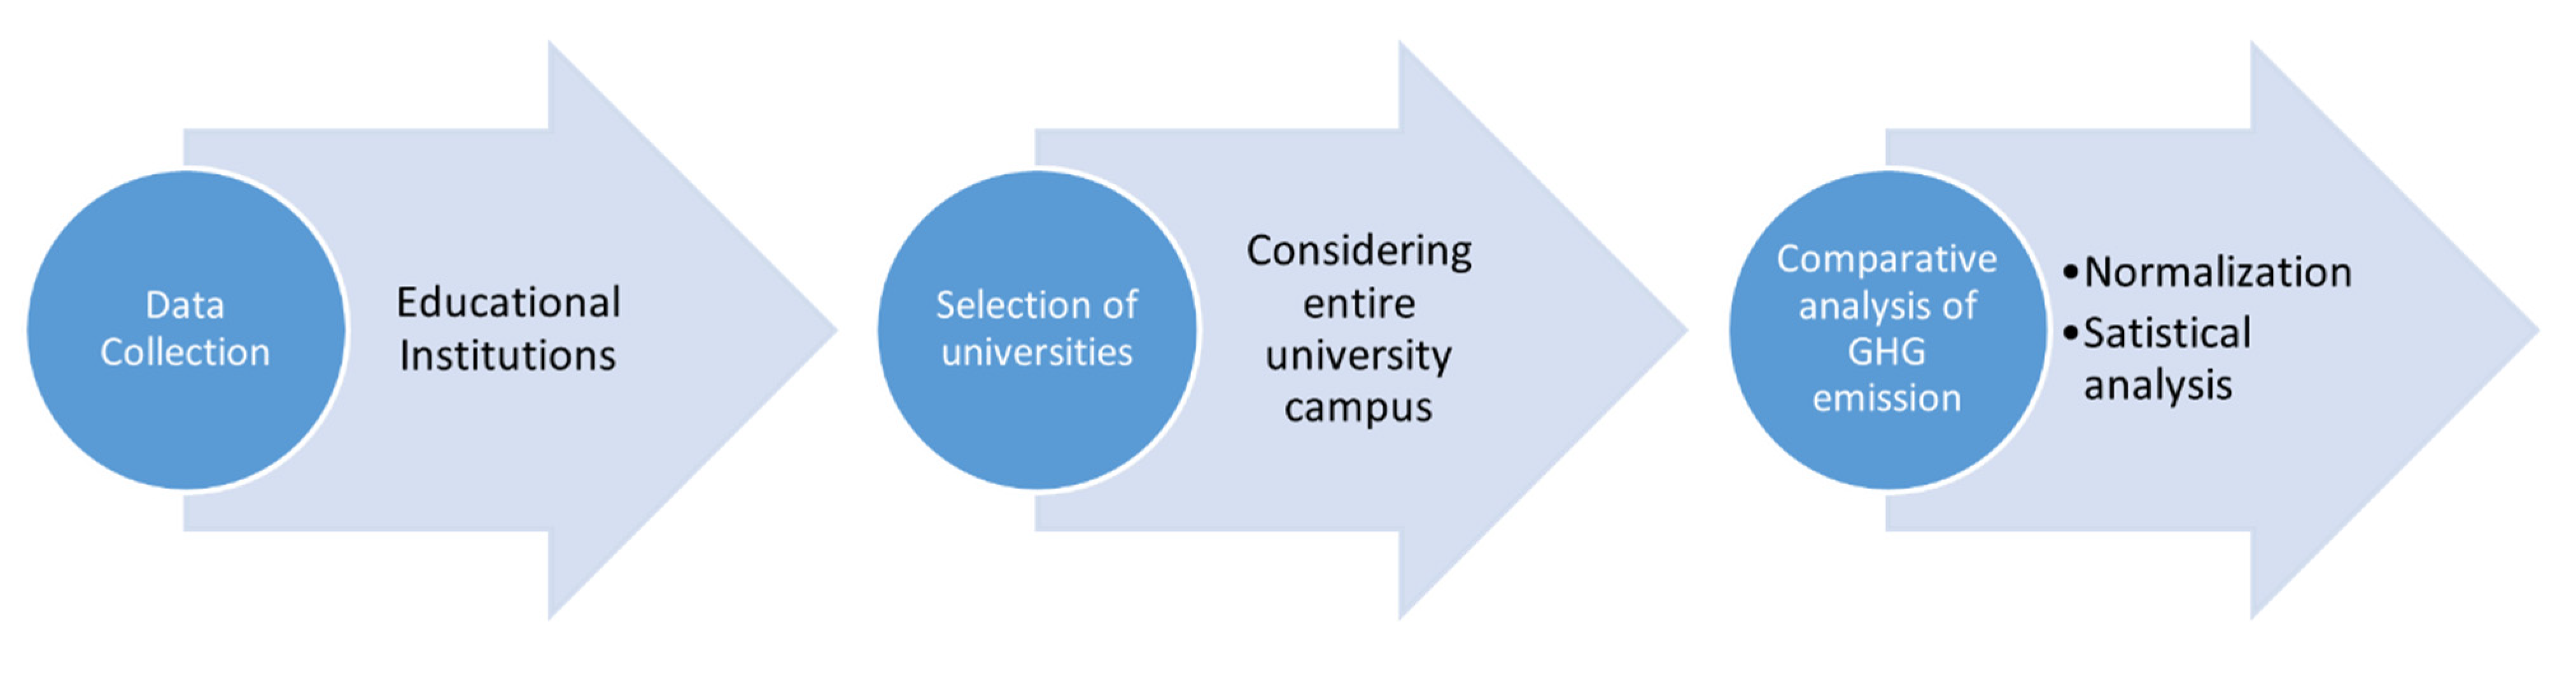
2. Materials and Methods
3. Results and Discussion
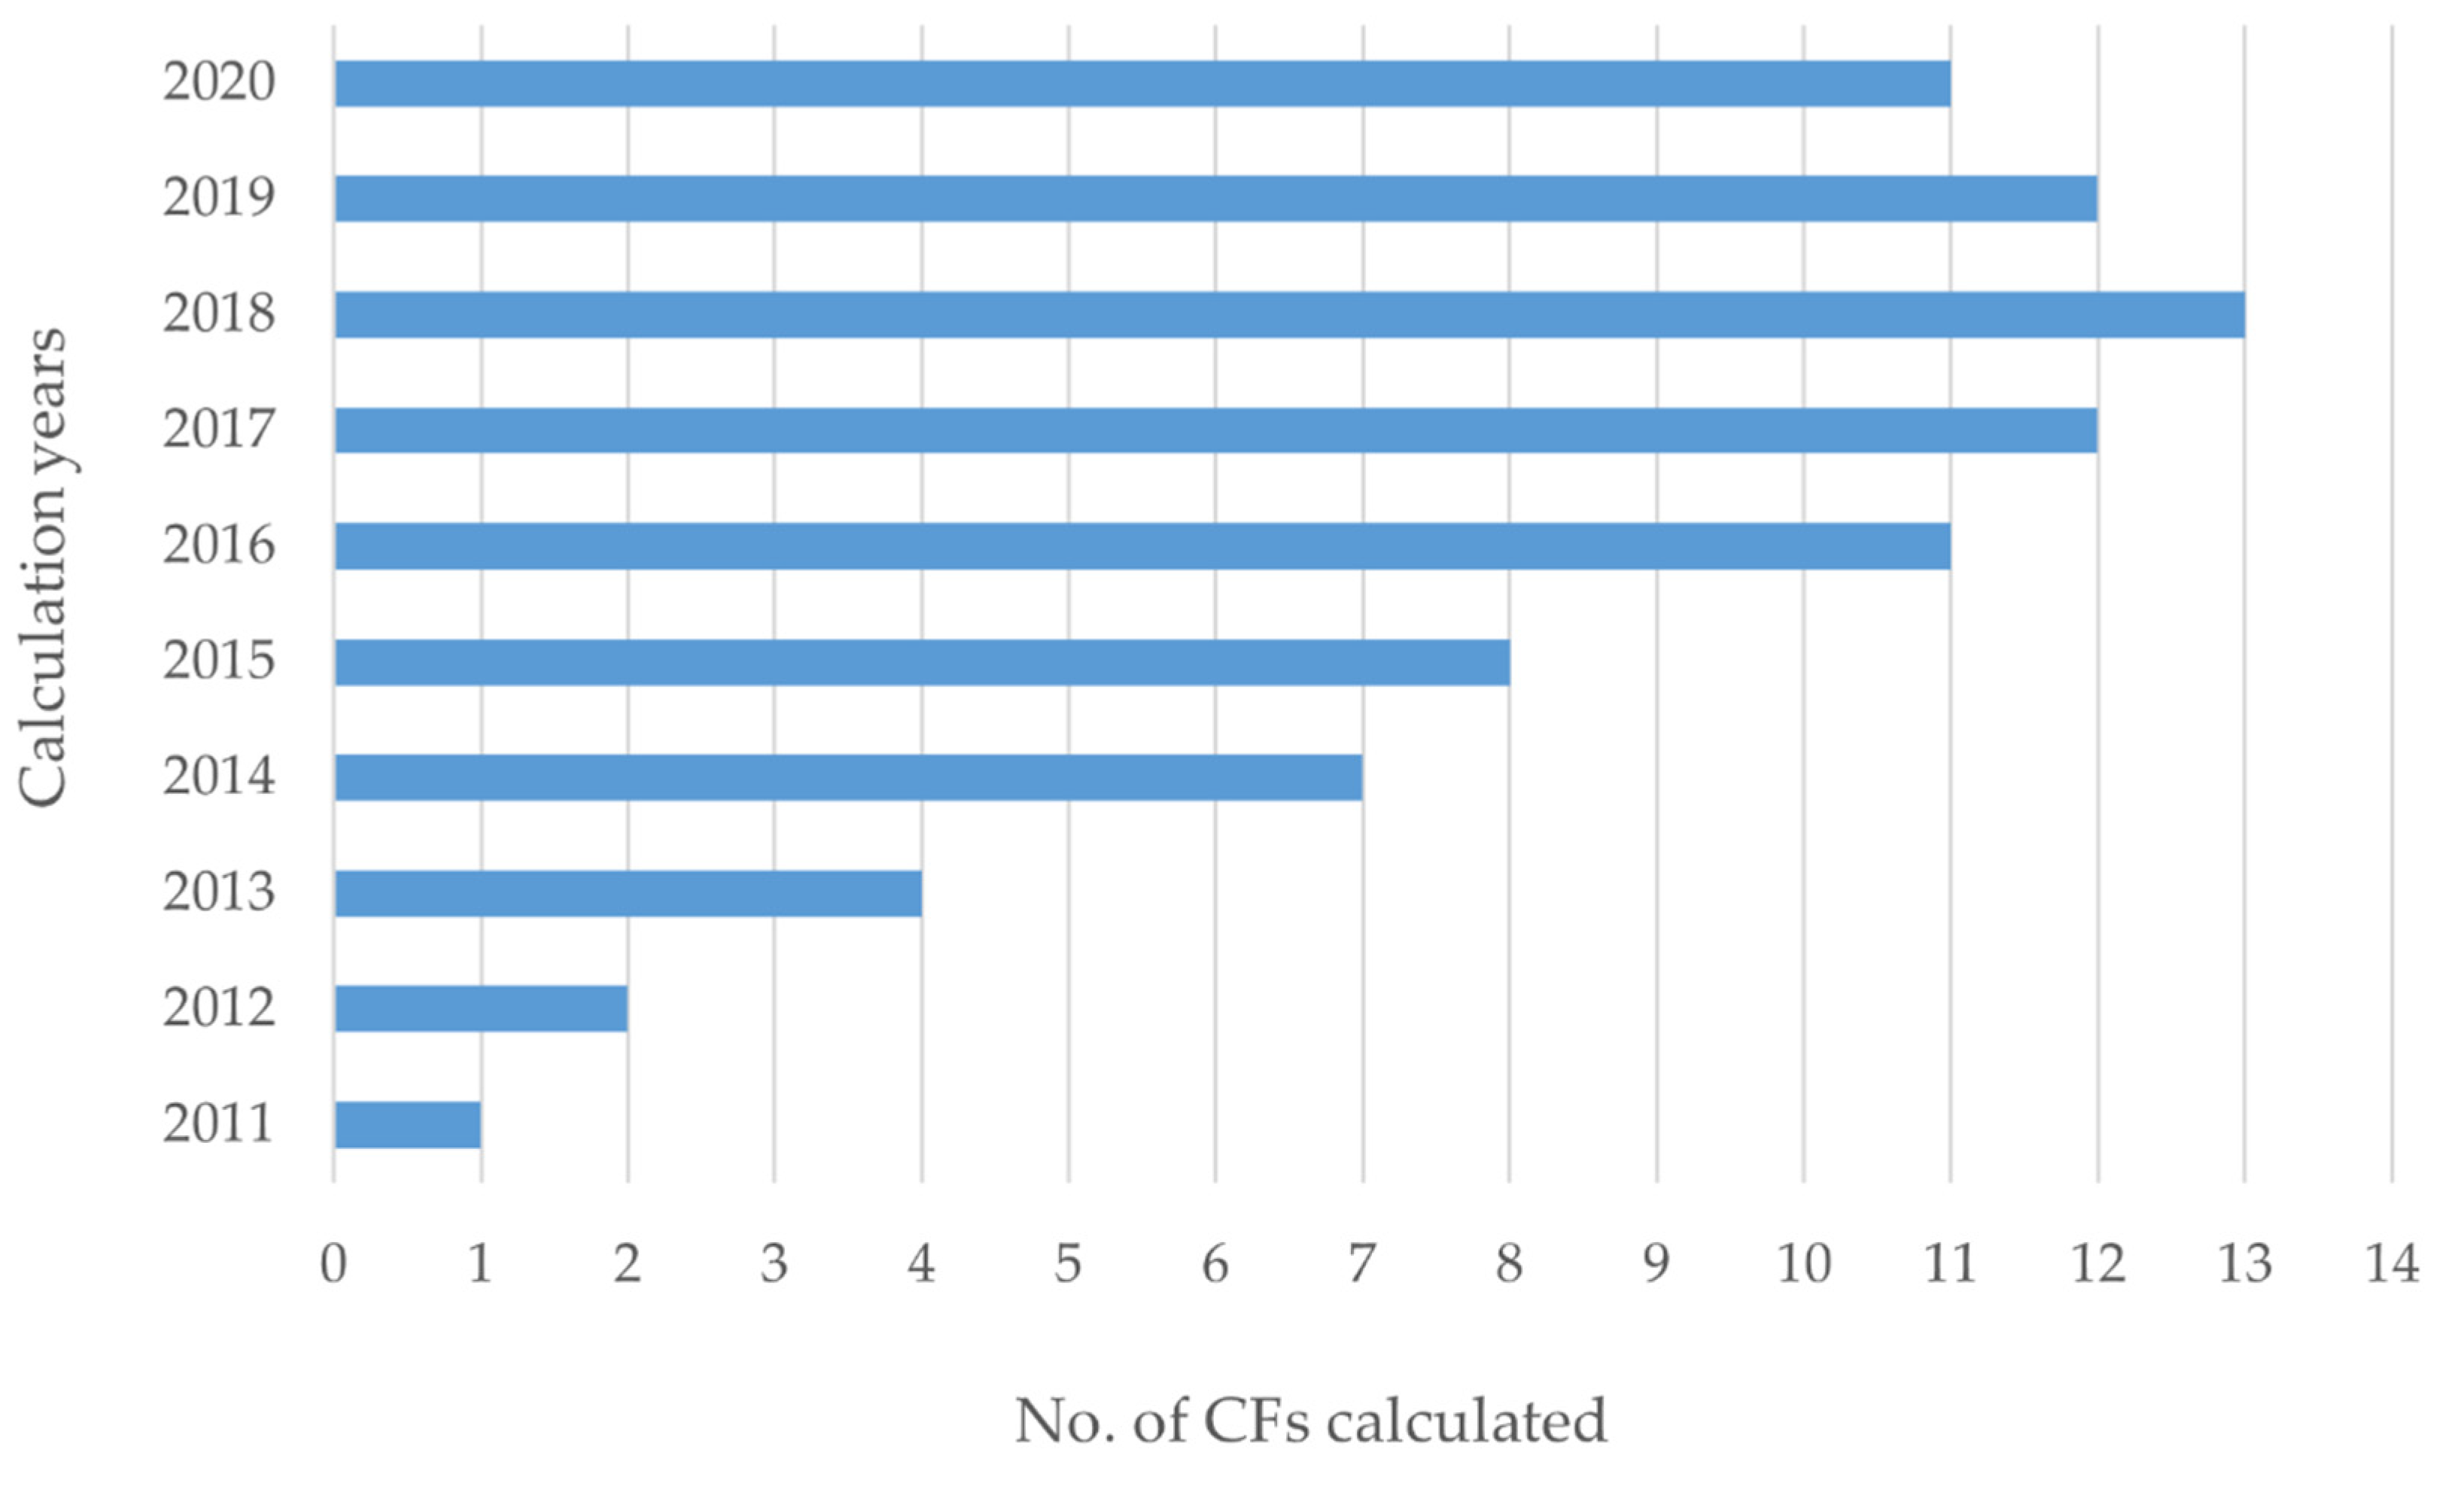
3.1. Registration Dates and Calculation Years
3.2. Reduction and Offsetting Seals Granted
3.3. Organizational Boundaries
3.4. Operational Boundaries
3.5. Characteristics of Institutions
- (a)
- Type of learning: As shown in Table 1, 13 of the universities with registered CF are face-to-face or in-person education (although they also have some mixed or distance degrees). Only one of the universities is officially recognized as non-face-to-face or distance learning university (National University of Distance Education). The official annual average of Spanish HEIs with face-to-face education for the study period was 76 organizations, so the study sample represents 17.1% of the total number of face-to-face Spanish universities. On the other hand, the total number of universities with distance education is six, so the sample includes 16.7% of the non-face-to-face organizations. No CF data from distance education HEIs has been found in any of the literature reviews [16,20,23,77]; therefore, this mapping of the CFs of Spanish HEIs is a useful contribution to the comparative study of the contribution to climate change of distance learning universities versus face-to-face universities.
- (b)
- University sizes: The sample ranges from small universities (with about 5000 members per year on average) to the largest of the face-to-face Spanish universities (Complutense University of Madrid, with an average of more than 80,000 members per year) as well as Spain’s largest non-attending university (the National University of Distance Education, with an average of almost 150,000 members per year). The remaining organizations range in size from 10,000 to 40,000 members per year on average. So, the different sizes of the HEI included in the study can also be considered representative.
- (c)
- Source of funding: In relation to the source of funding, one of the universities is private (San Jorge University), while the rest operate with public funds. This interferes with the fact that budgets and expenditures are not accessible, as is the case with public universities.
- (d)
- Territorial distribution: Moreover, they are well distributed throughout the Spanish territory, with presence in 7 of its 12 autonomous communities. Although a priori this variable could be interpreted as relevant, while there is a variation in heating or air-conditioning consumption depending on weather conditions [78], recent studies have not found a correlation of CF with geographical latitude [23].
- (e)
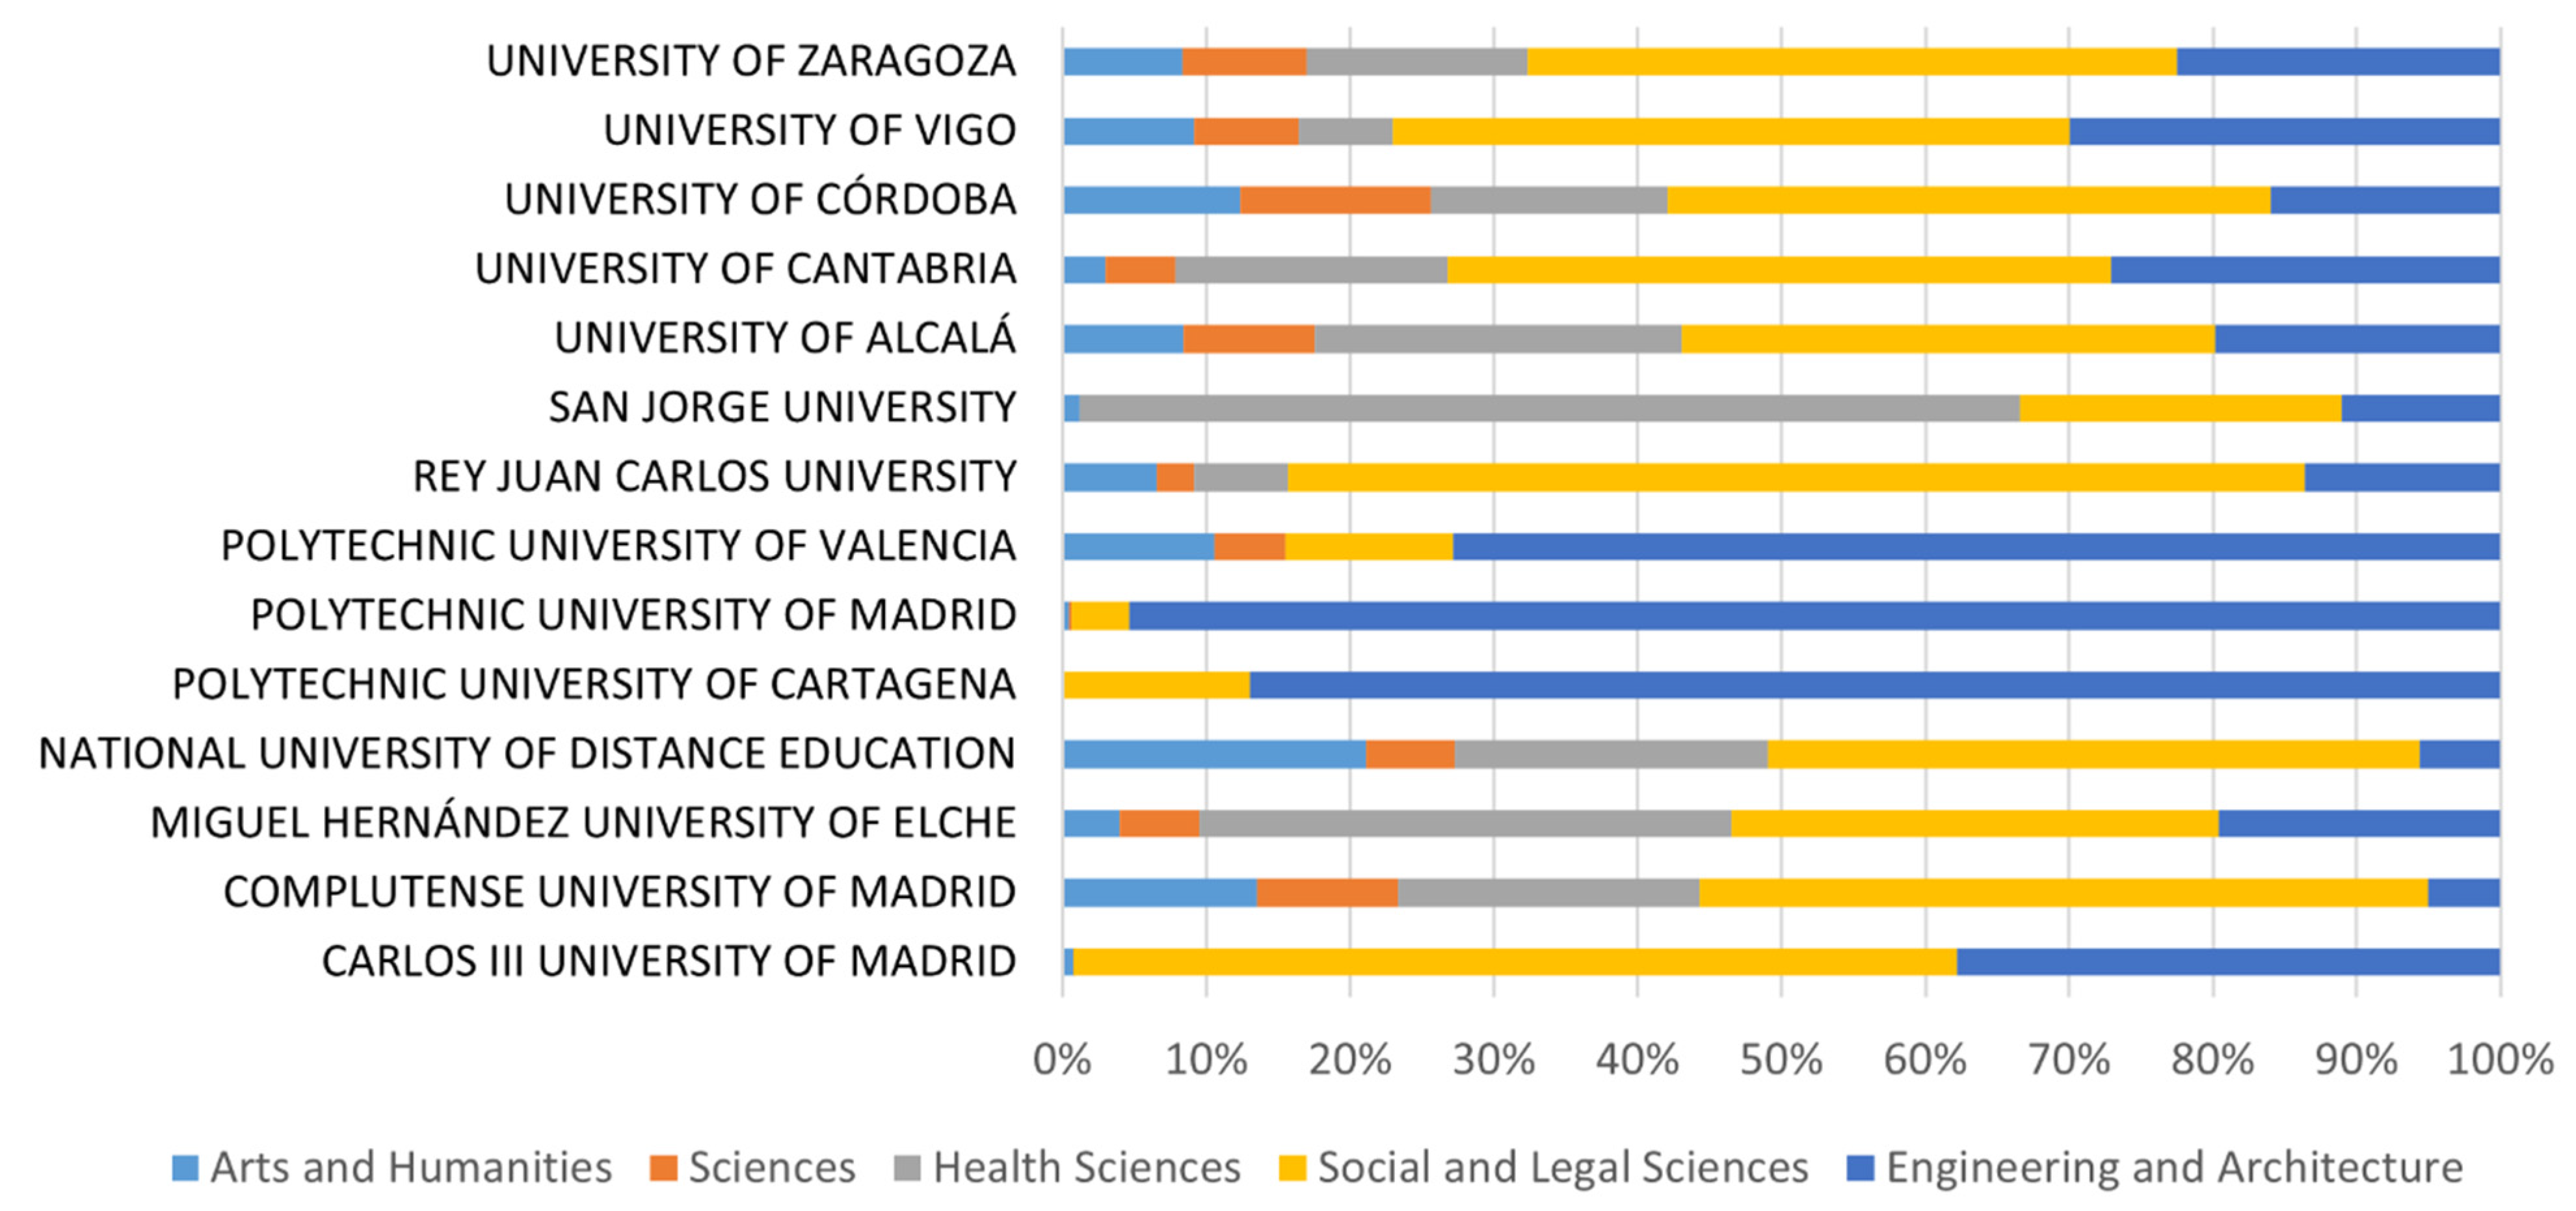
- Educational branches: As a result of the analysis of the different educational branches of the HEIs in the sample, it was observed that all sectors are well represented (Figure 5).
3.6. Total Contribution to Climate Change: Absolute CFs
3.7. Activity Ratio Indicators
- Regarding the number of students, large differences are observed in the values provided by the universities in the SRCF with respect to the figures for students in official degrees obtained from the Ministry of Universities: from −8.3% to 63.2%. This points to the fact that some universities seem to add only students from official bachelor’s and master’s programs for the calculation of the CF, while others also include postgraduate students, and others also include all students from non-official courses.
- With regard to the number of persons or members, there is also no consensus or standardization as to what type of relationship with the university is included in this term. Although a priori it might be expected that this value would coincide with the number of members of the university community (administrative staff, teaching and research staff, and students of official degrees), on the contrary, large differences are observed in the values of persons provided by the universities with respect to the number of members: from −56.6% to 31.1%. Detailed analysis reveals that in addition to the aforementioned differences in the type of students included, there are universities that seem to include only administrative staff and teaching and research staff, while others also include workers from subcontracted companies operating on campus. San Jorge University proposes the use of the so-called “equivalent person” ratio, which could be interpreted as an attempt to equate full-time staff with part-time staff, or undergraduate students with students on courses of less than one year, among other possible equivalences [14].
- One university chose to relativize its CFs by the number of euros in its annual budget, which undoubtedly provides a figure that is easy to monitor and compare with other universities (especially public universities). It is therefore not surprising that the values provided by the institution coincided exactly with the official values available.
- Finally, with regard to the use of the number of degrees offered as an index of activity, this was used by the only distance learning university in the study. It is understandable that distance learning universities do not consider the number of students to be representative for monitoring their CF.
- 5.
- Standardized “number of students”: Students of official bachelor’s, master’s, and doctoral programs. Other students on non-official courses and activities are not included. In the case of universities with a high percentage of non-face-to-face students (or all of them), it is advisable not to include them.
- 6.
- Standardized “number of employees”: Administrative and service staff, teaching and research staff, and research staff. If it is decided to include workers from subcontractors operating on campus such as gardeners or maintenance staff, this should be clearly identified.
- 7.
- Standardized “number of members”: The sum of standardized “number of students” and “number of employees”.
- 8.
- “Millions of Euros annual budget”: Includes the total initial budget approved at the beginning of the year by the universities. This data has the handicap that it is not usually disseminated by private HEIs.
3.8. Normalized CF with Standardized Activity Ratios
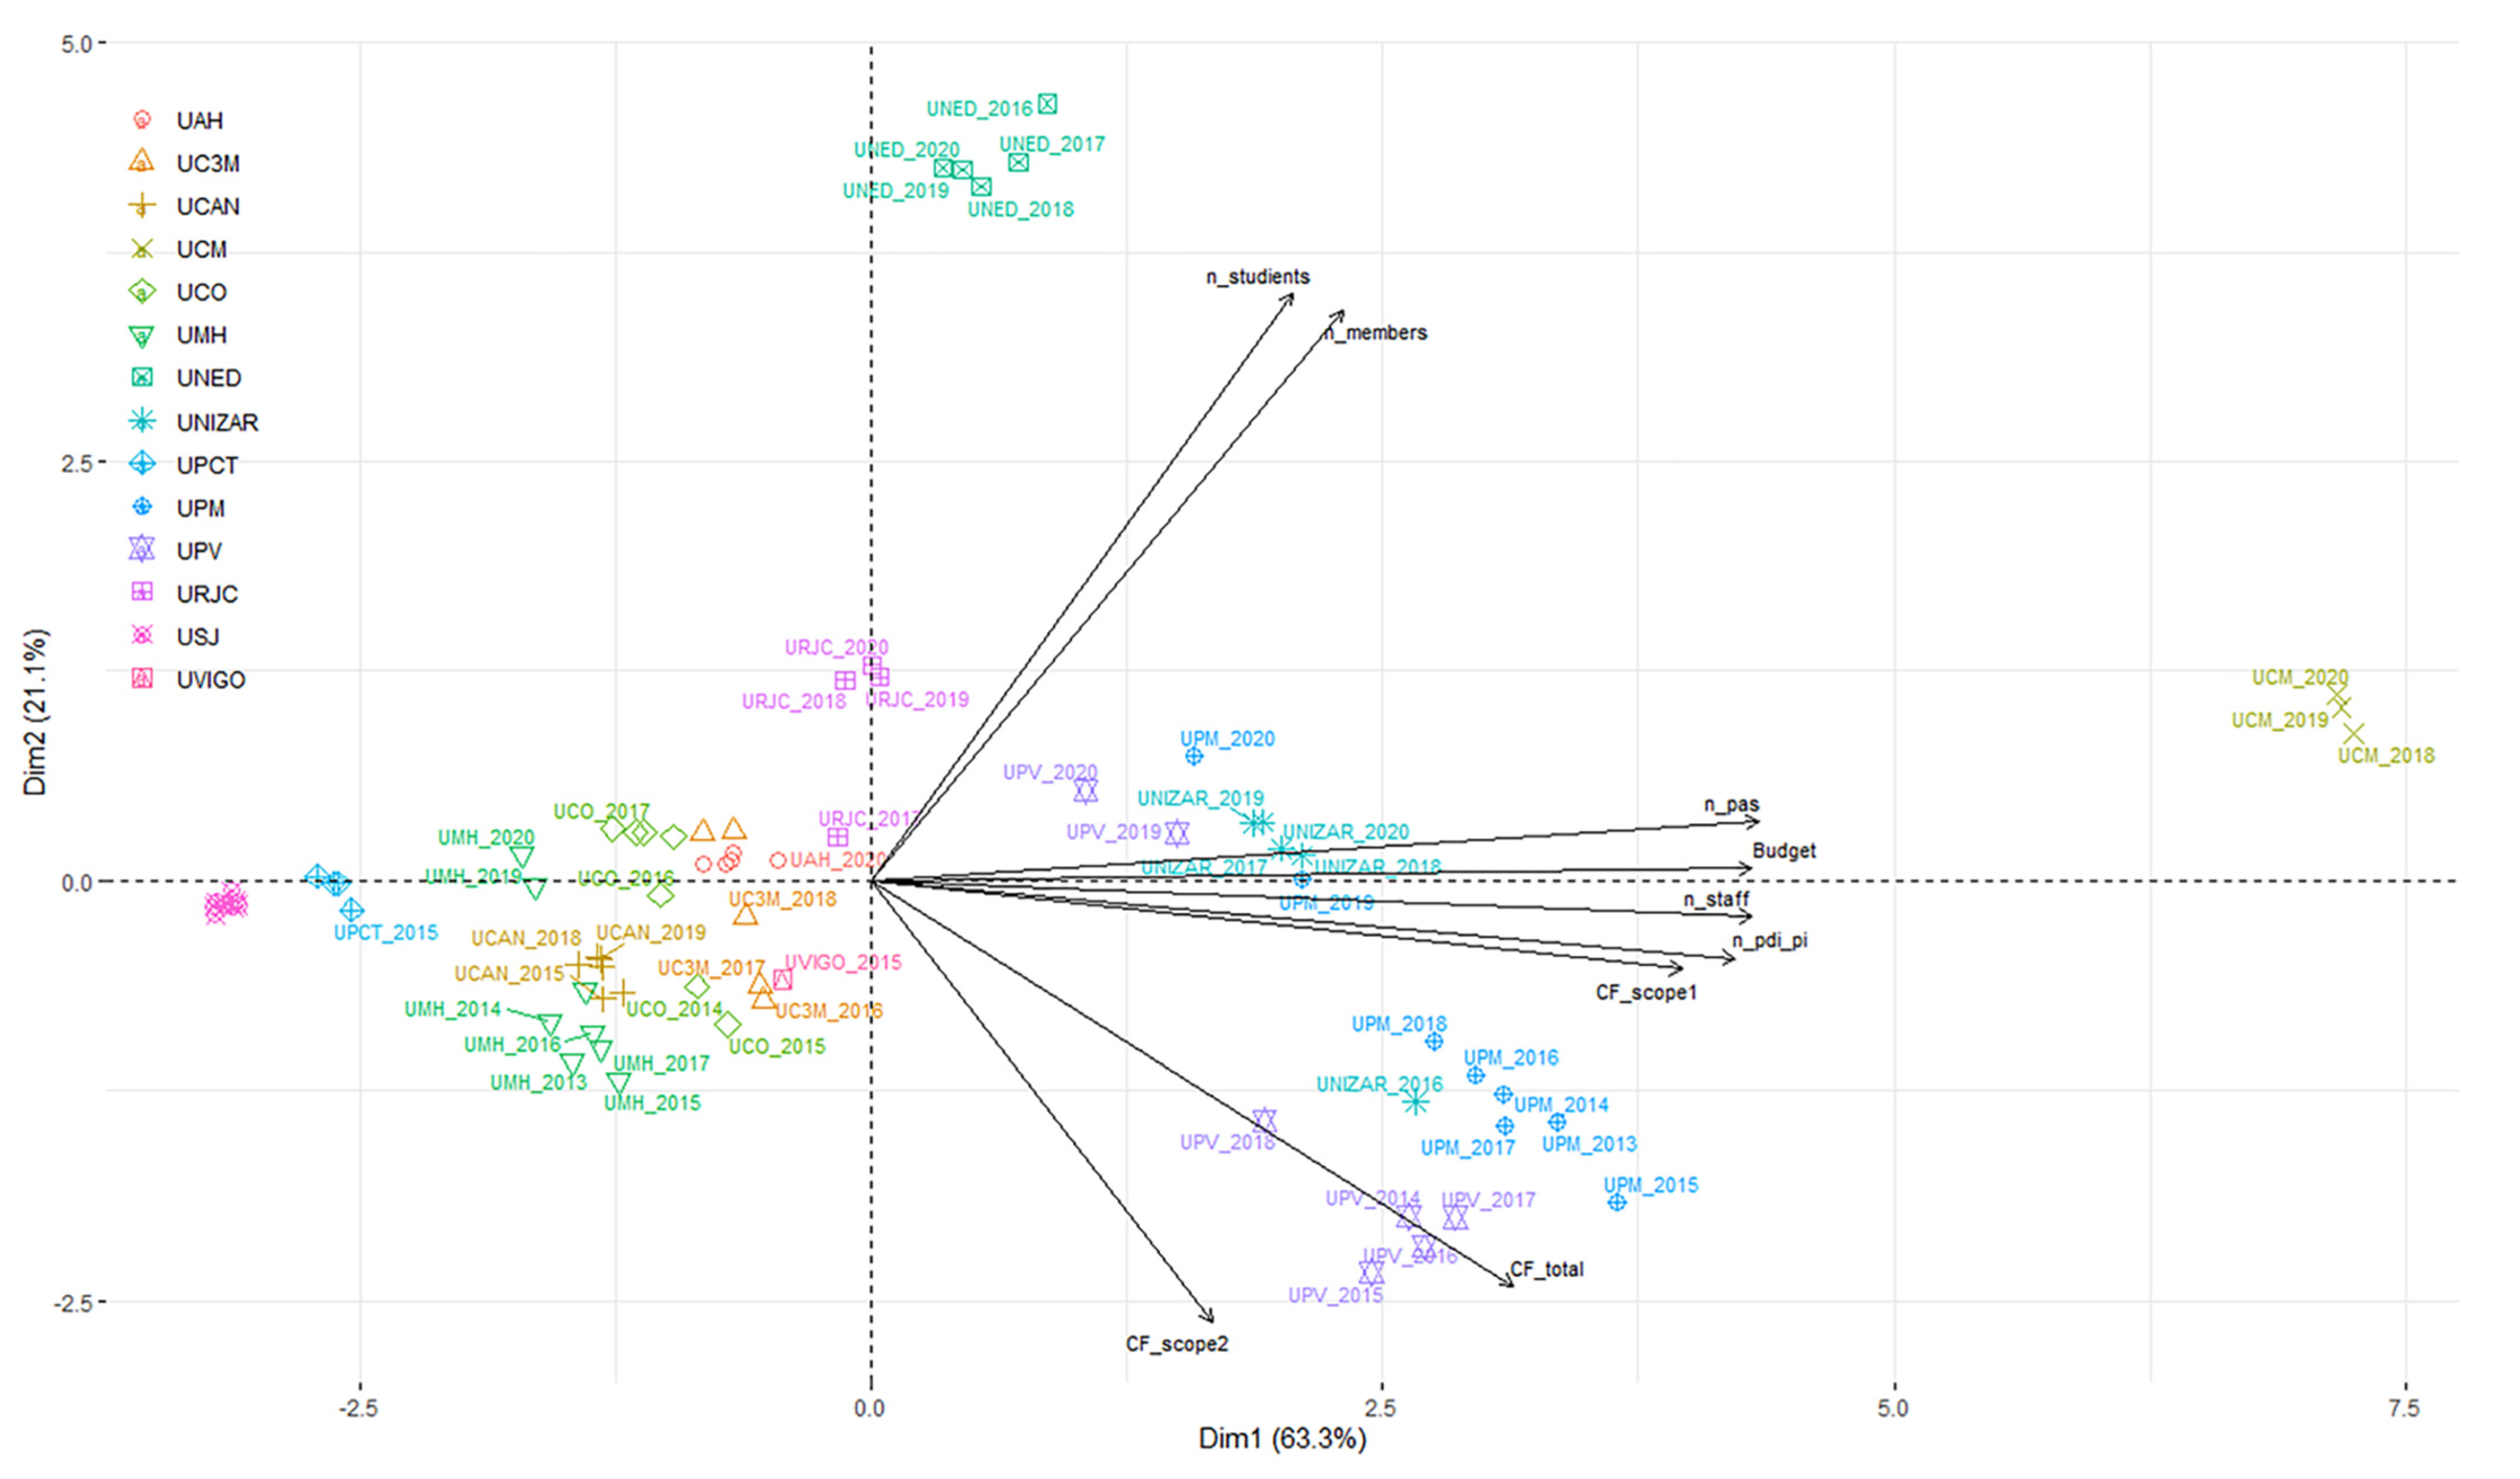
3.9. Correlations between Parameters
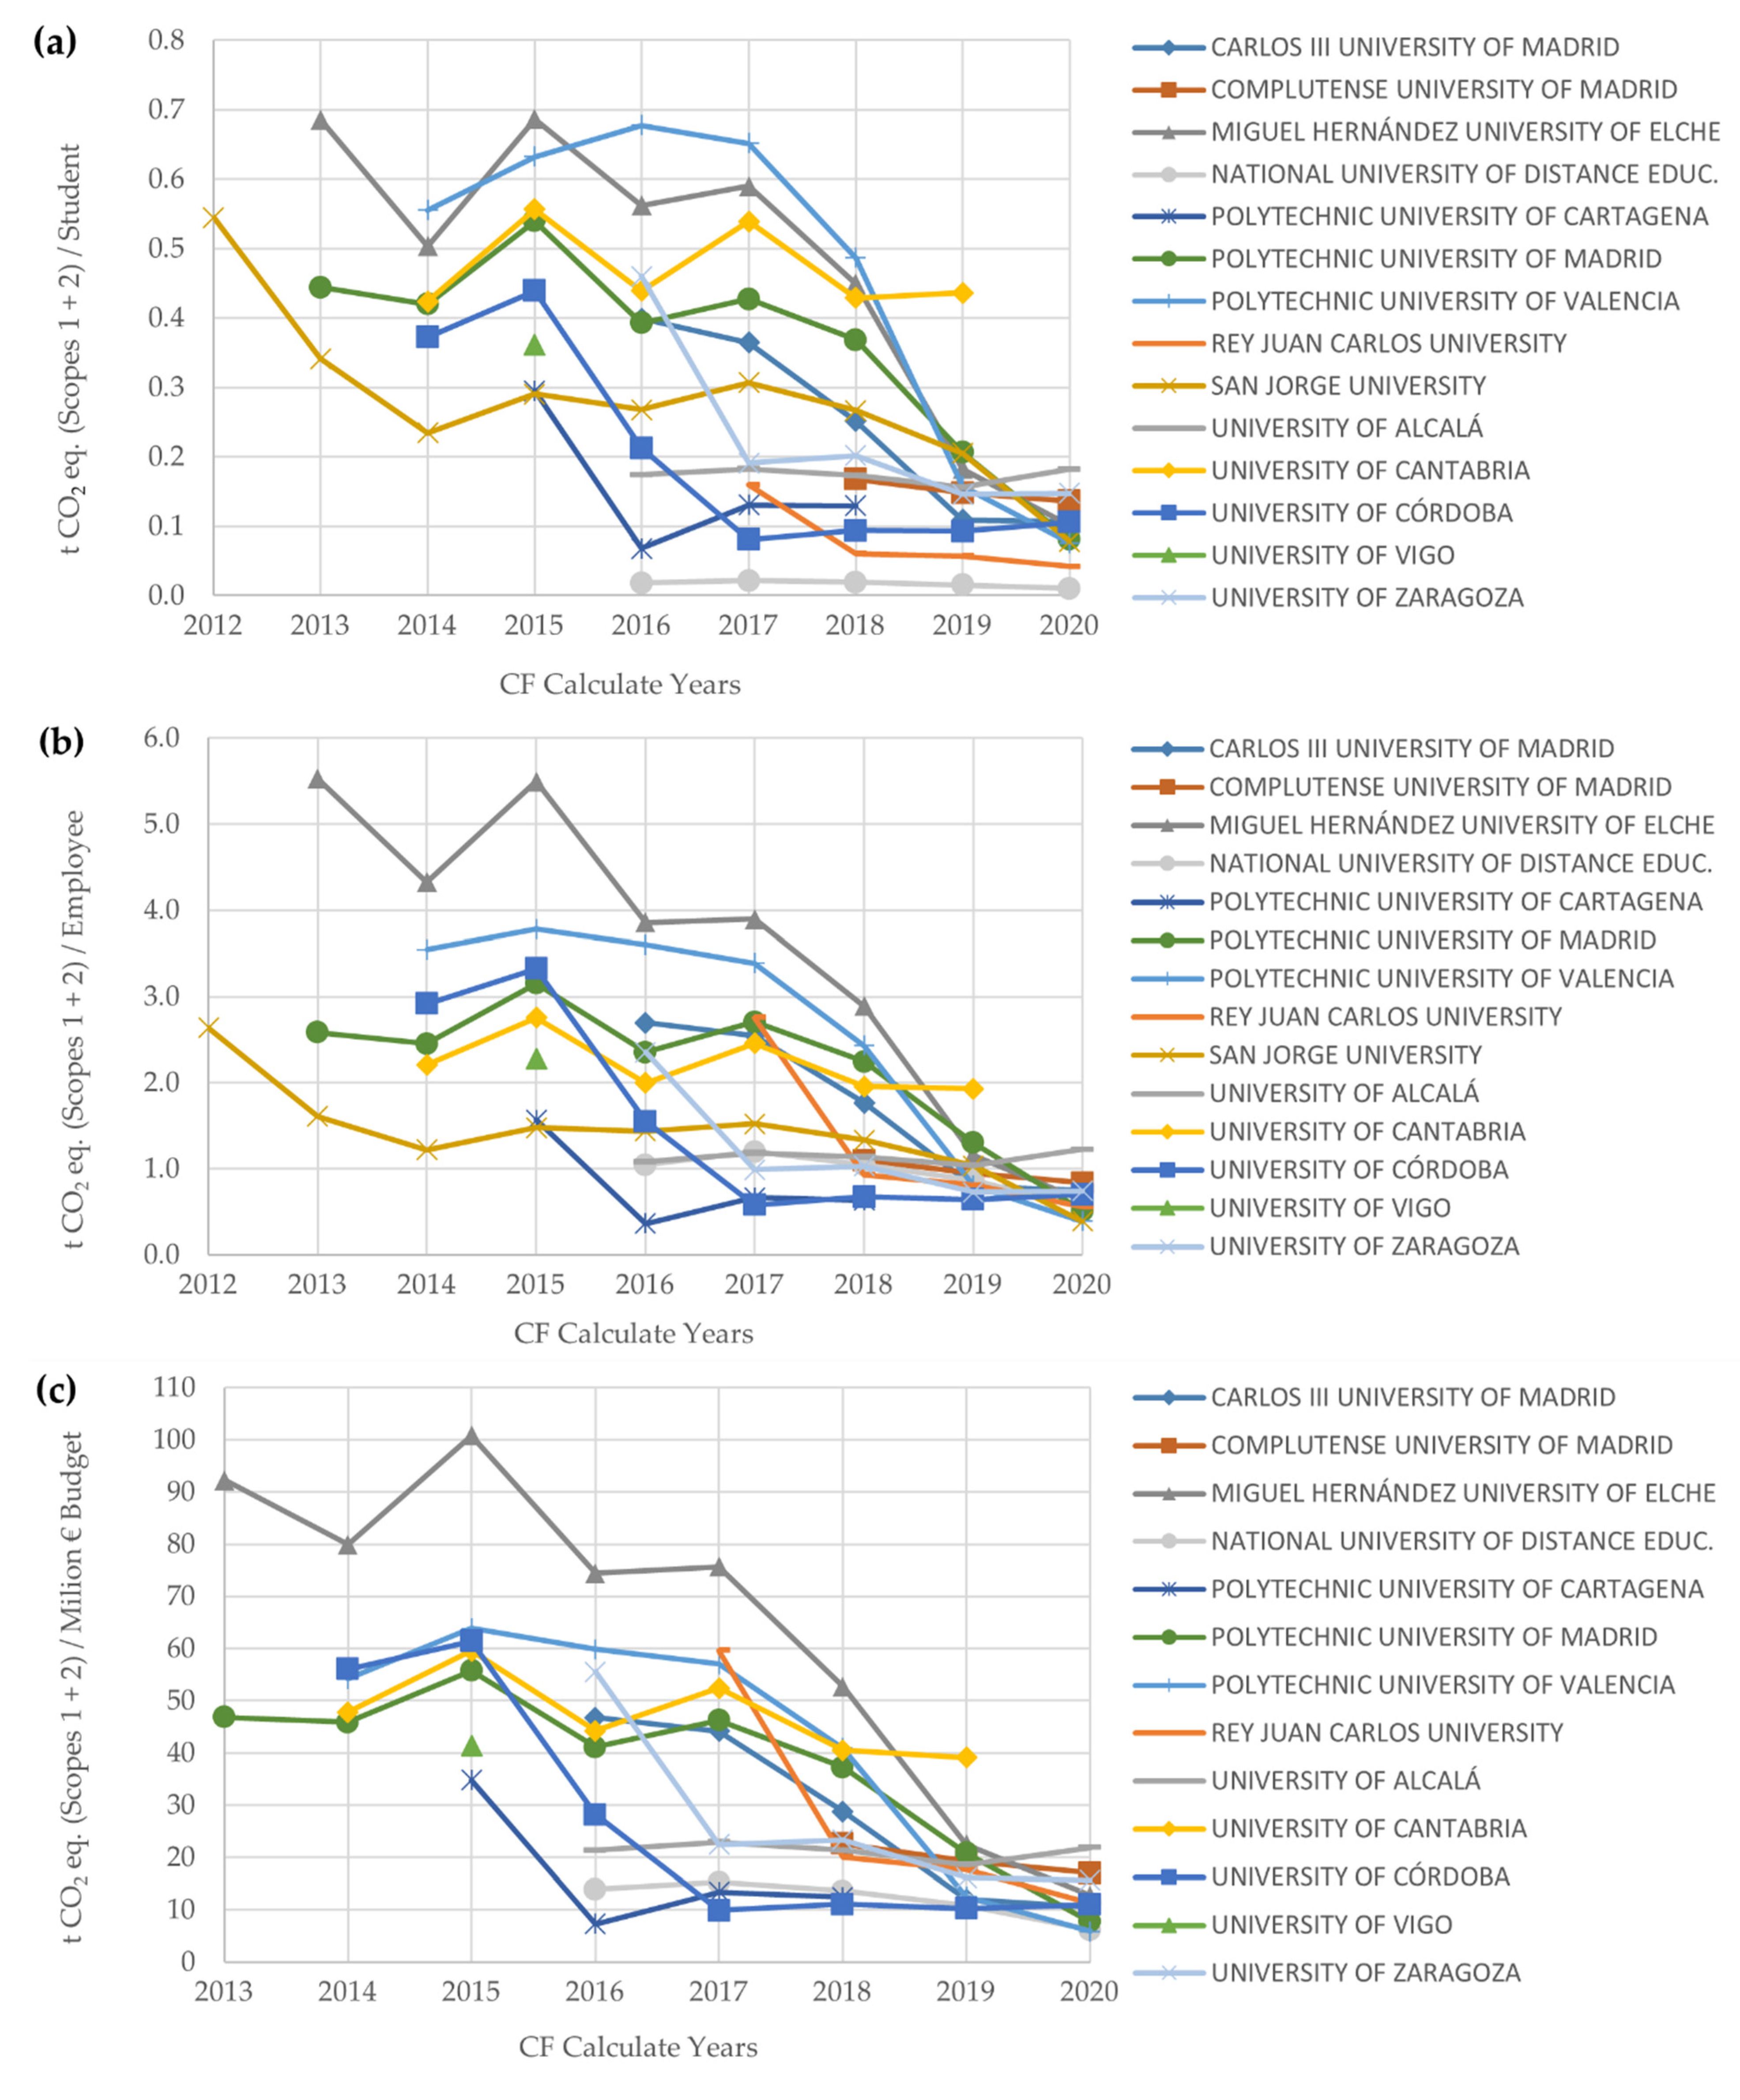
3.10. Temporal Evolution
4. Conclusions
- This study has made possible to draw a general map of the environmental performance in climate change mitigation of Spanish universities through a standardized tool for calculating and reporting CF. The environmental management performance in HEIs has been demonstrated by the high percentage of HEIs that calculate and record their CF compared to other economic sectors. Moreover, in recent years it has increased exponentially, on the line with the increased involvement of the world’s HEIs in the principles of sustainable development.
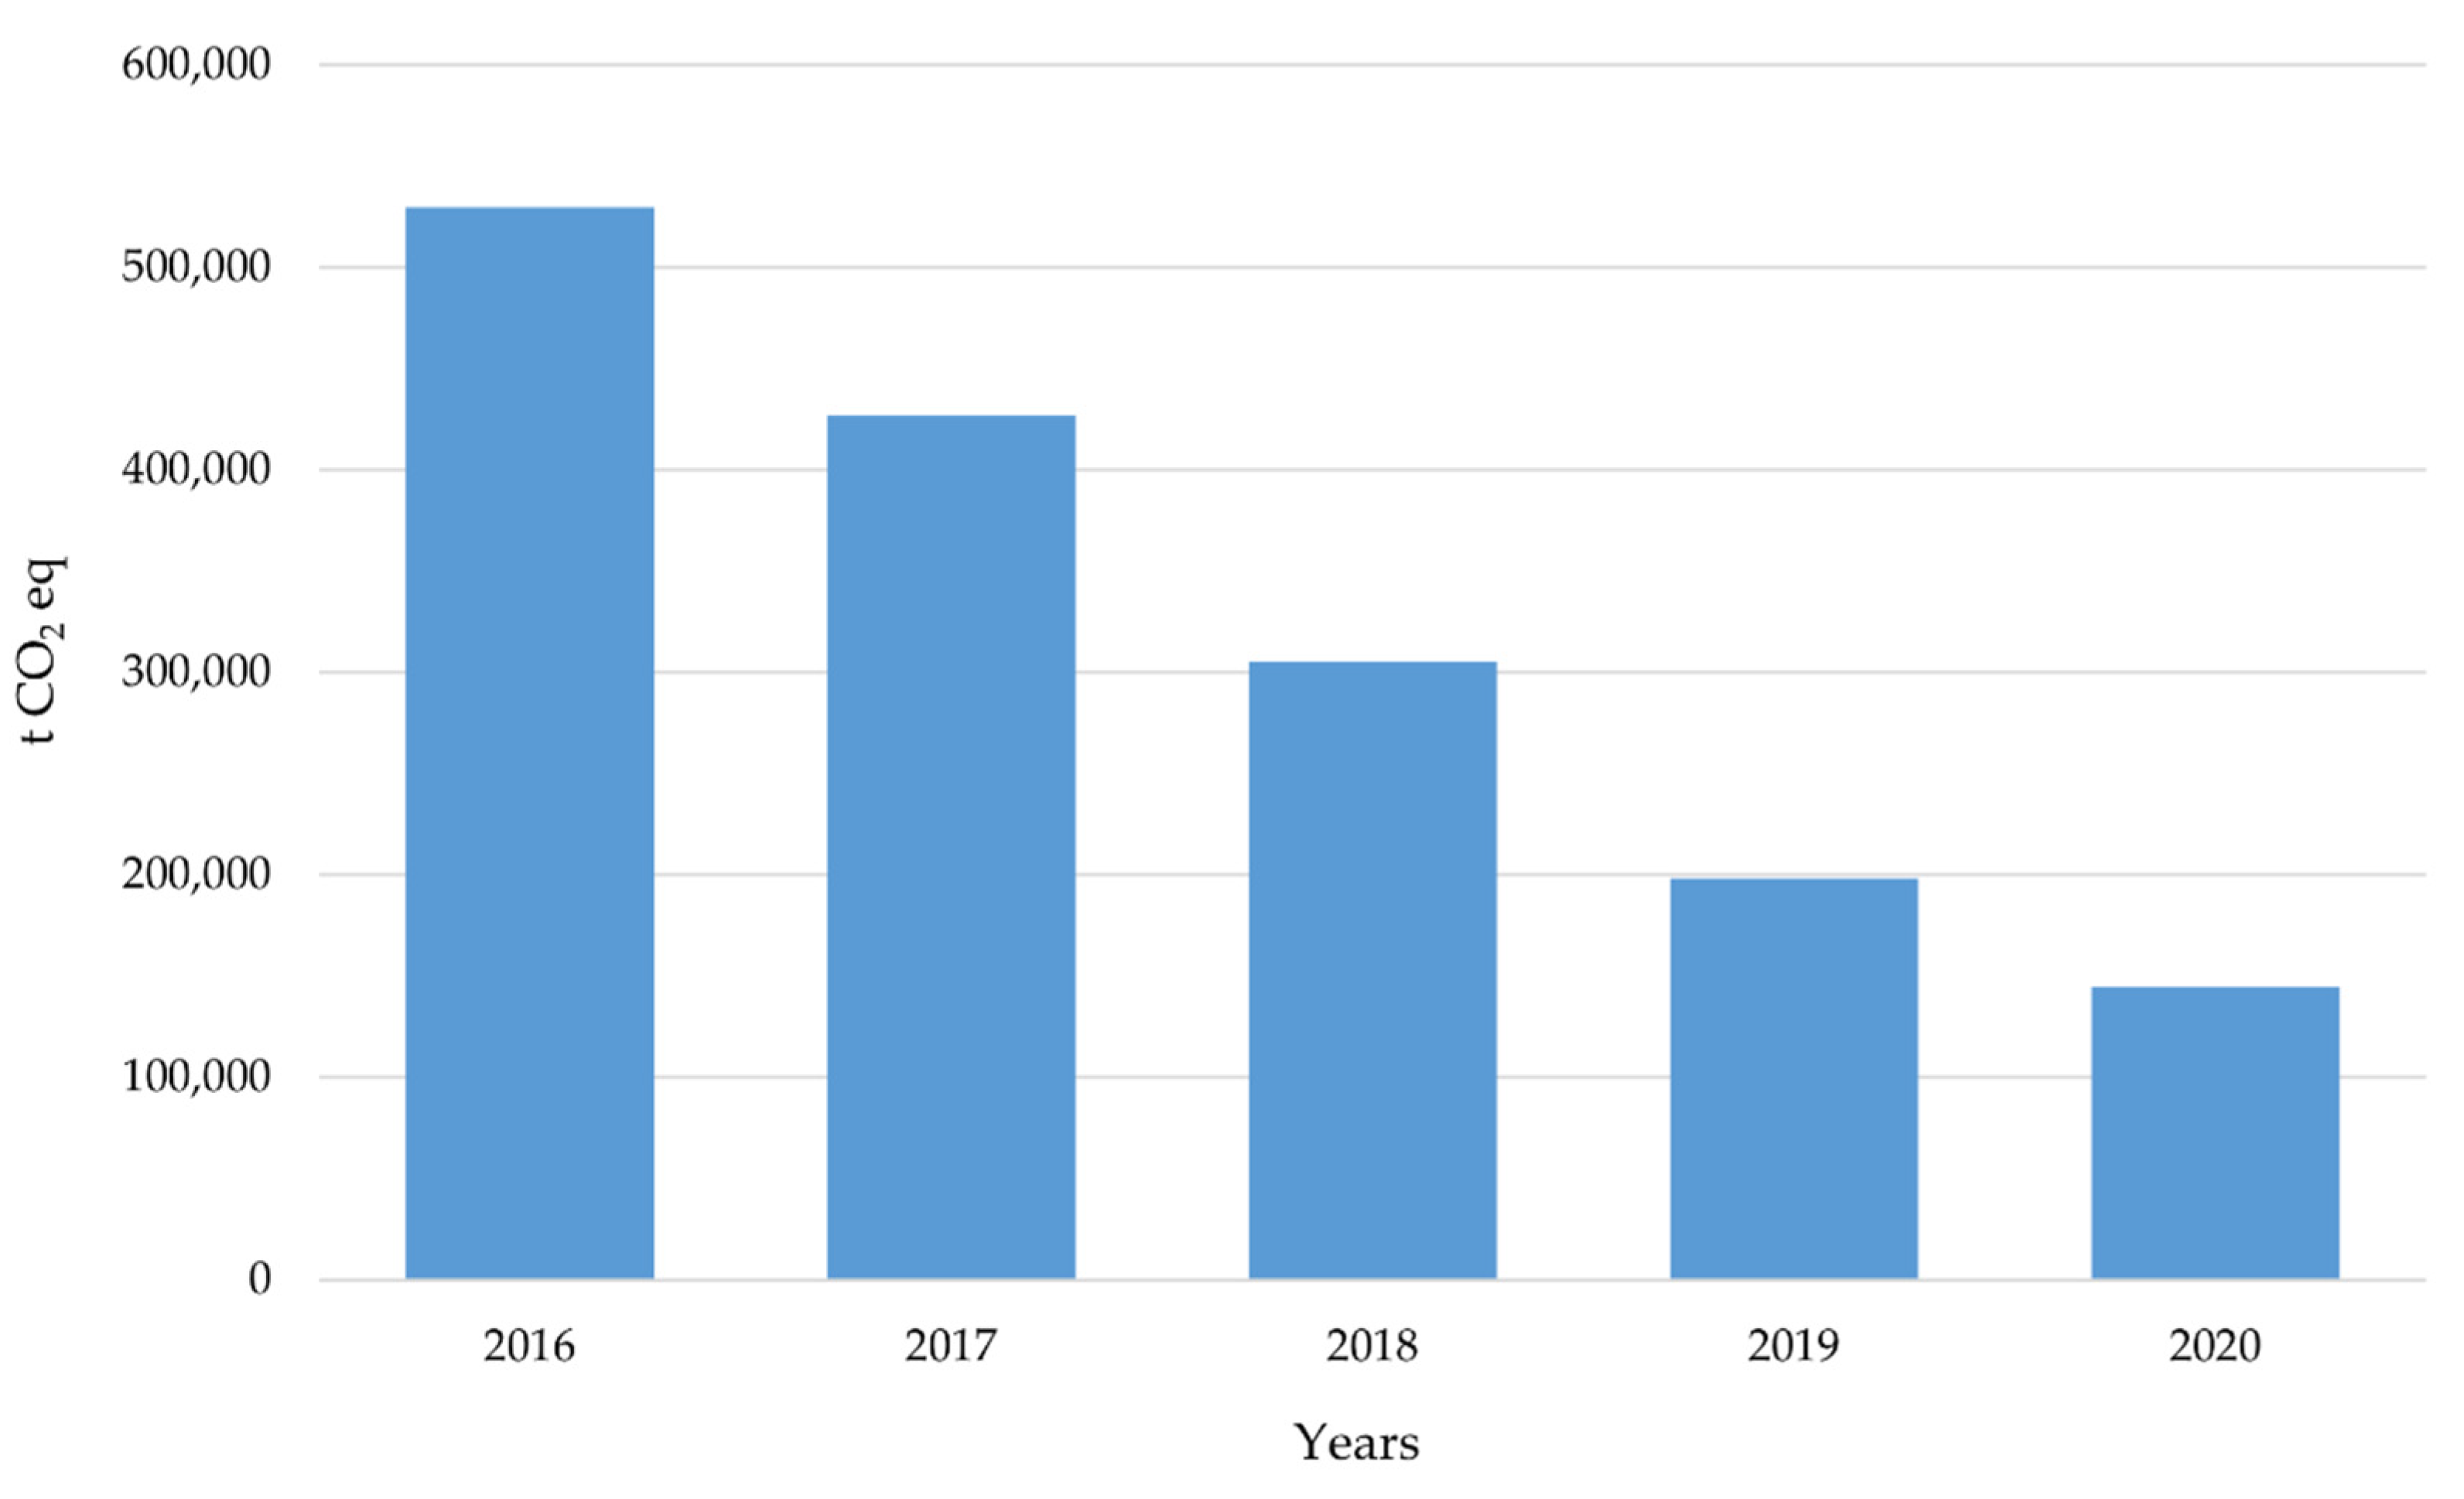
- The evolution of absolute values obtained for GHG emissions as an indicator of the operational environmental performance of the Spanish university system have allowed estimating a significant reduction (72.7%) for the study period, going from almost 600,000 t CO2eq in 2016 to about 145,000 t CO2eq by 2020. These data show the great effort of the Spanish universities to reduce their emissions, although there is still a significant margin for improvement in the area of offsetting GHG emissions through reforestation projects and other CO2 sinks.
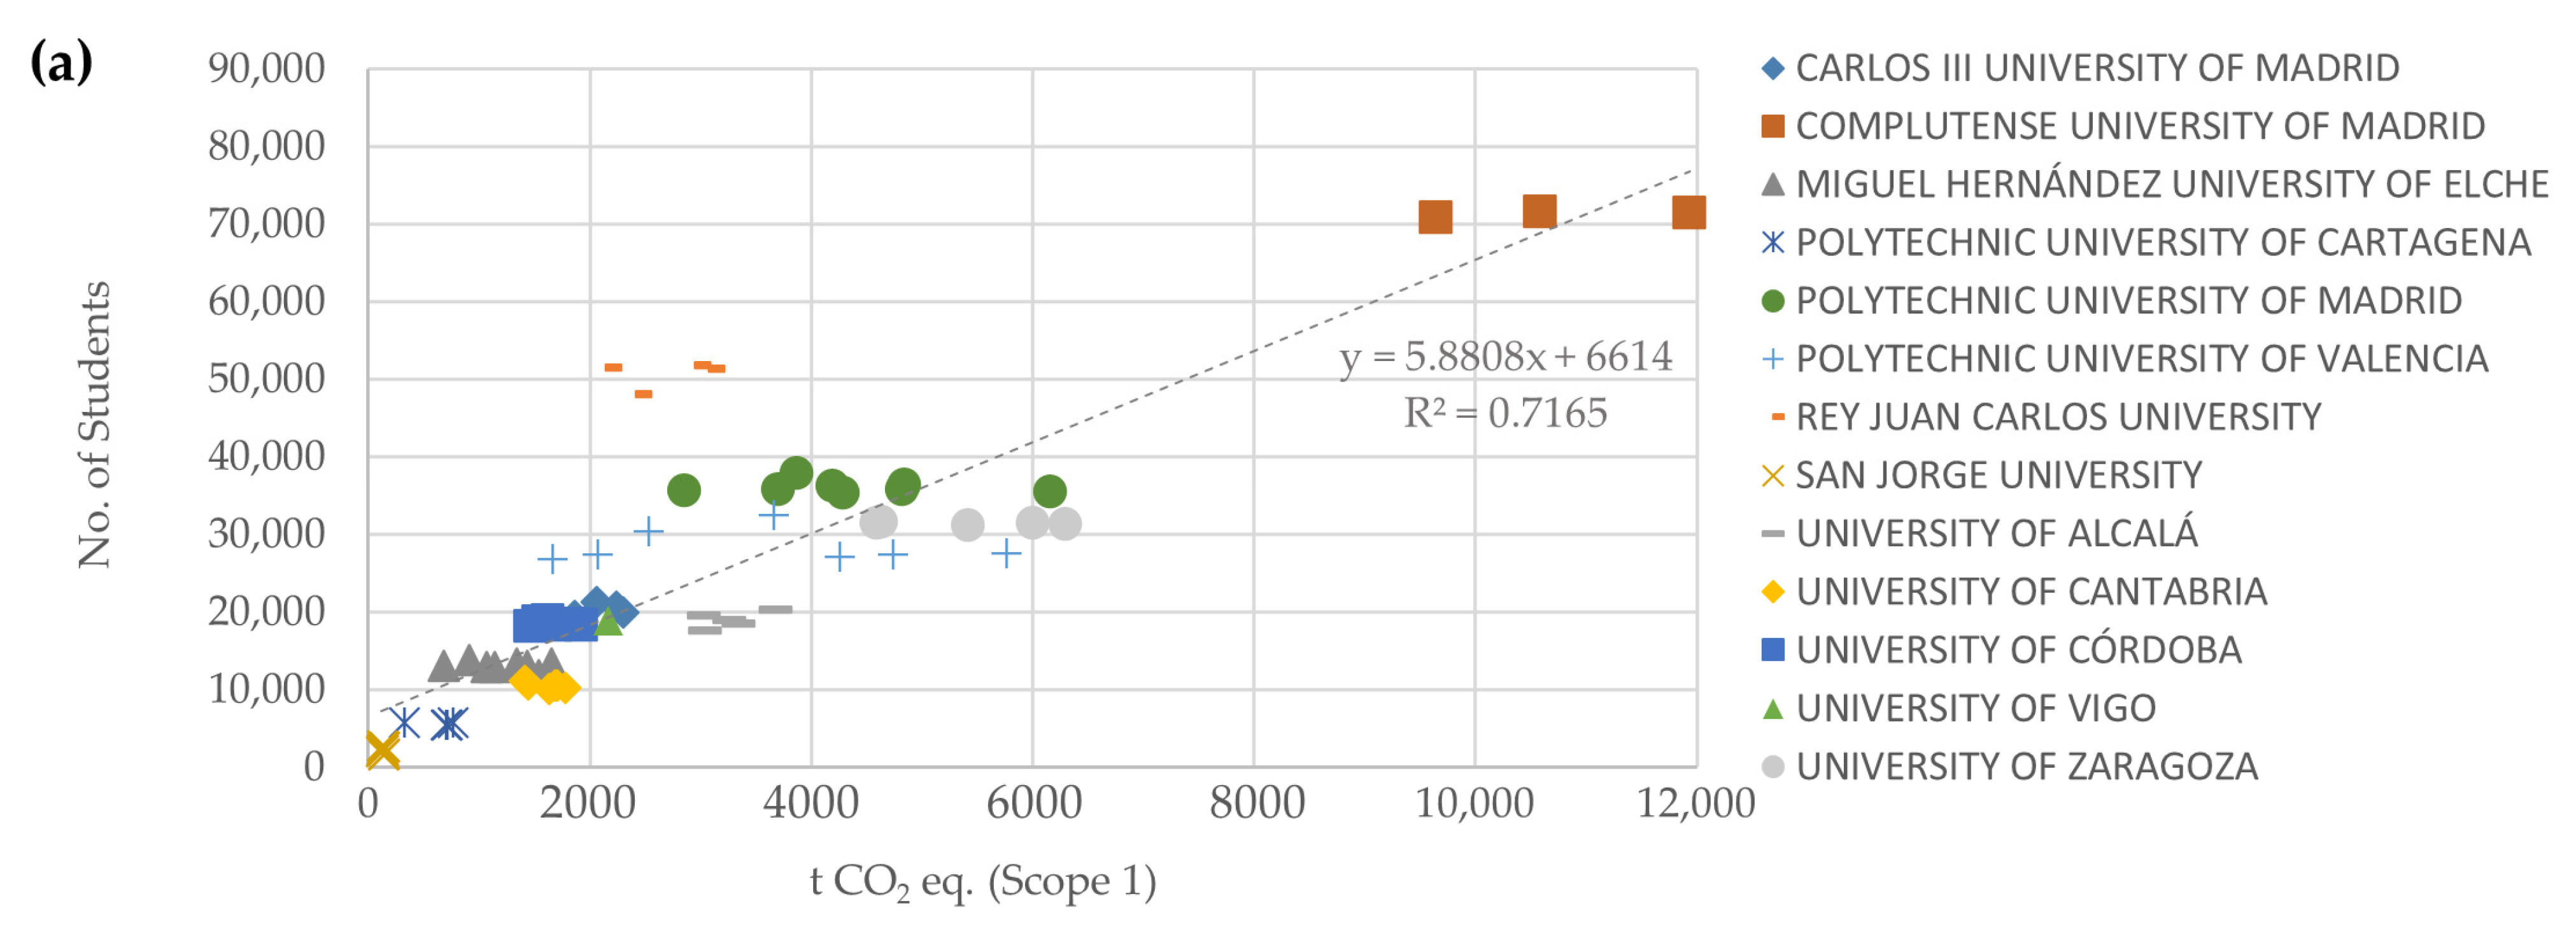
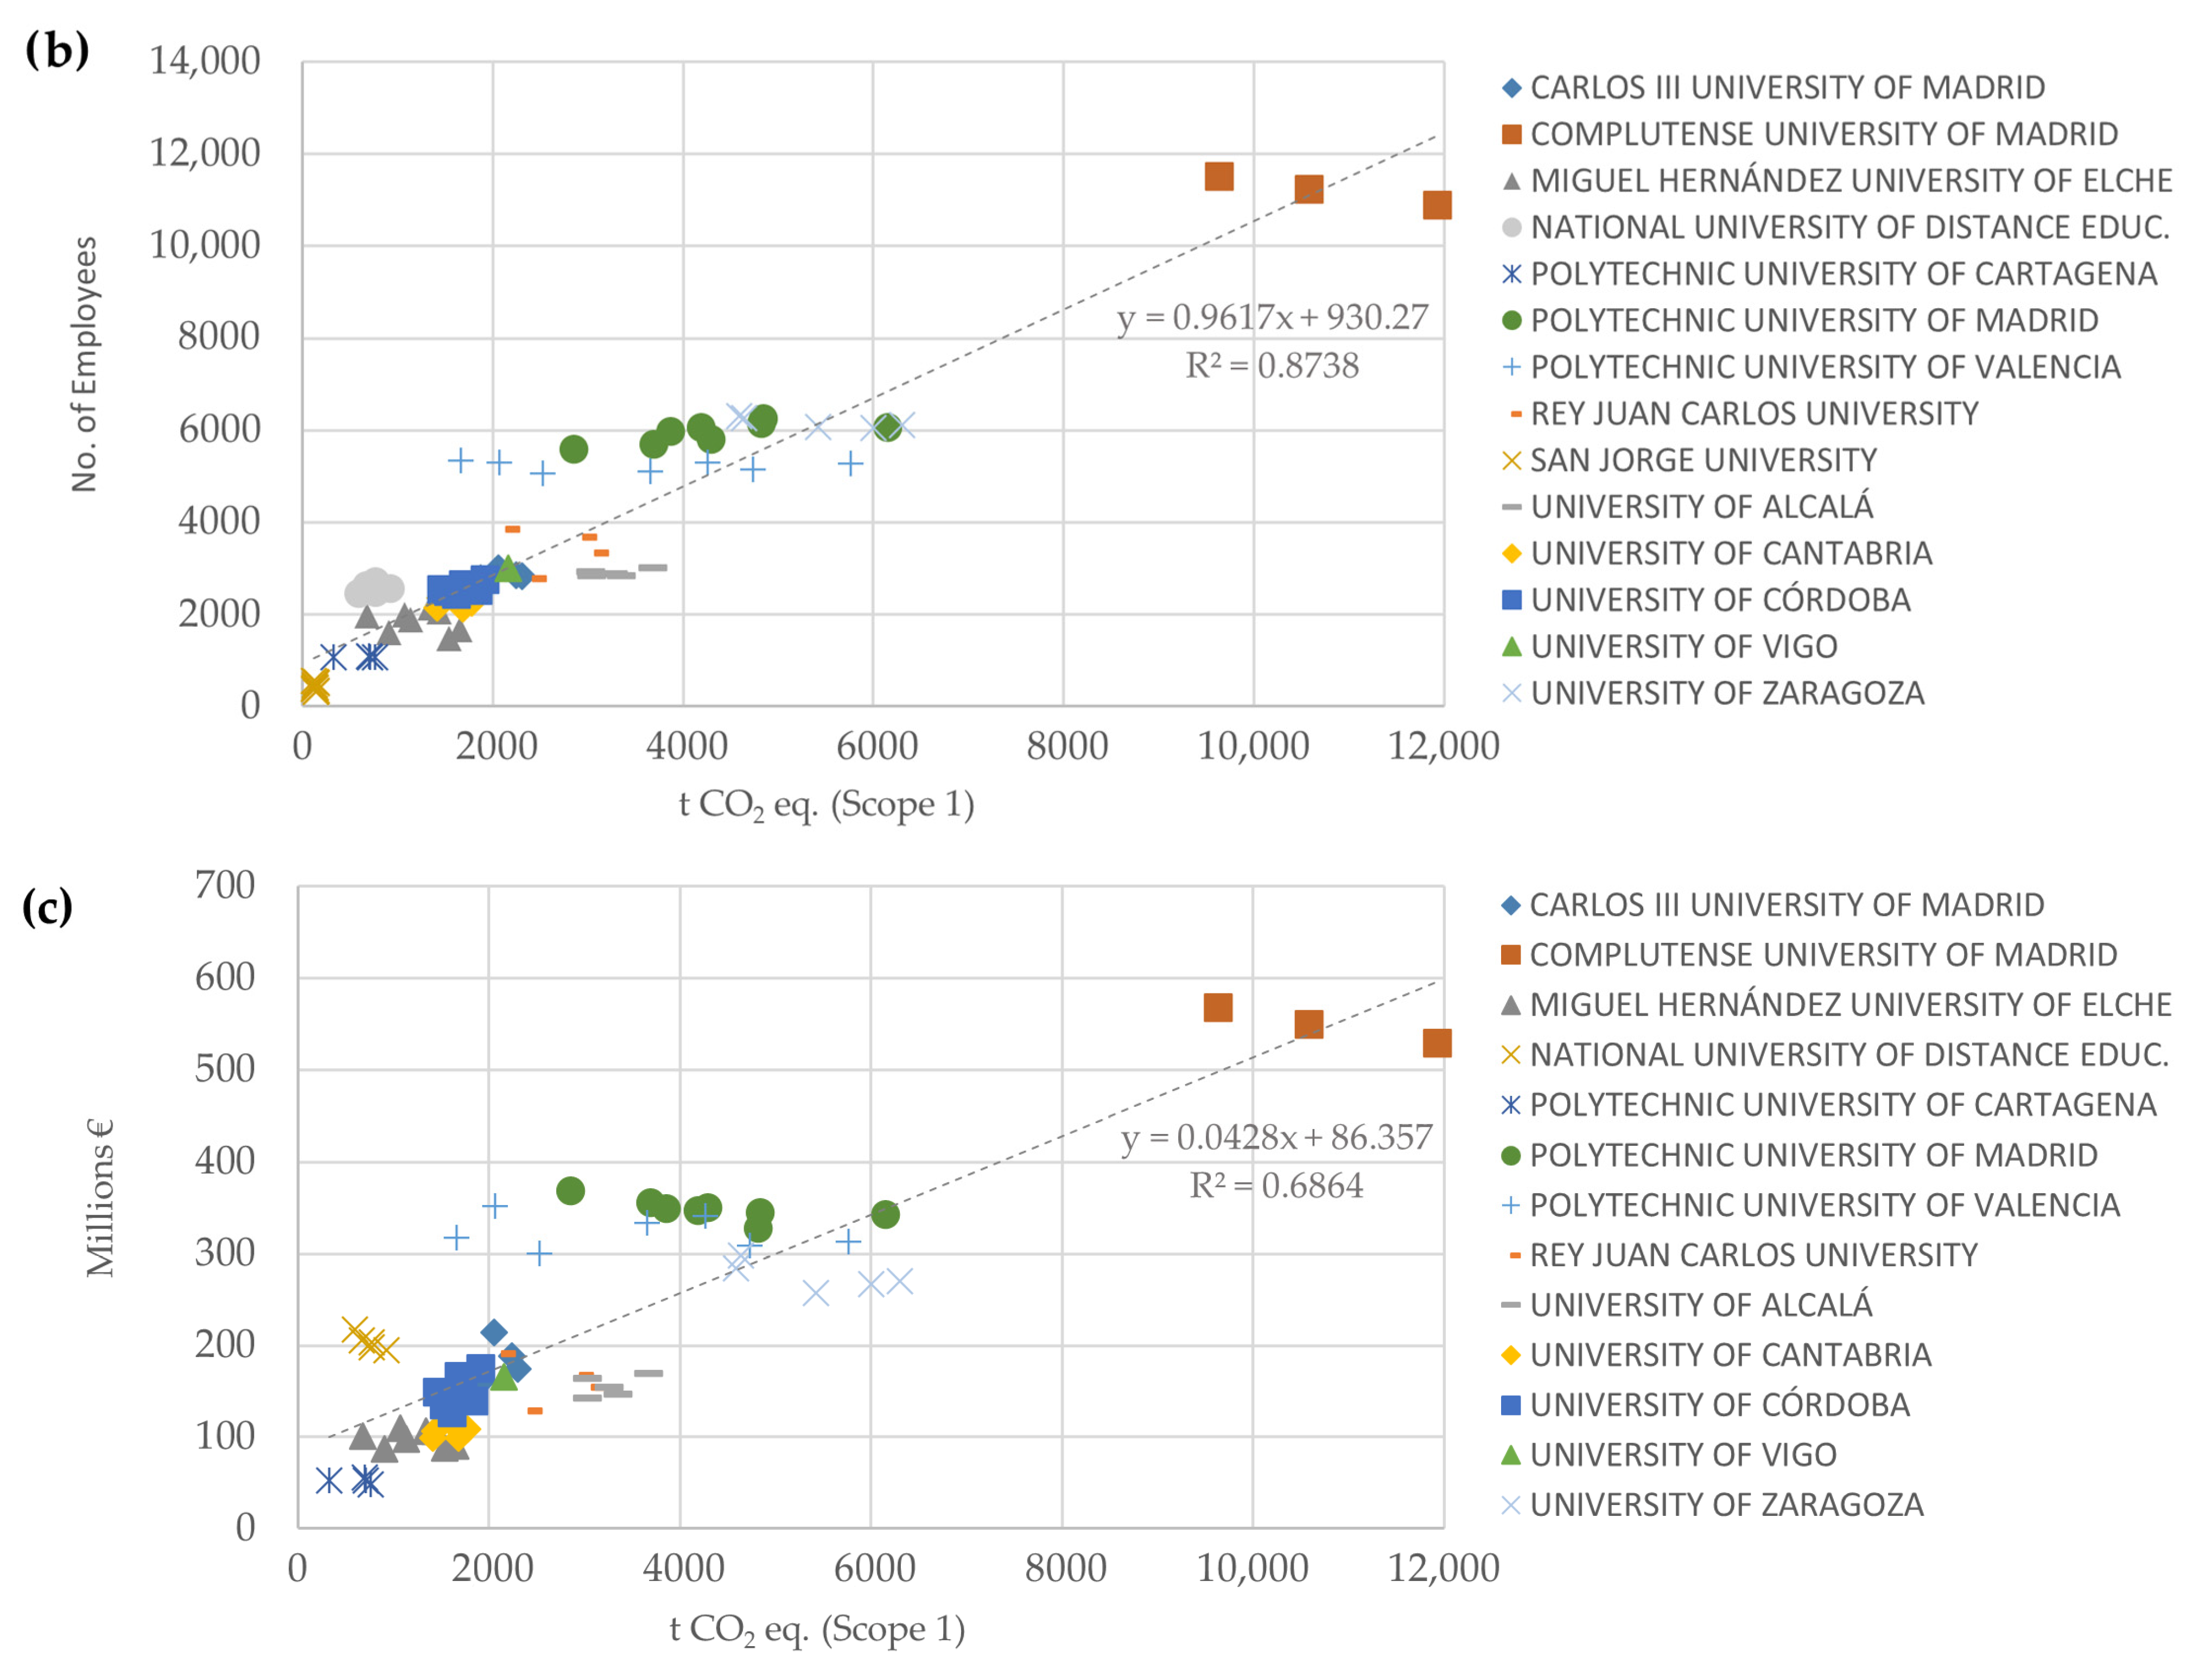
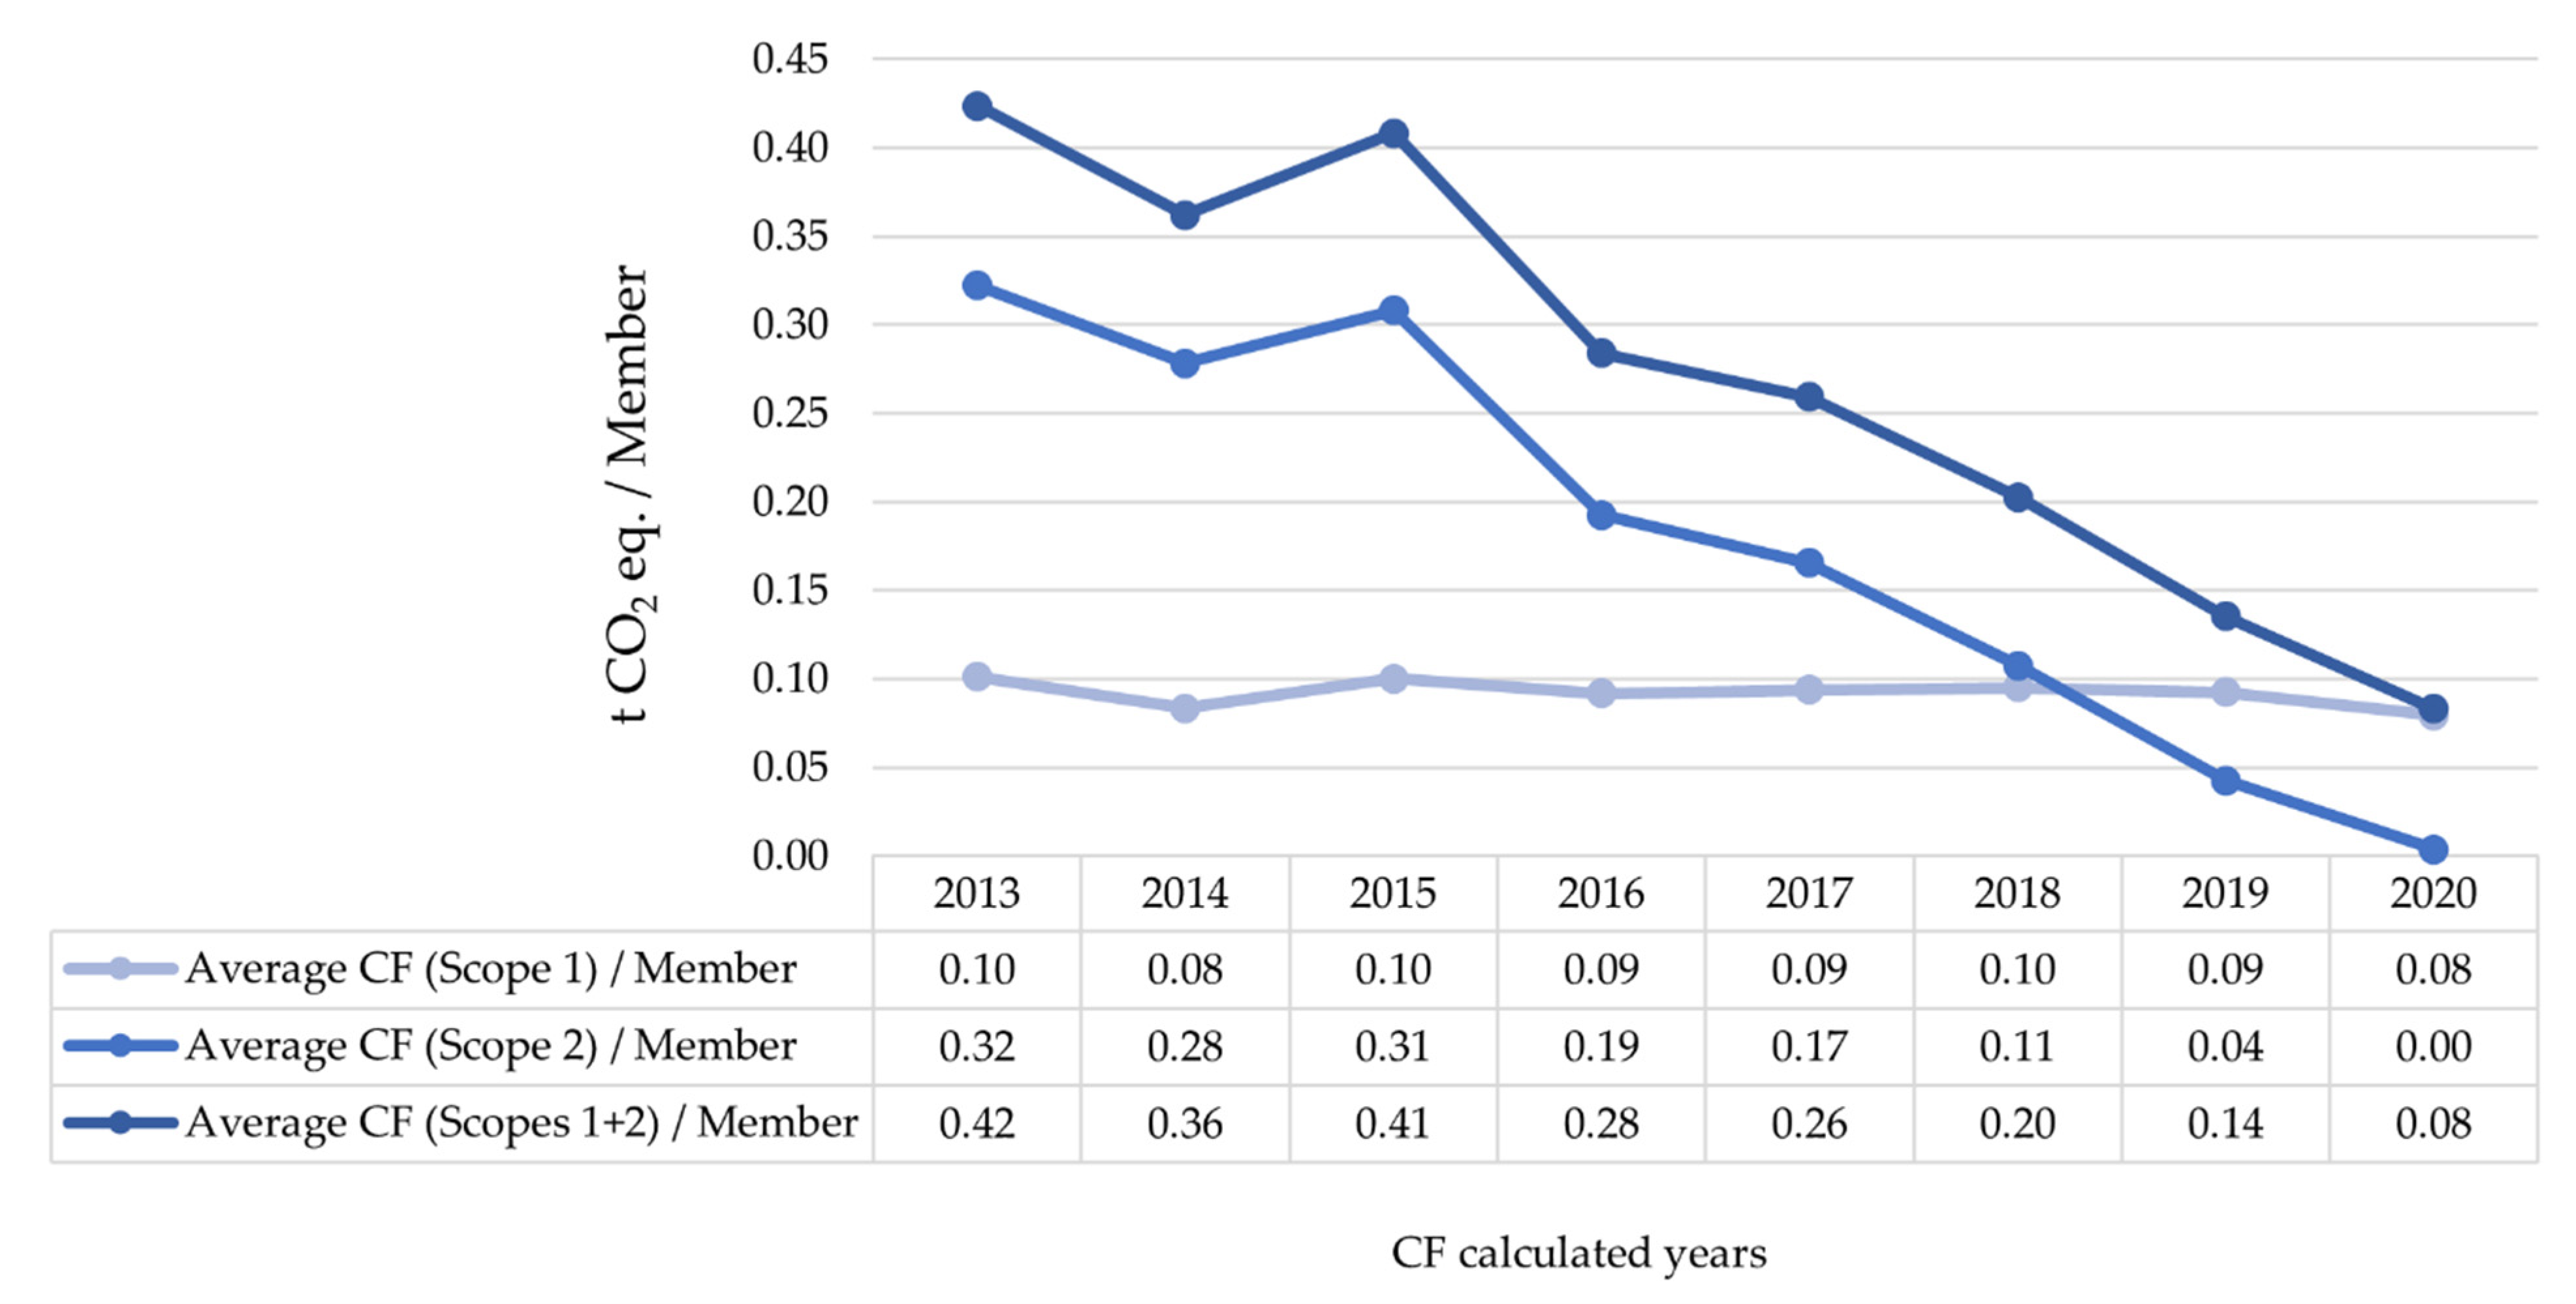
- Absolute direct emissions (Scope 1), due to the consumption of fossil fuels such as natural gas, diesel, etc., or refrigerant gas leakage, are correlated with the annual budget and with the standardized number of students and employees. In contrast, there are no significant correlations between indirect emissions due to the purchase of electricity (Scope 2) and the other variables. Therefore, GHG emissions from electricity consumption are not correlated with the amounts of electricity consumed but are correlated with the source of electricity and its emission factor. Since the emission factor varies depending on the electricity supplier, universities could reduce their CF drastically only by contracting electricity from renewable sources. Although there is an overall decrease in total CF, direct GHG emissions (Scope 1) remain stable, so HEIs should focus their efforts on reducing the consumption of fossil fuels in their facilities, replacing them with renewable energy sources or biomass consumption.
- Regarding CF as a benchmarking tool among universities, there is a very high lack of consensus or standardization in the definition of the concepts of “student”, “employee”, and “member” used for the calculation of CF activity ratios, due to the fact that each university includes in its count, or does not include, different types of students (e.g., students in non-official studies, doctoral students, etc.) and employees (e.g., employees of outsourced companies, part-time staff, etc.). This variability causes large variations in the relative CF values per member (between −24% and 131%), depending on how the concept of “member” is defined, which is significant enough to preclude comparison between published CF values without first checking that the functional units are defined and calculated in the same way.
- Consequently, standardization of university activity ratios is proposed. These indicator definitions should be based primarily on the robustness of the data over time and their ease of collection, since more precise ratios such as “full-time equivalent person” or “actual number of users of the facilities” would complicate the calculation and prevent comparison. The annual budget of the institution is one of the functional units proposed, which is not commonly used by HEIs, but provides a well-defined activity ratio related to the size of the university and its operating capacity.
- The recalculation of all normalized CFs of HEIs with standardized activity ratios has provided detailed data for GHG emissions of HEIs broken down by type of emission source, which can serve as a basis for future benchmarking of the operational environmental performance of HEIs worldwide.
- As for the CF calculation and registration tool provided by the Spanish Government, it has been proved to be a good basis for a comparative evaluation, since it does not only standardize the sources of emissions and scopes, but also provides updated emission factors and ensures homogeneity. As an opportunity for improvement, it is proposed that the organizational and operational boundaries should always include the whole institution and its activities, or that they should be clearly specified when it is not the case.
- It can be extrapolated worldwide that the calculation of CF can be a valid key indicator for benchmarking the environmental performance in the fight against climate change of HEIs of any country, provided that all CFs must (1) have included the standardized Scope 1 and Scope 2 GHG emission sources, (2) have used the same emissions factors, and, above all, (3) have obtained the activity ratios from homogeneous standardized functional units.
Author Contributions
Funding
Institutional Review Board Statement
Informed Consent Statement
Data Availability Statement
Acknowledgments
Conflicts of Interest
References
- Gu, Y.; Wang, H.; Xu, J.; Wang, Y.; Wang, X.; Robinson, Z.P.; Li, F.; Wu, J.; Tan, J.; Zhi, X. Quantification of Interlinked Environmental Footprints on a Sustainable University Campus: A Nexus Analysis Perspective. Appl. Energy 2019, 246, 65–76. [Google Scholar] [CrossRef]
- Cortese, A. The Critical Role of Higher Education in Creating a Sustainable Future. Plan. High. Educ. 2003, 13, 15–22. [Google Scholar]
- Gomera, A.; de Toro, A.; Aguilar, J.E.; Guijarro, C.; Antúnez, M.; Vaquero-Abellán, M. Combining Management, Education and Participation for the Transformation of Universities towards Sustainability: The Trébol Programme. Sustainability 2021, 13, 5959. [Google Scholar] [CrossRef]
- Cordero, E.C.; Centeno, D.; Todd, A.M. The Role of Climate Change Education on Individual Lifetime Carbon Emissions. PLoS ONE 2020, 15, e0206266. [Google Scholar] [CrossRef]
- Robinson, O.J.; Tewkesbury, A.; Kemp, S.; Williams, I.D. Towards a Universal Carbon Footprint Standard: A Case Study of Carbon Management at Universities. J. Clean. Prod. 2018, 172, 4435–4455. [Google Scholar] [CrossRef]
- Gómez, F.U.; Sáez-Navarrete, C.; Lioi, S.R.; Marzuca, V.I. Adaptable Model for Assessing Sustainability in Higher Education. J. Clean. Prod. 2015, 107, 475–485. [Google Scholar] [CrossRef]
- Alba, D. The Evaluation of the University’s Contribution to Environmental Sustainability: An Application to Spanish Universities, Doctorate Program Interuniversity in Environmental Education; Autonomous University of Madrid: Madrid, Spain, 2015. [Google Scholar]
- Johnstone, L. The Construction of Environmental Performance in ISO 14001-Certified SMEs. J. Clean. Prod. 2020, 263, 121559. [Google Scholar] [CrossRef]
- Trumpp, C.; Endrikat, J.; Zopf, C.; Guenther, E. Definition, Conceptualization, and Measurement of Corporate Environmental Performance: A Critical Examination of a Multidimensional Construct. J. Bus. Ethics 2015, 126, 185–204. [Google Scholar] [CrossRef]
- ISO 14031:1999; Environmental Management—Environmental Performance Evaluation—Guidelines. International Organization for Standardization: Geneva, Switzerland, 1999.
- Xie, S.; Hayase, K. Corporate Environmental Performance Evaluation: A Measurement Model and a New Concept. Bus. Strateg. Environ. 2007, 16, 148–168. [Google Scholar] [CrossRef]
- Boiral, O.; Guillaumie, L.; Heras-Saizarbitoria, I.; Tayo Tene, C.V. Adoption and Outcomes of ISO 14001: A Systematic Review. Int. J. Manag. Rev. 2018, 20, 411–432. [Google Scholar] [CrossRef]
- Spencer, S.Y.; Adams, C.; Yapa, P.W.S. The Mediating Effects of the Adoption of an Environmental Information System on Top Management’s Commitment and Environmental Performance. Sustain. Account. Manag. Policy J. 2013, 4, 75–102. [Google Scholar] [CrossRef]
- Lo-Iacono-Ferreira, V.G.; Torregrosa-López, J.I.; Capuz-Rizo, S. The Use of Carbon Footprint as a Key Performance Indicator in Higher Education Institutions. In Proceedings of the 22nd International Congress on Project Management and Engineering, Madrid, Spain, 11–13 July 2018. [Google Scholar]
- Ridhosari, B.; Rahman, A. Carbon Footprint Assessment at Universitas Pertamina from the Scope of Electricity, Transportation, and Waste Generation: Toward a Green Campus and Promotion of Environmental Sustainability. J. Clean. Prod. 2020, 246, 119172. [Google Scholar] [CrossRef]
- Valls-Val, K.; Bovea, M.D. Carbon Footprint in Higher Education Institutions: A Literature Review and Prospects for Future Research. Clean Technol. Environ. Policy 2021, 23, 2523–2542. [Google Scholar] [CrossRef]
- Kulkarni, S.D. A Bottom up Approach to Evaluate the Carbon Footprints of a Higher Educational Institute in India for Sustainable Existence. J. Clean. Prod. 2019, 231, 633–641. [Google Scholar] [CrossRef]
- Wright, L.A.; Kemp, S.; Williams, I. “Carbon Footprinting”: Towards a Universally Accepted Definition. Carbon Manag. 2011, 2, 61–72. [Google Scholar] [CrossRef]
- WRI/WBCSD Greenhouse Gas Protocol. Corporate Value Chain (Scope 3) Accounting and Reporting; WBCSD: Geneva, Switzerland, 2011; ISBN 9789896540821. [Google Scholar]
- Bailey, G.; LaPoint, T. Comparing Greenhouse Gas Emissions across Texas Universities. Sustainability 2016, 8, 80. [Google Scholar] [CrossRef]
- Robinson, O.J.; Kemp, S.; Williams, I. Carbon Management at Universities: A Reality Check. J. Clean. Prod. 2015, 106, 109–118. [Google Scholar] [CrossRef]
- Abdelalim, A.; O’Brien, W.; Shi, Z. Visualization of Energy and Water Consumption and GHG Emissions: A Case Study of a Canadian University Campus. Energy Build. 2015, 109, 334–352. [Google Scholar] [CrossRef]
- Helmers, E.; Chang, C.C.; Dauwels, J. Carbon Footprinting of Universities Worldwide: Part I—Objective Comparison by Standardized Metrics. Environ. Sci. Eur. 2021, 33, 30. [Google Scholar] [CrossRef]
- Valls-Val, K.; Bovea, M.D. Carbon Footprint Assessment Tool for Universities: CO2UNV. Sustain. Prod. Consum. 2022, 29, 791–804. [Google Scholar] [CrossRef]
- Alvarez, S.; Blanquer, M.; Rubio, A. Carbon Footprint Using the Compound Method Based on Financial Accounts. The Case of the School of Forestry Engineering, Technical University of Madrid. J. Clean. Prod. 2014, 66, 224–232. [Google Scholar] [CrossRef]
- Gomez, N.; Cadarso, M.Á.; Monsalve, F.; Gómez, N.; Cadarso, M.Á.; Monsalve, F.; Gomez, N.; Cadarso, M.Á.; Monsalve, F. Carbon Footprint of a University in a Multiregional Model: The Case of the University of Castilla-La Mancha. J. Clean. Prod. 2016, 138, 119–130. [Google Scholar] [CrossRef]
- Rodríguez Andara, A.; Rio Belver, R.M.; Garcia Marina, V. Sustainable University Institutions: Determination of Gases Greenhouse Efect in a University Center and Strategies to Decrease Them. DYNA 2020, 95, 47–53. [Google Scholar] [CrossRef]
- Guerrero, A.J.; García-Orenes, F.; Ruiz, J.J.; Vicente, P.G. The Spanish Carbon Footprint Calculation and Registration System: The Miguel Hernández of Elche University Case. Adv. Ecol. Environ. Res. 2019, 4, 324–336. [Google Scholar]
- Puchades, M.; De la Guardia, A.; Albertos, J. La Huella de Carbono de La Universitat de València: Diagnóstico, Análisis y Evaluación. Cuad. Geogr. 2011, 89, 99–114. [Google Scholar]
- Arroyo Hernández, P.; Álvarez, J.M.; Falagán Fernández, J.; Martínez Sanz, C.; Ansola González, G.; Calabuig, E.D.L. Ecological Footprint of the Vegazana Campus. An Approach to Its Value. Implications for the Sustainability of the University Community. In Seguridad y Medio Ambiente; MAPFRE: Madrid, Spain, 2009; pp. 38–51. [Google Scholar]
- Torregrosa-López, J.I.; Lo-Iacono-Ferrreira, V.G.; Lledó-Lagardera, D.; Martí-Barranco, C. Un Indicador Ambiental Para Medir La Sostenibilidad En Las Universidades, La Huella Ecológica. Caso de Estudio de La Universitat Politècnica de València. In Proceedings of the National Environmental Congress CONAMA10, Madrid, Spain, 22–26 November 2010. [Google Scholar]
- Giménez, A.; Pérez, I.; Montesinos, P.; Vera, V.; Bordonado, S. Pautas de Movilidad y Alternativas de Reducción de La Huella Ecológica En Centros de Trabajo: La Universidad Miguel Hernández Como Caso de Estudio. In Fundación MAPFRE. Seguridad y Medioambiente; MAPFRE: Madrid, Spain, 2009; pp. 2–13. [Google Scholar]
- Lo-Iacono-Ferreira, V.G.; Capuz-Rizo, S.F.; Torregrosa-López, J.I. Key Performance Indicators to Optimize the Environmental Performance of Higher Education Institutions with Environmental Management System—A Case Study of Universitat Politècnica de València. J. Clean. Prod. 2018, 178, 846–865. [Google Scholar] [CrossRef]
- ISO 14044:2006; Environmental Management—Life Cycle Assessment—Requirements and Guidelines. International Organization for Standardization: Geneva, Switzerland, 2006.
- Spanish Government Royal Decree 163/2014, of 14 March, Creating the Registry of Carbon Footprint, Offsetting and Carbon Dioxide Absorption Projects; Spanish Government: Madrid, Spain, 2014.
- Ministry of General Secretariat of Universities. Integrated University Information System. General Secretariat of Universities. Available online: https://www.universidades.gob.es/portal/site/universidades/menuitem.78fe777017742d34e0acc310026041a0/?vgnextoid=b93dd58bc3350710VgnVCM1000002006140aRCRD (accessed on 4 May 2022).
- INE National Statistics Institute—Companies Registered in Spain by Main Activity (CNAE 2009 Groups). Available online: https://www.ine.es/jaxiT3/Tabla.htm?t=298 (accessed on 3 March 2022).
- WRI/WBCSD Greenhouses Gases Procotol. A Corporate Accounting and Reporting Standard; Revised Edition; WBCSD: Geneva, Switzerland, 2004; ISBN 1-56973-568-9. [Google Scholar]
- Ministry of General Secretariat of Universities. Data and Figures of the Spanish University System (2011–2021). Available online: https://www.universidades.gob.es/portal/site/universidades/menuitem.a9621cf716a24d251662c810026041a0/?vgnextoid=044e91d248552710VgnVCM1000001d04140aRCRD (accessed on 1 March 2022).
- UC3M Carlos III University of Madrid 2020 Budget. Available online: https://www.uc3m.es/about-uc3m/financial-information (accessed on 5 March 2022).
- UCM Complutense University of Madrid 2019–2020 Facts and Figures. Available online: https://www.ucm.es/portaldetransparencia/ucm-en-cifras (accessed on 25 March 2022).
- USJ San Jorge University 2013–2015 Reports. Available online: https://cultura.usj.es/ediciones/memorias-academicas/ (accessed on 5 March 2022).
- UAH University of Alcalá 2020 Budget. Available online: https://transparencia.uah.es/transparencia-economica/presupuestos-2020/ (accessed on 4 May 2022).
- UNICAN University of Cantabria Reports 2013–2015. Available online: https://web.unican.es/unidades/serviciodecomunicacion/publicaciones-institucionales (accessed on 1 March 2022).
- UCO University of Córdoba Annual Financial Reports—2014–2020. Available online: https://www.uco.es/gestion/gestioneconomica/presupuestos (accessed on 3 March 2022).
- UVIGO University of Vigo Social Responsibility Report 2015. Available online: https://secretaria.uvigo.gal/uv/web/transparencia/pagina/show/47?_locale=es (accessed on 1 March 2022).
- UNIZAR University of Zaragoza 2020 Budget. Available online: https://www.unizar.es/institucion/presupuesto (accessed on 15 March 2022).
- UMH Miguel Hernández University of Elche Financial Year 2020 Budget Report. Available online: https://presupuestoypatrimonio.umh.es/2019/12/19/presupuesto-2020/ (accessed on 1 February 2022).
- UMH Miguel Hernández University of Elche Social Responsibility Reports 2007–2015. Available online: https://vdo.institucionales.umh.es/rsu/ (accessed on 1 February 2022).
- UNED National University of Distance Education 2020 Budget. Available online: https://www.uned.es/universidad/inicio/portaltransparencia/contenidos/presupuestos-ejecucion.html (accessed on 2 May 2022).
- UPM Polytechnic University of Madrid Social Council Report 2013–2015. Available online: https://www.upm.es/UPM/ConsejoSocial/Documentacion (accessed on 5 February 2022).
- UPM Polytechnic University of Madrid—Budgets 2020. Available online: https://transparencia.upm.es/economico/memoria (accessed on 6 February 2022).
- UPV Polytechnic University of Valencia—Reports of the Academic Years 2013/14 and 2014/15. Available online: https://www.upv.es/entidades/SG/infoweb/sg/info/518515normalc.html (accessed on 8 February 2022).
- UPV Polytechnic University of Valencia—2020 Budget. Available online: http://www.upv.es/entidades/GER/info/1094557normalc.html (accessed on 4 March 2022).
- Rey Juan Carlos University. Rey Juan Carlos University General Budget 2020. Available online: https://transparencia.urjc.es/informacion-economica/ (accessed on 22 March 2022).
- RStudio Team. RStudio v.3.6.2; RStudio Team: Boston, MA, USA, 2022. [Google Scholar]
- Lê, S.; Josse, J.; Husson, F. FactoMineR: An R Package for Multivariate Analysis. J. Stat. Softw. 2008, 25, 1–18. [Google Scholar] [CrossRef]
- Caeiro, S.; Hamón, L.A.S.; Martins, R.; Aldaz, C.E.B. Sustainability Assessment and Benchmarking in Higher Education Institutions-a Critical Reflection. Sustainability 2020, 12, 543. [Google Scholar] [CrossRef]
- MITECO Emission Factors. Registry of Carbon Footprint, Offsetting and Carbon Dioxide Removal; MITECO: Madrid, Spain, 2022. [Google Scholar]
- GESU Crue-Sosteniblidad Environmental Sustainability Diagnosis in Spanish Universities 2021; Spanish University Rectors’ Association (CRUE): Madrid, Spain, 2022.
- Vásquez, L.; Iriarte, A.; Almeida, M.; Villalobos, P. Evaluation of Greenhouse Gas Emissions and Proposals for Their Reduction at a University Campus in Chile. J. Clean. Prod. 2015, 108, 924–930. [Google Scholar] [CrossRef]
- Laingoen, O.; Kongkratoke, S.; Dokmaingam, P. Energy Consumption and Greenhouse Gas Emission Evaluation Scenarios of Mea Fah Luang University. MATEC Web Conf. 2016, 77, 06007. [Google Scholar] [CrossRef]
- Letete, T.C.M.; Mungwe, N.W.; Guma, M.; Marquard, A. Carbon Footprint of the University of Cape Town. J. Energy S. Afr. 2011, 22, 2–12. [Google Scholar] [CrossRef]
- Ologun, O.O.; Wara, S.T. Carbon Footprint Evaluation and Reduction as a Climate Change Mitigation Tool—Case Study of Federal University of Agriculture Abeokuta, Ogun State, Nigeria. Int. J. Renew. Energy Res. 2014, 4, 176–181. [Google Scholar]
- Riedy, C.; Daly, J. Targeting a Low-Carbon University: A Greenhouse Gas Reduction Target for the Australian Technology Network of Universities. In Universities and Climate Change—Introducing Climate Change at University Programmes; Springer: Berlin, Germany, 2010; pp. 151–162. [Google Scholar] [CrossRef]
- Almufadi, F.; Irfan, M.A. Initial Estimate of the Carbon Footprint of Qassim University, Saudi Arabia. Int. J. Appl. Eng. Res. 2016, 11, 8511–8514. [Google Scholar]
- Yañez, P.; Sinha, A.; Vásquez, M. Carbon Footprint Estimation in a University Campus: Evaluation and Insights. Sustainability 2019, 12, 181. [Google Scholar] [CrossRef] [Green Version]
- Syafrudin, S.; Zaman, B.; Budihardjo, M.A.; Yumaroh, S.; Gita, D.I.; Lantip, D.S. Carbon Footprint of Academic Activities: A Case Study in Diponegoro University. IOP Conf. Ser. Earth Environ. Sci. 2020, 448, 012008. [Google Scholar] [CrossRef]
- Tae, H.; Ko, C.-S.; Kwak, J.-G.; Seong, A.; Alothman, M.A.; Alrowaili, Z.A.; Iskandar, J.; Rahma, N.; Rosnarti, D.; Purnomo, A.B. The Carbon Footprint of Trisakti University’s Campus in Jakarta, Indonesia. IOP Conf. Ser. Earth Environ. Sci. 2020, 452, 012103. [Google Scholar] [CrossRef]
- Monash University Annual Report 2016. Available online: https://www.monash.edu/__data/assets/pdf_file/0011/844508/monash-university-2016-annual-report.pdf (accessed on 4 May 2022).
- UMD University of Maryland Climate Action Plan 2.0uthor|Positive Change Purchasing Cooperative. Available online: https://positivechangepc.com/uncategorized/university-of-maryland-climate-action-plan-2-0uthor/ (accessed on 19 March 2022).
- Sangwan, K.S.; Bhakar, V.; Arora, V.; Solanki, P. Measuring Carbon Footprint of an Indian University Using Life Cycle Assessment. Procedia CIRP 2018, 69, 475–480. [Google Scholar] [CrossRef]
- Clabeaux, R.; Carbajales-Dale, M.; Ladner, D.; Walker, T. Assessing the Carbon Footprint of a University Campus Using a Life Cycle Assessment Approach. J. Clean. Prod. 2020, 273, 122600. [Google Scholar] [CrossRef]
- Ozawa-Meida, L.; Brockway, P.; Letten, K.; Davies, J.; Fleming, P. Measuring Carbon Performance in a UK University through a Consumption-Based Carbon Footprint: De Montfort University Case Study. J. Clean. Prod. 2013, 56, 185–198. [Google Scholar] [CrossRef]
- Larrazábal, J. La Conducción Eficiente. Dyna 2004, 79, 12–14. [Google Scholar]
- Patchell, J. Can the Implications of the GHG Protocol’s Scope 3 Standard Be Realized? J. Clean. Prod. 2018, 185, 941–958. [Google Scholar] [CrossRef]
- Sinha, P.; Schew, W.A.; Sawant, A.; Kolwaite, K.J.; Strode, S.A. Greenhouse Gas Emissions from U.S. Institutions of Higher Education. J. Air Waste Manag. Assoc. 2012, 60, 568–573. [Google Scholar] [CrossRef]
- Schwartzkopf, L.; Urban, G. Minnesota State University (Mankato) Carbon Footprint Update Report 2018. Available online: https://mankato.mnsu.edu/globalassets/finance-and-administration/greencampus/carbonfootprint/minnesota-state-mankato-carbon-footprint-update-report-2018-final.pdf (accessed on 2 May 2022).
- Larsen, H.N.; Pettersen, J.; Solli, C.; Hertwich, E.G. Investigating the Carbon Footprint of a University—The Case of NTNU. J. Clean. Prod. 2013, 48, 39–47. [Google Scholar] [CrossRef]
- Klein-Banai, C.; Theis, T.L. Quantitative Analysis of Factors Affecting Greenhouse Gas Emissions at Institutions of Higher Education. J. Clean. Prod. 2013, 48, 29–38. [Google Scholar] [CrossRef]
- Fischer, D.; Jenssen, S.; Tappeser, V. Getting an Empirical Hold of the Sustainable University: A Comparative Analysis of Evaluation Frameworks across 12 Contemporary Sustainability Assessment Tools. Assess. Eval. High. Educ. 2015, 40, 785–800. [Google Scholar] [CrossRef] [Green Version]
- European Central Bank Euro Foreign Exchange Reference Rates. Available online: https://www.ecb.europa.eu/stats/policy_and_exchange_rates/euro_reference_exchange_rates/html/eurofxref-graph-usd.en.html (accessed on 20 June 2022).
- Baboulet, O.; Lenzen, M. Evaluating the Environmental Performance of a University. J. Clean. Prod. 2010, 18, 1134–1141. [Google Scholar] [CrossRef]
- Criollo, N.P.; Ramirez, A.D.; Salas, D.A.; Andrade, R. The Role of Higher Education Institutions Regarding Climate Change: The Case of Escuela Superior Politécnica Del Litoral and Its Carbon Footprint in Ecuador. In Proceedings of the ASME International Mechanical Engineering Congress and Exposition, American Society of Mechanical Engineers, Salt Lake City, UT, USA, 11 November 2019; Volume 5. [Google Scholar]


| HEI Name | HEI Spanish Acronym | Type of Learning a | Founds b | Date of First Register | No. of CFs Registered | Years Calculated |
|---|---|---|---|---|---|---|
| CARLOS III UNIVERSITY OF MADRID | UC3M | F | Pu | 30 March 2022 | 5 | 2016–2020 |
| COMPLUTENSE UNIVERSITY OF MADRID | UCM | F | Pu | 4 January 2022 | 3 | 2018–2020 |
| MIGUEL HERNÁNDEZ UNIVERSITY OF ELCHE | UMH | F | Pu | 13 October 2015 | 8 | 2013–2020 |
| NATIONAL UNIVERSITY OF DISTANCE EDUCATION | UNED | D | Pu | 30 March 2022 | 5 | 2016–2020 |
| POLYTECHNIC UNIVERSITY OF CARTAGENA | UPC | F | Pu | 26 September 2018 | 4 | 2015–2018 |
| POLYTECHNIC UNIVERSITY OF MADRID | UPM | F | Pu | 30 July 2014 | 12 c | 2011–2020 |
| POLYTECHNIC UNIVERSITY OF VALENCIA | UPV | F | Pu | 2 June 2016 | 7 | 2014–2020 |
| REY JUAN CARLOS UNIVERSITY | URJC | F | Pu | 10 February 2022 | 4 | 2017–2020 |
| SAN JORGE UNIVERSITY | USJ | F | Prv | 23 February 2016 | 9 | 2012–2020 |
| UNIVERSITY OF ALCALÁ | UAH | F | Pu | 18 January 2021 | 5 | 2016–2020 |
| UNIVERSITY OF CANTABRIA | UCAN | F | Pu | 2 October 2018 | 6 | 2014–2019 |
| UNIVERSITY OF CÓRDOBA | UCO | F | Pu | 18 January 2022 | 7 | 2014–2020 |
| UNIVERSITY OF VIGO | UVIGO | F | Pu | 18 September 2017 | 1 | 2015 |
| UNIVERSITY OF ZARAGOZA | UNIZAR | F | Pu | 15 December 2017 | 5 | 2016–2020 |
| All HEIs | Face-to-Face HEIs | Non-Face-to-Face HEIs | ||||||||
|---|---|---|---|---|---|---|---|---|---|---|
| CF Year | Academic Year a | Total Students b | No. Students Included in CFs | % Students Included in CFs | Total Students b | No. Students Included in CFs | % Students Included in CFs | Total Students b | No. Students Included in CFs | % Students Included in CFs |
| 2012 | 2011/2012 | 1,572,617 | 1525 | 0.1% | 1,345,045 | 1525 | 0.1% | 227,572 | 0 | 0.0% |
| 2013 | 2012/2013 | 1,548,534 | 49,830 | 3.2% | 1,327,345 | 49,830 | 3.8% | 221,189 | 0 | 0.0% |
| 2014 | 2013/2014 | 1,539,709 | 114,150 | 7.4% | 1,311,822 | 114,150 | 8.7% | 227,887 | 0 | 0.0% |
| 2015 | 2014/2015 | 1,506,179 | 134,946 | 9.0% | 1,279,550 | 134,946 | 10.5% | 226,629 | 0 | 0.0% |
| 2016 | 2015/2016 | 1,548,369 | 336,953 | 21.8% | 1,315,688 | 180,752 | 13.7% | 232,681 | 156,201 | 67.1% |
| 2017 | 2016/2017 | 1,564,943 | 379,369 | 24.2% | 1,330,150 | 231,971 | 17.4% | 234,793 | 147,398 | 62.8% |
| 2018 | 2017/2018 | 1,583,025 | 444,070 | 28.1% | 1,345,417 | 304,097 | 22.6% | 237,608 | 139,973 | 58.9% |
| 2019 | 2018/2019 | 1,599,050 | 442,450 | 27.7% | 1,353,605 | 301,666 | 22.3% | 245,445 | 140,784 | 57.4% |
| 2020 | 2019/2020 | 1,626,210 | 429,481 | 26.4% | 1,369,096 | 292,259 | 21.3% | 257,114 | 137,222 | 53.4% |
| Average per year: | 1,565,404 | 259,197 | 16.6% | 1,330,858 | 179,022 | 13.5% | 234,546 | 80,175 | 34.2% | |
| Annual Average/HEI & Year | CF Scope 1 per Student a | CF Scope 1 per Student a | CF Scope 1 per Employee b | CF Scope 2 per Employee b | CF Scope 1 per Member c | CF Scope 2 per Member c | CF Scope 1 per M€ Budget d | CF Scope 2 per M€ Budget d |
|---|---|---|---|---|---|---|---|---|
| (tCO2eq/std) | (tCO2eq/std) | (tCO2eq/emp) | (tCO2eq/emp) | (tCO2eq/per) | (tCO2eq/per) | (tCO2eq/M€) | (tCO2eq/M€) | |
| AVERAGE 2012 | 0.09 | 0.46 | 0.43 | 2.21 | 0.07 | 0.38 | 11.76 | 61.04 |
| AVERAGE 2013 | 0.12 | 0.37 | 0.75 | 2.49 | 0.10 | 0.32 | 14.66 | 47.46 |
| AVERAGE 2014 | 0.10 | 0.32 | 0.62 | 2.16 | 0.08 | 0.28 | 11.88 | 40.83 |
| AVERAGE 2015 | 0.12 | 0.36 | 0.71 | 2.27 | 0.10 | 0.31 | 13.82 | 43.15 |
| AVERAGE 2016 | 0.11 | 0.23 | 0.65 | 1.38 | 0.09 | 0.19 | 12.57 | 26.34 |
| AVERAGE 2017 | 0.11 | 0.19 | 0.69 | 1.30 | 0.09 | 0.17 | 13.47 | 24.73 |
| AVERAGE 2018 | 0.11 | 0.13 | 0.72 | 0.75 | 0.10 | 0.11 | 13.82 | 13.74 |
| AVERAGE 2019 | 0.11 | 0.05 | 0.70 | 0.30 | 0.09 | 0.04 | 12.91 | 5.78 |
| AVERAGE 2020 | 0.09 | 0.00 | 0.61 | 0.05 | 0.08 | 0.00 | 10.98 | 0.76 |
| UC3M 2016 | 0.10 | 0.30 | 0.69 | 2.00 | 0.09 | 0.26 | 12.01 | 34.75 |
| UC3M 2017 | 0.10 | 0.27 | 0.67 | 1.88 | 0.08 | 0.23 | 11.61 | 32.57 |
| UC3M 2018 | 0.12 | 0.14 | 0.81 | 0.95 | 0.10 | 0.12 | 13.23 | 15.49 |
| UC3M 2019 | 0.11 | 0.00 | 0.79 | 0.00 | 0.10 | 0.00 | 11.94 | 0.00 |
| UC3M 2020 | 0.10 | 0.01 | 0.68 | 0.06 | 0.09 | 0.01 | 9.59 | 0.87 |
| UCM 2018 | 0.17 | 0.00 | 1.10 | 0.00 | 0.15 | 0.00 | 22.59 | 0.03 |
| UCM 2019 | 0.15 | 0.00 | 0.94 | 0.00 | 0.13 | 0.00 | 19.30 | 0.00 |
| UCM 2020 | 0.14 | 0.00 | 0.84 | 0.00 | 0.12 | 0.00 | 17.02 | 0.00 |
| UMH 2013 | 0.13 | 0.56 | 1.04 | 4.49 | 0.11 | 0.50 | 17.32 | 74.92 |
| UMH 2014 | 0.07 | 0.44 | 0.56 | 3.76 | 0.06 | 0.39 | 10.40 | 69.52 |
| UMH 2015 | 0.12 | 0.56 | 0.99 | 4.50 | 0.11 | 0.50 | 18.22 | 82.54 |
| UMH 2016 | 0.09 | 0.47 | 0.61 | 3.25 | 0.08 | 0.41 | 11.68 | 62.74 |
| UMH 2017 | 0.05 | 0.54 | 0.35 | 3.55 | 0.05 | 0.47 | 6.75 | 68.91 |
| UMH 2018 | 0.08 | 0.37 | 0.54 | 2.35 | 0.07 | 0.32 | 9.76 | 42.94 |
| UMH 2019 | 0.11 | 0.07 | 0.70 | 0.46 | 0.10 | 0.06 | 13.55 | 8.86 |
| UMH 2020 | 0.10 | 0.00 | 0.63 | 0.00 | 0.09 | 0.00 | 12.67 | 0.00 |
| UNED 2016 | 0.00 | 0.01 | 0.29 | 0.76 | 0.00 | 0.01 | 3.81 | 10.09 |
| UNED 2017 | 0.00 | 0.02 | 0.26 | 0.94 | 0.00 | 0.02 | 3.28 | 11.94 |
| UNED 2018 | 0.01 | 0.01 | 0.36 | 0.68 | 0.01 | 0.01 | 4.75 | 8.86 |
| UNED 2019 | 0.01 | 0.01 | 0.31 | 0.56 | 0.01 | 0.01 | 3.90 | 6.96 |
| UNED 2020 | 0.00 | 0.01 | 0.24 | 0.30 | 0.00 | 0.01 | 2.73 | 3.43 |
| UPCT 2015 | 0.13 | 0.16 | 0.71 | 0.86 | 0.11 | 0.14 | 15.71 | 19.06 |
| UPCT 2016 | 0.06 | 0.01 | 0.31 | 0.05 | 0.05 | 0.01 | 6.20 | 1.10 |
| UPCT 2017 | 0.13 | 0.00 | 0.66 | 0.00 | 0.11 | 0.00 | 13.36 | 0.00 |
| UPCT 2018 | 0.13 | 0.00 | 0.63 | 0.00 | 0.11 | 0.00 | 12.38 | 0.00 |
| UPM 2013 | 0.13 | 0.31 | 0.78 | 1.81 | 0.11 | 0.26 | 14.07 | 32.71 |
| UPM 2014 | 0.13 | 0.28 | 0.79 | 1.66 | 0.12 | 0.24 | 14.74 | 31.11 |
| UPM 2015 | 0.17 | 0.37 | 1.02 | 2.13 | 0.15 | 0.31 | 18.01 | 37.75 |
| UPM 2016 | 0.12 | 0.28 | 0.69 | 1.66 | 0.10 | 0.24 | 12.12 | 28.94 |
| UPM 2017 | 0.10 | 0.32 | 0.65 | 2.06 | 0.09 | 0.28 | 11.08 | 35.17 |
| UPM 2018 | 0.12 | 0.25 | 0.74 | 1.50 | 0.10 | 0.21 | 12.29 | 24.92 |
| UPM 2019 | 0.10 | 0.10 | 0.65 | 0.65 | 0.09 | 0.09 | 10.43 | 10.37 |
| UPM 2020 | 0.08 | 0.00 | 0.51 | 0.00 | 0.07 | 0.00 | 7.76 | 0.00 |
| UPV 2014 | 0.11 | 0.44 | 0.72 | 2.82 | 0.10 | 0.38 | 10.98 | 43.17 |
| UPV 2015 | 0.08 | 0.55 | 0.50 | 3.28 | 0.07 | 0.47 | 8.43 | 55.43 |
| UPV 2016 | 0.17 | 0.50 | 0.92 | 2.68 | 0.15 | 0.42 | 15.32 | 44.54 |
| UPV 2017 | 0.21 | 0.44 | 1.09 | 2.29 | 0.18 | 0.37 | 18.40 | 38.64 |
| UPV 2018 | 0.06 | 0.42 | 0.31 | 2.12 | 0.05 | 0.35 | 5.23 | 35.64 |
| UPV 2019 | 0.16 | 0.00 | 0.80 | 0.00 | 0.13 | 0.00 | 12.49 | 0.00 |
| UPV 2020 | 0.08 | 0.00 | 0.39 | 0.00 | 0.06 | 0.00 | 5.89 | 0.00 |
| URJC 2017 | 0.05 | 0.11 | 0.87 | 1.88 | 0.05 | 0.10 | 18.83 | 40.74 |
| URJC 2018 | 0.06 | 0.00 | 0.93 | 0.00 | 0.06 | 0.00 | 19.96 | 0.00 |
| URJC 2019 | 0.06 | 0.00 | 0.81 | 0.00 | 0.05 | 0.00 | 17.71 | 0.00 |
| URJC 2020 | 0.04 | 0.00 | 0.56 | 0.00 | 0.04 | 0.00 | 11.27 | 0.00 |
| USJ 2012 | 0.09 | 0.46 | 0.43 | 2.21 | 0.07 | 0.38 | 11.76 | 61.04 |
| USJ 2013 | 0.09 | 0.25 | 0.43 | 1.18 | 0.07 | 0.21 | 12.59 | 34.74 |
| USJ 2014 | 0.06 | 0.18 | 0.30 | 0.92 | 0.05 | 0.15 | 7.98 | 24.56 |
| USJ 2015 | 0.06 | 0.23 | 0.33 | 1.15 | 0.05 | 0.19 | 8.48 | 29.83 |
| USJ 2016 | 0.06 | 0.21 | 0.32 | 1.12 | 0.05 | 0.18 | 7.77 | 27.64 |
| USJ 2017 | 0.06 | 0.25 | 0.28 | 1.24 | 0.05 | 0.21 | 7.33 | 32.29 |
| USJ 2018 | 0.06 | 0.21 | 0.29 | 1.04 | 0.05 | 0.17 | 7.39 | 26.56 |
| USJ 2019 | 0.05 | 0.15 | 0.26 | 0.78 | 0.04 | 0.13 | 6.17 | 18.64 |
| USJ 2020 | 0.04 | 0.03 | 0.22 | 0.17 | 0.04 | 0.03 | 5.44 | 4.08 |
| UAH 2016 | 0.17 | 0.00 | 1.08 | 0.00 | 0.15 | 0.00 | 21.36 | 0.00 |
| UAH 2017 | 0.18 | 0.00 | 1.18 | 0.00 | 0.16 | 0.00 | 22.86 | 0.00 |
| UAH 2018 | 0.17 | 0.00 | 1.14 | 0.00 | 0.15 | 0.00 | 21.31 | 0.00 |
| UAH 2019 | 0.16 | 0.00 | 1.04 | 0.00 | 0.14 | 0.00 | 18.60 | 0.00 |
| UAH 2020 | 0.18 | 0.00 | 1.22 | 0.00 | 0.16 | 0.00 | 21.85 | 0.00 |
| UCAN 2014 | 0.13 | 0.30 | 0.66 | 1.55 | 0.11 | 0.25 | 14.28 | 33.49 |
| UCAN 2015 | 0.16 | 0.40 | 0.79 | 1.96 | 0.13 | 0.33 | 17.10 | 42.43 |
| UCAN 2016 | 0.13 | 0.30 | 0.61 | 1.38 | 0.11 | 0.25 | 13.59 | 30.66 |
| UCAN 2017 | 0.16 | 0.38 | 0.74 | 1.71 | 0.13 | 0.31 | 15.84 | 36.55 |
| UCAN 2018 | 0.17 | 0.26 | 0.79 | 1.17 | 0.14 | 0.21 | 16.35 | 24.11 |
| UCAN 2019 | 0.16 | 0.27 | 0.71 | 1.21 | 0.13 | 0.22 | 14.48 | 24.58 |
| UCO 2014 | 0.09 | 0.29 | 0.67 | 2.24 | 0.08 | 0.25 | 12.92 | 43.12 |
| UCO 2015 | 0.08 | 0.36 | 0.62 | 2.70 | 0.07 | 0.32 | 11.52 | 49.89 |
| UCO 2016 | 0.10 | 0.11 | 0.73 | 0.82 | 0.09 | 0.10 | 13.32 | 14.83 |
| UCO 2017 | 0.08 | 0.00 | 0.58 | 0.00 | 0.07 | 0.00 | 9.85 | 0.00 |
| UCO 2018 | 0.09 | 0.00 | 0.67 | 0.00 | 0.08 | 0.00 | 11.08 | 0.00 |
| UCO 2019 | 0.09 | 0.00 | 0.64 | 0.00 | 0.08 | 0.00 | 10.24 | 0.00 |
| UCO 2020 | 0.11 | 0.00 | 0.70 | 0.00 | 0.09 | 0.00 | 11.00 | 0.00 |
| UVIGO 2015 | 0.11 | 0.25 | 0.72 | 1.56 | 0.10 | 0.21 | 13.09 | 28.26 |
| UNIZAR 2016 | 0.17 | 0.28 | 0.89 | 1.46 | 0.15 | 0.24 | 21.12 | 34.43 |
| UNIZAR 2017 | 0.19 | 0.00 | 0.99 | 0.00 | 0.16 | 0.00 | 22.47 | 0.00 |
| UNIZAR 2018 | 0.20 | 0.00 | 1.03 | 0.00 | 0.17 | 0.00 | 23.30 | 0.00 |
| UNIZAR 2019 | 0.15 | 0.00 | 0.73 | 0.00 | 0.12 | 0.00 | 16.14 | 0.00 |
| UNIZAR 2020 | 0.15 | 0.00 | 0.74 | 0.00 | 0.12 | 0.00 | 15.57 | 0.00 |
| Absolute CF (Scope 1 + 2) | Absolute CF (Scope 1) | Absolute CF (Scope 2) | ||
|---|---|---|---|---|
| No. Students | Pearson correlation | 0.50 | 0.85 | 0.16 |
| N | 72 | 72 | 72 | |
| R-squared (R2) | 0.25 | 0.72 | 0.02 | |
| No. Employees | Pearson correlation | 0.62 | 0.93 | 0.24 |
| N | 77 | 77 | 77 | |
| R-squared (R2) | 0.38 | 0.87 | 0.06 | |
| No. Members | Pearson correlation | 0.52 | 0.87 | 0.17 |
| N | 72 | 72 | 72 | |
| R-squared (R2) | 0.96 | 0.76 | 0.06 | |
| Millions € Budget | Pearson correlation | 0.55 | 0.83 | 0.22 |
| N | 68 | 68 | 68 | |
| R-squared (R2) | 0.31 | 0.69 | 0.05 |
| Absolute CF (Scope 1 + 2) | Electricity Consumption | Emission Factor | ||
|---|---|---|---|---|
| Electricity consumption | Pearson correlation | 0.50 | 1 | −0.062 |
| Sig. (bilateral) | 72 | 0.773 | ||
| N | 0.25 | 24 | 24 | |
| Emission Factor | Pearson correlation | 0.62 | −0.062 | 1 |
| Sig. (bilateral) | 77 | 0.773 | ||
| N | 0.38 | 24 | 24 | |
| Carbon Footprint | Pearson correlation | 0.52 | 0.340 | 0.916 ** |
| Sig. (bilateral) | 72 | 0.104 | 0.000 | |
| N | 0.96 | 24 | 24 |
Publisher’s Note: MDPI stays neutral with regard to jurisdictional claims in published maps and institutional affiliations. |
© 2022 by the authors. Licensee MDPI, Basel, Switzerland. This article is an open access article distributed under the terms and conditions of the Creative Commons Attribution (CC BY) license (https://creativecommons.org/licenses/by/4.0/).
Share and Cite
Guerrero-Lucendo, A.; García-Orenes, F.; Navarro-Pedreño, J.; Alba-Hidalgo, D. General Mapping of the Environmental Performance in Climate Change Mitigation of Spanish Universities through a Standardized Carbon Footprint Calculation Tool. Int. J. Environ. Res. Public Health 2022, 19, 10964. https://doi.org/10.3390/ijerph191710964
Guerrero-Lucendo A, García-Orenes F, Navarro-Pedreño J, Alba-Hidalgo D. General Mapping of the Environmental Performance in Climate Change Mitigation of Spanish Universities through a Standardized Carbon Footprint Calculation Tool. International Journal of Environmental Research and Public Health. 2022; 19(17):10964. https://doi.org/10.3390/ijerph191710964
Chicago/Turabian StyleGuerrero-Lucendo, Antonio, Fuensanta García-Orenes, Jose Navarro-Pedreño, and David Alba-Hidalgo. 2022. "General Mapping of the Environmental Performance in Climate Change Mitigation of Spanish Universities through a Standardized Carbon Footprint Calculation Tool" International Journal of Environmental Research and Public Health 19, no. 17: 10964. https://doi.org/10.3390/ijerph191710964