Abstract
Pedestrians are vulnerable road users that are directly exposed to road traffic crashes with high odds of resulting in serious injuries and fatalities. Therefore, there is a critical need to identify the risk factors associated with injury severity in pedestrian crashes to promote safe and friendly walking environments for pedestrians. This study investigates the risk factors related to pedestrian, crash, and built environment characteristics that contribute to different injury severity levels in pedestrian crashes in Santiago, Chile from a spatial and statistical perspective. First, a GIS kernel density technique was used to identify spatial clusters with high concentrations of pedestrian crash fatalities and severe injuries. Subsequently, partial proportional odds models were developed using the crash dataset for the whole city and the identified spatial clusters to examine and compare the risk factors that significantly affect pedestrian crash injury severity. The model results reveal higher increases in the fatality probability within the spatial clusters for statistically significant contributing factors related to drunk driving, traffic signage disobedience, and imprudence of the pedestrian. The findings may be utilized in the development and implementation of effective public policies and preventive measures to help improve pedestrian safety in Santiago.
1. Introduction
Walking is a common human activity that provides health and economic benefits, and helps reduce traffic congestion, air pollution, carbon emissions, and energy consumption [1]. Thus, walking contributes to a better quality of life and sustainability. However, pedestrians are vulnerable road users with a high likelihood of being injured or killed when involved in traffic crashes. Pedestrians are directly exposed to the impact of these crashes, and thus, the fatality risk of pedestrians is higher than vehicle occupants [2,3].
According to the World Health Organization (WHO), over 300,000 pedestrian fatalities were reported worldwide in 2018, accounting for 26% of all traffic deaths, while millions of victims are injured in pedestrian crashes every year [4]. In recent years, pedestrian safety has been a relevant research area as increased efforts have focused on promoting active travel such as walking in the population [5]. Chile has the highest walking rate in Latin America with an average of 5204 steps per day, which has helped improve public health campaigns to fight obesity [6]. However, Chile has the highest fatality rate of pedestrians in traffic crashes among other Organization for Economic Co-operation and Development (OECD) country members with 3.6 road deaths per 10,000 motorized vehicles. Pedestrians represent the largest share of casualties with 34% among all road user groups, and approximately 20% of all severely injured victims due to road traffic crashes nationwide [7].
Santiago is the capital and largest city of Chile with over 700 km2 of extension and a population of 7.1 million inhabitants, representing approximately 40% of the total population of Chile [8]. Walking is the major mode of transportation in Santiago [9,10]. Over six million walking trips are generated every day in the city [11]. People walk on average 0.67 km every day to commute to work, and 19% of these inhabitants walk more than 1 km to reach a specific destination [12]. Although sidewalks are abundant, the majority of major road infrastructure favors automobile users, making pedestrian infrastructure in some places inhospitable and disrupted [13]. Thus, pedestrian safety is a critical concern. Nearly 30% of all pedestrian crashes reported nationwide occur in Santiago, yielding more than 40% of all crash fatalities and 27% of all crash severely injured victims that arise in Chile [14]. Therefore, there is an imperative need to investigate the risk factors that contribute to pedestrian crash severity in Santiago for implementing preventive measures that will have the most significant impact on pedestrian safety.
2. Literature Review
Different risk factors (such as demographics, crash, and built environment characteristics) that affect pedestrian crash injury severity and casualty have been identified by several studies [15,16,17,18,19,20,21,22,23,24,25,26,27,28]. From the demographic perspective, males and the elderly are found to be more prone to incur serious injuries and fatalities than other age groups when involved in pedestrian crashes [16,17,29,30]. Other studies have concluded that more severe pedestrian injuries and fatalities are associated with temporal factors, such as time of day, day of the week, and season [15,19,31,32]. For instance, mechanisms that explain increases in crash severity may be the lack of visibility at night-time. Among different contributing factors of pedestrian crashes, the influence of alcohol consumption has shown to increase injury severity in pedestrian crashes [26,33,34]; at-fault drivers cause fatalities and serious injuries when not yielding right-of-way to pedestrians at intersections and crosswalks [35,36]; and the irresponsible or careless behavior of pedestrians have proven to be associated with more serious crash injuries [37,38]. In terms of built environment factors, high rates of pedestrian crash casualties tend to occur in neighborhoods of lower socioeconomic status (SES), meaning that pedestrians that walk in deprived neighborhoods have higher probability of being killed or seriously injured in a crash than in affluent neighborhoods [5,39,40,41,42]. Additionally, the odds of crashes that result in injured or killed pedestrians increase in commercial and residential areas particularly due to large flow of pedestrians and vehicles, and high intersection density [15,43]. In addition, studies suggest that there is a higher risk of crashes with fatal and severe injury outcomes in areas with higher population density, in which pedestrians are more exposed to crashes [5,16]. Public transportation accessibility has been associated with pedestrian crash injury severity, suggesting the need of safety zones near bus stops and subway stations to protect pedestrians [15,23,44,45]. Finally, studies have concluded that pedestrians suffer more severe injuries at road intersections due complex traffic operations inherent to such intersections [3,21,36,46,47].
Econometric methods have been widely employed to analyze the effect of risk factors on injury severity and fatalities in pedestrian crashes, such as multinomial logit models [26,48,49], mixed logit models [19,44,50], and ordered logit or probit models [16,47,51]. However, multinomial logit models and mixed logit models assume that all injury severity levels are non-ordered without considering the inherent hierarchical nature of crash injury severities [19], whereas the ordered logit or probit models are ordered-response models that account for the inherent ordered nature of the dependent variable (i.e., levels of injury severity). In addition, multinomial logit models are less parsimonious and more difficult to interpret than the ordered response models [52]. Ordered logit or probit models follow the parallel-lines assumption, in which parameter estimates are equal and constant across different levels of the dependent variable. This is usually not the case with crash injury severity outcomes since explanatory variables may have the same or dissimilar effects on different injury severity levels [30]. The partial proportional odds (PPO) model relaxes the parallel-lines assumption, allowing certain variables to violate the parallel-lines assumption while other variables are constrained to this assumption [52], and thus, the model results are more correct and complete than ordered logit or probit models.
Studies have developed PPO models to study risk factors affecting crash injury severity concerning at-fault drivers and not at-fault drivers [53], heavy trucks [27,54,55], bicycles [56], work zones [57], rural highways [58], and wrong-way driving [59], among others. PPO models have also proven to outperform other statistical models when examining the effect of risk factors of pedestrian injuries and fatalities in traffic crashes [18,24,25,60]. Thus, the PPO model is used in this study to explore the main risk factors that significantly affect severity injury of pedestrian crashes, as in studies by Lin and Fan [17], Pour et al. [32], and Lu et al. [46].
In traffic crash analysis, kernel density estimation (KDE) is a commonly used spatial analytical tool to identify hazardous road locations. KDE adds a significant value to the statistical methods by revealing high-risk areas for pedestrians, in which there is an increased likelihood of crashes based on spatial dependency [31,61,62], and where authorities need to focus on specific countermeasures [43,63]. Thus, studies have combined KDE and statistical methods for analyzing injury severity in clusters with high density of pedestrian crashes, which are summarized in Table 1 [15,22,43,62,63,64,65].

Table 1.
Description of pedestrian crash studies using KDE and statistical methods.
To the best of our knowledge, this is the first study that contributes to the literature by investigating the risk factors associated with pedestrian crash injury severity in Chile from a spatial and statistical perspective. First, a KDE method is employed in a GIS environment to identify spatial clusters with high likelihood of pedestrian crashes that resulted in serious injuries and fatalities. Subsequently, the PPO models are developed to understand different risk factors related to the pedestrian, crash, and built environment characteristics that significantly affect injury severity levels of pedestrian crashes within the identified spatial clusters, which are then compared with the PPO model results for the whole pedestrian crash dataset in Santiago. Therefore, this study contributes to better inform current debates regarding appropriate countermeasures to enhance pedestrian safety.
3. Data
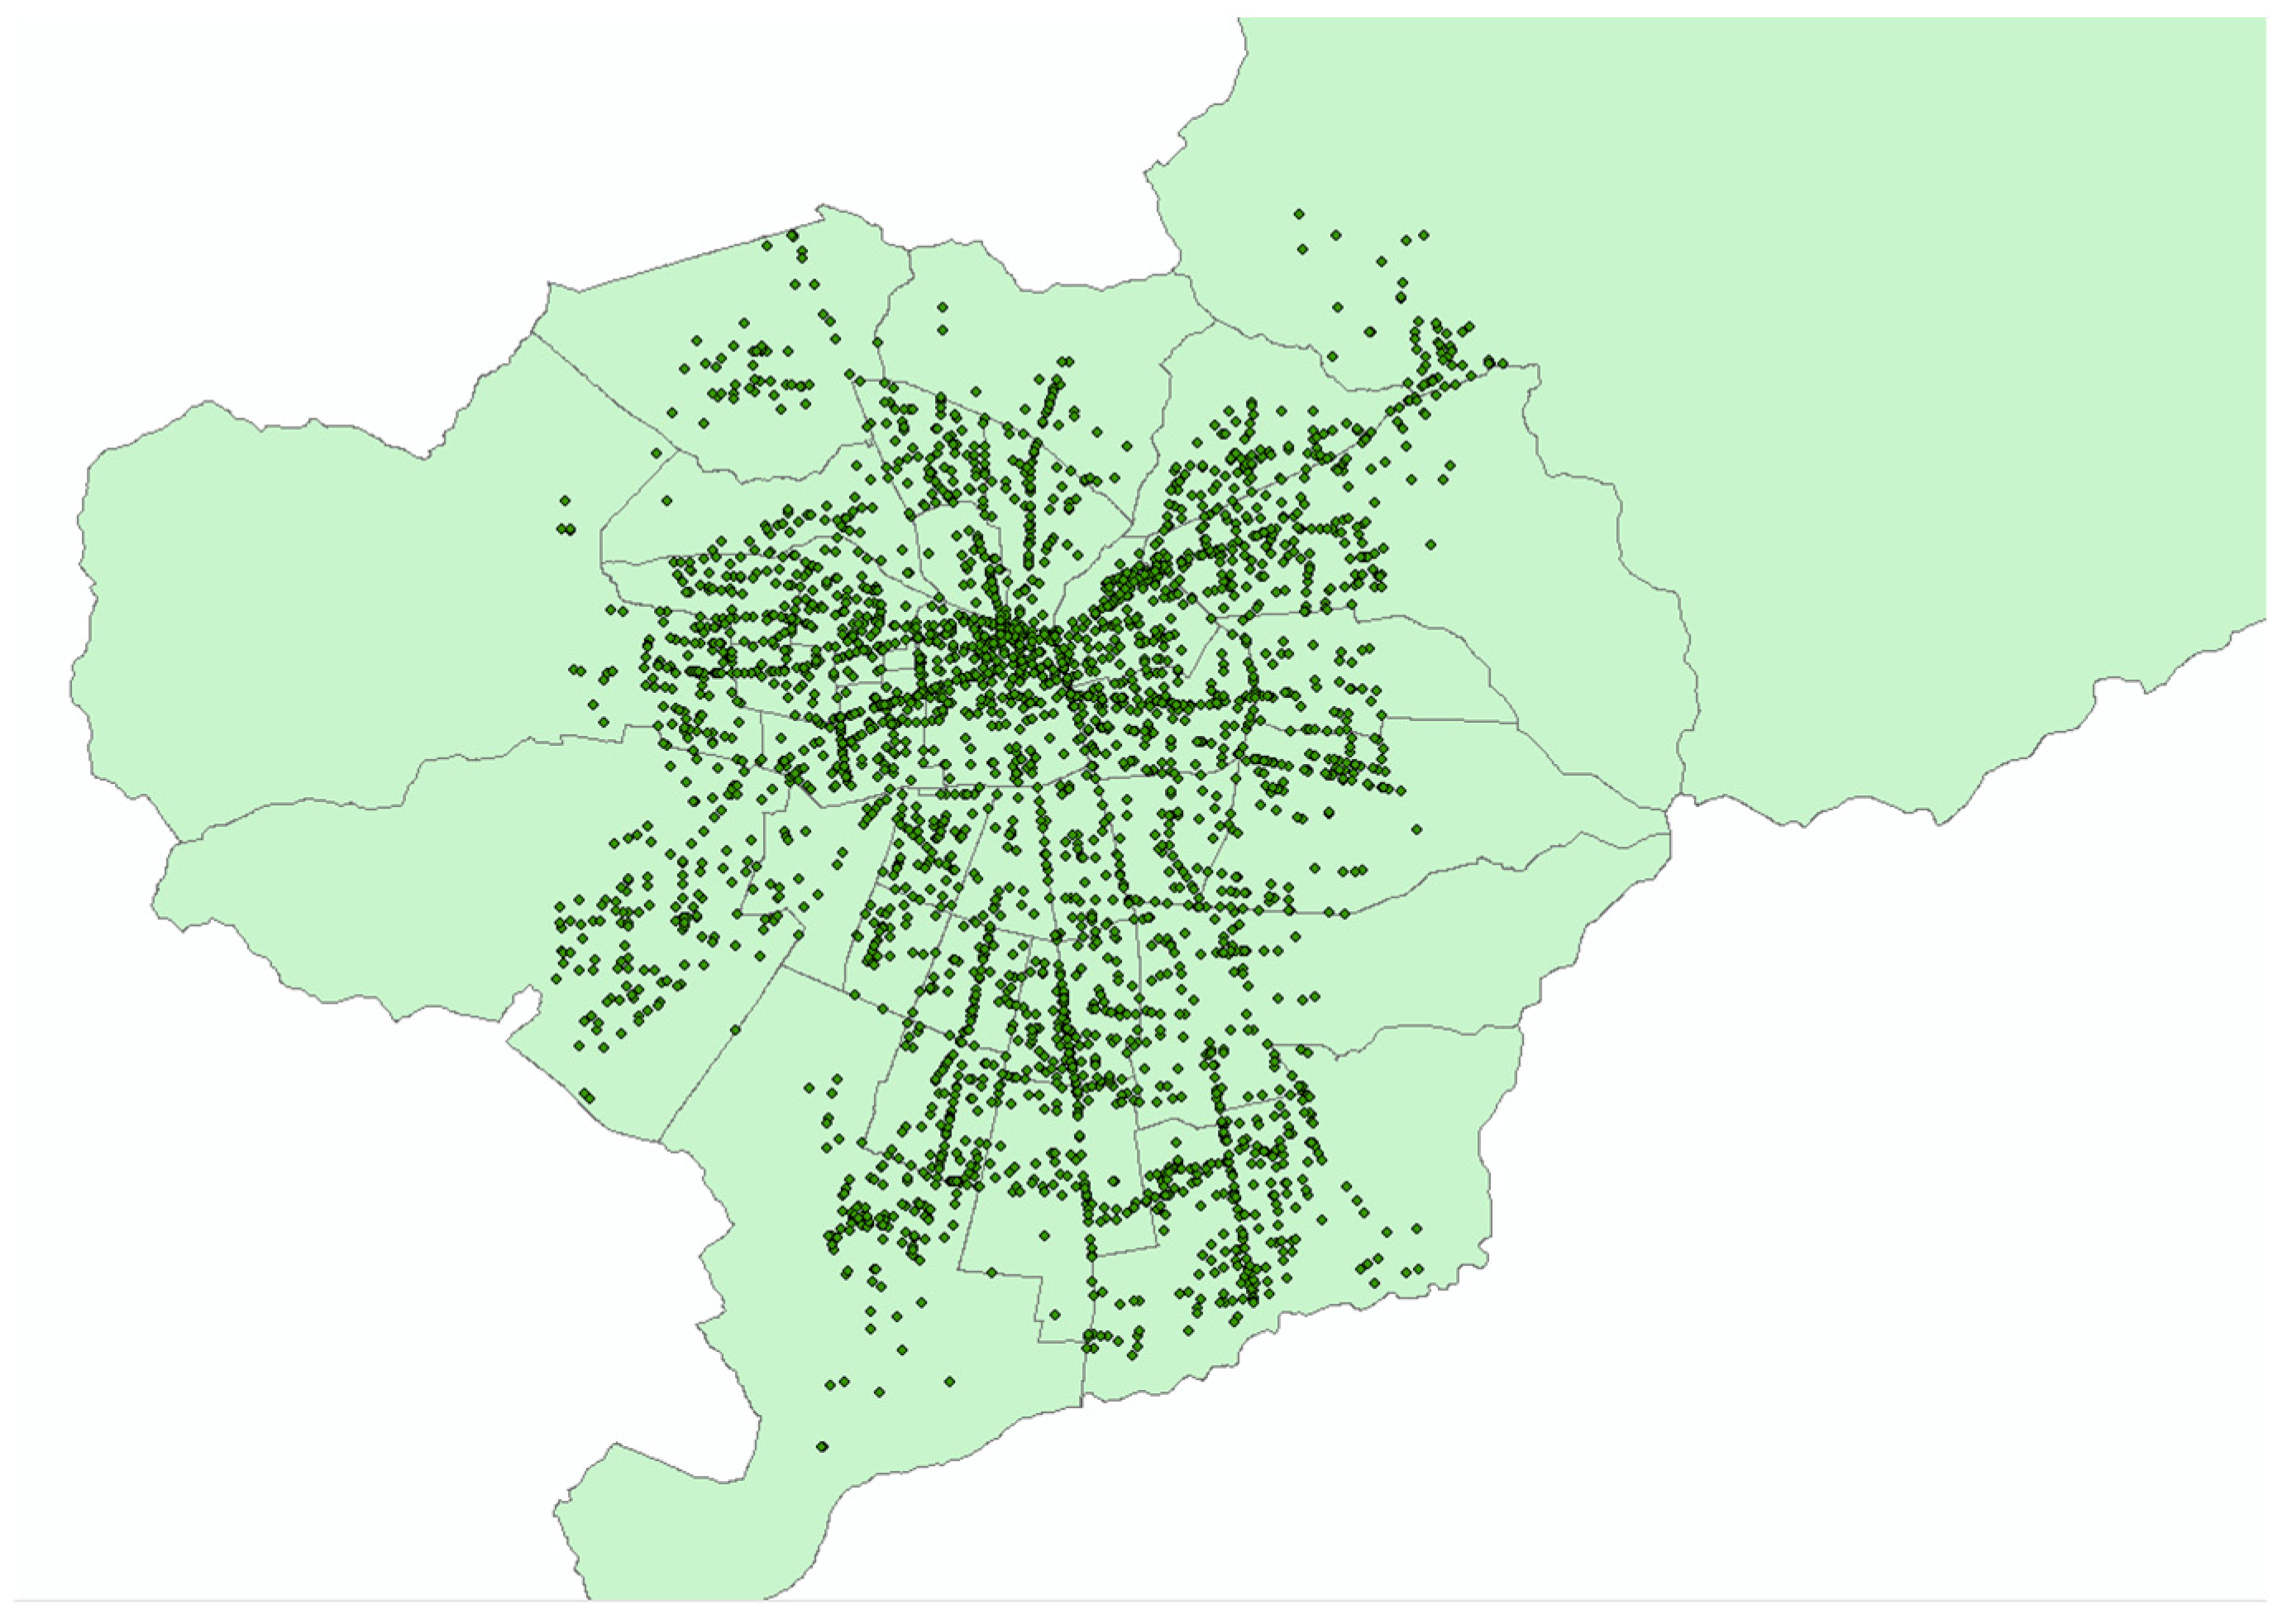
During the 2012–2016 period, the Chilean police reported 4874 pedestrian crashes with different injury severity levels that occurred in Santiago, of which 4216 (86.5%) were successfully geocoded [14], as shown in Figure 1. The remaining crash locations were not geocoded because the addresses or intersections were incomplete, incorrect, or non-existent. The pedestrian crash database that includes demographics and crash characteristics was requested from the Chilean National Road Safety Commission (CONASET) through the Transparency Law [66]. The built environment characteristics, such as socioeconomic status, land use, and access to public transportation, are other risk factors considered in the injury severity analysis that were provided by private and public entities (e.g., National Statistics Institute, Spatial Data Infrastructure-City Observatory, and Center for Sustainable Urban Development). Among the built environment characteristics considered in this study, a risk factor related to the amount of exposed population to pedestrian crashes was computed using the number of residents that reside in the vicinity of pedestrian crashes using the 2017 Census [8], which is a surrogate factor to the pedestrian volume counts near these crashes that actually account for the quantity of walking people. Based on the provided crash data, a three-point ordinal scale from lowest to highest was used to define injury severity level (1 = less serious injury, 2 = serious injury, 3 = fatal injury, denoting B, A, K, respectively, in the KABCO scale established by the United States Federal Highway Administration). Crashes with at least one injured pedestrian or one pedestrian that died within 24 h of the crash were considered in the analyses.
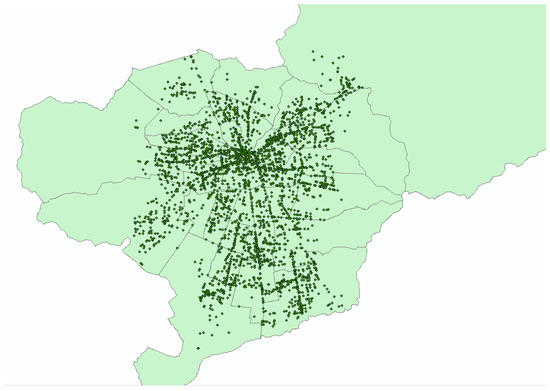
Figure 1.
Pedestrian crashes with injury severity in Santiago during the 2012–2016 period, Source: Prepared by the authors.
Table 2 shows the descriptive statistics with the frequency and percentages of pedestrian crashes for each analyzed risk factor and the percentages for the three injury severity levels examined in this study. This table indicates that pedestrian crash occurrence yielded less seriously injured pedestrians (22.2%), seriously injured pedestrians (64.8%), and fatal severities (13.0%). Approximately 50% of all persons involved in pedestrian crashes are adults (25–65 years old) and the proportion of males involved in pedestrian crashes is higher than females (57% males vs. 43% females). For the relative location factor, pedestrian crashes that occurred along straight road sections represent the highest share with 42.1%, followed by intersections with functioning traffic lights with 33.7%.
Table 2.
Descriptive statistics of variables and their pedestrian crash severity outcomes for the whole dataset.
The most critical time is during night-time due to the higher number of pedestrian crashes and higher proportion of fatal crashes compared to other times of the day. Higher proportions of less seriously and seriously injured victims are perceived during holidays, while a higher share of fatal pedestrian crashes occur during weekends. A larger number of pedestrian crashes arose in the winter season with a higher share of less seriously injured victims. The imprudence of the pedestrian (e.g., pedestrian crosses road surprisingly or carelessly, jaywalking) and the imprudence of the driver (e.g., not yielding right of way to pedestrians, improper turns) account for 30.4% and 34.1%, respectively, of all contributing factors, while disobeying traffic signals has the highest share of fatal injury with 26.9%, followed by driving and pedestrians being under the influence of alcohol with 24.3% and 23.2%, respectively.
Regarding built environment factors, approximately 64.7% of the pedestrian crashes occur in medium and medium-low SES zones of the city, but a higher proportion of fatal crashes is observed in low SES neighborhoods (20.0%). In addition, pedestrian crashes have a tendency of occurring in commercial (33.9%) and residential areas (32.8%), resulting in similar distributions of injury severity across different land uses. Although most pedestrian crashes occur where the exposed population is low (<500 inhabitants), similar proportions are observed in the pedestrian crash injuries among locations with different levels of population exposure. Approximately 83% and 51.2% of the pedestrian crashes occur in the vicinity of bus stops and intersections, respectively, while more than half of the crashes occurred away from subway stations and traffic lights.
4. Methods
As aforementioned, in this study, the spatial phenomenon is incorporated in the statistical analysis through the use of KDE to investigate the influence of risk factors associated with injury severity in pedestrian crashes in critical areas (dangerous locations) of Santiago. Subsequently, these results are compared with significant factors identified for pedestrian crashes that occurred in the whole city.
4.1. Kernel Density Estimation (KDE)
KDE is used in this study to identify risk areas with high density of pedestrian crashes in Santiago. KDE is a non-parametric method that first yields a symmetrical surface over each point feature, secondly assesses the distance from the point to a reference location based on a mathematical function, and finally adds the value for all the surfaces for that reference location [67]. In this study, Equation (1) is used to compute the estimated density value of pedestrian crashes at location (x,y) by providing a magnitude per unit of area (e.g., the number of pedestrian crashes per km2).
where n is the total number of locations, h is the bandwidth or smoothing parameter, K is the kernel function, and di is the distance between location (x,y) and location of observation i. Given that near points to the reference points have more weight than distant points, this study employed a normal distribution as a kernel function. Additionally, after conducting preliminary tests, as in Ouni and Belloumi [22] and Blazquez and Celis [31], a bandwidth of 1500 m and a 100-m cell size were employed in the KDE analysis. As a result of this analysis, clusters with high concentrations of pedestrian crash injury severities and fatalities were obtained for the studied period.
4.2. Partial Proportional Odds Model (PPO)
As aforementioned, the PPO model is used for analyzing different pedestrian crash injury severity levels since this model is an effective alternative model for ordinal response data and has the ability to correct for the violated parallel-lines assumption [25,27,55,58]. The PPO model may be specified in terms of the probability of an injury severity level j for a pedestrian crash i expressed by Equation (2) [68,69].
where Yi is the crash injury severity for crash i, X1i is a vector with the explanatory variables that comply with the parallel-lines assumption, X2i is a vector with the explanatory variables that violate the parallel-lines assumption, β1 and β2 are vectors of estimated coefficients for X1i and X2i, respectively, αi is the cut-off threshold of the jth cumulative logit, and M is the number of injury severity levels (in this study, M = 3).
Direct pseudo-elasticities are employed to explain the marginal effect of the explanatory variables on the probability of a pedestrian crash severity level j for crash i. In this study, the explanatory variables are all binaries, and, thus, the elasticity may not be calculated since it is not differentiable. Instead, pseudo-elasticities are computed as the marginal percentage change of the pedestrian crash injury probability when a binary explanatory variable switches from 0 to 1, or from 1 to 0 using Equation (3) [27,70].
where P(Yi > j) is computed with Equation (2) and Xjik is the kth binary explanatory variable associated with the injury severity level j for pedestrian crash i. Note that the direct pseudo-elasticity is computed for each injury severity level j of crash i. Therefore, average direct pseudo-elasticities are obtained for each injury severity level j given known elasticities for all crashes [47]. All statistical analyses were performed with a user-written program in STATA 16 [69].
5. Results
5.1. KDE Analysis Results
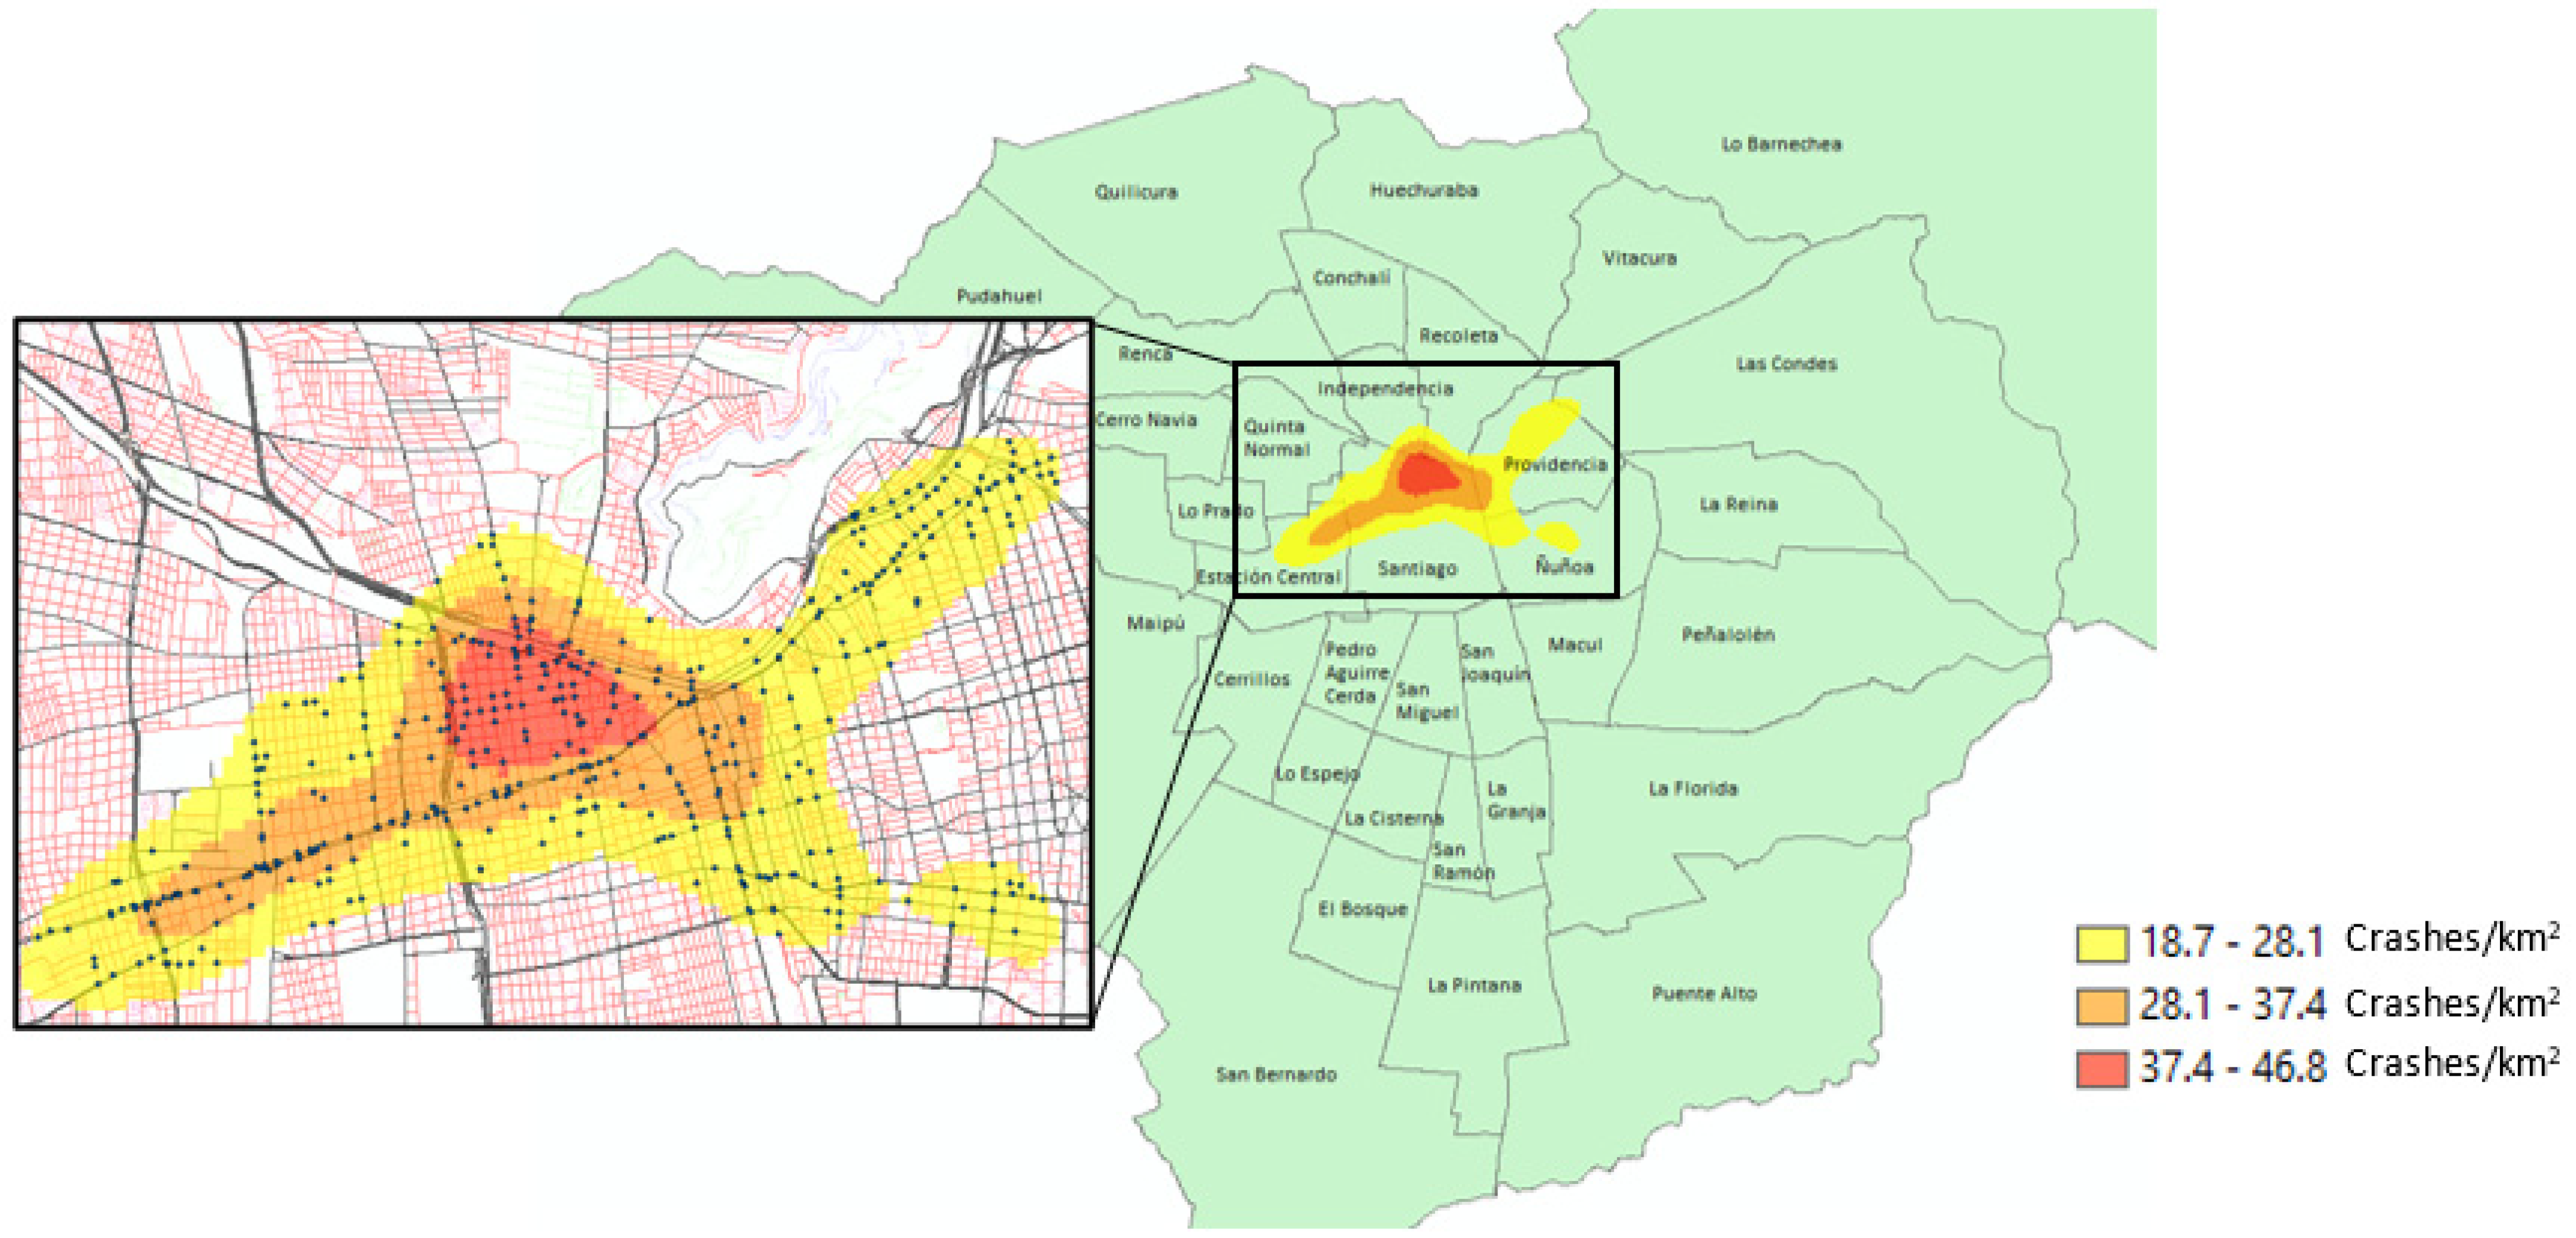
Figure 2 shows that a single critical zone with high-risk of crash fatality/severe injury was identified using the KDE analysis. This zone with 659 pedestrian crashes (15.6% of the whole dataset) that is located in the heart of the city mainly includes the municipality of Santiago and some areas of the neighboring municipalities of Estación Central, Independencia, Las Condes, Providencia, Ñuñoa, and Recoleta. Table 3 shows the distribution of pedestrian crashes across different injury severity levels for each municipality within the identified spatial clusters. The municipality of Santiago presents the highest number of pedestrian crashes among all municipalities with 322 crashes (36.7%) during the studied period, followed by Providencia (19.3%) and Estación Central (11.1%). The highest shares of fatal crashes are observed in Estación Central (24.7%) and Independencia (22.2%), while the highest proportions of serious injuries are concentrated in Ñuñoa (81.1%) and Santiago (75.8%).

Figure 2.
Critical zone with high density of pedestrian crashes during the 2012–2016 period.
Table 3.
Pedestrian crashes and injury severity per municipality within the identified critical zone.
The descriptive statistics of the analyzed variables and their pedestrian crash severity outcomes for the identified critical zone are presented in Table 4. In this critical zone, the proportion of serious injuries is higher than for the whole dataset (70.7%), while it is lower for less serious and fatal severities (19.3% and 10%, respectively). The pedestrian crashes in the critical zone are characterized by a higher proportion of male (59.2%) and adult (56.6%) victims than the whole dataset. Regarding the built environment characteristics, a lower proportion of crashes along straight road sections (37.3%) and higher share of crashes at intersections with functioning traffic lights (48.6%) are observed within the critical zone than the whole dataset in Santiago. The distribution of pedestrian crashes among different times of the day, days of the week, and seasons of the year is similar to the statistics for the whole dataset. Most pedestrian crashes in the critical zone are caused by the imprudence of the pedestrian (35.1%), followed by the imprudence of the driver (22.2%) and undetermined causes (15.6%). Regarding the SES, the larger proportions of pedestrian crashes tend to occur in medium and medium-high SES (36.7% and 42%, respectively) within the critical zone, compared to the whole dataset where they are found mostly in medium-low and medium SES areas (33% and 31.7%, respectively). While most pedestrian crashes tend to arise in commercial and residential areas of Santiago, the proportions of these crashes in the critical zone are similar among areas with commerce, residence, and office space. In both the whole dataset and the critical zone, the highest share of pedestrian crashes is apparent in areas with low population exposure (41.9% and 36.5%, respectively). While pedestrian crashes in the city of Santiago tend to occur away from subway stations, approximately 96% of the pedestrian crashes in the critical zone occurred within short and medium distances from subway stations. Finally, most crashes in both the whole dataset and the identified critical zone tend to arise more than 25 m away from traffic lights, and short distances from bus stops and intersections.
Table 4.
Descriptive statistics of variables and their pedestrian crash severity outcomes for the identified critical zone.
5.2. Modeling Results
In this study, the explanatory variables were progressively incorporated following an iterative process until the best model was obtained, as the violation of the parallel-lines assumption was tested using Wald chi-square. The following sub-sections present the model results for the pedestrian crashes in the entire city (whole dataset) and within the identified critical zone, and the comparison between the modeling results. Note that we explored the explanatory variables in the model that may be a source of unobserved heterogeneity (i.e., some factors that affect injury severity in pedestrian crashes remain unknown), which may result in bias and inconsistent coefficient estimates. This unobserved heterogeneity is taken into account in random effects models. The relative variability that is explained by the random effects in the model was evaluated with the intra-class correlation coefficient (ICC) for the whole dataset and within the identified critical zone [19,45,59].
5.2.1. Whole Dataset
Table 5 presents the statistically significant parameter estimates for the best model when considering the dataset as a whole. Results show that the ICC values are less than 1% for this model, which suggests that random effects are not significant in the model. The estimates of the PPO model thresholds between the injury severity levels are shown in this table along with those variables that are found to violate the parallel-lines assumption. Since the direction of the effect of the explanatory variables is not always determined by the sign of the coefficients, the average direct pseudo-elasticities for the statistically significant explanatory variables of the PPO model are used to better interpret the results, as shown in Table 6. Note that the summation of the average direct pseudo-elasticities across all severity levels is equal to zero since any increase in the probability of a severity level must be balanced by a decrease in another severity level [27,70,71].
Table 5.
Results of the PPO model using the whole dataset.
Table 6.
Average pseudo-elasticities for the PPO model using the whole dataset.
Regarding the demographic characteristics, a significant difference exists between the elderly over 65 years old and children less than 18 years old. The probability of being killed in a pedestrian crash for the elderly increases by 7.13% when contrasted with children less than 18 years old. Compared to female pedestrians, the probabilities of male pedestrians incurring serious injuries or death are increased by 1.93% and 1.73%, respectively, while the probability of less serious injuries decreases by 3.66%. With respect to the relative location of pedestrian crashes, there is only a significant difference between pedestrian crashes at intersections with functioning traffic lights and straight road segments. Pedestrian crashes at intersections with functioning traffic lights could increase the probability of serious injuries and fatalities by 2.05% and 2.16%, respectively, compared to pedestrian crashes that occur along straight road sections.
Model findings reveal that time is significantly associated with injury severities. Pedestrian crashes in the morning, afternoon, and night have comparable increases in less serious injury outcome probabilities with 4.79%, 4.90%, and 4.64%, respectively, while pedestrian crashes during these same time periods seem to be more likely to reduce serious injuries compared to the early morning. The day of the week was found as another significant parameter affecting injury severity of pedestrians. The probability of occurrence of serious and fatal severity increases by 1.35% and 1.42%, respectively, and the probability of less serious injuries decreases by 2.78% during the weekend, compared to a weekday. The model results did not find any significant difference in the probabilities of the three injury levels when discerning between weekdays and holidays, and also among the different seasons of the year.
Among all the significant variables of the model, the contributing factors of pedestrian crashes present the highest increases in the probability of fatality risk. Disobeying traffic signage, driving under the influence of alcohol, pedestrians being under the influence of alcohol, and imprudence of the pedestrian increase the probability of fatal outcome by 17.22%, 12.54%, 10.85%, and 7.78%, respectively, when compared to the imprudence of the driver, while undetermined causes and other causes are linked to decreases in fatality probabilities (−9.55% and −5.88%, respectively). No significant differences were observed between the pedestrian being under the influence of alcohol, speeding, and loss of control of the vehicle, and the base variable for the contributing factor imprudence of the driver.
Regarding the effect of built environment factors, the model results revealed that there is no significant difference between medium-low SES and low SES. However, pedestrian crashes that occur in medium and medium-high SES are associated with decreases in serious injury probabilities (−4.95% and −5.65%, respectively) and comparable decreases in fatality probabilities (−3.72% and −3.59%, respectively). Finally, the probability of occurrence of fatalities increases by 2.17% and 5.48% for medium and long distances from intersections, respectively, when compared to pedestrian crashes that occur near to intersections. Note that the findings did not uncover any significant differences in the injury or fatality probabilities between different distances from bus stops, subway stations, and traffic lights to pedestrian crash locations. In addition, all types of land use and different population exposure levels did not have significantly different effects.
5.2.2. Pedestrian Crashes within the Identified Critical Zone
Results for the analysis of the risk factors that affect crash injury severity in the identified critical zone using the PPO model are shown in Table 7. Note that the best model found has statistically significant parameter estimates only for certain variables related to crash and built environment characteristics, and null associations are observed with the remaining variables. The ICC value is less than 1% for this PPO model, indicating that random effects are not significant. Table 8 presents the average pseudo-elasticities for the three injury severity levels within the high-risk area with pedestrian crash injury severity. When compared to the imprudence of the driver, this table indicates that drunk driving is a relevant contributing factor among the crash characteristics since it is associated with a major increase in the fatality probability (70.75%), followed by signage disobedience (19.52%), and imprudence of the pedestrian (17.88%). The model results also provided evidence of the effect of built characteristics. Pedestrian crashes that occurred at a distance from traffic lights present an increase in the serious injury probability (4.35%) and a non-significant increase in the fatality probability (2.56%), compared to crashes at a short distance from traffic lights. Finally, a decrease is perceived in the fatality probability (−2.39%) for pedestrian crashes that occur within medium distances from intersections, when compared to short distances from intersections.
Table 7.
Results of the PPO model using the pedestrian crashes in the identified critical zone.
Table 8.
Average pseudo-elasticities for the PPO model using pedestrian crashes in the identified critical zone.
5.2.3. Comparison of the Modeling Results
When comparing the modeling results for the whole dataset and the identified critical zone, differences and similarities are observed between the explanatory variables in the models. This finding confirms the need to conduct a spatial analysis with the KDE method to determine the variables that may have a significant impact on pedestrian injury severity within high-risk areas.
Higher increases in the fatality probability are perceived within the critical zone for statistically significant contributing factors, suggesting that pedestrians are at a higher risk of being killed in this zone than in other areas of the city due to drunk driving, signage disobedience, and imprudence of the pedestrian. When compared to the imprudence of the driver, speeding is a contributing factor that substantially reduces the probability in serious injury outcomes in the identified critical zone (−74.19%) but has a non-significant effect for the dataset as a whole. For the built environment factors, there is a statistically significant rise in serious injuries for pedestrian crashes at a long distance from traffic lights within the critical zone and a non-significant variation in this probability for the whole dataset. Lastly, intersections are built environment characteristics that became relevant in both model results, but with contrary effects. Pedestrian crashes that occur within the spatial cluster decrease the probability of fatal severity by 2.39% for medium distances from intersections, while this probability increases by 2.17% when considering the whole dataset.
6. Discussion
6.1. Demographics
The model results for the whole dataset reveal that pedestrians over the age of 65 years old have a higher risk of being involved in a crash than child pedestrians, similar to the recent work conducted in Chile by Bravo Rojas et al. [72]. These results also concur with several studies that have reported the effect of older pedestrians on suffering more severe injuries or death than other age groups [15,16,23,30,32,54]. Elderly individuals have restricted cognitive abilities, less mobility, and lower walking speed than pedestrians from other age groups, which increases the chances of being involved in a crash resulting in some type of injury. Different studies have concluded that most fatal pedestrian victims are predominantly males [34,43,50,54]. Male pedestrians take more risks and are less cautious than female pedestrians, and, thus, they are more likely to be involved in a crash.
6.2. Crash Characteristics
With respect to the relative location of crashes, the model results suggest that intersections with functioning traffic lights increase the chances of being killed and seriously injured, which conforms to the large number of pedestrian crashes that occurred during the studied period at signalized intersections in Santiago. In terms of the time of day, the findings concur with the studies by Kim et al. [16] and Chen and Fan [49], indicating that pedestrian crashes in the afternoon tend to decrease the chances of fatal outcomes since there are still some daylight conditions and more traffic congestion with overall low vehicle speeds, whereas pedestrian crashes at night tend to increase fatality probability, as found in various previous studies by Martínez-Ruiz et al. [20], Song et al. [44], and Chen and Fan [49], denoting a dangerous time period for pedestrians due to poor visibility or fatigue. The model results for the whole dataset indicate that pedestrian crashes during the weekend increase the likelihood of serious injuries and fatal crashes, similar to the results of Chen and Fan [49]. The traffic volume is reduced during weekends, and as a result, vehicles travel at higher speeds increasing the odds of fatal pedestrian crashes.
Overall, this study suggests multiple contributing factors for pedestrian safety improvements. Among all significant contributing factors, signage disobedience leads to the highest rise in fatality probability of pedestrian crashes in Santiago. This risky illegal behavior is immersed in the Chilean culture that has been adopted by the population over the years from a young age, perhaps due the lack of enforcement of traffic regulations that creates a general perception that the traffic regulations do not apply to pedestrians [73]. In accordance with Li and Fan [17] and Downey et al. [36], our results reveal that the imprudence of the pedestrian presents important increments of fatal risk. Crossing the road without adequate attention to traffic conditions or standing or walking on the roadway instead of sidewalks are common and recurrent behaviors among Chilean pedestrians [74]. Thus, protective measures should consider reduction of vehicle speed limits, traffic calming, and local area traffic management especially in zones with large flow of pedestrians [75]. Consistent with studies by Kim et al. [16] and Li and Fan [19], our results also reveal that driving under the influence of alcohol presents a significant increase in the probability of being killed in a pedestrian crash when analyzing such crashes using the whole dataset. Additionally, studies have found that pedestrians being under the influence of alcohol is a crucial concern [26,33,34]. The work by Sun et al. [26] found that pedestrians with alcohol involvement are 180% more likely to be killed or severely injured. In this study, crashes that involve pedestrians under the influence of the alcohol represent only 3% of all pedestrian crashes, however there is a significant increase in the probability of crash fatal severity for this contributing cause when focusing on the whole dataset. This result is particularly interesting since previous studies have identified that legislation enacted in Chile during the analyzed period for increasing penalties for drivers under the influence of alcohol and decreasing the maximum blood alcohol limit from 0.05 to 0.03 g/dL was associated with considerable reduction in alcohol-related traffic fatalities and injuries [76,77]. However, these studies only focus on overall traffic crashes rather than on pedestrian crashes, which suggests that these laws may have been particularly relevant in targeting a specific group of drivers rather than protecting pedestrians.
6.3. Built Environment Characteristics
The city of Santiago has undergone major investments in road infrastructure during the last decades including improvements in traffic signage, roundabouts, pedestrian crossings, and exclusive corridors for public transportation [10]. Apparently, these improvements offer safer mobility and visibility of vulnerable road users, such as pedestrians, in more advantaged neighborhoods than in deprived neighborhoods [41]. These results assist road safety professionals in implementing adequate safety measures and improving pedestrian infrastructure in low SES zones of the city to reduce pedestrian crashes.
Distances between pedestrian crash locations and intersections greater than 10 m tend to increase the odds of fatality outcomes, meaning that risk propensity for fatal injuries is increased away from intersections, coinciding with the works by Mukherjee and Mitra [5] and Pour et al. [32]. Pedestrians may start jaywalking as they get closer to intersections, and, thus, the introduction of pedestrian crossings at mid-blocks may help improve pedestrian safety.
6.4. Model Comparison
The KDE analysis results indicate that a single critical zone with high concentrations of pedestrian crashes was identified comprising 7 out of 34 municipalities of the city. This critical zone is situated the heart of the city, particularly in the municipality of Santiago, in which the abundance of economic, cultural, and political activities attracts a daily floating population of one third of the total population of Santiago [78]. Consequently, pedestrians are more prone to be exposed to injury severity crashes in this municipality. In addition, a high density of pedestrian crash fatalities is observed in the municipalities of Estación Central and Providencia, which have experienced a rapid redevelopment of high-rise properties and an attraction of a large number of pedestrians to various shopping malls and other commercial spaces.
The model results show that common risk factors are statistically significant in pedestrian crash models for both the whole crash dataset in the city and within the identified critical zone. The contributing factors related to the imprudence of the pedestrian, driving under the influence of alcohol, and signage disobedience present considerably higher probabilities of pedestrian crash fatalities in the critical zone than in the entire city. The high concentration of alcohol outlets in the critical area may contribute to the pedestrian crash occurrence while the driver is under the influence of alcohol [14], and the high pedestrian volume in this critical area may produce more jaywalking, careless actions of pedestrians, and violation of traffic signage than in the rest of the city.
When focusing on the whole dataset, the probability of fatal pedestrian crashes increases for medium and long distances from intersections whereas there is a reduction in the probability of suffering severe injuries for medium distances from intersections in critical zones with high density of crash injury severity clusters. These contrasting results between the two models should be further investigated since the crash database has no specific information on the presence/absence of traffic lights, pedestrian crossings, or other signage at these intersections.
7. Conclusions
This research aimed to investigate the risk factors that significantly impact pedestrian crash injury severity by performing spatial and statistical analyses. Based on pedestrian crash data collected between 2012 and 2016 in Santiago, Chile, a KDE analysis was first performed to identify spatial clusters with high density of pedestrian crashes, and, subsequently, PPO models were built to understand different risk factors related to the pedestrian, crash, and built environment characteristics that significantly affect injury severity levels of pedestrian crashes within the identified spatial cluster and also for the whole city. Results for the whole dataset confirm previous identified risk factors that play relevant roles in increasing the probability of serious injury and fatality outcomes in pedestrian crashes. For example, the following significantly increase the odds of resulting in a fatal crash: being male and older, being the morning, night, or a weekend, being at a distance from intersections with functioning traffic lights, the presence of alcohol in the driver or the pedestrian, imprudence of the pedestrian, and signage disobedience. Safe mobility for the elderly should be ensured by providing traffic regulations related to pedestrians’ right-of-way and crossing times [41]. Additionally, education programs targeted particularly at men are necessary to help their awareness on safe road crossing practices. With respect to crashes during the night, pedestrians need crossing signs equipped with flashing lights to alert drivers of the presence of pedestrians.
Common risk factors for the whole dataset and the identified critical area were identified to increase the probability of pedestrian crash injury severity. However, significantly higher increases are perceived in the probability of fatality risk for certain contributing factors in pedestrian crashes that occur within the critical zone. This result proves the need to perform a spatial clustering analysis with the KDE technique to identify those risk factors that require effective pedestrian safety improvements and interventions to increase pedestrian safety in high-risk zones.
In light of our results, we provide the following set of countermeasures as practical recommendations that may be introduced in Santiago for improving pedestrian safety: improving traffic regulations to secure right-of-way of pedestrians; introducing devices that favor the significant increasing of crossing times; crossing signs equipped with flashing lights at night to alert drivers to the presence of pedestrians; implementing speed cameras in critical zones; and designing and implementing road safety education programs to teach both new drivers and pedestrians to respect traffic regulations. In this study, the low ICC values obtained for each model reveal the insignificance of the random effects in the models. Therefore, the studied variables were not found to have random effects on the probability of pedestrian crash injury severities. However, future research should compare our results with other approaches such as the mixed effect PPO model to better explore the unobserved heterogeneity in the crash data. Further research should also consider other risk factors such as weather, road characteristics, and vehicle conditions that may have significant impacts on pedestrian crash injury severity, similar to the works by Munira et al. [21], Pour-Rouholamin and Zhou [24], and Park and Bae [79]. The model may improve the explanation of the data if other additional explanatory variables or proxy variables are available. As aforementioned, this study has the limitation of using surrogate data for population exposure since actual pedestrian counts are not available. In future research, data collection methods should be studied to obtain pedestrian counts throughout the city to be employed as a risk factor in pedestrian crash injury severity modeling. The analysis of pedestrian crashes using actual pedestrian volume counts would provide more accurate modeling results.
This study has the limitation of using pedestrian crash data between 2012 and 2016 due to main three reasons. First, recent crash data were not included in the study since we considered that the social riots that took place in Chile in 2019 and the pandemic that started in March 2020 may have influenced our results, given this atypical situation. Second, the pedestrian crash data were available for this period when this study was started. Third, Iglesias et al. [10] indicated that during the 2010–2016 period a total of USD 3.8 million was invested in transportation infrastructure projects in Santiago. In addition, Martínez et al. [41] studied the improvements in Santiago that offer safer mobility and visibility of pedestrians over a 12-year period (2002–2013). Thus, this study analyzes a five-year period of pedestrian crashes when these improvements were being carried out. We assume that such crashes reflect the situation with safety improvements. Future research will also determine whether certain risk factors that affect pedestrian crashes persist through time by analyzing the models per year, and, thus, adequate countermeasures may be implemented to directly target those factors.
Author Contributions
Conceptualization, A.R., J.F.C. and C.A.B.; methodology, A.R. and C.A.B.; software, A.R. and N.H.; investigation, A.R., J.F.C., C.A.B. and K.S.-B.; data curation, A.R.; writing—original draft preparation, C.A.B.; writing—review and editing, J.F.C., C.A.B., K.S.-B. and J.I.N.-M.; funding acquisition, J.F.C. All authors have read and agreed to the published version of the manuscript.
Funding
This research was funded by Universidad Andres Bello, grant number DI-01-20/REG, and the APC was funded by the Faculty of Engineering at Universidad Andres Bello and FONDECYT, grant number 11220485.
Institutional Review Board Statement
Not applicable.
Informed Consent Statement
Not applicable.
Data Availability Statement
The data employed in this study were downloaded from CONASET’s website (https://mapas-conaset.opendata.arcgis.com/ (accessed on 17 April 2018)).
Conflicts of Interest
The authors declare no conflict of interest.
References
- Lin, M.I.B.; Huang, Y.P. The impact of walking while using a smartphone on pedestrians’ awareness of roadside events. Accid. Anal. Prev. 2017, 101, 87–96. [Google Scholar] [CrossRef]
- Congiu, T.; Sotgiu, G.; Castiglia, P.; Azara, A.; Piana, A.; Saderi, L.; Dettori, M. Built Environment Features and Pedestrian Accidents: An Italian Retrospective Study. Sustainability 2019, 11, 1064. [Google Scholar] [CrossRef]
- Wang, K.; Li, G.; Chen, J.; Long, Y.; Chen, T.; Chen, L.; Xia, Q. The adaptability and challenges of autonomous vehicles to pedestrians in urban China. Accid. Anal. Prev. 2020, 145, 105692. [Google Scholar] [CrossRef]
- World Health Organization, WHO. Global Status Report on Road Safety 2018: Summary. 2018. Available online: https://apps.who.int/iris/bitstream/handle/10665/277370/WHO-NMH-NVI-18.20-eng.pdf (accessed on 8 June 2019).
- Mukherjee, D.; Mitra, S. Impact of road infrastructure land use and traffic operational characteristics on pedestrian fatality risk: A case study of Kolkata, India. Transp. Dev. Econ. 2019, 5, 6. [Google Scholar] [CrossRef]
- Althoff, T.; Sosič, R.; Hicks, J.L.; King, A.C.; Delp, S.L.; Leskovec, J. Large-scale physical activity data reveal worldwide activity inequality. Nature 2017, 547, 336–339. [Google Scholar] [CrossRef]
- International Traffic Safety Data and Analysis Group, IRTAD. Chile Road Safety Annual Report. International Transport Forum. 2020. Available online: https://www.itf-oecd.org/sites/default/files/chile-road-safety.pdf (accessed on 30 April 2021).
- Instituto Nacional de Estadística, INE 2017. Census 2017. Available online: https://www.censo2017.cl/ (accessed on 8 June 2019).
- Herrmann-Lunecke, M.G.; Mora, R.; Sagaris, L. Persistence of walking in Chile: Lessons for urban sustainability. Transp. Rev. 2020, 40, 135–159. [Google Scholar] [CrossRef]
- Iglesias, V.; Giraldez, F.; Tiznado-Aitken, I.; Muñoz, J.C. How uneven is the urban mobility playing field? Inequalities among socioeconomic groups in Santiago De Chile. Transp. Res. Rec. 2019, 2673, 59–70. [Google Scholar] [CrossRef]
- Subsecretaría de Transporte, SECTRA. 2012 O-D Survey; Planning and Development Coordination, Ministry of Transportation and Telecommunications, Government of Chile: Santiago, Chile, 2015.
- MOOVIT. (n.d.) Data and Statistics on Public Transportation. Available online: https://moovitapp.com/insights/es/Moovit_Insights_%C3%8Dndice_de_Transporte_P%C3%BAblico_Chile_Santiago-642 (accessed on 13 March 2021).
- Blazquez, C.; Lee, J.S.; Zegras, C. Children at risk: A comparison of child pedestrian traffic collisions in Santiago, Chile, and Seoul, South Korea. Traffic Inj. Prev. 2016, 17, 304–312. [Google Scholar] [CrossRef]
- Comisión Nacional de Seguridad del Tránsito, CONASET. General Statistics. 2020. Available online: https://conaset.cl/programa/observatorio-datos-estadistica/biblioteca-observatorio/estadisticas-generales/ (accessed on 13 March 2021).
- Hu, L.; Wu, X.; Huang, J.; Peng, Y.; Liu, W. Investigation of clusters and injuries in pedestrian crashes using GIS in Changsha, China. Saf. Sci. 2020, 127, 104710. [Google Scholar] [CrossRef]
- Kim, M.; Kho, S.Y.; Kim, D.K. Hierarchical ordered model for injury severity of pedestrian crashes in South Korea. J. Saf. Res. 2017, 61, 33–40. [Google Scholar] [CrossRef]
- Li, Y.; Fan, W.D. Modelling severity of pedestrian-injury in pedestrian-vehicle crashes with latent class clustering and partial proportional odds model: A case study of North Carolina. Accid. Anal. Prev. 2019, 131, 284–296. [Google Scholar] [CrossRef]
- Li, Y.; Fan, W. Modelling the severity of pedestrian injury in pedestrian-vehicle crashes in North Carolina: A partial proportional odds logit model approach. J. Transp. Saf. Secur. 2020, 12, 358–379. [Google Scholar] [CrossRef]
- Li, Y.; Fan, W. Mixed logit approach to modeling the severity of pedestrian-injury in pedestrian-vehicle crashes in North Carolina: Accounting for unobserved heterogeneity. J. Transp. Saf. Secur. 2020, 14, 796–817. [Google Scholar] [CrossRef]
- Martínez-Ruiz, V.; Valenzuela-Martínez, M.; Lardelli-Claret, P.; Molina-Soberanes, D.; Moreno-Roldán, E.; Jiménez-Mejías, E. Factors related to the risk of pedestrian fatality after a crash in Spain, 1993–2013. J. Transp. Health 2019, 12, 279–289. [Google Scholar] [CrossRef]
- Munira, S.; Sener, I.; Dai, B. A Bayesian spatial Poisson-lognormal model to examine pedestrian crash severity at signalized intersections. Accid. Anal. Prev. 2020, 144, 105679. [Google Scholar] [CrossRef]
- Ouni, F.; Belloumi, M. Spatio-temporal pattern of vulnerable road user’s collisions hot spots and related risk factors for injury severity in Tunisia. Transp. Res. Part F 2018, 56, 477–495. [Google Scholar] [CrossRef]
- Park, S.-H.; Bae, M.-K. Exploring the Determinants of the Severity of Pedestrian Injuries by Pedestrian Age: A Case Study of Daegu Metropolitan City, South Korea. Int. J. Environ. Res. Public Health 2020, 17, 2358. [Google Scholar] [CrossRef]
- Pour-Rouholamin, M.; Zhou, H. Investigating the risk factors associated with pedestrian injury severity in Illinois. J. Saf. Res. 2016, 57, 9–17. [Google Scholar] [CrossRef]
- Sasidharan, L.; Menéndez, M. Partial proportional odds model—An alternate choice for analyzing pedestrian crash injury severities. Accid. Anal. Prev. 2014, 72, 330–340. [Google Scholar] [CrossRef]
- Sun, M.; Sun, X.; Shan, D. Pedestrian crash analysis with latent class clustering method. Accid. Anal. Prev. 2019, 124, 50–57. [Google Scholar] [CrossRef]
- Wang, Y.; Prato, C.G. Determinants of injury severity for truck crashes on mountain expressways in China: A case-study with a partial proportional odds model. Saf. Sci. 2019, 117, 100–107. [Google Scholar] [CrossRef]
- Zafri, N.; Prithul, A.; Baral, I.; Rahman, M. Exploring the factors influencing pedestrian-vehicle crash severity in Dhaka, Bangladesh. Int. J. Inj. Control. Saf. Promot. 2020, 27, 300–307. [Google Scholar] [CrossRef] [PubMed]
- Jahangeer, A.A.; Anjana, S.S.; Das, V.R. A Hierarchical Modeling Approach to Predict Pedestrian Crash Severity. In Transportation Research; Mathew, T., Joshi, G., Velaga, N., Arkatkar, S., Eds.; Springer: Singapore, 2020; pp. 355–366. [Google Scholar] [CrossRef]
- Sasidharan, L.; Menéndez, M. Application of partial proportional odds model for analyzing pedestrian crash injury severities in Switzerland. J. Transp. Saf. Secur. 2019, 11, 58–78. [Google Scholar] [CrossRef]
- Blazquez, C.; Celis, M. A spatial and temporal analysis of child pedestrian crashes in Santiago, Chile. Accid. Anal. Prev. 2013, 50, 304–311. [Google Scholar] [CrossRef] [PubMed]
- Pour, A.; Moridpour, S.; Tay, R.; Rajabifard, A. Modelling pedestrian crash severity at mid-blocks. Transp. A Transp. Sci. 2017, 13, 273–297. [Google Scholar] [CrossRef]
- Hezaveh, A.M.; Cherry, C.R. Walking under the influence of the alcohol: A case study of pedestrian crashes in Tennessee. Accid. Anal. Prev. 2018, 121, 64–70. [Google Scholar] [CrossRef]
- Lasota, D.; Goniewicz, M.; Kosson, D.; Ochal, A.; Krajewski, P.; Tarka, S.; Goniewicz, K.; Mirowska-Guzel, D. Effects of ethyl alcohol on injuries severity according to injury severity scales in pedestrian fatal injury in traffic crashes. Int. J. Inj. Control. Saf. Promot. 2020, 27, 112–120. [Google Scholar] [CrossRef]
- Aga, M.A.; Woldeamanuel, B.T.; Tadesse, M. Statistical modeling of numbers of human deaths per road traffic accident in the Oromia region, Ethiopia. PLoS ONE 2021, 16, e0251492. [Google Scholar] [CrossRef]
- Downey, L.T.; Saleh, W.; Muley, D.; Kharbeche, M. Pedestrian crashes at priority-controlled junctions, roundabouts, and signalized junctions: The UK case study. Traffic Inj. Prev. 2019, 20, 308–313. [Google Scholar] [CrossRef]
- Cinnamon, J.; Schuurman, N.; Hameed, S.M. Pedestrian injury and human behaviour: Observing road-rule violations at high-incident intersections. PLoS ONE 2011, 6, e21063. [Google Scholar] [CrossRef]
- Giummarra, M.J.; Beck, B.; Gabbe, B.J. Classification of road traffic injury collision characteristics using text mining analysis: Implications for road injury prevention. PLoS ONE 2021, 16, e0245636. [Google Scholar] [CrossRef] [PubMed]
- Alkahtani, K.; Abdel-Aty, M.; Lee, J. A zonal level safety investigation of pedestrian crashes in Riyadh, Saudi Arabia. Int. J. Sustain. Transp. 2019, 13, 255–267. [Google Scholar] [CrossRef]
- Brubacher, J.R.; Chan, H.; Erdelyi, S.; Schuurman, N.; Amram, O. The association between regional environmental factors and road trauma rates: A geospatial analysis of 10 years of road traffic crashes in British Columbia, Canada. PLoS ONE 2016, 11, e0153742. [Google Scholar] [CrossRef] [PubMed]
- Martínez, P.; Contreras, D.; Moreno, M. Safe mobility, socioeconomic inequalities, and aging: A 12-year multilevel interrupted time-series analysis of road traffic death rates in a Latin American country. PLoS ONE 2020, 15, e0224545. [Google Scholar] [CrossRef] [PubMed]
- Osama, A.; Sayed, T. Macro-spatial approach for evaluating the impact of socio-economics, land use, built environment, and road facility on pedestrian safety. Can. J. Civ. Eng. 2017, 44, 1036–1044. [Google Scholar] [CrossRef]
- Bajada, T.; Attard, M. A typological and spatial analysis of pedestrian fatalities and injuries in Malta. Res. Transp. Econ. 2021, 86, 101023. [Google Scholar] [CrossRef]
- Song, L.; Li, Y.; Fan, W.D.; Liu, P. Mixed logit approach to analyzing pedestrian injury severity in pedestrian-vehicle crashes in North Carolina: Considering time-of-day and day-of-week. Traffic Inj. Prev. 2021, 22, 524–529. [Google Scholar] [CrossRef]
- Xin, C.; Guo, R.; Wang, Z.; Lu, Q.; Lin, P.-S. The effects of neighborhood characteristics and the built environment on pedestrian injury severity: A random parameters generalized ordered probability model with heterogeneity in means and variances. Anal. Methods Accid. Res. 2017, 16, 117–132. [Google Scholar] [CrossRef]
- Lu, X.; Ma, Z.; Chien, S.; Xiong, Y. Development of a Partial Proportional Odds Model for Pedestrian Injury Severity at Intersections. Traffic Transp. 2020, 32, 559–571. [Google Scholar] [CrossRef]
- Ma, Z.; Lu, X.; Chien, S.; Hu, D. Investigating factors influencing pedestrian injury severity at intersections. Traffic Inj. Prev. 2018, 19, 159–164. [Google Scholar] [CrossRef]
- Tay, R.; Choi, J.; Kattan, L.; Khan, A. A Multinomial Logit Model of Pedestrian–Vehicle Crash Severity. Int. J. Sustain. Transp. 2011, 5, 233–249. [Google Scholar] [CrossRef]
- Chen, Z.; Fan, W. A multinomial logit model of pedestrian-vehicle crash severity in North Carolina. Int. J. Transp. Sci. Technol. 2019, 8, 43–52. [Google Scholar] [CrossRef]
- Tulu, G.S.; Washington, S.; Haque, M.M.; King, M. Injury severity of pedestrians involved in road traffic crashes in Addis Ababa, Ethiopia. J. Transp. Saf. Secur. 2017, 9, 47–66. [Google Scholar] [CrossRef]
- Sivasankaran, S.; Rangam, H.; Balasubramanian, V. Investigation of factors contributing to injury severity in single vehicle motorcycle crashes in India. Int. J. Inj. Control. Saf. Promot. 2021, 28, 243–254. [Google Scholar] [CrossRef] [PubMed]
- Williams, R. Understanding and interpreting generalized ordered logit models. J. Math. Sociol. 2016, 40, 7–20. [Google Scholar] [CrossRef]
- Duddu, V.; Penmetsa, P.; Pulugurtha, S. Modeling and comparing injury severity of at-fault and not at-fault drivers in crashes. Accid. Anal. Prev. 2018, 120, 55–63. [Google Scholar] [CrossRef]
- Song, L.; Fan, W.D. Combined latent class and partial proportional odds model approach to exploring the heterogeneities in truck-involved severities at cross and T-intersections. Accid. Anal. Prev. 2020, 144, 105638. [Google Scholar] [CrossRef]
- Yuan, Y.; Yang, M.; Guo, Y.; Rasouli, S.; Gan, Z.; Ren, Y. Risk factors associated with truck-involved fatal crash severity: Analyzing their impact for different groups of truck drivers. J. Saf. Res. 2021, 76, 154–165. [Google Scholar] [CrossRef]
- Lin, Z.; Fan, W. Exploring bicyclist injury severity in bicycle-vehicle crashes using latent class clustering analysis and partial proportional odds models. J. Saf. Res. 2021, 76, 101–117. [Google Scholar] [CrossRef]
- Koilada, K.; Mane, A.; Pulugurtha, S. Odds of work zone crash occurrence and getting involved in advance warning, transition, and activity areas by injury severity. IATSS Res. 2020, 44, 75–83. [Google Scholar] [CrossRef]
- Ma, Z.; Zhao, W.; Chien, S.; Dong, C. Exploring factors contributing to crash injury severity on rural two-lane highways. J. Saf. Res. 2015, 55, 171–176. [Google Scholar] [CrossRef] [PubMed]
- Kadeha, C.; Haule, H.; Ali, M.D.S.; Alluri, P.; Ponnaluri, R. Modeling Wrong-way Driving (WWD) crash severity on arterials in Florida. Accid. Anal. Prev. 2021, 151, 105963. [Google Scholar] [CrossRef] [PubMed]
- Hasanat-E-Rabbi, S.; Raihan, A.; Sohel Mahmud, S.; Hoque, S. Pedestrian injury outcomes in the developing urban metropolis: Econometric models for assessing risk factors. IATSS Res. 2022, in press. [Google Scholar] [CrossRef]
- Anderson, T.K. Kernel density estimation and K-means clustering to profile road accident hotspots. Accid. Anal. Prev. 2009, 41, 359–364. [Google Scholar] [CrossRef] [PubMed]
- Chimba, D.; Musinguzi, A.; Kidando, E. Associating pedestrian crashes with demographic and socioeconomic factors. Case Stud. Transp. Policy 2018, 6, 11–16. [Google Scholar] [CrossRef]
- Yao, S.; Wang, J.; Fang, L.; Wu, J. Identification of vehicle-pedestrian collision hotspots at the micro-level using network kernel density estimation and random forests: A case study in Shanghai, China. Sustainability 2018, 10, 4762. [Google Scholar] [CrossRef]
- Chen, Y.; Luo, R.; King, M.; Shi, Q.; He, J.; Hu, Z. Spatiotemporal analysis of crash severity on rural highway: A case study in Anhui, China. Accid. Anal. Prev. 2022, 165, 106538. [Google Scholar] [CrossRef]
- Xie, K.; Ozbay, K.; Kurkcu, A.; Yang, H. Analysis of traffic crashes involving pedestrians using big data: Investigation of contributing factors and identification of hotspots. Risk Anal. 2017, 37, 1459–1476. [Google Scholar] [CrossRef]
- Comisión Nacional de Seguridad de Tránsito, CONASET. (n.d) Request of Information, Transparency Law. Available online: http://www.subtrans.gob.cl/transparencia/solicitud_informacion.html (accessed on 17 April 2018).
- Fotheringham, A.S.; Brunsdon, C.; Charlton, M. Quantitative Geography: Perspectives on Spatial Data Analysis; Sage: Thousand Oaks, CA, USA, 2000. [Google Scholar]
- Peterson, B.; Harrell, J. Partial proportional odds models for ordinal response variables. J. R. Stat. Society. Ser. C 1990, 39, 205–217. [Google Scholar] [CrossRef] [Green Version]
- Williams, R. Generalized ordered logit/partial proportional odds models for ordinal dependent variables. Stata J. 2006, 6, 58–82. [Google Scholar] [CrossRef]
- Liu, P.; Fan, W. Analysis of head-on crash injury severity using a partial proportional odds model. J. Transp. Saf. Secur. 2019, 13, 714–734. [Google Scholar] [CrossRef]
- Chung, Y. An application of in-vehicle recording technologies to analyze injury severity in crashes between taxis and two-wheelers. Accid. Anal. Prev. 2022, 166, 106541. [Google Scholar] [CrossRef]
- Bravo Rojas, G.; Duarte Anselmi, G.; Cerda Lorca, J.; Castellucci, H.I. Road traffic accidents of the elderly in Chile between the years 2008-2017: A register-based descriptive study. Medwave 2020, 20, e7924. [Google Scholar] [CrossRef]
- Herrera, A.; Repetto, P. Parental practices and pedestrian risk behaviors in Chilean adolescents. Rev. Médica Chile 2014, 142. [Google Scholar] [CrossRef]
- Lienlaf, C.; Plass, A.; Rodríguez, N.; Veas, F. A Dos Pies, Etnografía Aplicada: Conductas de Riesgo en Peatones [At Two Feet, Applied Ethnography: Risk Behaviors in Pedestrians]. Dilab, DICTUC S.A.; Centro de Innovación Pontificia Universidad Católica de Chile. 2017. Available online: https://biblioteca.digital.gob.cl/handle/123456789/1024 (accessed on 25 April 2019).
- Su, J.; Sze, N.N.; Bai, L. A joint probability model for pedestrian crashes at macroscopic level: Roles of environment, traffic, and population characteristics. Accid. Anal. Prev. 2021, 150, 105898. [Google Scholar] [CrossRef]
- Blazquez, C.; Laurent, J.G.C.; Nazif-Munoz, J.I. Differential impacts of ridesharing on alcohol-related crashes by socioeconomic municipalities: Rate of technology adoption matters. BMC Public Health 2021, 21, 2008. [Google Scholar] [CrossRef]
- Nazif-Muñoz, J.I.; Batomen, B.; Oulhote, Y.; Spengler, J.; Nandi, A. State or market? How to effectively decrease alcohol-related crash fatalities and injuries. J. Epidemiol. Community Health 2020, 74, 502–509. [Google Scholar] [CrossRef]
- Bonan, G.; Danilo, M.; Carabantes, J.P. Hábitat patrimonial y mixidad social en la Comuna de Santiago (Chile): Posibilidades de desarrollo de un centro histórico chileno con introducción de viviendas sociales en arriendo subsidiado en contexto patrimonial [Heritage habitat and social mix in the Santiago Commune (Chile): Possibilities for the development of a Chilean historic center with the introduction of subsidized social housing for rent in a heritage context]. Planur-E Territ. Urban. Paisaje Sostenibilidad Y Diseño Urbano 2020, 17, 4. [Google Scholar]
- Park, S.-H.; Bae, M.-K. Effects Influencing Pedestrian–Vehicle Crash Frequency by Severity Level: A Case Study of Seoul Metropolitan City, South Korea. Safety 2020, 6, 25. [Google Scholar] [CrossRef]
Publisher’s Note: MDPI stays neutral with regard to jurisdictional claims in published maps and institutional affiliations. |
© 2022 by the authors. Licensee MDPI, Basel, Switzerland. This article is an open access article distributed under the terms and conditions of the Creative Commons Attribution (CC BY) license (https://creativecommons.org/licenses/by/4.0/).