
Radon Progeny Adsorption on Facial Masks


Abstract
:1. Introduction
2. Materials and Methods
- Melt-blown protective mask (IPOS—Medikal, Diş Ticaret A. Ş, Istanbul, Turkey), consisting of nonwoven fabric on the outer and inner layers and spunbond fabric on the middle layer, with a performance level of FFP2 and in conformity with the EU-type examination certificate 224-21-01-R02; thickness: 0.9 ± 0.1 mm (referred to as FFP2); test standard: EN 149:2001 + A1:2009.
- Surgical mouth and nose protection mask type II R (IPOS—Medikal, Diş Ticaret A. Ş, Istanbul, Turkey), consisting of nonwoven fabric; thickness: 0.5 ± 0.1 mm (referred to as II R); test standard: DIN EN 14683:2019-10.
3. Results
4. Discussion
5. Conclusions
Author Contributions
Funding
Institutional Review Board Statement
Informed Consent Statement
Data Availability Statement
Acknowledgments
Conflicts of Interest
References
- Paquet, F.; Bailey, M.R.; Leggett, R.W.; Lipsztein, J.; Marsh, J.; Fell, T.P.; Smith, T.; Nosske, D.; Eckerman, K.F.; Berkovski, V.; et al. ICRP Publication 137: Occupational Intakes of Radionuclides: Part 3. Ann. ICRP 2017, 46, 1–486. [Google Scholar] [CrossRef] [PubMed]
- Nucleonica. Karlsruher Nuklidkarte, 10th ed.; Marktdienste Haberbeck GmbH: Karlsruhe, Germany, 2018. [Google Scholar]
- Porstendörfer, J. Properties and behaviour of radon and thoron and their decay products in the air. J. Aerosol Sci. 1994, 25, 219–263. [Google Scholar] [CrossRef]
- Kendall, G.M.; Smith, T.J. Doses to organs and tissues from radon and its decay products. J. Radiol. Prot. 2002, 22, 389–406. [Google Scholar] [CrossRef] [PubMed]
- Grosskopf, A.; Irlweck, K. Radon Exposure and Urinary 210Po Excretion of Austrian Spa Workers. Radiat. Prot. Dosim. 1985, 12, 39–43. [Google Scholar] [CrossRef]
- Sakoda, A.; Ishimori, Y.; Kawabe, A.; Kataoka, T.; Hanamoto, K.; Yamaoka, K. Physiologically based pharmacokinetic modeling of inhaled radon to calculate absorbed doses in mice, rats, and humans. J. Nucl. Sci. Technol. 2010, 47, 731–738. [Google Scholar] [CrossRef]
- Khursheed, A. Doses to systemic tissues from radon gas. Radiat. Prot. Dosim. 2000, 88, 171–181. [Google Scholar] [CrossRef]
- El Ghissassi, F.; Baan, R.; Straif, K.; Grosse, Y.; Secretan, B.; Bouvard, V.; Benbrahim-Tallaa, L.; Guha, N.; Freeman, C.; Galichet, L.; et al. A review of human carcinogens—Part D: Radiation. Lancet Oncol. 2009, 10, 751–752. [Google Scholar] [CrossRef]
- Szucs, S.; Delfosse, J. Charge Spectrum of Recoiling Po 216 in the α Decay of Rn 220. Phys. Rev. Lett. 1965, 15, 163–165. [Google Scholar] [CrossRef]
- Porstendörfer, J.; Mercer, T. Adsorption probability of atoms and ions on particle surfaces in submicrometer size range. J. Aerosol Sci. 1978, 9, 469–474. [Google Scholar] [CrossRef]
- Stuart, B.O. Deposition and clearance of inhaled particles. Environ. Health Perspect. 1984, 55, 369–390. [Google Scholar] [CrossRef] [PubMed]
- Carvalho, T.C.; Peters, J.I.; Williams, R.O., III. Influence of particle size on regional lung deposition–what evidence is there? Int. J. Pharm. 2011, 406, 1–10. [Google Scholar] [CrossRef] [PubMed]
- Hofmann, W. Modelling inhaled particle deposition in the human lung—A review. J. Aerosol Sci. 2011, 42, 693–724. [Google Scholar] [CrossRef]
- Maier, A.; Wiedemann, J.; Rapp, F.; Papenfuß, F.; Rödel, F.; Hehlgans, S.; Gaipl, U.S.; Kraft, G.; Fournier, C.; Frey, B. Radon Exposure—Therapeutic Effect and Cancer Risk. Int. J. Mol. Sci. 2020, 22, 316. [Google Scholar] [CrossRef]
- Rabago, D.; Fuente, I.; Celaya, S.; Fernandez, A.; Fernandez, E.; Quindos, J.; Pol, R.; Cinelli, G.; Quindos, L.; Sainz, C. Intercomparison of indoor radon measurements under field conditions in the framework of metroradon european project. Int. J. Environ. Res. Public Health 2020, 17, 1780. [Google Scholar] [CrossRef]
- Maier, A.; Jones, J.; Sternkopf, S.; Friedrich, E.; Fournier, C.; Kraft, G. Radon Adsorption in Charcoal. Int. J. Environ. Res. Public Health 2021, 18, 4454. [Google Scholar] [CrossRef] [PubMed]
- Wilson, O.J. Radon transport in an activated charcoal canister. Nucl. Instrum. Methods Phys. Res. Sect. A Accel. Spectrometers Detect. Assoc. Equip. 1989, 275, 163–171. [Google Scholar] [CrossRef]
- Yasuoka, Y.; Ishikawa, T.; Tokonami, S.; Takahashi, H.; Sorimachi, A.; Shinogi, M. Radon mitigation using an air cleaner. J. Radioanal. Nucl. Chem. 2009, 279, 885–891. [Google Scholar] [CrossRef]
- Hopke, P.K.; Jensen, B.; Montassier, N. Evaluation of several air cleaners for reducing indoor radon progeny. J. Aerosol Sci. 1994, 25, 395–405. [Google Scholar] [CrossRef]
- Hopke, P.K.; Montassier, N.; Wasiolek, P. Evaluation of the effectiveness of several air cleaners for reducing the hazard from indoor radon progeny. Aerosol Sci. Technol. 1993, 19, 268–278. [Google Scholar] [CrossRef]
- WHO. Technical Specifications of Personal Protective Equipment for COVID-19: Interim Guidance, 13 November 2020; World Health Organization: Geneva, Switzerland, 2020. [Google Scholar]
- Maier, A.; van Beek, P.; Hellmund, J.; Durante, M.; Schardt, D.; Kraft, G.; Fournier, C. Experimental setup for radon exposure and first diffusion studies using gamma spectroscopy. Nucl. Instrum. Methods Phys. Res. Sect. B Beam Interact. Mater. At. 2015, 362, 187–193. [Google Scholar] [CrossRef]
- Paquet, F.; Etherington, G.; Bailey, M.R.; Leggett, R.W.; Lipsztein, J.; Bolch, W.; Eckerman, K.F.; Harrison, J.D.; ICRP. ICRP Publication 130: Occupational Intakes of Radionuclides: Part 1. Ann. ICRP 2015, 44, 5–188. [Google Scholar] [CrossRef]
- Porstendörfer, J.; Röbig, G.; Ahmed, A. Experimental determination of the attachment coefficients of atoms and ions on monodisperse aerosols. J. Aerosol Sci. 1979, 10, 21–28. [Google Scholar] [CrossRef]
- Arellano-Cotrina, J.J.; Marengo-Coronel, N.; Atoche-Socola, K.J.; Peña-Soto, C.; Arriola-Guillén, L.E. Effectiveness and recommendations for the use of dental masks in the prevention of COVID-19: A literature review. Disaster Med. Public Health Prep. 2021, 15, e43–e48. [Google Scholar] [CrossRef]
- Regli, A.; Sommerfield, A.; von Ungern-Sternberg, B. The role of fit testing N95/FFP2/FFP3 masks: A narrative review. Anaesthesia 2021, 76, 91–100. [Google Scholar] [CrossRef]
- Cook, T.M. Personal protective equipment during the coronavirus disease (COVID) 2019 pandemic—A narrative review. Anaesthesia 2020, 75, 920–927. [Google Scholar] [CrossRef] [PubMed]
- Lettner, H.; Hubmer, A.; Rolle, R.; Steinhäusler, F. Occupational exposure to radon in treatment facilities of the radon-spa Badgastein, Austria. Environ. Int. 1996, 22, 399–407. [Google Scholar] [CrossRef]
- Vogiannis, E.; Niaounakis, M.; Halvadakis, C. Contribution of 222Rn-bearing water to the occupational exposure in thermal baths. Environ. Int. 2004, 30, 621–629. [Google Scholar] [CrossRef] [PubMed]


| Experiment | Temperature | Relative Humidity | c(Rn) |
|---|---|---|---|
| linearity | 21.9 ± 0.3 °C | 74.6 ± 2.8% | 88–375 kBq m−3 |
| no filter | 22.4 ± 0.1 °C | 63.9 ± 2.3% | 19.7–54.5 kBq m−3 |
| FFP2 | 22.2 ± 0.1 °C | 65.8 ± 1.7% | 54.5–79.1 kBq m−3 |
| II R | 22.1 ± 0.2 °C | 67.4 ± 2.5% | 75.8–104.4 kBq m−3 |
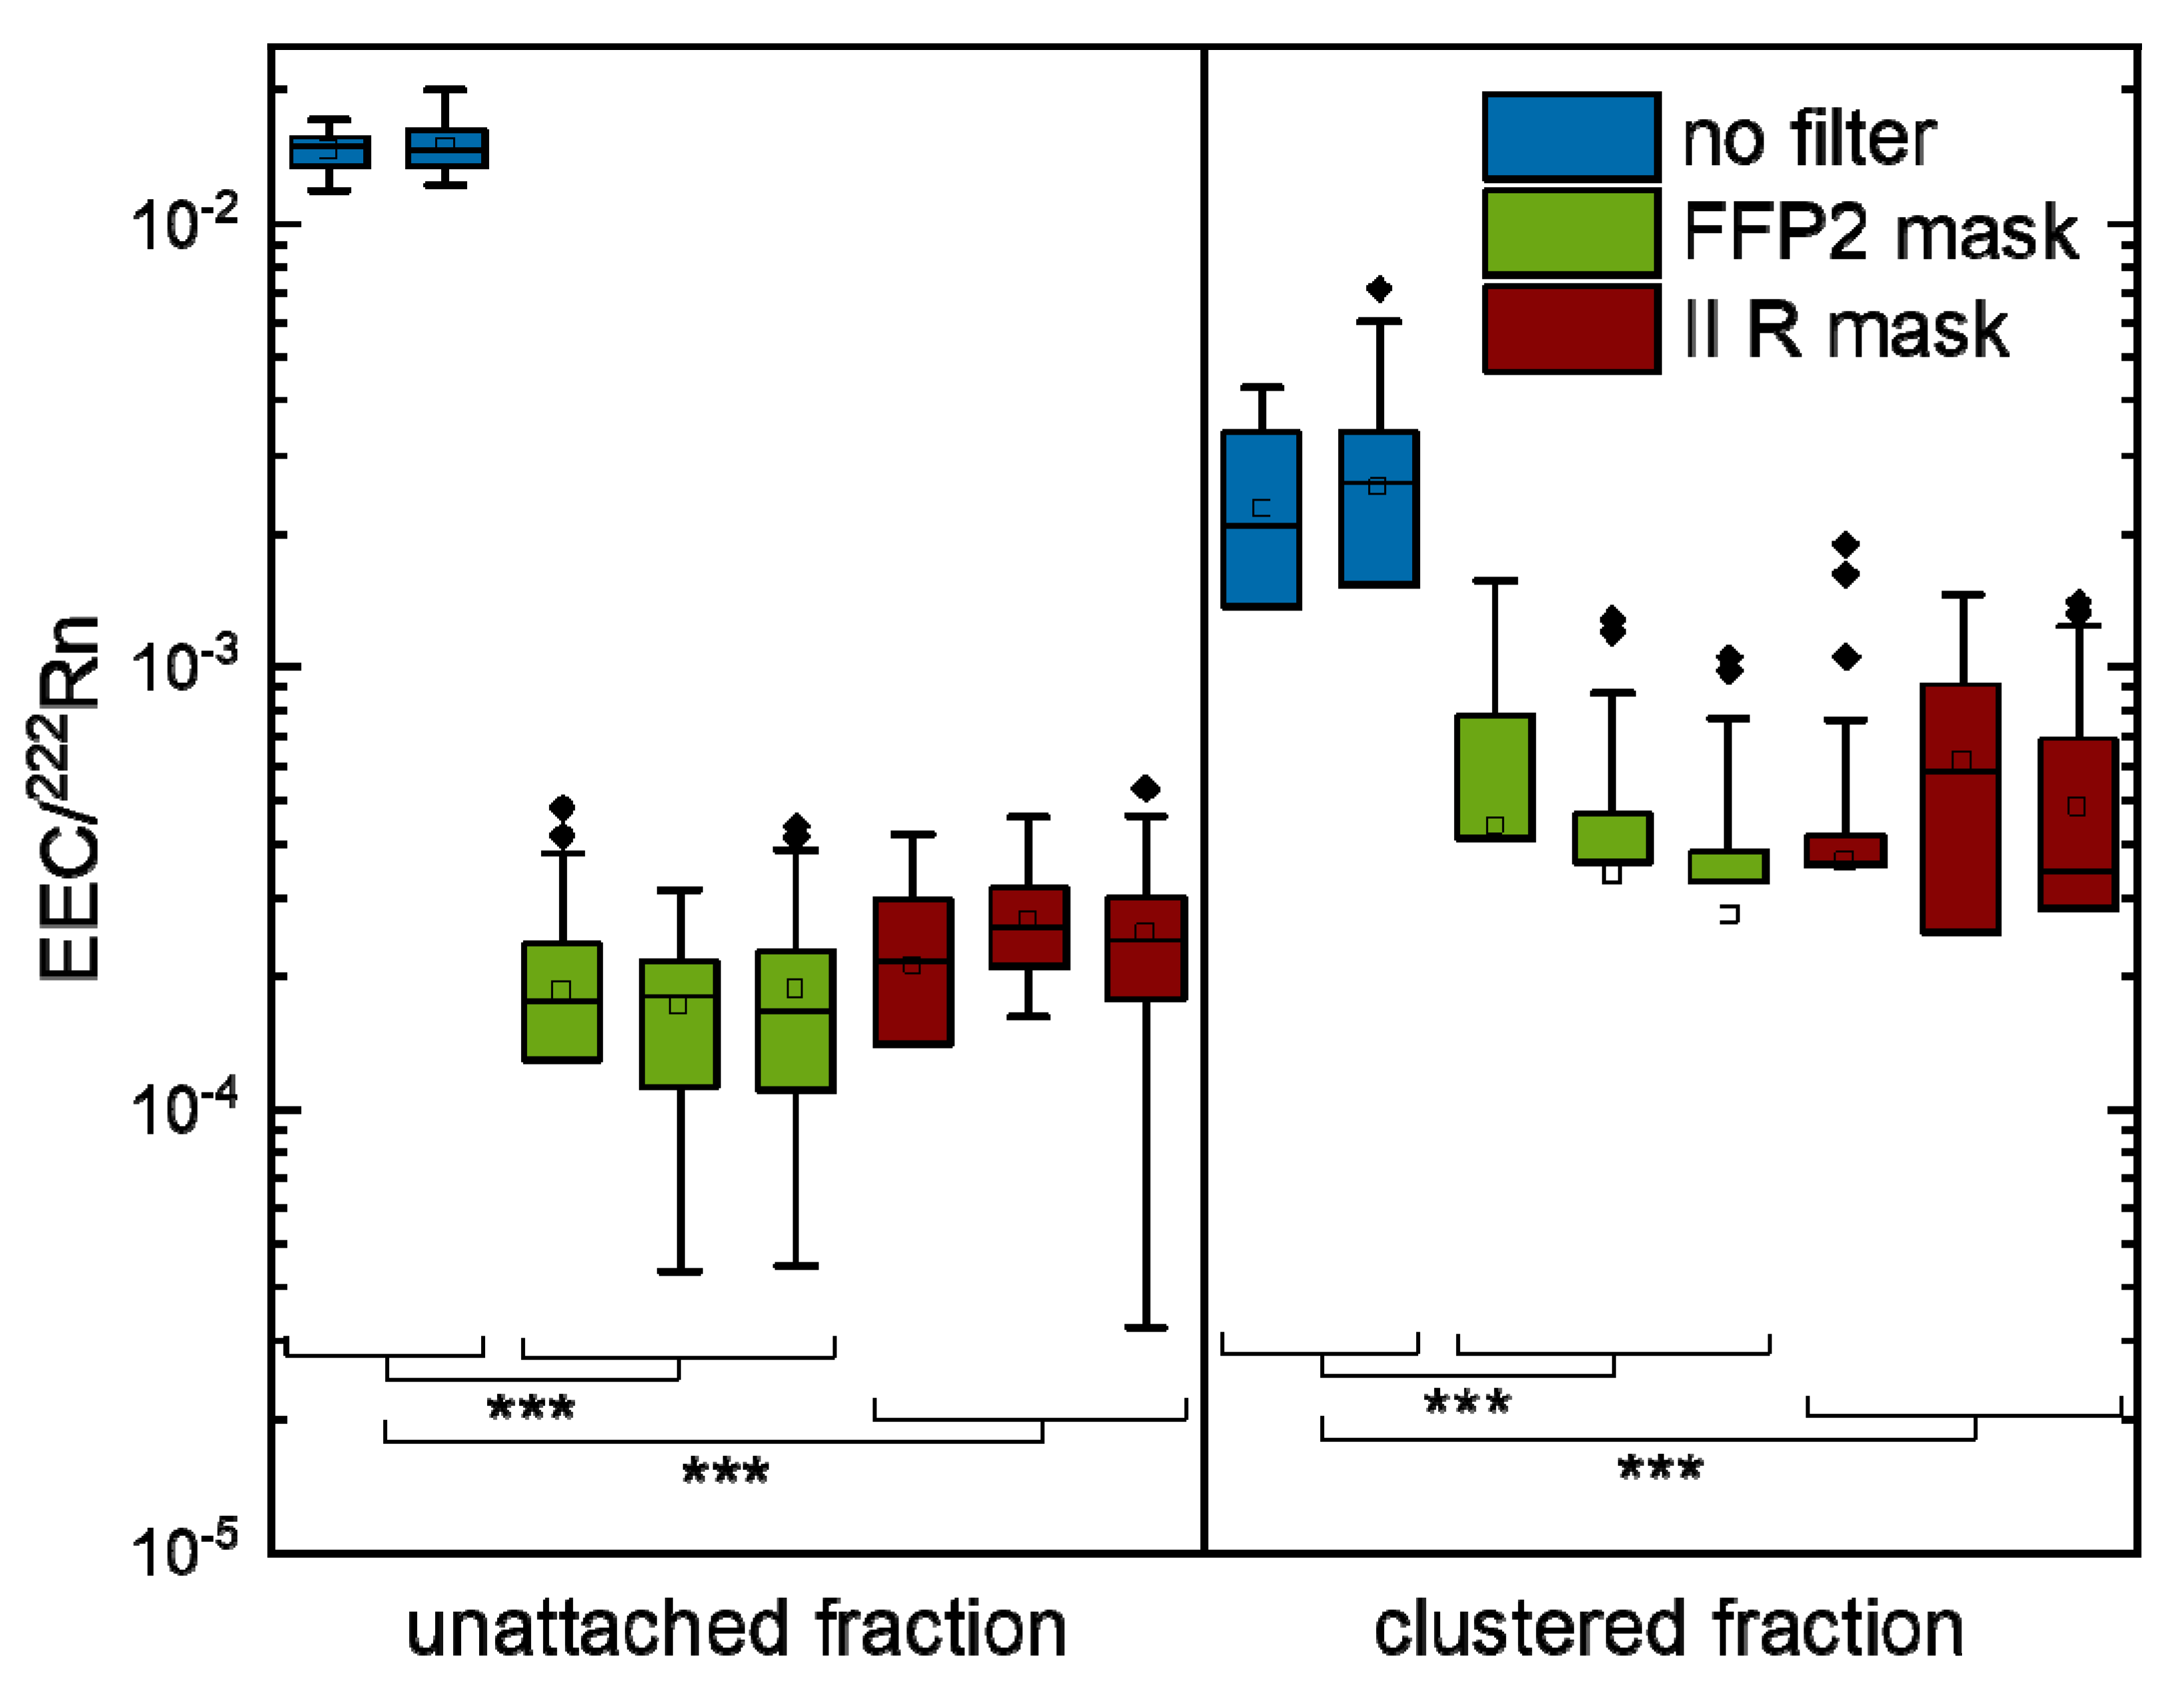
| Experiment | Unattached Fraction | Clustered Fraction |
|---|---|---|
| no filter 1 | (1.47 ± 0.13)·10−2 | (2.28 ± 1.15)·10−3 |
| no filter 2 | (1.50 ± 0.20)·10−2 | (2.54 ± 1.92)·10−3 |
| FFP 2_1 | (1.86 ± 1.01)·10−4 | (4.37 ± 4.28)·10−4 |
| FFP 2_2 | (1.72 ± 0.75)·10−4 | (3.42 ± 3.65)·10−4 |
| FFP 2_3 | (1.87 ± 0.99)·10−4 | (2.77 ± 2.98)·10−4 |
| II R 1 | (2.11 ± 1.01)·10−4 | (3.66 ± 4.20)·10−4 |
| II R 2 | (2.68 ± 0.74)·10−4 | (6.11 ± 4.13)·10−4 |
| II R 3 | (2.50 ± 1.11)·10−4 | (4.83 ± 3.81)·10−4 |
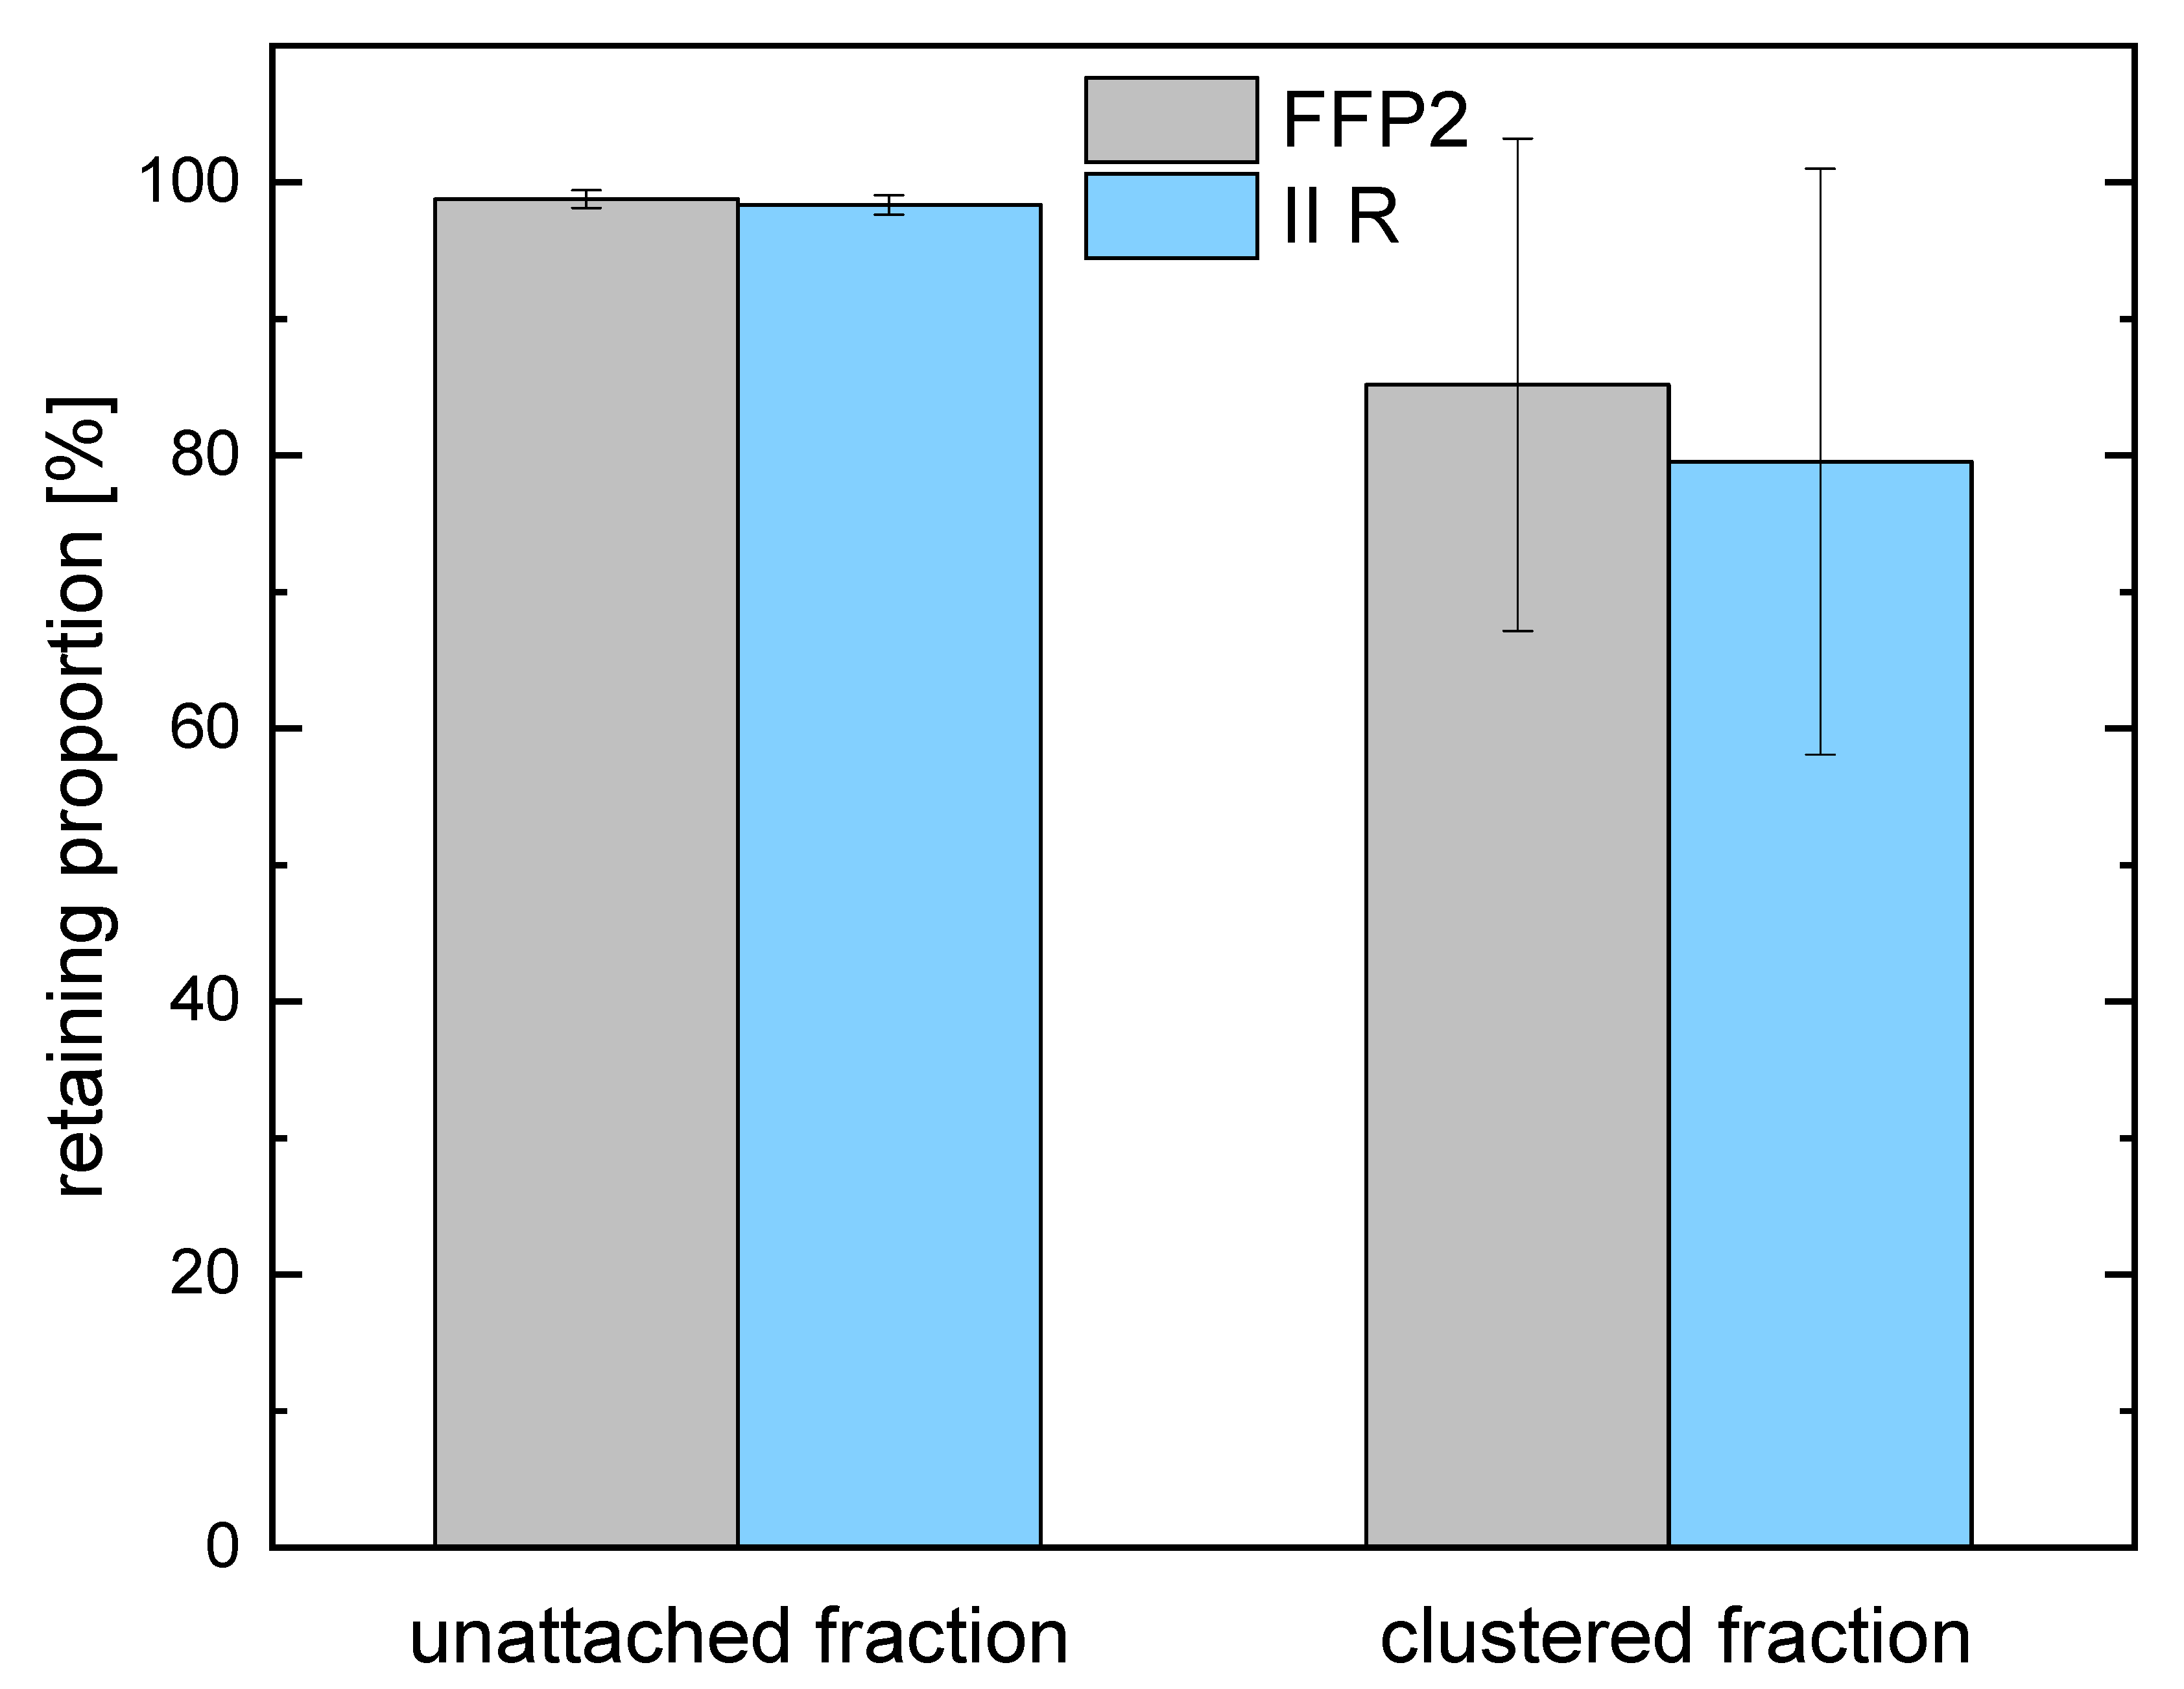
| Experiment | Unattached Fraction | Clustered Fraction |
|---|---|---|
| FFP2 | 98.77 ± 0.64% | 85.17 ± 18.05% |
| II R | 98.36 ± 0.69% | 79.54 ± 21.47% |
| Particle Diameter | Diffusion Rate |
|---|---|
| 0.5 nm | 432.18 m s−1 |
| 5 nm | 13.67 m s−1 |
| 20 nm | 1.71 m s−1 |
| 100 nm | 0.15 m s−1 |
Publisher’s Note: MDPI stays neutral with regard to jurisdictional claims in published maps and institutional affiliations. |
© 2022 by the authors. Licensee MDPI, Basel, Switzerland. This article is an open access article distributed under the terms and conditions of the Creative Commons Attribution (CC BY) license (https://creativecommons.org/licenses/by/4.0/).
Share and Cite
Hinrichs, A.; Fournier, C.; Kraft, G.; Maier, A. Radon Progeny Adsorption on Facial Masks. Int. J. Environ. Res. Public Health 2022, 19, 11337. https://doi.org/10.3390/ijerph191811337
Hinrichs A, Fournier C, Kraft G, Maier A. Radon Progeny Adsorption on Facial Masks. International Journal of Environmental Research and Public Health. 2022; 19(18):11337. https://doi.org/10.3390/ijerph191811337
Chicago/Turabian StyleHinrichs, Annika, Claudia Fournier, Gerhard Kraft, and Andreas Maier. 2022. "Radon Progeny Adsorption on Facial Masks" International Journal of Environmental Research and Public Health 19, no. 18: 11337. https://doi.org/10.3390/ijerph191811337
APA StyleHinrichs, A., Fournier, C., Kraft, G., & Maier, A. (2022). Radon Progeny Adsorption on Facial Masks. International Journal of Environmental Research and Public Health, 19(18), 11337. https://doi.org/10.3390/ijerph191811337