
The Effect of Persistence of Physical Exercise on the Positive Psychological Emotions of Primary School Students under the STEAM Education Concept

 ,
,  and
and
Abstract
:1. Introduction
2. Basic Theory and Research Methods
2.1. STEAM Education Concept
2.2. Positive Emotion Theory
2.3. Survey Participants and Research Methods
3. Results and Analysis
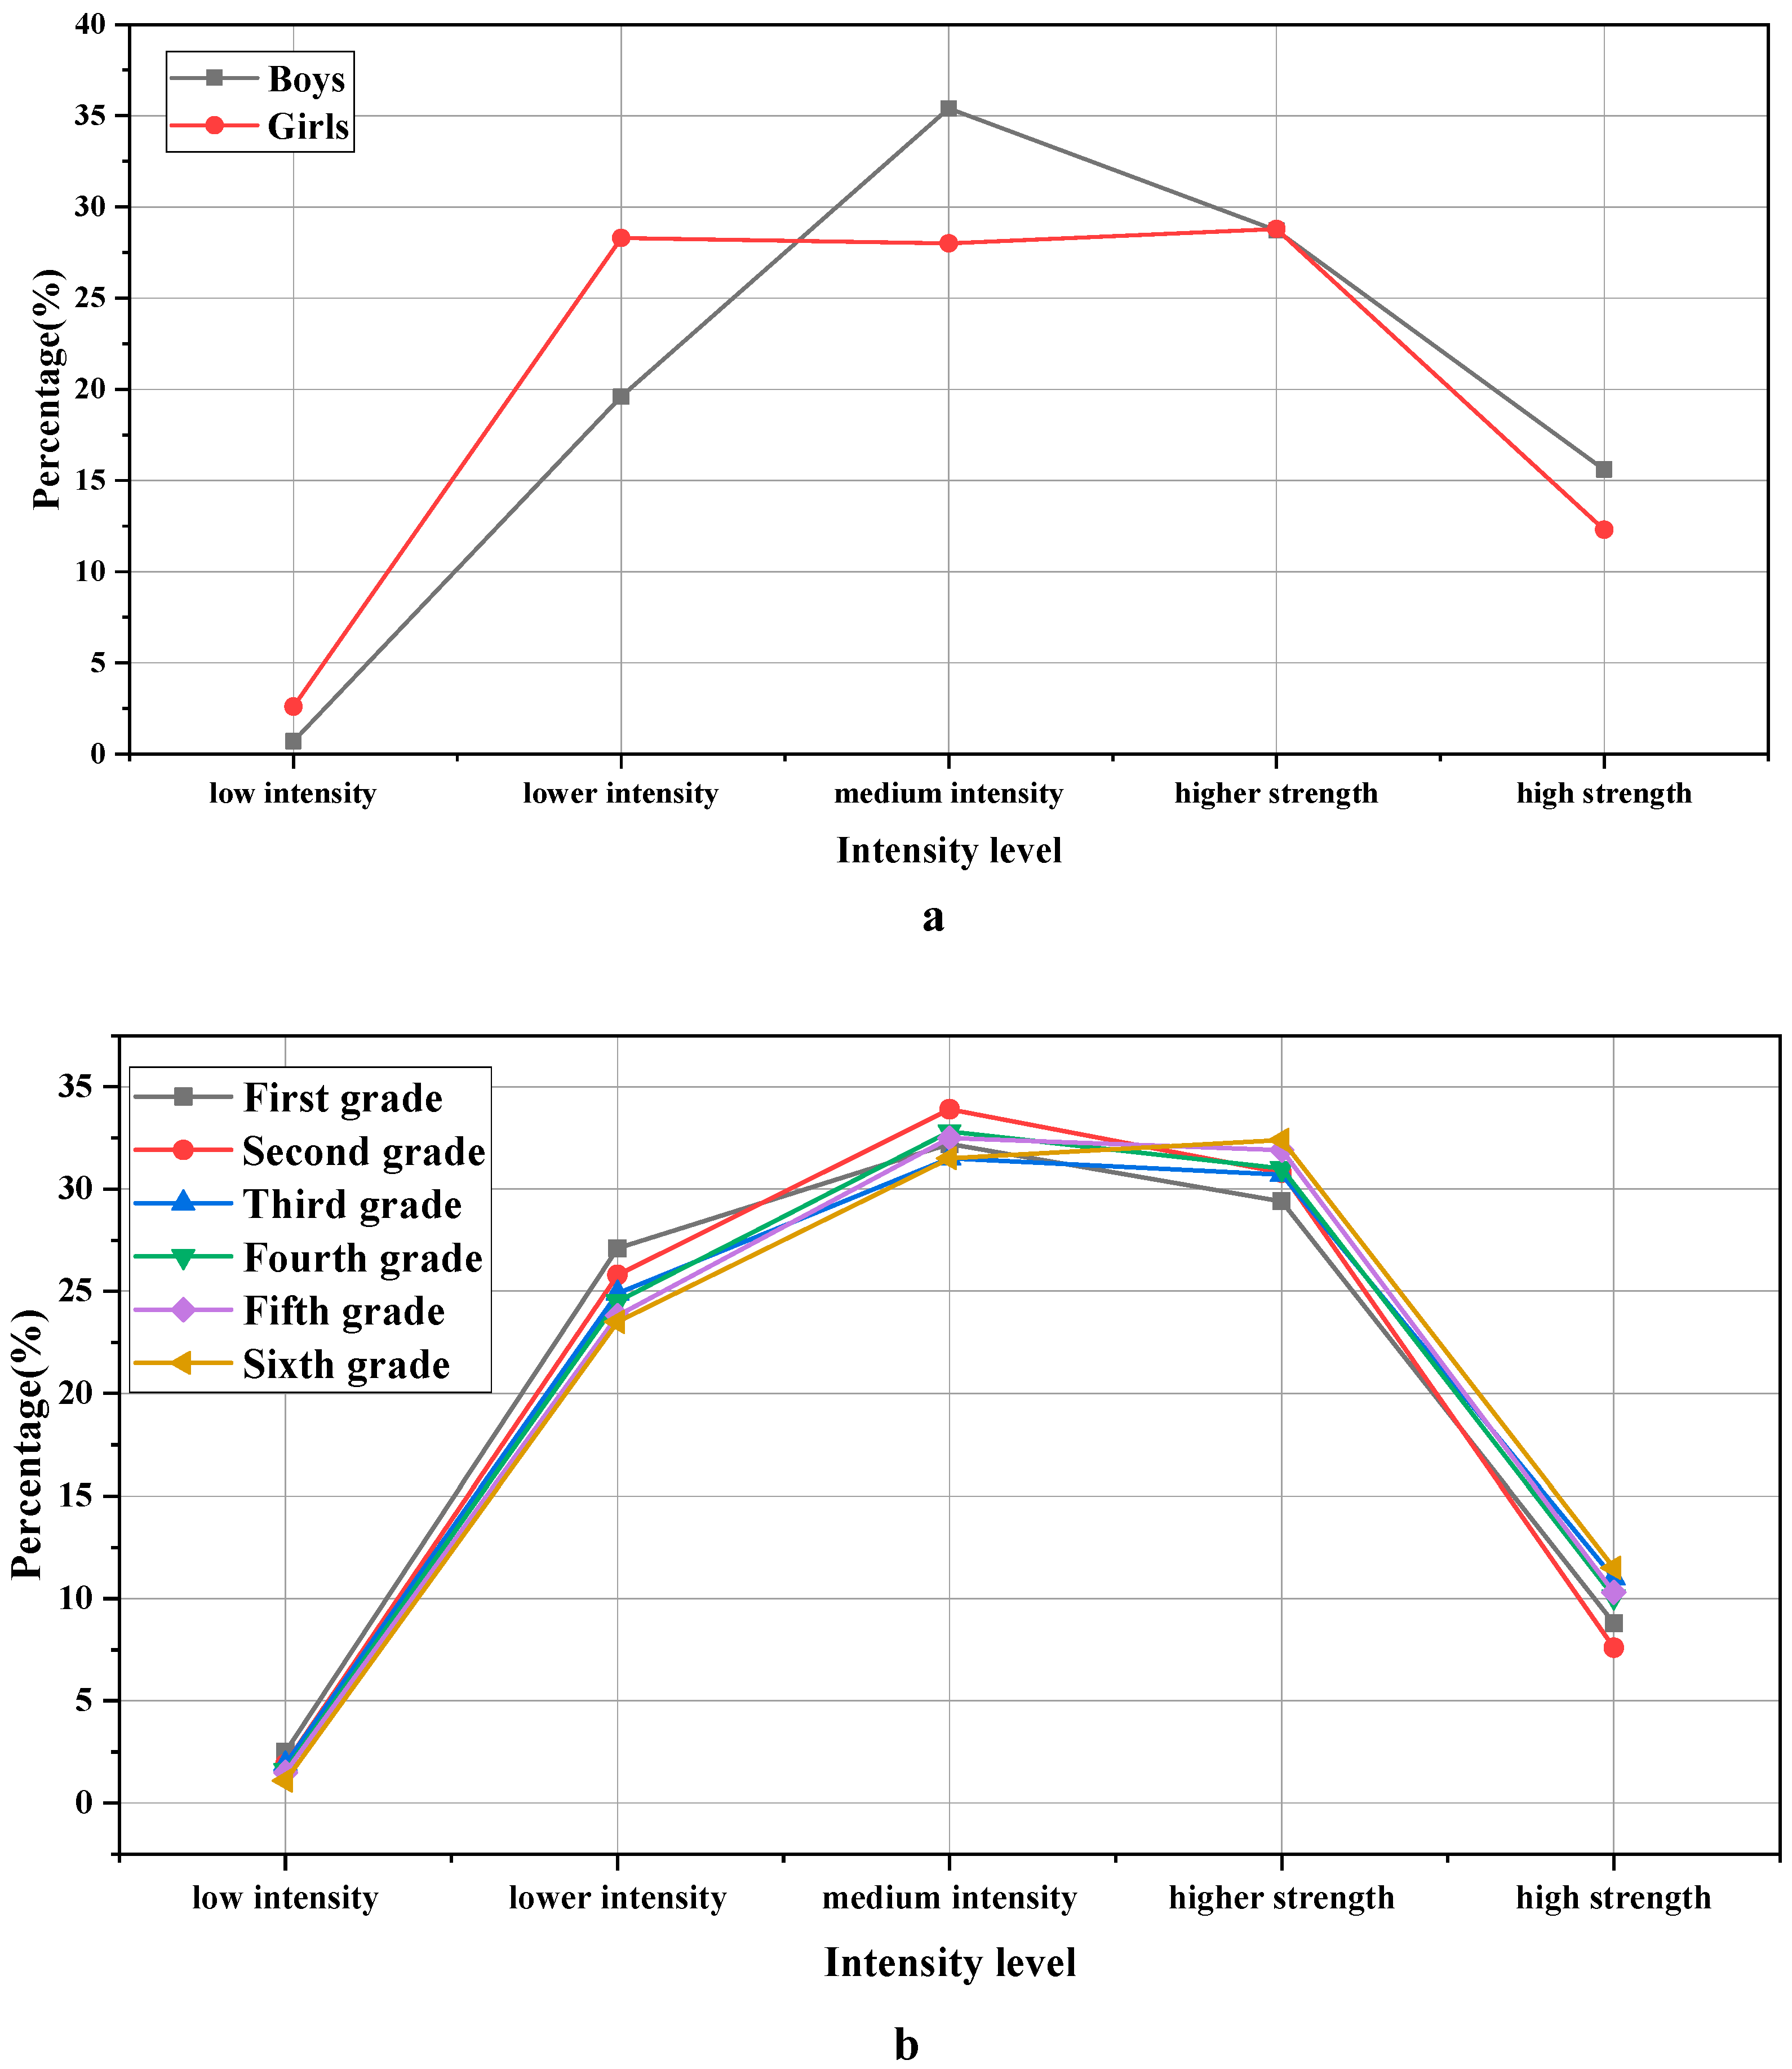
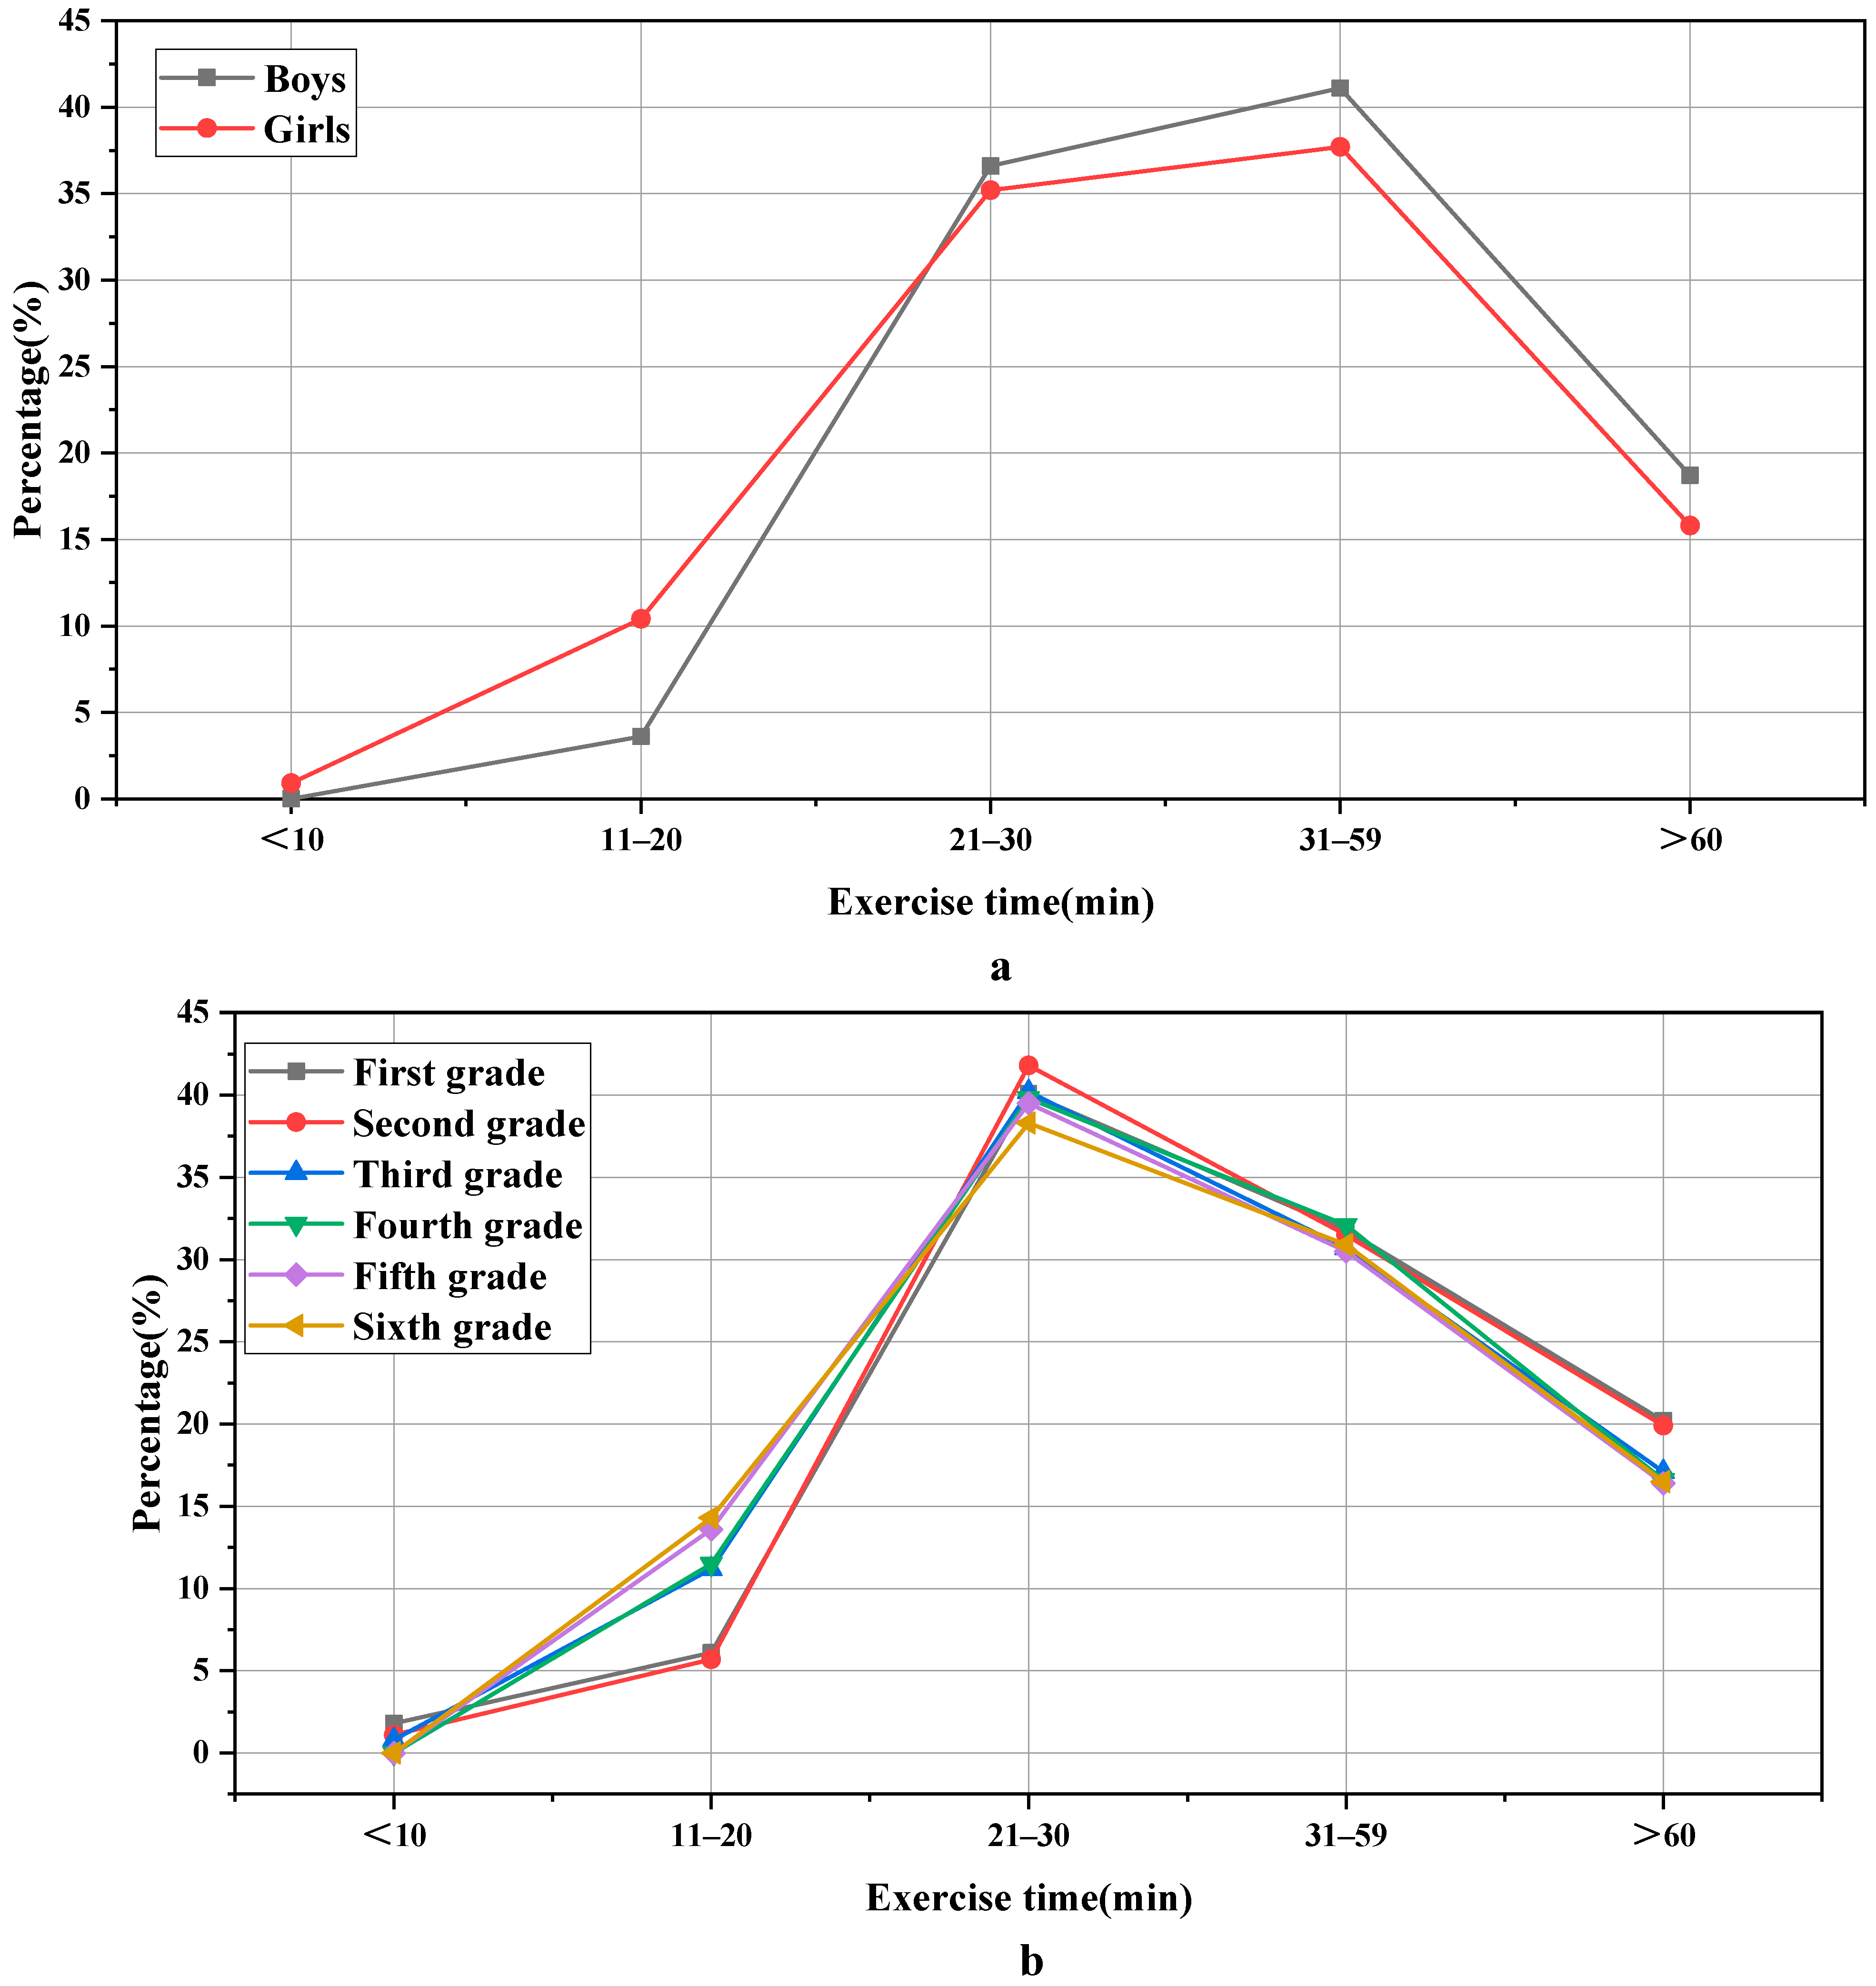
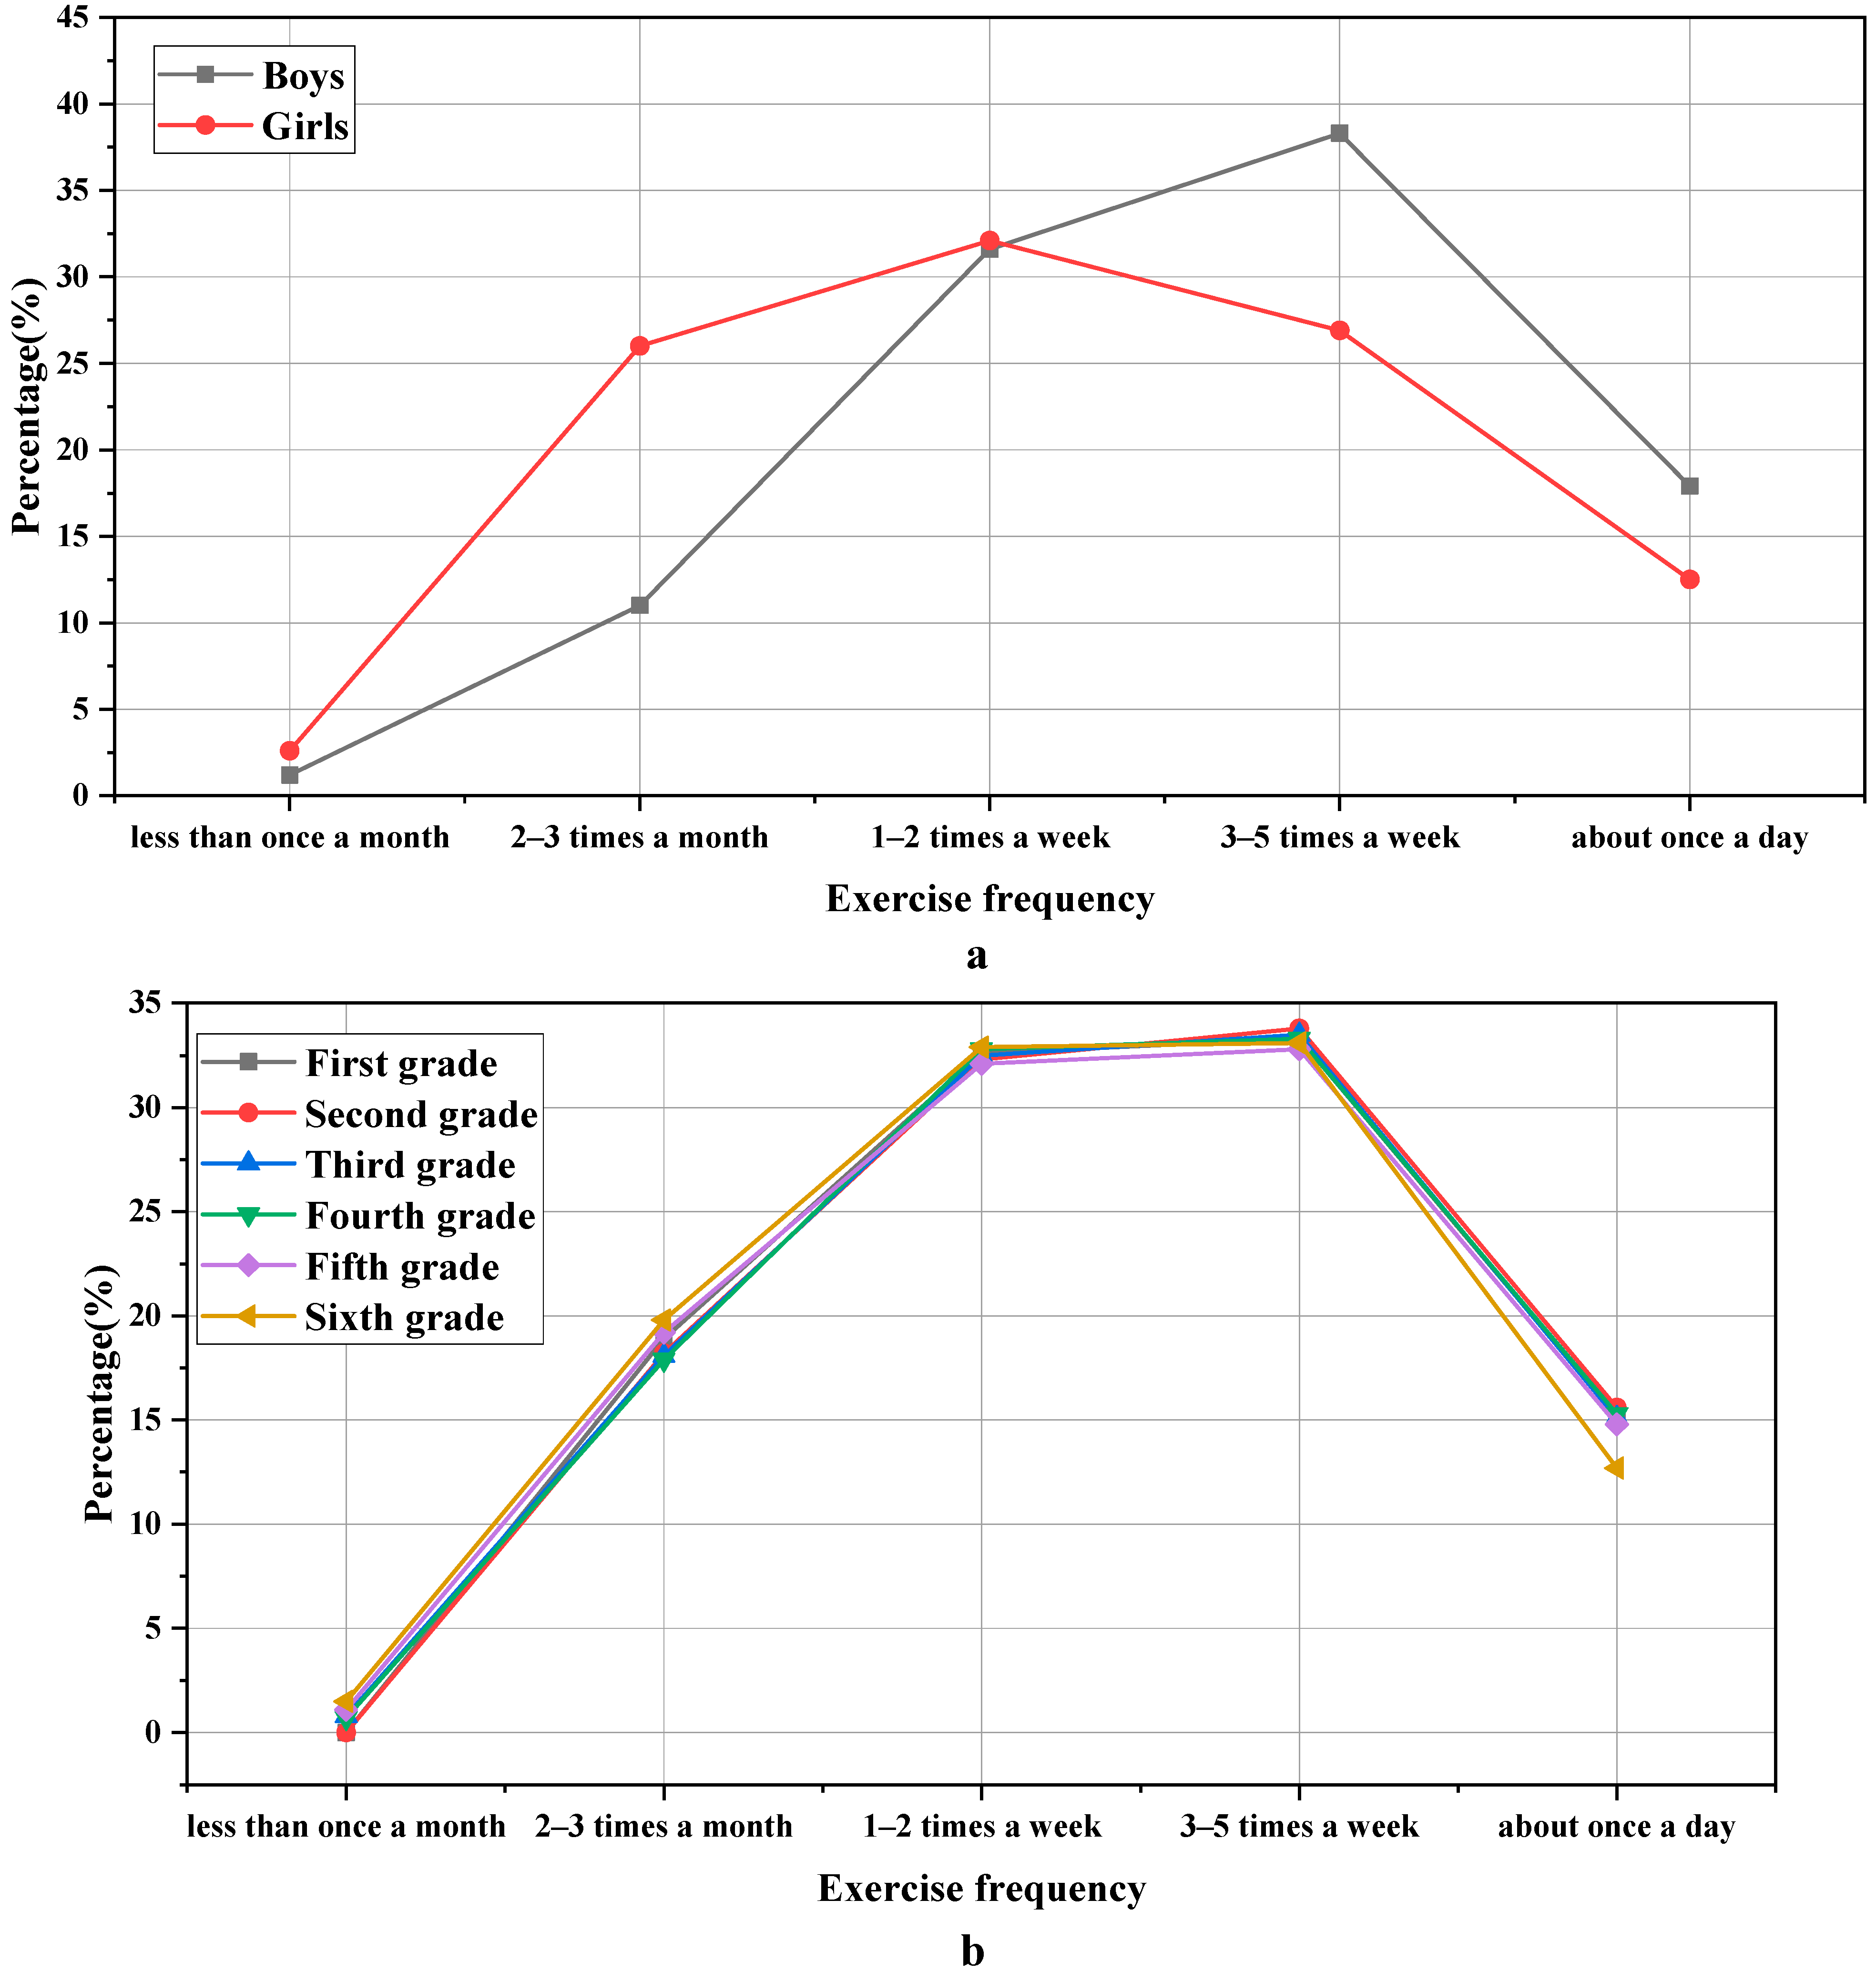
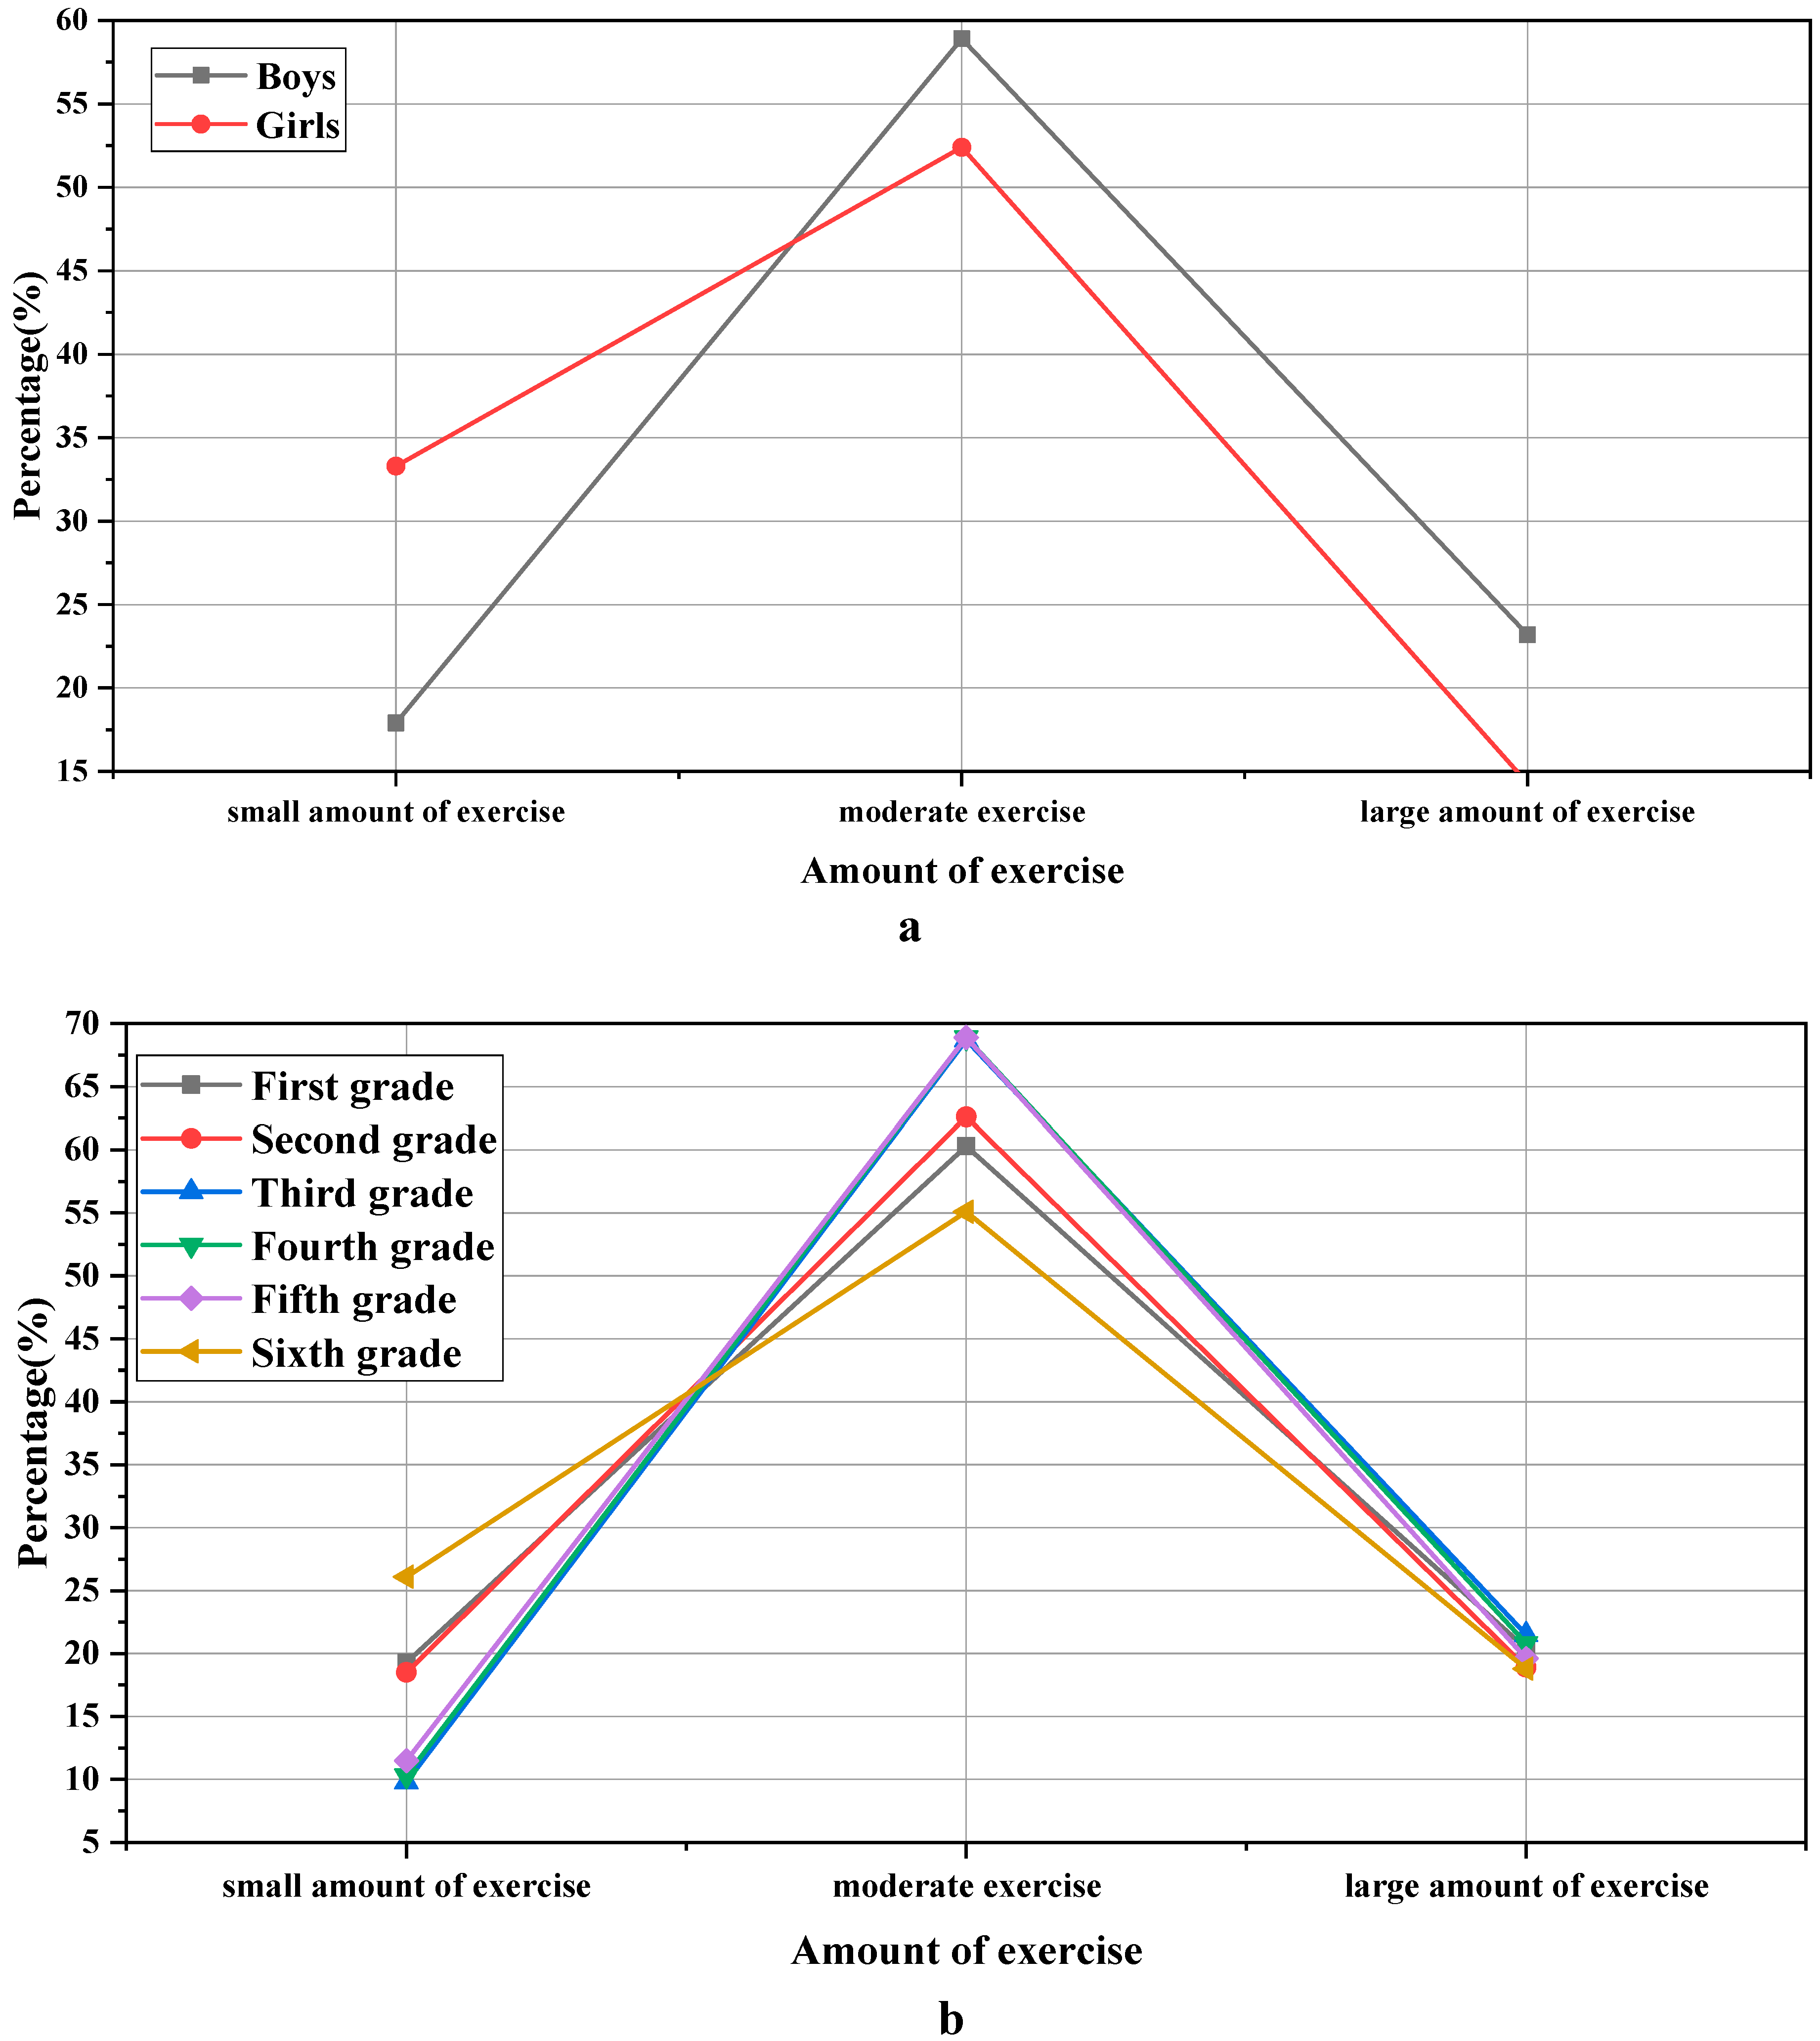
3.1. Description of the Basic Situation of Primary School Students Participating in Physical Exercise
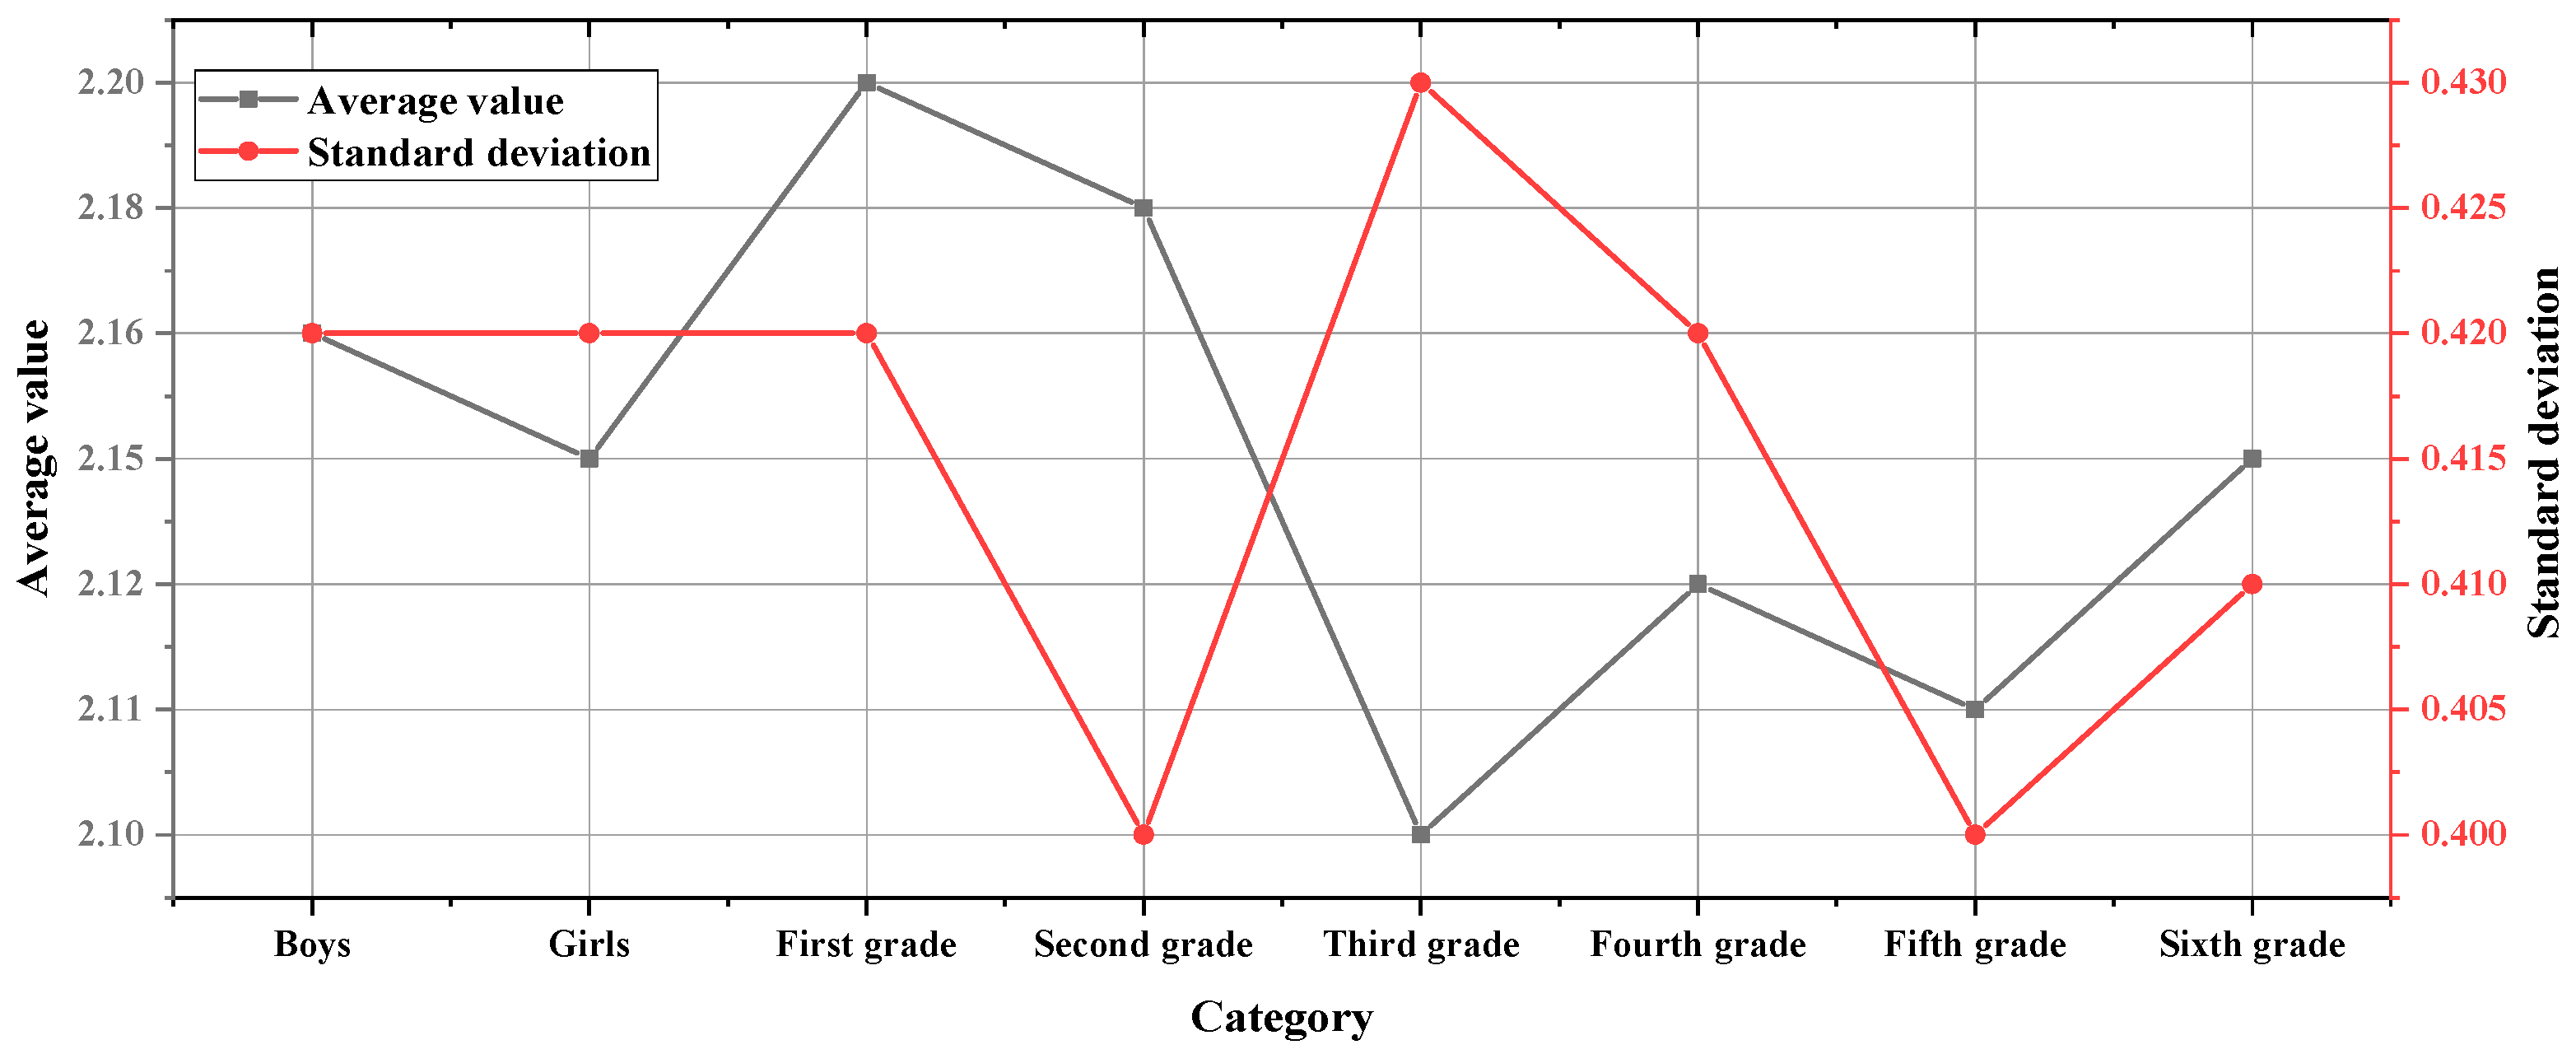
3.2. Analysis of the Overall Situation of the Positive Psychological Emotions of Primary School Students
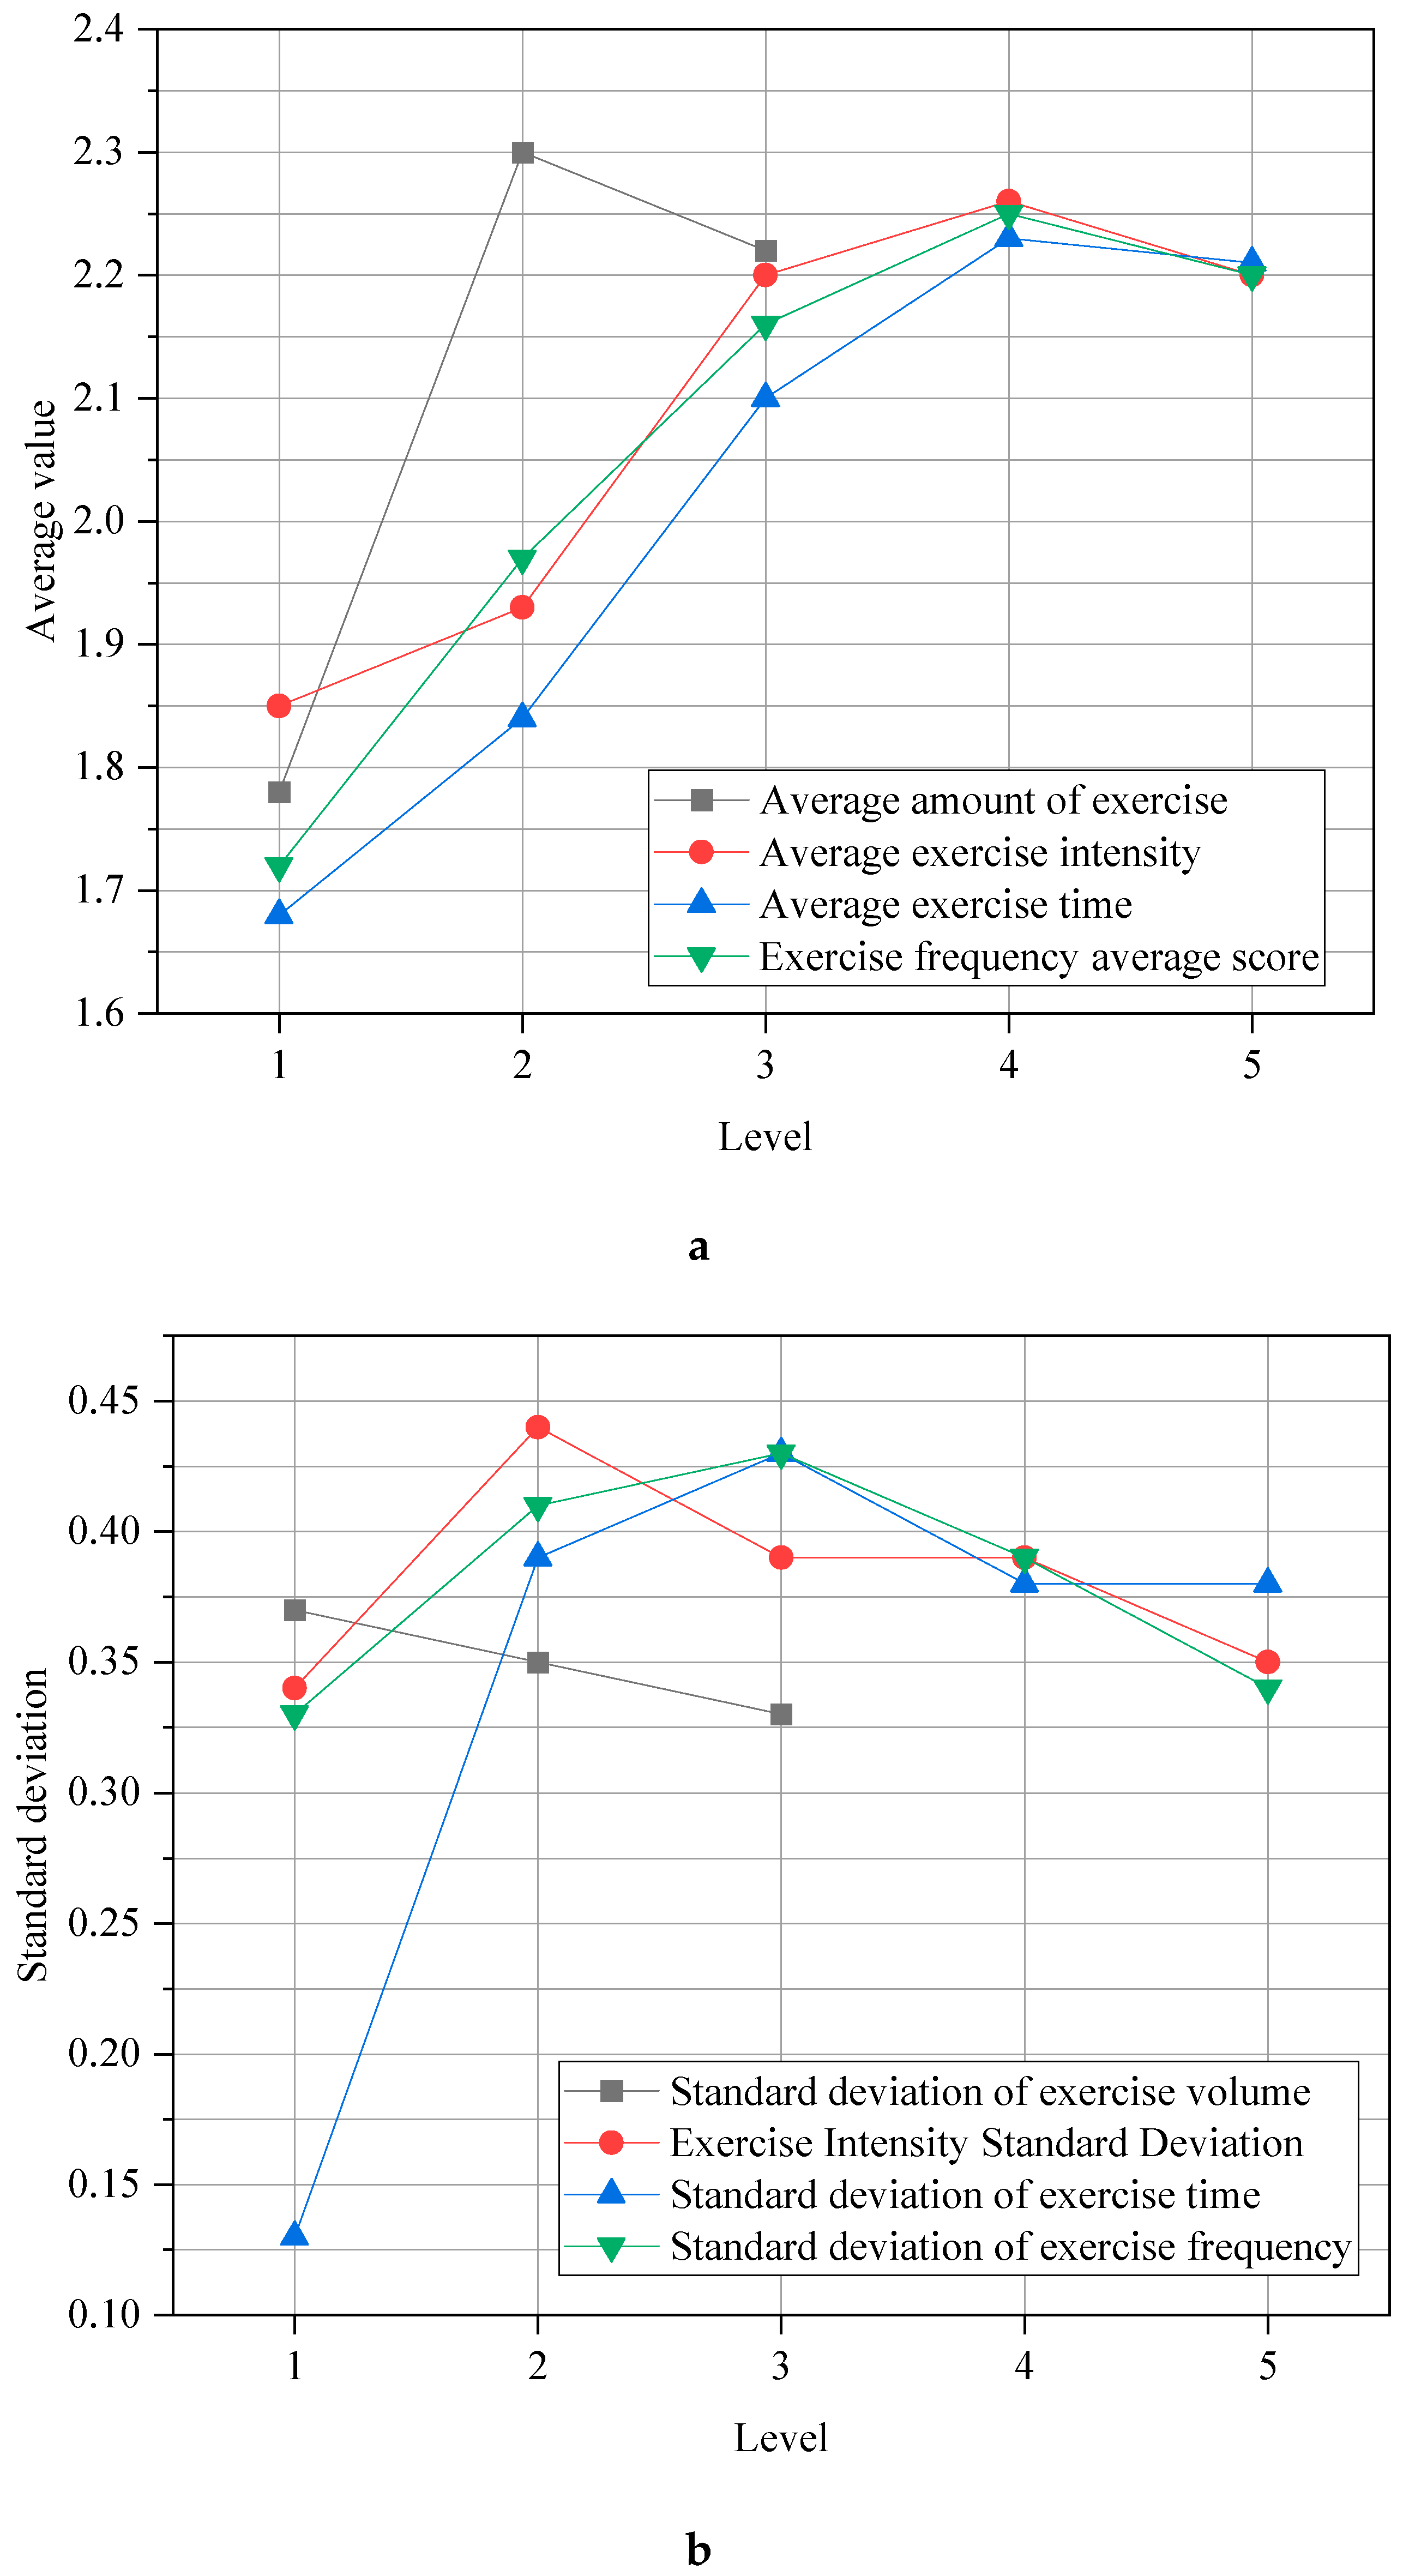
3.3. Analysis of the Effect of Physical Exercise on Positive Psychological Emotions
4. Conclusions
5. Limitations
Author Contributions
Funding
Institutional Review Board Statement
Informed Consent Statement
Data Availability Statement
Acknowledgments
Conflicts of Interest
References
- Guo, S. Strategies to improve the effectiveness of classroom teaching of morality and rule of law in primary schools. J. High. Educ. Res. 2021, 2, 342–345. [Google Scholar] [CrossRef]
- Zhu, X.; Bao, L.; Wang, H.; Zhao, N. The train of thought and strategy of chinese school physical education to cultivate unique minority students’ motor quotient in yunnan. Adv. Phys. Educ. 2021, 11, 490. [Google Scholar] [CrossRef]
- Klaperski, S.; Fuchs, R. Investigation of the stress-buffering effect of physical exercise and fitness on mental and physical health outcomes in insufficiently active men: A randomized controlled trial. Ment. Health Phys. Act. 2021, 21, 100408. [Google Scholar] [CrossRef]
- Zhu, Z.; Chen, H.; Ma, J.; He, Y.; Sun, J. Exploring the relationship between walking and emotional health in china. Int. J. Environ. Res. Public Health 2020, 17, 8804. [Google Scholar] [CrossRef] [PubMed]
- Rahawi, N.S.; Gonzalez, A.; Bachmeier, E.E.; Morrissey, J.L.; Leininger, L.J. Evaluating students’ perceived stress, sleep quality, and physical activity in exercise is medicine on campus student-led health consultation program. J. Phys. Act. Res. 2021, 6, 72–77. [Google Scholar]
- Holzer, J.; Korlat, S.; Haider, C.; Mayerhofer, M.; Pelikan, E.; Schober, B.; Lüftenegger, M. Adolescent well-being and learning in times of COVID-19—A multi-country study of basic psychological need satisfaction, learning behavior, and the mediating roles of positive emotion and intrinsic motivation. PLoS ONE 2021, 16, e0251352. [Google Scholar] [CrossRef] [PubMed]
- Guyotte, K.W. Toward a philosophy of steam in the anthropocene. Educ. Philos. Theory 2020, 52, 769–779. [Google Scholar] [CrossRef]
- Sohsomboon, P.; Yuenyong, C. Strategies for teacher utilizing ethnography as a way of seeing for steam education. J. Phys. Conf. Ser. 2021, 1933, 012080. [Google Scholar] [CrossRef]
- Kartini, D.; Widodo, A. Exploring elementary teachers’, students’ beliefs and readiness toward steam education. Mimb. Sekol. Dasar 2020, 7, 54–65. [Google Scholar] [CrossRef]
- Song, J.B. Development of a steam education program using artificial intelligence tools for lower grades of elementary school. J. Digit. Contents Soc. 2020, 21, 2135–2142. [Google Scholar] [CrossRef]
- Kim, R.E.; Seo, Y.S. The difference in perception and demand in applying smart devices for steam education between early childhood teachers and elementary school teachers. Korean J. Child Educ. Care 2020, 20, 119–134. [Google Scholar] [CrossRef]
- Moss, R.H.; Conner, M.; O’Connor, D.B. Exploring the effects of positive and negative emotions on eating behaviours in children and young adults. Psychol. Health Med. 2020, 26, 457–466. [Google Scholar] [CrossRef] [PubMed]
- Ren, H.J.; Yang, Q.; Zhang, X. Relationship between college students’ physical activity and unhealthy psychological conditions. Aggress. Violent Behav. 2021, 12, 101640. [Google Scholar] [CrossRef]
- Her, E.S.; Kim, D.H.; Lee, S.M. The effect of restaurant environment on consumers’ healthy eating intentions: Focused on the mediating role of positive emotions. J. Tour. Leis. Res. 2020, 32, 265–283. [Google Scholar] [CrossRef]
- Kim, J.H.; Bock, G.W.; Sabherwal, R.; Kim, H.M. Spreading online rumors: The effects of negative and positive emotions. Asia Pac. J. Inf. Syst. 2020, 30, 1–20. [Google Scholar] [CrossRef]
- Barranca-Enríquez, A.; Romo-González, T.; López-Mora, G.; Sánchez-Silva, D.M. Positive education in college students: The effects of the “self-knowledge and soul care” workshop on the emotions and character strengths. Arch. De Med. 2021, 21, 386–402. [Google Scholar] [CrossRef]
- Lee, H.W.; Shin, J.T. The effect of preferred physical activity on emotion, stress and happiness of university student. Res. Danc. Phys. Educ. 2020, 4, 63–70. [Google Scholar] [CrossRef]
- Rodriguez-Hernandez, M.; Mcdonald, J.R.; Wadsworth, D.W. Continuous or intermittent walking, the effect on glycated hemoglobin in sedentary employees during 10-week intervention. Int. J. Phys. Educ. Fit. Sports 2021, 10, 24–33. [Google Scholar] [CrossRef]
- Dorontsev, A.V.; Kozlyatnikov, O.A.; Lapina, N.M.; Volobuev, A.L.; Ivanov, D.A. The state of health of students of physical education specialties with systematic available loads. Biomed. Pharmacol. J. 2021, 14, 979–984. [Google Scholar] [CrossRef]
- Chang, C.F.; Hsieh, H.H.; Huang, H.C.; Huang, Y.L. The effect of positive emotion and interpersonal relationships to adaptation of school life on high school athletic class students. Int. J. Environ. Res. Public Health 2020, 17, 6354. [Google Scholar] [CrossRef]
- Wang, K.; Luo, J.; Zhang, T.; Ouyang, Y.; Lu, Y. Effect of physical activity on drug craving of women with substance use disorder in compulsory isolation: Mediating effect of internal inhibition. Front. Psychol. 2019, 10, 1928. [Google Scholar] [CrossRef] [Green Version]
- Wang, K.; Yang, Y.; Zhang, T.; Ouyang, Y.; Luo, J. The relationship between physical activity and emotional intelligence in college students: The mediating role of self-efficacy. Front. Psychol. 2020, 11, 967. [Google Scholar] [CrossRef]
- Zhang, T.; Wang, K.; Qu, M.; Jiang, H.; Luo, J. The effect of physical activity on drug cravings of drug addicts with aids: The dual mediating effect of internal inhibition. Front. Psychol. 2020, 11, 2002. [Google Scholar] [CrossRef]
- Galvin, J.E.; Tolea, M.I.; Rosenfeld, A.; Chrisphonte, S. The quick physical activity rating (qpar) scale: A brief assessment of physical activity in older adults with and without cognitive impairment. PLoS ONE 2020, 15, e0241641. [Google Scholar] [CrossRef]
- Cordaro, D.T.; Bradley, C.; Zhang, J.W.; Zhu, F.; Han, R. The development of the positive emotion assessment of contentment experience (peace) scale. J. Happiness Stud. 2021, 22, 1769–1790. [Google Scholar] [CrossRef]
- Preece, D.A.; Becerra, R.; Hasking, P.; McEvoy, P.M.; Boyes, M.; Sauer-Zavala, S.; Chen, W.; Gross, J.J. The emotion regulation questionnaire: Psychometric properties and relations with affective symptoms in a United States general community sample. J. Affect. Disord. 2021, 284, 27–30. [Google Scholar] [CrossRef]
- Albert, F.A.; Malau-Aduli, A.; Crowe, M.J.; Malau-Aduli, B.S. The ‘price’ of physical activity referral schemes (pars): Stakeholders’ recommendations for delivering quality care to patients. Int. J. Environ. Res. Public Health 2021, 18, 8627. [Google Scholar] [CrossRef]
- Hackney, M.E.; Bay, A.A.; Jackson, J.M.; Nocera, J.R.; Huddleston, D.E. Rationale and design of the paired trial: Partnered dance aerobic exercise as a neuroprotective, motor, and cognitive intervention in parkinson’s disease. Front. Neurol. 2020, 11, 943. [Google Scholar] [CrossRef]
- Ramos-Galarza, C.; Acosta-Rodas, P.; Ramos, V. Psychometric properties of adhd rating scale in school context. Rev. Ecuat. Neurol. 2020, 28, 33–40. [Google Scholar]
- Canivez, G.L.; Embse, N.; Mcgill, R.J. Construct validity of the basc-3 teacher rating scales: Hierarchical exploratory factor analyses with the normative sample. Sch. Psychol. 2021, 36, 235–254. [Google Scholar] [CrossRef]
- Mekhrinigor, Y. Statistical Programs in The Teaching Of Physical Education Classes. Turk. J. Comput. Math. Educ. (TURCOMAT) 2021, 12, 354–356. [Google Scholar]


| Questions | Multiple Choice | |
|---|---|---|
| 1. How intense is your physical activity? (Test of training intensity) | ||
| A. Light exercise (such as walking, doing radio gymnastics, playing croquet, etc.) | ||
| B. Less intense sports of low intensity (such as recreational volleyball, table tennis, jogging, tai chi, etc.) | ||
| C. Moderate-intensity, more intense, and long-lasting exercise (such as cycling, running, playing table tennis, etc.) | ||
| D. High-intensity, but not long-lasting sports (such as more than half an hour of badminton, basketball, volleyball, tennis, football, etc.) | ||
| E. High-intensity long-lasting exercise with shortness of breath and sweating a lot (such as more than 1 h of running, aerobics, swimming, etc.) | ||
| 2. How many minutes do you do the above physical exercise? (Test for training time) | ||
| A. Less than 10 min | B. 11–20 min | C. 21–30 min |
| D. 31–59 min | E. More than 60 min | |
| 3. How often do you engage in the above physical activity? (Test of training frequency) | ||
| A. Less than once a month | B. 2–3 times a month | |
| C. 1–2 times a week | D. 3–5 times a week | |
| E. About once a day | ||
| The following are some adjectives that describe emotions. It doesn’t matter whether they are good or bad. Please choose the option that best matches your life experience according to your general life experience. | |||||
| Never | Rarely | Sometimes | Often | Always | |
| Interested | □ | □ | □ | □ | □ |
| Excited | □ | □ | □ | □ | □ |
| Strong | □ | □ | □ | □ | □ |
| Passionate | □ | □ | □ | □ | □ |
| Proudly | □ | □ | □ | □ | □ |
| Alert | □ | □ | □ | □ | □ |
| Inspired | □ | □ | □ | □ | □ |
| Determined | □ | □ | □ | □ | □ |
| Attentive | □ | □ | □ | □ | □ |
| Active | □ | □ | □ | □ | □ |
| Grades | Boys | Girls | Total |
|---|---|---|---|
| Grade 1 | 25 | 28 | 53 |
| Grade 2 | 22 | 29 | 51 |
| Grade 3 | 22 | 28 | 50 |
| Grade 4 | 12 | 20 | 32 |
| Grade 5 | 23 | 30 | 53 |
| Grade 6 | 18 | 23 | 41 |
| Positive Emotions | Amount of Exercise | Exercise Intensity | Exercise Time | Exercise Frequency |
|---|---|---|---|---|
| f | 197.272 *** | 26.518 *** | 17.909 *** | 20.854 *** |
| Amount of Exercise | Exercise Intensity | Exercise Time | Exercise Frequency | |
|---|---|---|---|---|
| Positive emotions | 0.403 | 0.250 | 0.221 | 0.238 |
| Calibration Variable | Predictor Variable | B | Beta | t | F | R | R2 |
|---|---|---|---|---|---|---|---|
| positive emotions | Constant term | 1.946 | - | 78.58 | 92.79 *** | 0.297 | 0.088 |
| Physical exercise | 0.007 | 0.297 | 9.63 |
Publisher’s Note: MDPI stays neutral with regard to jurisdictional claims in published maps and institutional affiliations. |
© 2022 by the authors. Licensee MDPI, Basel, Switzerland. This article is an open access article distributed under the terms and conditions of the Creative Commons Attribution (CC BY) license (https://creativecommons.org/licenses/by/4.0/).
Share and Cite
Yuan, Y.; Ji, X.; Yang, X.; Wang, C.; Samsudin, S.; Omar Dev, R.D. The Effect of Persistence of Physical Exercise on the Positive Psychological Emotions of Primary School Students under the STEAM Education Concept. Int. J. Environ. Res. Public Health 2022, 19, 11451. https://doi.org/10.3390/ijerph191811451
Yuan Y, Ji X, Yang X, Wang C, Samsudin S, Omar Dev RD. The Effect of Persistence of Physical Exercise on the Positive Psychological Emotions of Primary School Students under the STEAM Education Concept. International Journal of Environmental Research and Public Health. 2022; 19(18):11451. https://doi.org/10.3390/ijerph191811451
Chicago/Turabian StyleYuan, Yubin, Xueyan Ji, Xiaoming Yang, Chen Wang, Shamsulariffin Samsudin, and Roxana Dev Omar Dev. 2022. "The Effect of Persistence of Physical Exercise on the Positive Psychological Emotions of Primary School Students under the STEAM Education Concept" International Journal of Environmental Research and Public Health 19, no. 18: 11451. https://doi.org/10.3390/ijerph191811451
APA StyleYuan, Y., Ji, X., Yang, X., Wang, C., Samsudin, S., & Omar Dev, R. D. (2022). The Effect of Persistence of Physical Exercise on the Positive Psychological Emotions of Primary School Students under the STEAM Education Concept. International Journal of Environmental Research and Public Health, 19(18), 11451. https://doi.org/10.3390/ijerph191811451