1. Introduction
Infectious diarrhea is a preventable intestinal infectious disease, including cholera, dysentery, typhoid and paratyphoid and other infectious diarrheas (OIDs, defined as infectious diarrhea other than cholera, dysentery, typhoid or paratyphoid), but it is still a major public health problem in the world. According to the investigation of the World Health Organization, diarrheal disease causes about 1.8 million deaths every year [
1], and the incidence of infectious diarrhea is more serious in developing countries [
2,
3]. China is a large developing country with a vast territory and complex and diverse climate. Even though the Chinese government provided tremendous subsidies for medical care and attached great importance to public health education, China is still facing a huge burden of infectious diarrhea. The incidence rate of diarrhea in China ranks among the top 15 in the world [
4]. From January 2004 to December 2013, the annual incidence rate of infectious diarrhea accounted for 19.5% of the incidence rate of 45 recognized infectious diseases [
5]. Various studies have shown that infectious diarrhea poses a great threat to public health in all age groups, especially infants and young children, and has caused a heavy economic burden to the Chinese government.
Previous studies have found that the incidence rate of infectious diarrhea is closely related to the seasonal changes [
6,
7,
8,
9,
10], especially the meteorological conditions [
11]. A large number of studies have shown that an increase in temperature or relative humidity will increase the incidence rate of infectious diarrhea [
12,
13,
14,
15,
16]. Additionally, extreme weather events such as floods or extremely high temperatures have a great impact on infectious diarrhea in various places [
17,
18,
19]. For example, studies in Taiwan found that the influence of extremely high temperature on the incidence rate of infectious diarrhea is mainly reflected in children and the elderly, while the incidence rate of infectious diarrhea caused by relative humidity and extreme rainfall is mainly reflected in adults [
19]. Another study also showed that there is a significant positive correlation between the increase in the incidence rate of diarrhea and high temperature, high relative humidity and high accumulated rainfall 4 weeks before the date of visit [
20].
Although the potential influencing meteorological factors of infectious diarrhea have been fully confirmed, no study has focused on whether the impact of the same meteorological factors on the incidence rate of infectious diarrhea in different climate regions has changed and quantified these changes, and whether these changes may lead to the high incidence rate of infectious diarrhea in some climate regions. The objective of this study was to estimate and quantify the casual associations between climate factors and the incidence of various types of infectious diarrhea in different climate regions by using the incidence rate of infectious diarrhea and climate variables in 31 provinces of China from 2004 to 2018, after adding some social factors related to the incidence rate of infectious diarrhea to control the confounding.
4. Discussion
This study found that climate change will have a great impact on human health [
27]. Changes in temperature, humidity, rainfall and other climate factors will affect the incidence rate of influenza [
28], diarrhea [
29] and other infectious diseases [
30], thus affecting public health and bringing financial burden to relevant government departments. Many studies have used the Poisson regression model to describe the incidence rate and hospitalization rate of diarrhea [
29,
31]. In this study, we also used fixed-effect time series Poisson regression to fit the relationships between meteorological factors and the incidence rate of various types of infectious diarrhea in different climate zones, and added some social factors to the model to control the confounding. The results show that the meteorological factors in different climate regions had different effects on the incidence rate of various infectious diarrheas, revealing that there was a certain lag relationship between the weather conditions and the incidence rate of infectious diarrhea. In general, the monthly average temperature had a positive correlation with all types of infectious diarrhea, which is consistent with previous studies [
31,
32,
33]. At the same time, we found that extreme weather had a strong impact on the incidence rate of different infectious diarrheas in some climate regions. For example, extreme rainfall had a strong negative influence on the incidence rate of dysentery in the alpine plateau area, while extreme sunshine duration had an intense positive effect on the incidence rate of dysentery in the alpine plateau area and on the incidence rate of typhoid and paratyphoid in the temperate region.
This study revealed several important findings. First, the results quantify the impact of meteorological factors in different climate regions of China on different types of infectious diarrhea. The study found that temperature had a positive effect on all types of infectious diarrhea, which is not only consistent with previous studies [
31,
32,
33], but also consistent with the pattern of high incidence rate of infectious diarrhea in summer and autumn. Second, the inclusion of extreme weather in the model allowed us to find that extreme rainfall and extreme sunshine duration had an intense impact on infectious diarrhea in temperate and alpine plateau areas, providing a scientific basis for policy makers to better prevent and control infectious diarrhea when facing extreme weather conditions. Third, the impact of climate change on the incidence rate of infectious diarrhea is indirectly caused in various other ways, so this study found that the impact of climate variables on the incidence rate of infectious diarrhea had a certain time lag. Zhang et al. [
31] found that the impact of maximum and minimum temperature on the incidence rate of diarrhea had a 0-month lag time in Townsville with tropical climate, while the lag effects of rainfall on the incidence rate of diarrhea in Townsville was 3 months. Chou et al. [
19] showed that the impact of the highest monthly temperature and monthly relative humidity on the incidence rate of diarrhea in Taiwan had a 1-month lag, while extreme rainfall had a 2-month lag. These indicate that local climate conditions affect the impact of meteorological factors on the incidence rate of infectious diarrhea, and strategies for preventing and controlling infectious diarrhea should be adapted to local conditions. The results of the meta-analysis also indicate that there is no consistency between individual effects of different provinces even in the same climate region. There are many reasons explaining this phenomenon, such as the differences in climate, social development, personal health level and so on among various provinces. These emphasize again that the prevention policy for infectious diarrhea should be adjusted according to the local special conditions.
The causal association between infectious diarrhea and meteorological conditions can be explained by pathogen activity. Infectious diarrhea is easily caused by microorganisms, which is closely related to environmental conditions [
34,
35]. Changes in rainfall and temperature are related to fecal contamination [
36], which is the direct cause of infectious diarrhea [
37]. Extreme rainfall and extreme sunshine duration may affect human behavior patterns and even lead to floods or droughts and other disasters, leading to population displacement and subsequent health problems [
36]. Meanwhile, the causal association between meteorological factors and infectious diarrhea is affected by many confounding factors, such as personal hygiene, latrine utilization, water availability and quality, which are also very important factors affecting the incidence rate of infectious diarrhea. In this paper, the fixed-effect model was used to fit the relationship between the incidence rate of infectious diarrhea and the meteorological factors in various climatic regions, and the addition of some social factors in the model could control confounding to a certain extent. However, the model could not include all possible confounding factors, so the parameter estimation results in this paper are only approximate estimates of the changes in the incidence rate of infectious diarrhea caused by meteorological factors. The findings would be more convincing if the same results as those in this paper could be obtained in populations with different potential confounding patterns but the same or similar exposure patterns [
38].
This study had several limitations. First, this study only obtained the monthly incidence rate of infectious diarrhea and the monthly data of meteorological factors rather than the daily data, and could not more accurately analyze the lag effect of climate factors on the incidence rate of infectious diarrhea. Additionally, the article used provincial data rather than county/district-level or the prefecture-level data, so we were unable to conduct a more detailed analysis, and the results lack certain reliability. More detailed data about meteorological factors and the incidence of infectious diarrhea are needed. Second, the method of using the monthly meteorological data of the provincial capital city to represent the monthly meteorological data of the whole province was not rigorous enough, but since we lacked more detailed meteorological data, there was no way to verify the rationality of this method with actual data. In the future, we will strive to obtain more detailed meteorological data to further confirm our findings. Third, compared with temperate and subtropical monsoon regions, there are few data for alpine plateau and tropical monsoon regions, which leads to a low R
2, and the impact of meteorological factors on infectious diarrhea in these two climate regions cannot be studied thoroughly. According to the existing research, extremely high or low temperatures and rainfall will affect the incidence rate of infectious diarrhea in Townsville with tropical climate [
31]. Additionally, extremely high temperatures and more sunshine before the monsoon will increase the first summit of infectious diarrhea in the tropical region [
39]. Moreover, a study has shown that higher ambient temperatures will affect rainfall, thus increasing the risk of diarrhea in rural areas in southern India [
40]. These provide a good direction and basis for our future research. However, there are few studies focusing on the relationship between the incidence rate of infectious diarrhea and meteorological factors in alpine plateau climate areas. More data on these two climate regions, especially on alpine plateau climate areas, are required for further research in the future. In addition, the incidence rate of cholera in China is very low and does not show obvious periodicity, which makes it difficult to study the environmental impact factors of cholera and achieve good representative results. Additionally, social factors are also important factors affecting the incidence rate of infectious diarrhea. The six social factors considered in this paper are far from enough. As this article involves multiple cities, we temporary could not obtain all relevant social factor data for this research area. We believe that this is also one of the main reasons why the meta-analysis showed that the individual effects of different provinces in the same climate region were statistically significant. In the future, more relevant social factors can be incorporated into the model to obtain more accurate results. Finally, in ecological research, it is difficult to control confounding factors, link individual outcome events with individual exposure or co-variate history and determine causality. Moreover, if the background risk distribution (in this study, this refers to other factors affecting the incidence rate of infectious diarrhea, such as the various social factors mentioned above) is not fully controlled, the ecological study may reach a spurious association [
41]. However, it is very difficult to control the background risk distribution in the ecological research of multiple regions, because the interactions between the factors in different regions vary. In this study, Spearman correlation analysis was used to screen the meteorological factors in order to minimize the problem of multi-collinearity among variables, a fixed-effect model was used, and some social factors were included in the model to control some confounding factors to some extent. Additionally, we were very clear that these methods are not enough to achieve sufficiently reliable results. Thus, individual-level studies and more detailed research are needed in the future.

 and
and 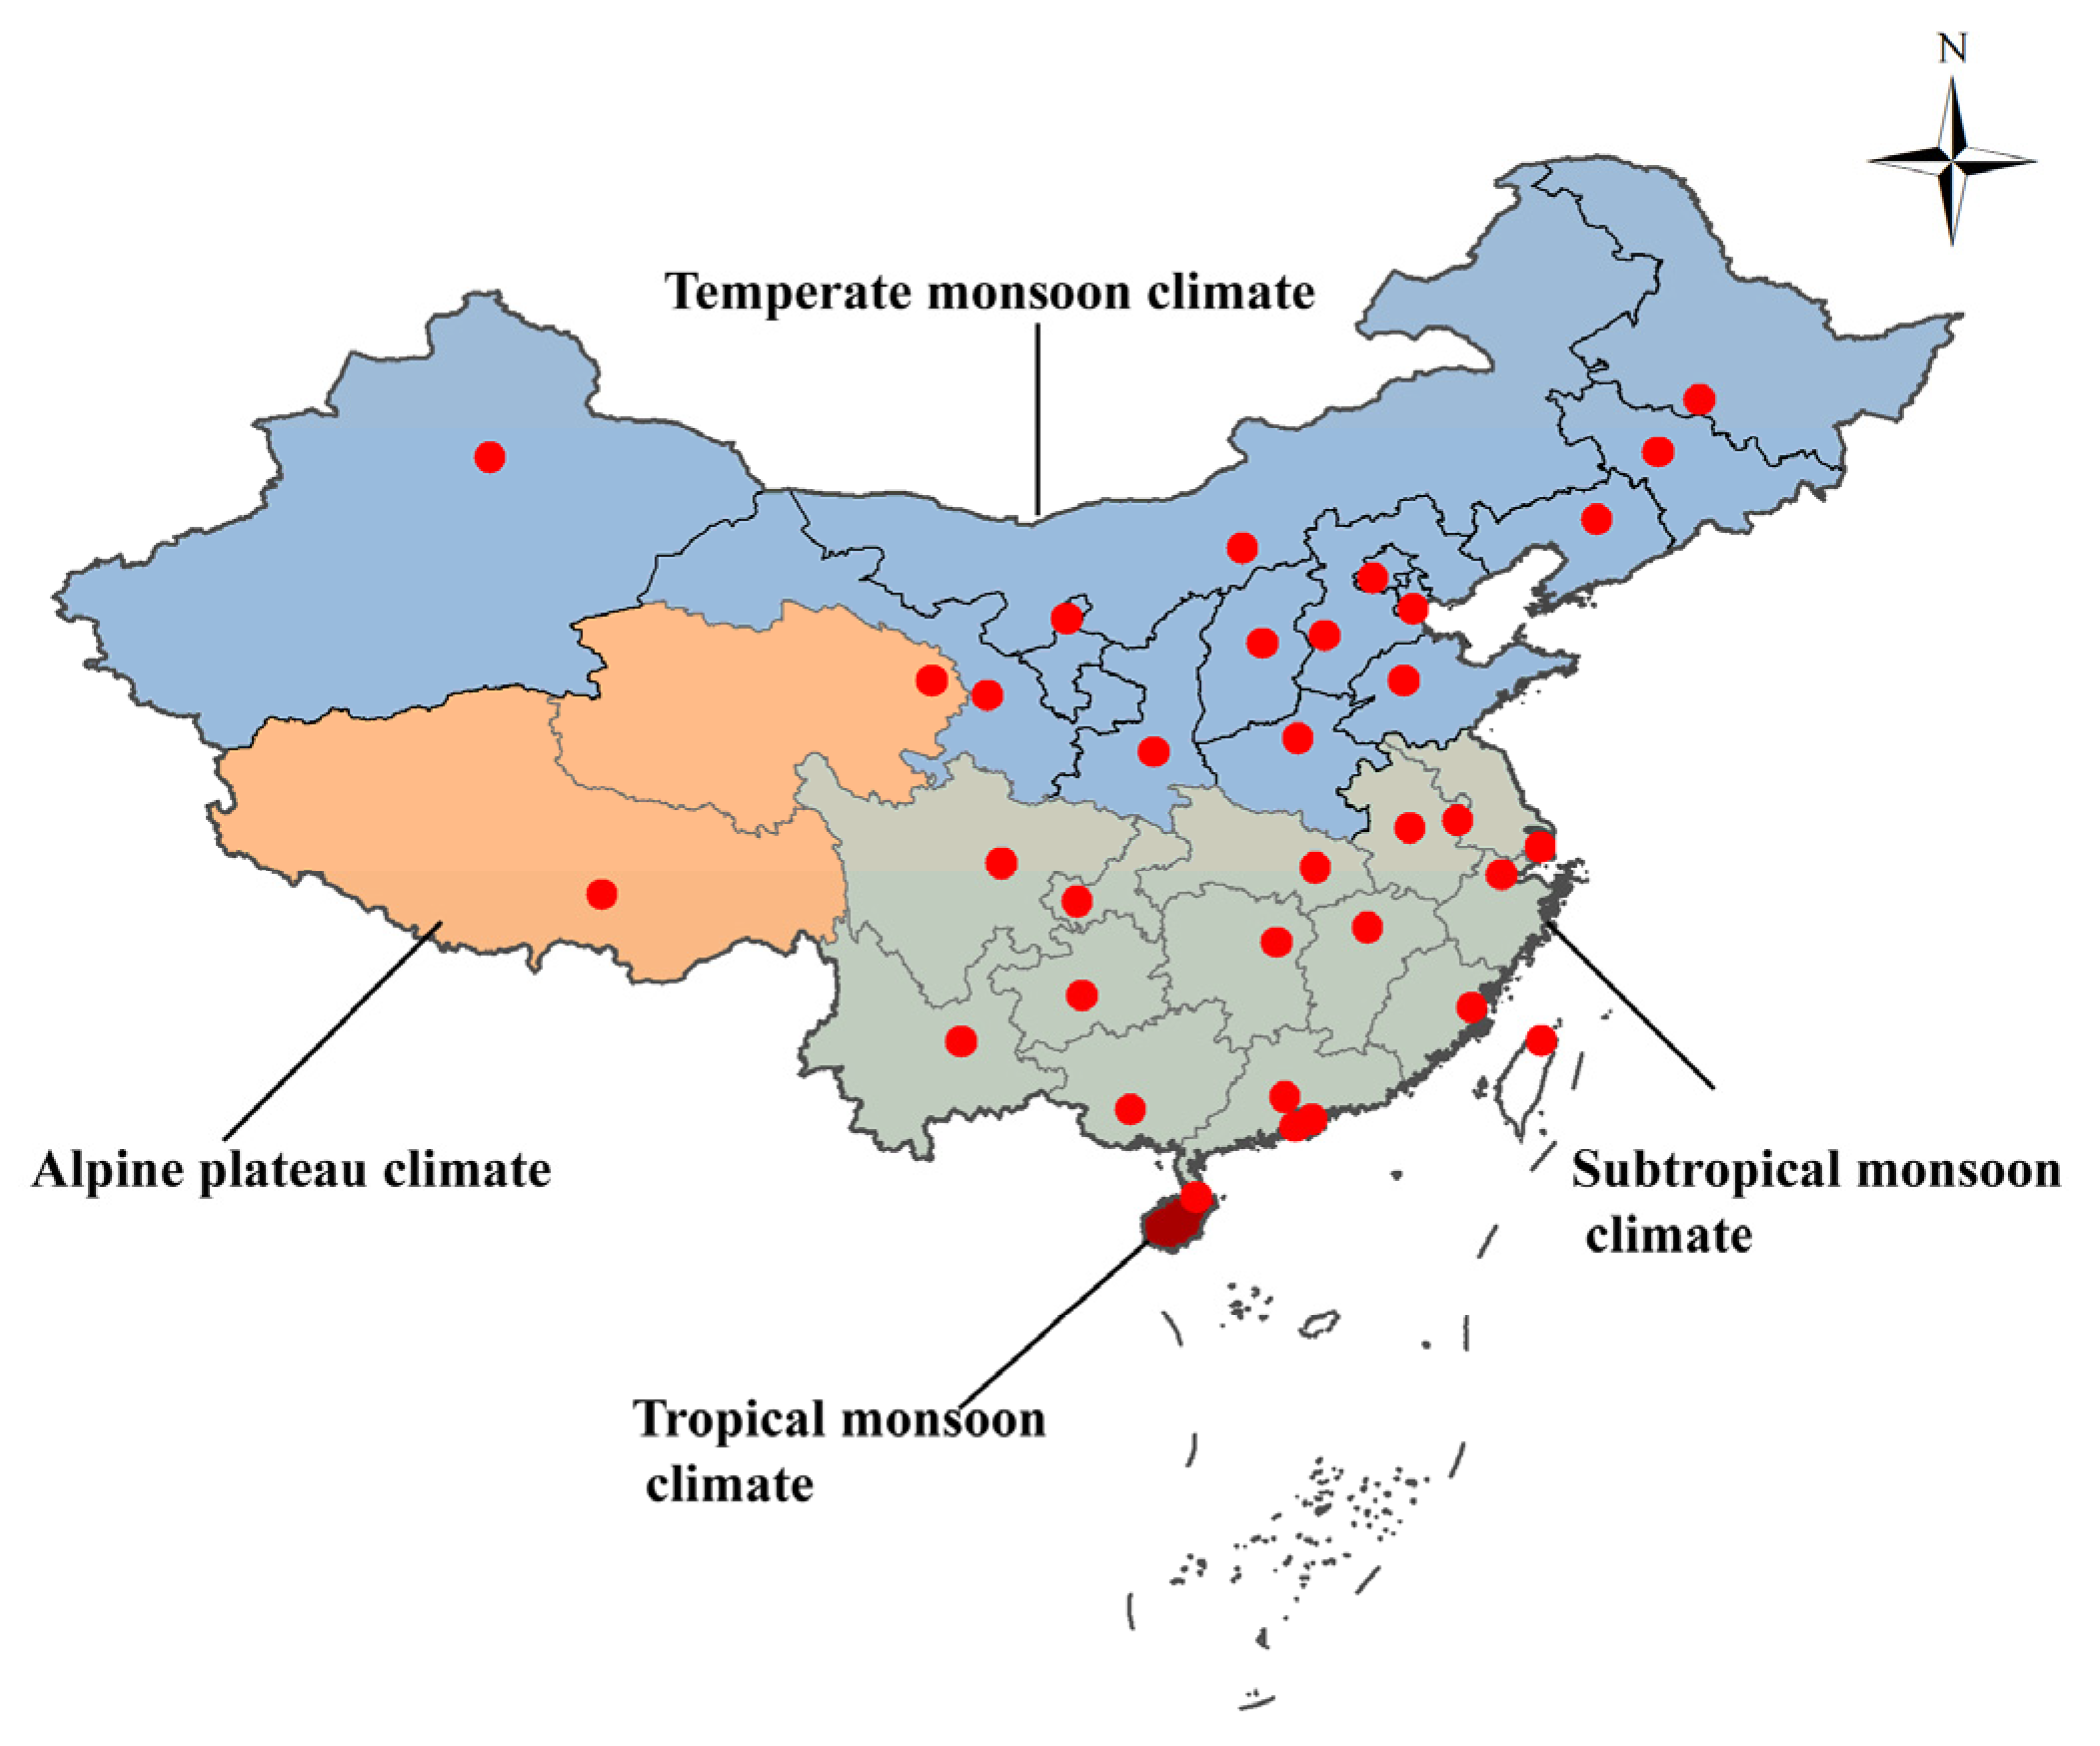

