
Inequality of Low Air Quality-Related Health Impacts among Socioeconomic Groups in the World of Work


Abstract
:1. Introduction
2. Materials and Methods
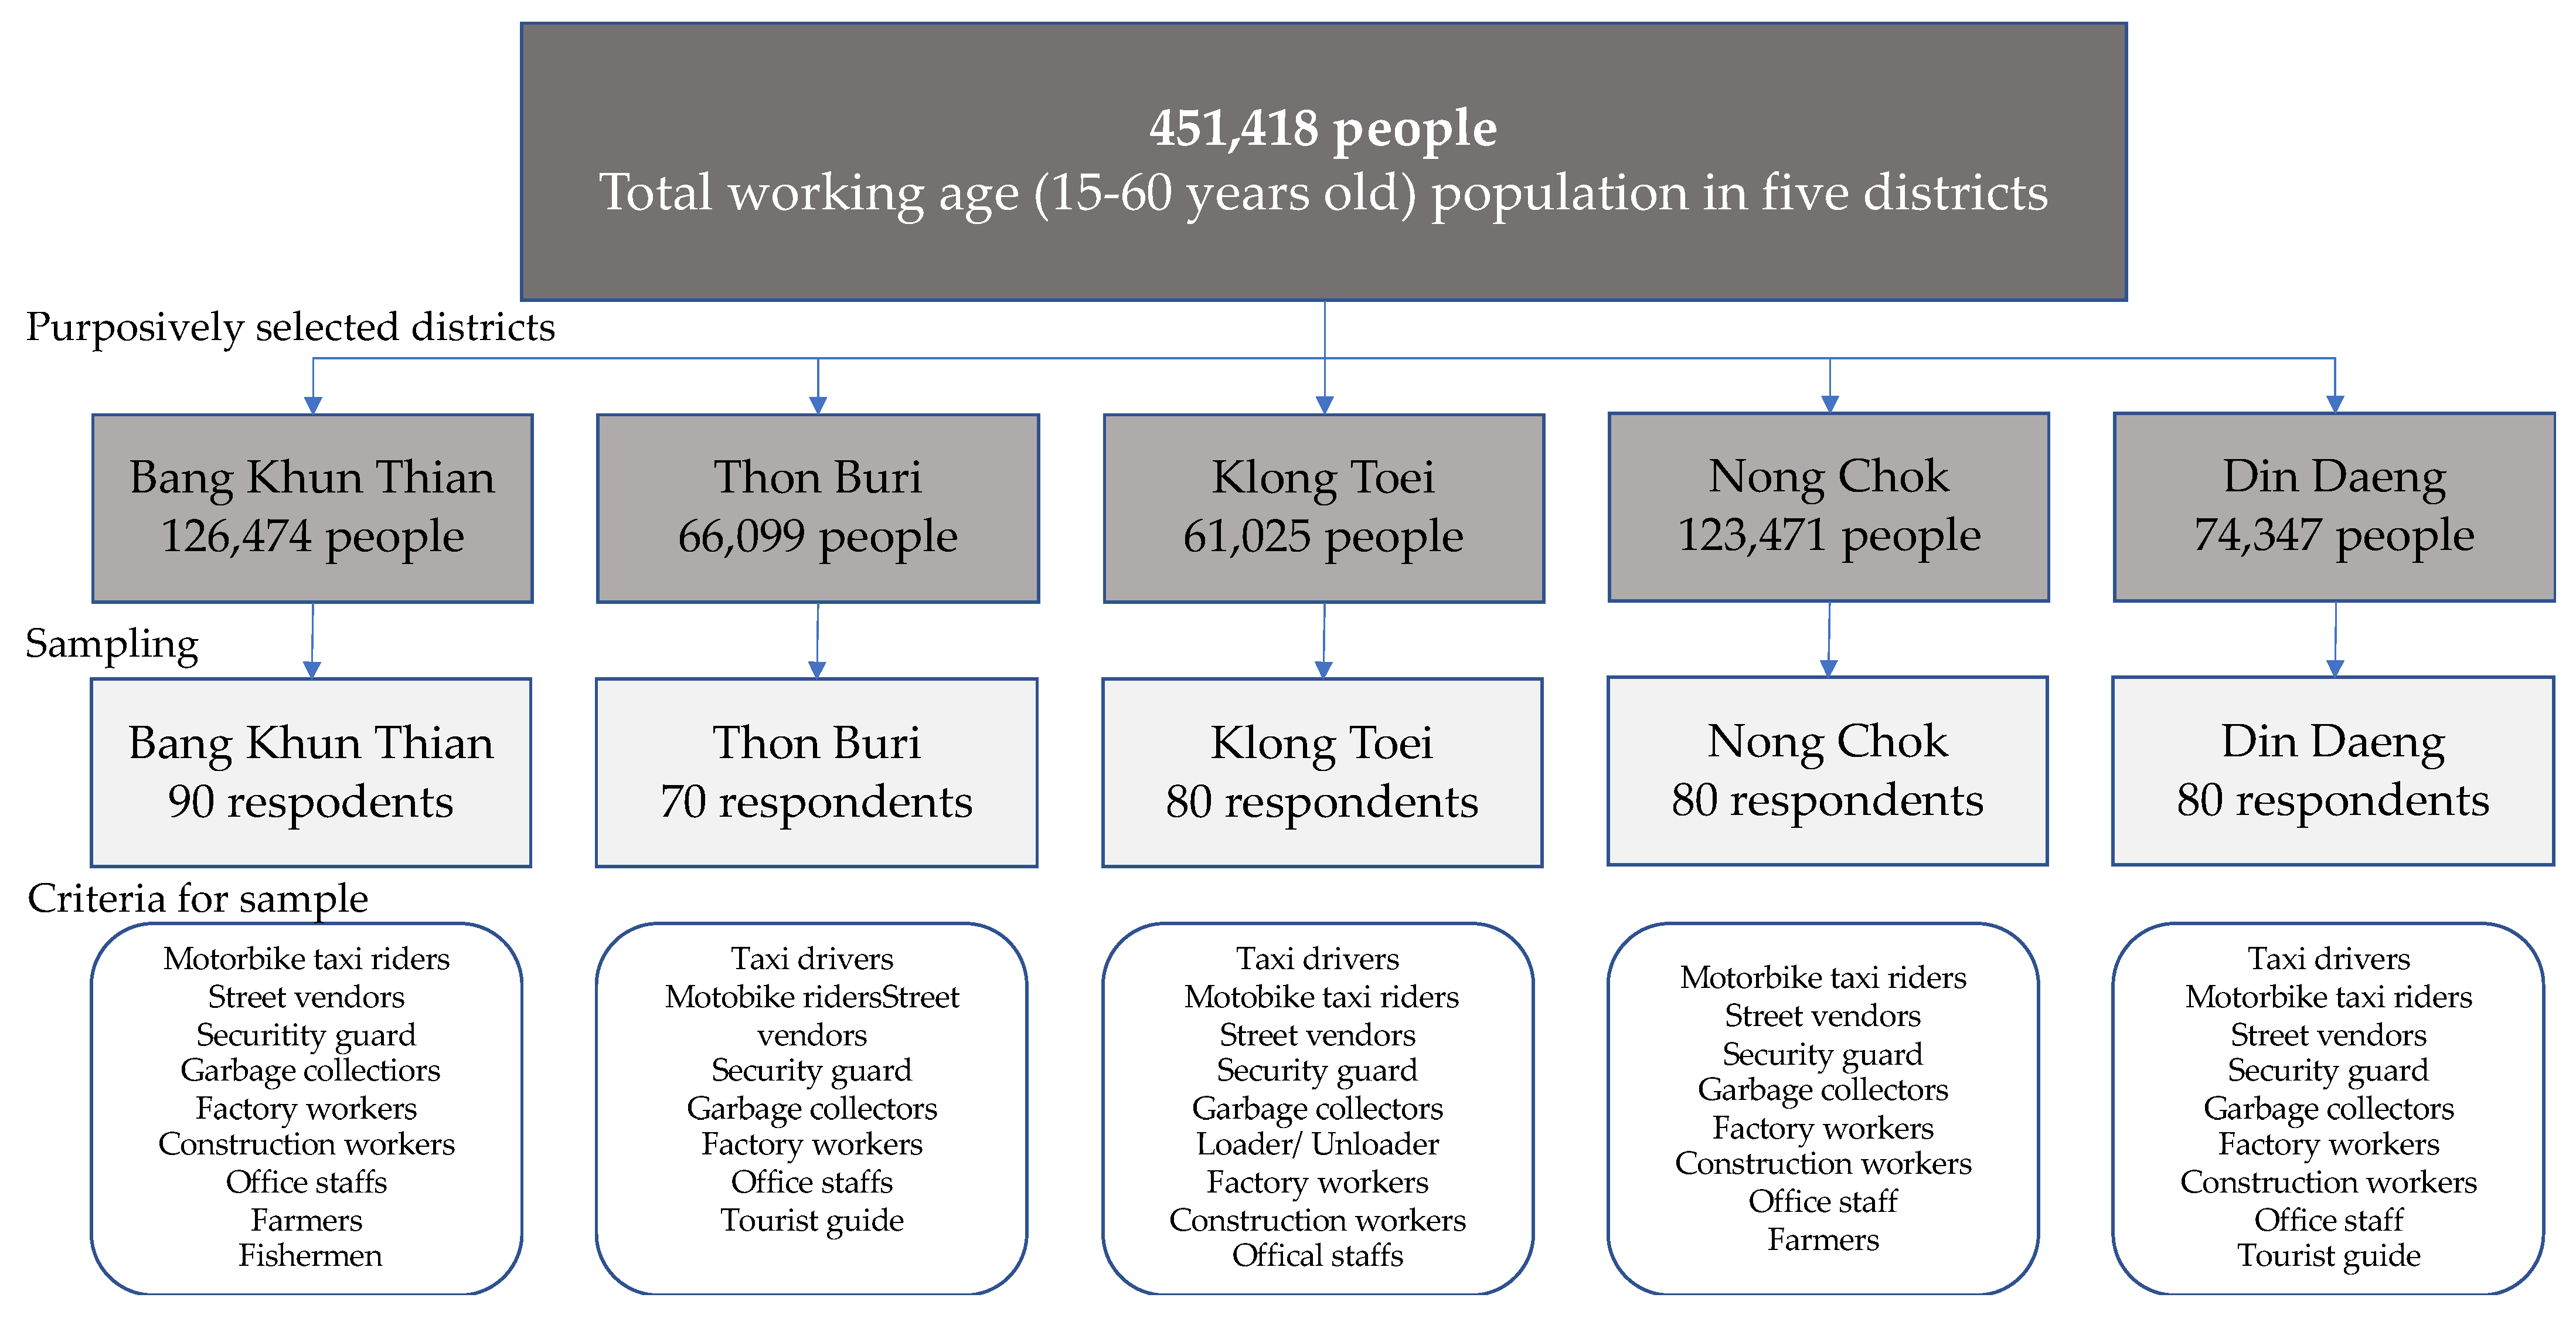
2.1. The Study Area
2.2. Data Collection
2.3. Data Analysis
3. Results
3.1. Socio-Economic and Demographic Characteristics of the Respondents
3.2. Socio-Economic Groups’ Perceptions of Air Quality in Bangkok
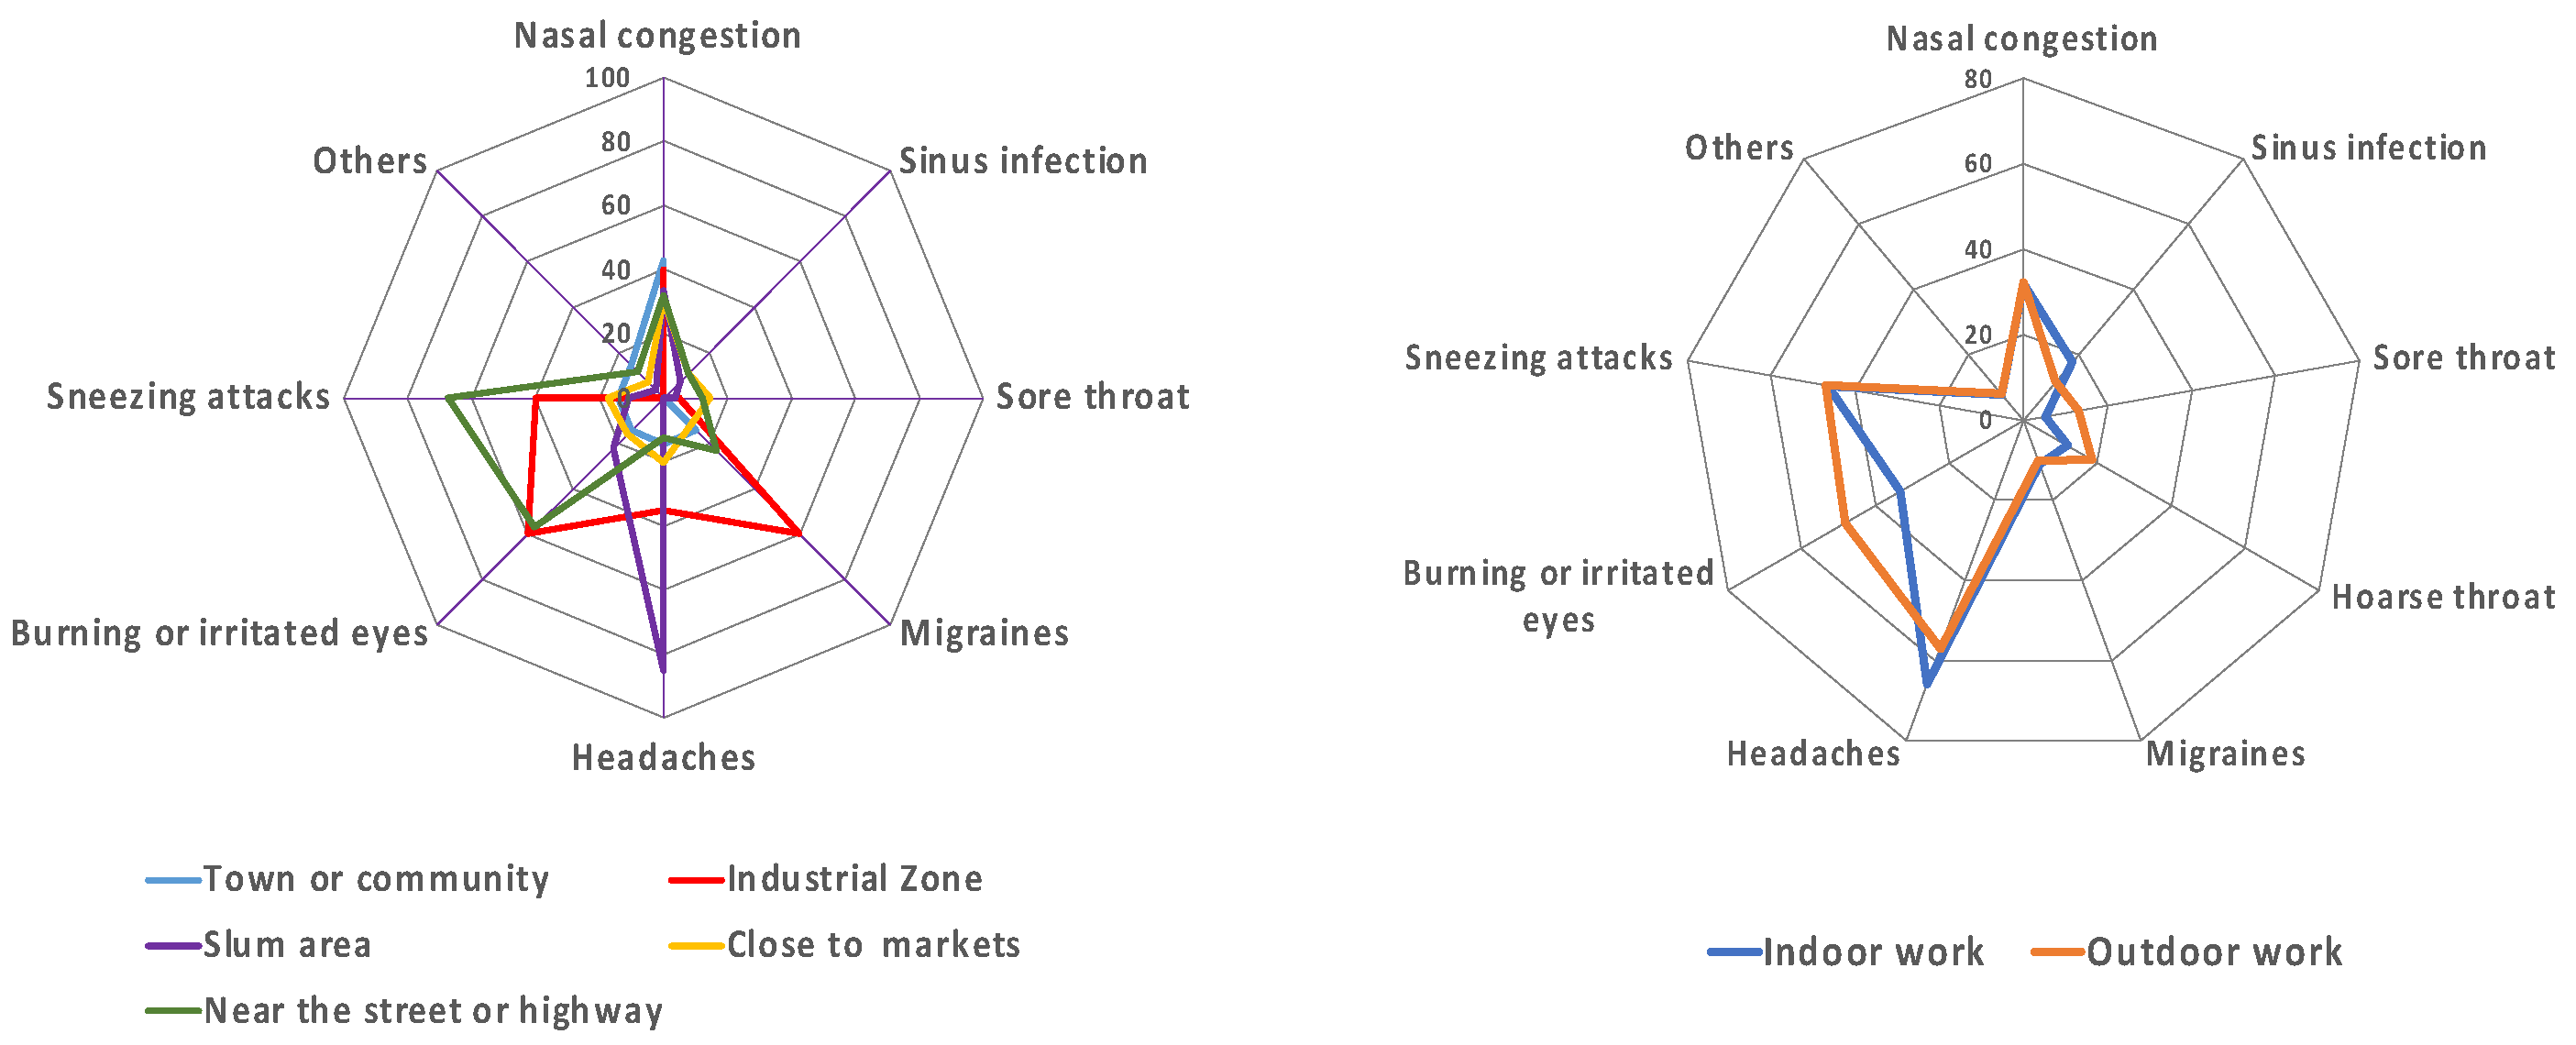
3.3. Low Air Quality-Related Health Symptoms among Urban Working Locations
3.4. Low Air Quality-Related Health Symptoms among Different Socio-Economic Groups
3.5. Factors Influencing Declared Health Symptoms among Socio-Economic Groups
4. Discussion
4.1. Symmetry and Asymmetry between Air Quality-Monitoring Data and Different Socio-Economic Groups’ Health Symptoms and Perception of Air Quality
4.2. Inequalities of Low Air Quality-Related Health Impacts among Socioeconomic Groups in the World of Work
5. Conclusions
Author Contributions
Funding
Institutional Review Board Statement
Informed Consent Statement
Data Availability Statement
Acknowledgments
Conflicts of Interest
References
- UNESCAP. On Environmental Degradation and Its Impact on Inequality in Asia and the Pacific; ESCAP: Bangkok, Thailand, 2018. [Google Scholar]
- Kim, Y.; Knowles, S.; Manley, J.; Radoias, V. Long-run health consequences of air pollution: Evidence from Indonesia’s forest fires of 1997. Econ. Hum. Biol. 2017, 26, 186–198. [Google Scholar] [CrossRef] [PubMed] [Green Version]
- Kim, Y.; Manley, J.; Radoias, V. Air pollution and long term mental health. Atmosphere 2020, 11, 1355. [Google Scholar] [CrossRef]
- Currie, J.; Zivin, J.G.; Mullins, J.; Neidell, M. What Do We Know About Short- and Long-Term Effects of Early-Life Exposure to Pollution? Annu. Rev. Resour. Econ. 2014, 6, 217–247. [Google Scholar] [CrossRef] [Green Version]
- Dockery, D.W.; Pope, C.A., 3rd; Xu, X.; Spengler, J.D.; Ware, J.H.; Fay, M.E.; Ferris, B.G., Jr.; Speizer, F.E. An association between air pollution and mortality in six U.S. cities. N. Engl. J. Med. 1993, 329, 1753–1759. [Google Scholar] [CrossRef] [PubMed] [Green Version]
- Ghorani-Azam, A.; Riahi-Zanjani, B.; Balali-Mood, M. Effects of air pollution on human health and practical measures for prevention in Iran. J. Res. Med. Sci. 2016, 21, 65. [Google Scholar] [CrossRef]
- IQAir. 2021 World Air Quality Report: Region & City PM2.5 Ranking. 2021. Available online: https://www.iqair.com/world-most-polluted-cities/world-air-quality-report-2021-en.pdf (accessed on 29 September 2022).
- Thongsawang, S.; Rehbein, B.; Chantavanich, S. Inequality, Sociocultures and Habitus in Thailand. Sojourn J. Soc. Issues Southeast Asia 2020, 35, 493–524. [Google Scholar] [CrossRef]
- Poonsab, W.; Vanek, J.; Carré, F. Informal Workers in Urban Thailand: A Statistical Snapshot; Women in Informal Employment Globalizing and Organizing: Manchester, UK, 2019. [Google Scholar]
- Mehrotra, S. The Impact of the Economic Crisis on the Informal Sector and Poverty in East Asia. Glob. Soc. Policy 2009, 9, 101–118. [Google Scholar] [CrossRef]
- Komin, W.; Thepparp, R.; Subsing, B.; Engstrom, D. Covid-19 and its impact on informal sector workers: A case study of Thailand. Asia Pac. J. Soc. Work. Dev. 2021, 31, 80–88. [Google Scholar] [CrossRef]
- Hajat, A.; Hsia, C.; O’Neill, M.S. Socioeconomic Disparities and Air Pollution Exposure: A Global Review. Curr. Environ. Health Rep. 2015, 2, 440–450. [Google Scholar] [CrossRef] [PubMed] [Green Version]
- Li, V.O.K.; Han, Y.; Lam, J.C.K.; Zhu, Y.; Bacon-Shone, J. Air pollution and environmental injustice: Are the socially deprived exposed to more PM2.5 pollution in Hong Kong? Environ. Sci. Policy 2018, 80, 53–61. [Google Scholar] [CrossRef]
- Ringquist, E.J. Assessing Evidence of Environmental Inequities: A Meta-Analysis. J. Policy Anal. Manag. 2005, 24, 223–247. [Google Scholar] [CrossRef]
- Meijer, M.; Röhl, J.; Bloomfield, K.; Grittner, U. Do neighborhoods affect individual mortality? A systematic review and meta-analysis of multilevel studies. Soc. Sci. Med. 2012, 74, 1204–1212. [Google Scholar] [CrossRef] [PubMed]
- Hölzl, S.E.; Veskov, M.; Scheibner, T.; Le, T.T.; Kleinschmit, B. Vulnerable socioeconomic groups are disproportionately exposed to multiple environmental burden in Berlin—implications– for planning. Int. J. Urban Sustain. Dev. 2021, 13, 334–350. [Google Scholar] [CrossRef]
- Manisalidis, I.; Stavropoulou, E.; Stavropoulos, A.; Bezirtzoglou, E. Environmental and Health Impacts of Air Pollution: A Review. Front. Public Health 2020, 8, 14. [Google Scholar] [CrossRef] [Green Version]
- Kim, Y.; Manley, J.; Radoias, V. Medium- and long-term consequences of pollution on labor supply: Evidence from Indonesia. IZA J. Labor Econ. 2017, 6, 5. [Google Scholar] [CrossRef] [Green Version]
- Hanna, R.; Oliva, P. The effect of pollution on labor supply: Evidence from a natural experiment in Mexico City. J. Public Econ. 2015, 122, 68–79. [Google Scholar] [CrossRef] [Green Version]
- Walters, R. Air Pollution and Invisible Violence. In Invisible Crimes and Social Harms; Davies, P., Francis, P., Wyatt, T., Eds.; Palgrave Macmillan: London, UK, 2014; pp. 142–160. [Google Scholar]
- Ramírez, A.S.; Ramondt, S.; Van Bogart, K.; Perez-Zuniga, R. Public Awareness of Air Pollution and Health Threats: Challenges and Opportunities for Communication Strategies To Improve Environmental Health Literacy. J. Health Commun. 2019, 24, 75–83. [Google Scholar] [CrossRef]
- Maione, M.; Mocca, E.; Eisfeld, K.; Kazepov, Y.; Fuzzi, S. Public perception of air pollution sources across Europe. Ambio 2021, 50, 1150–1158. [Google Scholar] [CrossRef] [PubMed]
- Finn, S.; O’Fallon, L.R. Environmental Health Literacy; Springer: Cham, Switzerland, 2018. [Google Scholar]
- Nguyen, T.P.L.; Pattanarsi, S. WASH, vulnerability, severity, and the response of urban slum dwellers to the COVID-19 pandemic. J. Water Sanit. Hyg. Dev. 2022, 12, 600–611. [Google Scholar] [CrossRef]
- Aiman, N.; Gulnaz, S.; Alena, M. The characteristics of pollution in the big industrial cities of Kazakhstan by the example of Almaty. J. Environ. Health Sci. Eng. 2018, 16, 81–88. [Google Scholar] [CrossRef]
- Kobza, J.; Geremek, M. Do the pollution related to high-traffic roads in urbanised areas pose a significant threat to the local population? Environ. Monit. Assess. 2016, 189, 33. [Google Scholar] [CrossRef] [Green Version]
- Leung, D.Y. Outdoor-indoor air pollution in urban environment: Challenges and opportunity. Front. Environ. Sci. 2015, 2, 69. [Google Scholar] [CrossRef] [Green Version]
- Forastiere, F.; Stafoggia, M.; Tasco, C.; Picciotto, S.; Agabiti, N.; Cesaroni, G.; Perucci, C.A. Socioeconomic status, particulate air pollution, and daily mortality: Differential exposure or differential susceptibility. Am. J. Ind. Med. 2007, 50, 208–216. [Google Scholar] [CrossRef]
- Martins, M.; Fatigati, F.; Vespoli, T.; Martins, L.; Pereira, L.; Martins, M.; Saldiva, P.; Braga, A. Influence of socioeconomic conditions on air pollution adverse health effects in elderly people: An analysis of six regions in Sao Paulo, Brazil. J. Epidemiol. Community Health 2004, 58, 41–46. [Google Scholar] [CrossRef] [PubMed]


| Categories (Codes) * | Respondent Number | Respondents % |
|---|---|---|
| Gender | ||
| Female (0) | 228 | 57.00% |
| Male (1) | 172 | 43.00% |
| Working age groups | ||
| 15–30 (0) | 103 | 25.80% |
| 31–45 (1) | 171 | 42.80% |
| Over 45 (2) | 126 | 31.50% |
| Education | ||
| Illiterate (0) | 0 | 0.00% |
| Primary school (1) | 31 | 34.40% |
| Secondary school (2) | 45 | 50.00% |
| High school (3) | 12 | 13.30% |
| Bachelor level (4) | 2 | 2.20% |
| Jobs | ||
| Office worker (0) | 66 | 16.50% |
| Street vendors (1) | 112 | 28.00% |
| Factory and construction worker (2) | 86 | 21.50% |
| Farmer/fishermen (3) | 61 | 15.30% |
| Service provider (4) | 75 | 18.80% |
| Work environment | ||
| Outdoor (0) | 153 | 38.30% |
| Indoor (1) | 247 | 61.80% |
| Types of employment | ||
| Informal (0) | 164 | 41.00% |
| Formal (1) | 236 | 59.00% |
| Income (bath) | ||
| 5000–10,000 baht | 72 | 18.00% |
| 10,000–15,000 baht | 251 | 62.75% |
| 15,000–20,000 baht | 77 | 19.25% |
| Working locations | ||
| Town or community (0) | 7 | 1.75% |
| Industrial area (1) | 20 | 5.00% |
| Slum area (2) | 27 | 6.75% |
| Close to markets (3) | 75 | 18.75% |
| Near the street or highway (4) | 227 | 56.75% |
| Working locations | ||
| Town or community (0) | 115 | 28.75% |
| Industrial area (1) | 10 | 2.50% |
| Slum area (2) | 143 | 35.75% |
| Close to markets (3) | 12 | 3.00% |
| Near the street or highway (4) | 120 | 30.00% |
| Chronic Cough | Wheezing (Except Colds) | Multiple Colds | Shortness of Breath | Nasal Congestion | Sinus | Sore Throat | Hoarse Throat | Migraine | Headaches | Burning Eyes | Sneezing Attacks | |
|---|---|---|---|---|---|---|---|---|---|---|---|---|
| Districts | β (SE) | β (SE) | β (SE) | β (SE) | β (SE) | β (SE) | β (SE) | β (SE) | β (SE) | β (SE) | β (SE) | β (SE) |
| Thon Buri a | ||||||||||||
| Bang Khun Thain | −0.022 (0.04) | −0.017 (0.04) | −0.029 (0.07) | −0.089 (0.07) | −0.308 (0.14) * | −0.078 (0.09) | −0.056 (0.08) | 0.042 (0.11) | 0.066 (0.09) | −0.497 (0.14) ** | 0.417 (0.13) *** | 0.438 (0.12) *** |
| Klong Toei | 0.017 (0.03) | 0.023 (0.03) | 0.077 (0.05) | 0.047 (0.04) | 0.080 (0.09) | −0.009 (0.06) | 0.139 (0.06) * | 0.122 (0.070 | 0.126 (0.06) * | −0.199 (0.10) * | 0..014 (0.09) | 0.120 (0.08) |
| Nong Chok | 0.079 (0.04) | 0.026 (0.04) | 0.243 (0.07) *** | 0.100 (0.07) | −0.028 (0.14) | −0.073 (0.09) | 0.177 (0.8) * | 0.251 (0.10) * | 0.152 (0.09) | −0.346 (0.14) * | 0.340 (0.13) *** | 0.337 (0.12) ** |
| Din Daeng | 0.000 (0.09) | 0.021 (0.08) | 0.016 (0.06) | 0.004 (0.06) | −0.084 (0.12) | −0.007 (0.08) | −0.039 (0.08) | 0.186 (0.09) * | 0.079 (0.08) | −0.150 (0.13) | 0.214 (0.03) | 0.681 (0.11) *** |
| Working location | ||||||||||||
| Town and community a | ||||||||||||
| Industrial zone | 0.002 (0.04) | 0.000 (0.04) | −0.061 (0.07) | −0.022 (0.07) | 0.066 (0.14) | −0.026 (0.09) | 0.086 (0.09) | −0.029 (0.11) | −0.135 (0.09) | −0.184 (0.15) | 0.264 (0.13) * | 0.292 (0.12) * |
| Slum areas | 0.013 (0.04) | 0.003 (0.04) | 0.040 (0.06) | −0.002 (0.06) | 0.055 (012) | 0.031 (0.08) | 00.080 (0.08) | 0.056 (0.09) | −0.117 (0.08) | 0.050 (0.13) | 0.091 (0.12) | 0.113 (0.11) |
| Close to market | 0.034 (0.04) | 0.042 (0.03) | 0.053 (0.05) | 0.036 (0.05) | 0.003 (0.11) | 0.055 (0.07) | 0.080 (0.07) | 0.059 (0.09) | −0.134 (0.07) | −0.033 (0.12) | 0.002 (0.10) | 0.143 (0.10) |
| Close to street/highways | 0.020 (0.03) | 0.000 (0.03) | −0.026 (0.05) | 0.012 (0.05) | −0.016 (0.10) | 0.050 (0.07) | 0.105 (0.06) | 0.082 (0.08) | −0.077 (0.07) | −0.120 (0.110 | 0.117 (0.100) | 0.236 (0.09) ** |
| Living location | ||||||||||||
| Town and community a | ||||||||||||
| Industrial zone | −0.060 (0.11) | 0–0.023 (0.10) | −0.138 (0.017) | −0.059 (0.17) | −0.308 (0.36) | −0.010 (0.23) | −0.109 (0.22) | −0.236 (0.27) | −0.064 (0.24) | −0.062 (0.37) | 0.062 (0.33) | −0.148 (0.31) |
| Slum areas | −0.02 (0.03)) | −0.022 (0.03) | 0.051 (0.05) | −0.015 (0.05) | 0.129 (0.10) | −0.042 (0.07) | 0.033 (0.06) | −0.002 (0.08) | −0.015 (0.07) | 0.115 (0.11) | 0.047 (0.10) | −0.040 (0.09) |
| Close to market | −0.018 (0.09) | (−0.011 (0.08) | −0.011 (0.013) | −0.007 (0.13) | 0.398 (0.28) | −0.087 (0.18) | 0.028 (0.17) | −0.016 (0.21) | −0.109 (0.18) | −0.345 (0.29) | 0.011 ((0.26) | 0.119 (0.24) |
| Close to street/highways | −0.041 (0.04) | 0.007 (0.03) | −0.036 (0.06) | 0.004 (0.06) | −0.009 (0.12) | −0.002 (0.08) | 0.047 (0.07) | −0.042 (0.09) | −0.028 (0.08) | 0.040 (0.12) | 0.021 (0.11) | −0.094 (0.10) |
| Age | 0.001 (0.00) | 0.000 (0.00) | 0.000 (0.00) | −0.001 (0.00) | 0.006 (0.00) * | −0.002 (0.00) | 0.001 (0.00) | 0.003 (0.00) | −0.003 (0.00) | 0.003 (0.00) | 0.000 (0.00) | 0.003 (0.00) |
| Gender | ||||||||||||
| Female a | ||||||||||||
| Male | 0.004 (0.02) | 0.000 (0.01) | −0.040 (0.03) | −0.030 (0.03) | 0.100 (0.05) | 0.003 (0.03) | −0.046 (0.03) | −0.067 (0.04) | 0.007 (0.03) | −0.010 (0.05) | −0.017 (0.5) | −0.006 (0.4) |
| Work environment | ||||||||||||
| Informal job a | ||||||||||||
| Indoor job | 0.021 (0.02) | 0.033 (0.02) | 0.05 (0.03)) | 0.018 (0.03) | 0.140 (0.07) * | −0.021 (0.05) | 0.010 (0.04) | −0.001 (0.05) | 0.044 (0.05) | 0.092 (0.07) | −0.114 (0.07) | 0.030 (0.06) |
| Types of employment sectors | ||||||||||||
| Informal sector work a | ||||||||||||
| Formal sector work | −0.056 (0.03) * | −0.045 (0.02) * | −0.101 (0.04) * | −0.113 (0.04) *** | −0.223 (0.08) *** | −0.146 (0.05) ** | −0.021 90.05) | −0.111 (0.06) | −0.072 (0.05) | −0.126 (0.08) | −0.109 (0.07) | −0.217 (0.07) ** |
| Income | 0.000 (0.02) | 0.000 (0.00) | 0.000 (0.00) | 0.000 (0.00) | 0.000 (0.00) | 0.000 (0.00) | 0.000 (0.00) | 0.000 (0.00) | 0.000 (0.00) | 0.000 (0.00) | 0.000 (0.00) | 0.000 (0.00) |
| Education | 0.009 (0.01) | −0.015 (0.01) | 0.010 (0.02) | −0.020 (0.02) | 0.046 (0.03) | −0.014 (0.02) | −0.008 90.02) | −0.003 (0.03) | −0.020 (0.020 | 0.016 (0.04) | 0.033 (0.03) | 0.044 (0.03) |
| Job types | ||||||||||||
| Office worker a | ||||||||||||
| Street seller | 0.012 (0.02) | −0.014 (.02) | 0.013 (0.04) | 0.022 (0.04) | 0.002 (0.08) | 0.107 (0.05) * | 0.002 (0.05) | −0.057 (0.06) | −0.001 (0.05) | −0.069 (0.08) | 0.109 (0.7) | −0.097 (0.07) |
| Factory/ Construction worker | 0.062 (0.03) * | 0.018 (0.02) | 0.085 (0.04) * | 0.077 (0.04) | 0.023 (0.09) | 0.126 (0.06) * | 0.101 (0.05) | 0.037 (0.07) | −0.007 (0.06) | −0.200 (0.09) * | 0.186 (0.8) * | 0.016 (0.07) |
| Farmer | 0.02 (0.04)) | 0.008 (0.04) | 0.006 (0.06) | 0.083 (0.06) | 0.050 (0.13) | 0.162 (0.08) * | 0.138 (0.08) | −0.042 (0.10) | 0.102 (0.08) | −0.079 (0.13) | 0.289 (0.12) * | −0.131 (0.11) |
| Service provider | 0.020 (0.03) | 0.054 (0.02) * | 0.068 (0.04) | 0.055 (0.04) | 0.123 (0.09) | 0.034 (0.06) | 0.182 (0.08) *** | 0.075 (0.07) | −0.000 (0.06) | −0.096 (0.09) | 0.204 (0.8) * | 0.019 (0.08) |
| _cons | −0.019 (0.09) | 0.008 (0.08) | 0.032 (0.13) | 0.075 (0.013) | 0.130 (0.27) | 0.167 (0.17) | −0.152 (0.16) | 0.008 (0.20) | 0.217 (0.18) | 0.786 (0.28) * | −0.188 (0.25) | 0.128 (0.23) |
| N | 400 | 400 | 400 | 400 | 400 | 400 | 400 | 400 | 400 | 400 | 400 | 400 |
| Parms | 23 | 23 | 23 | 23 | 23 | 23 | 23 | 23 | 23 | 23 | 23 | 23 |
| RMSE | 0.146 | 0.130 | 0.223 | 0.220 | 0.459 | 0.298 | 0.279 | 0.350 | 0.303 | 0.475 | 0.427 | 0.395 |
| R-sq | 0.090 | 0.071 | 0.200 | 0.121 | 0.093 | 0.068 | 0.182 | 0.142 | 0.079 | 0.110 | 0.296 | 0.411 |
| F | 1.689 | 1.318 | 4.277 | 2.359 | 1.760 | 1.250 | 3.813 | 2.837 | 1.463 | 2.128 | 7.212 | 11.933 |
| p-value | 0.028* | 0.155 | 0.000 *** | 0.001 *** | 0.019 * | 0.202 | 0.000 *** | 0.000 *** | 0.083 | 0.003 *** | 0.000 | 0.000 *** |
Publisher’s Note: MDPI stays neutral with regard to jurisdictional claims in published maps and institutional affiliations. |
© 2022 by the authors. Licensee MDPI, Basel, Switzerland. This article is an open access article distributed under the terms and conditions of the Creative Commons Attribution (CC BY) license (https://creativecommons.org/licenses/by/4.0/).
Share and Cite
Nguyen, T.P.L.; Virdis, S.G.P.; Winjikul, E. Inequality of Low Air Quality-Related Health Impacts among Socioeconomic Groups in the World of Work. Int. J. Environ. Res. Public Health 2022, 19, 12980. https://doi.org/10.3390/ijerph191912980
Nguyen TPL, Virdis SGP, Winjikul E. Inequality of Low Air Quality-Related Health Impacts among Socioeconomic Groups in the World of Work. International Journal of Environmental Research and Public Health. 2022; 19(19):12980. https://doi.org/10.3390/ijerph191912980
Chicago/Turabian StyleNguyen, Thi Phuoc Lai, Salvatore G. P. Virdis, and Ekbordin Winjikul. 2022. "Inequality of Low Air Quality-Related Health Impacts among Socioeconomic Groups in the World of Work" International Journal of Environmental Research and Public Health 19, no. 19: 12980. https://doi.org/10.3390/ijerph191912980