
Loss of Skeletal Muscle Mass and Intracellular Water as Undesired Outcomes of Weight Reduction in Obese Hyperglycemic Women: A Short-Term Longitudinal Study

 , , , , , ,
  , ,
, ,
Abstract
:1. Introduction
2. Methods
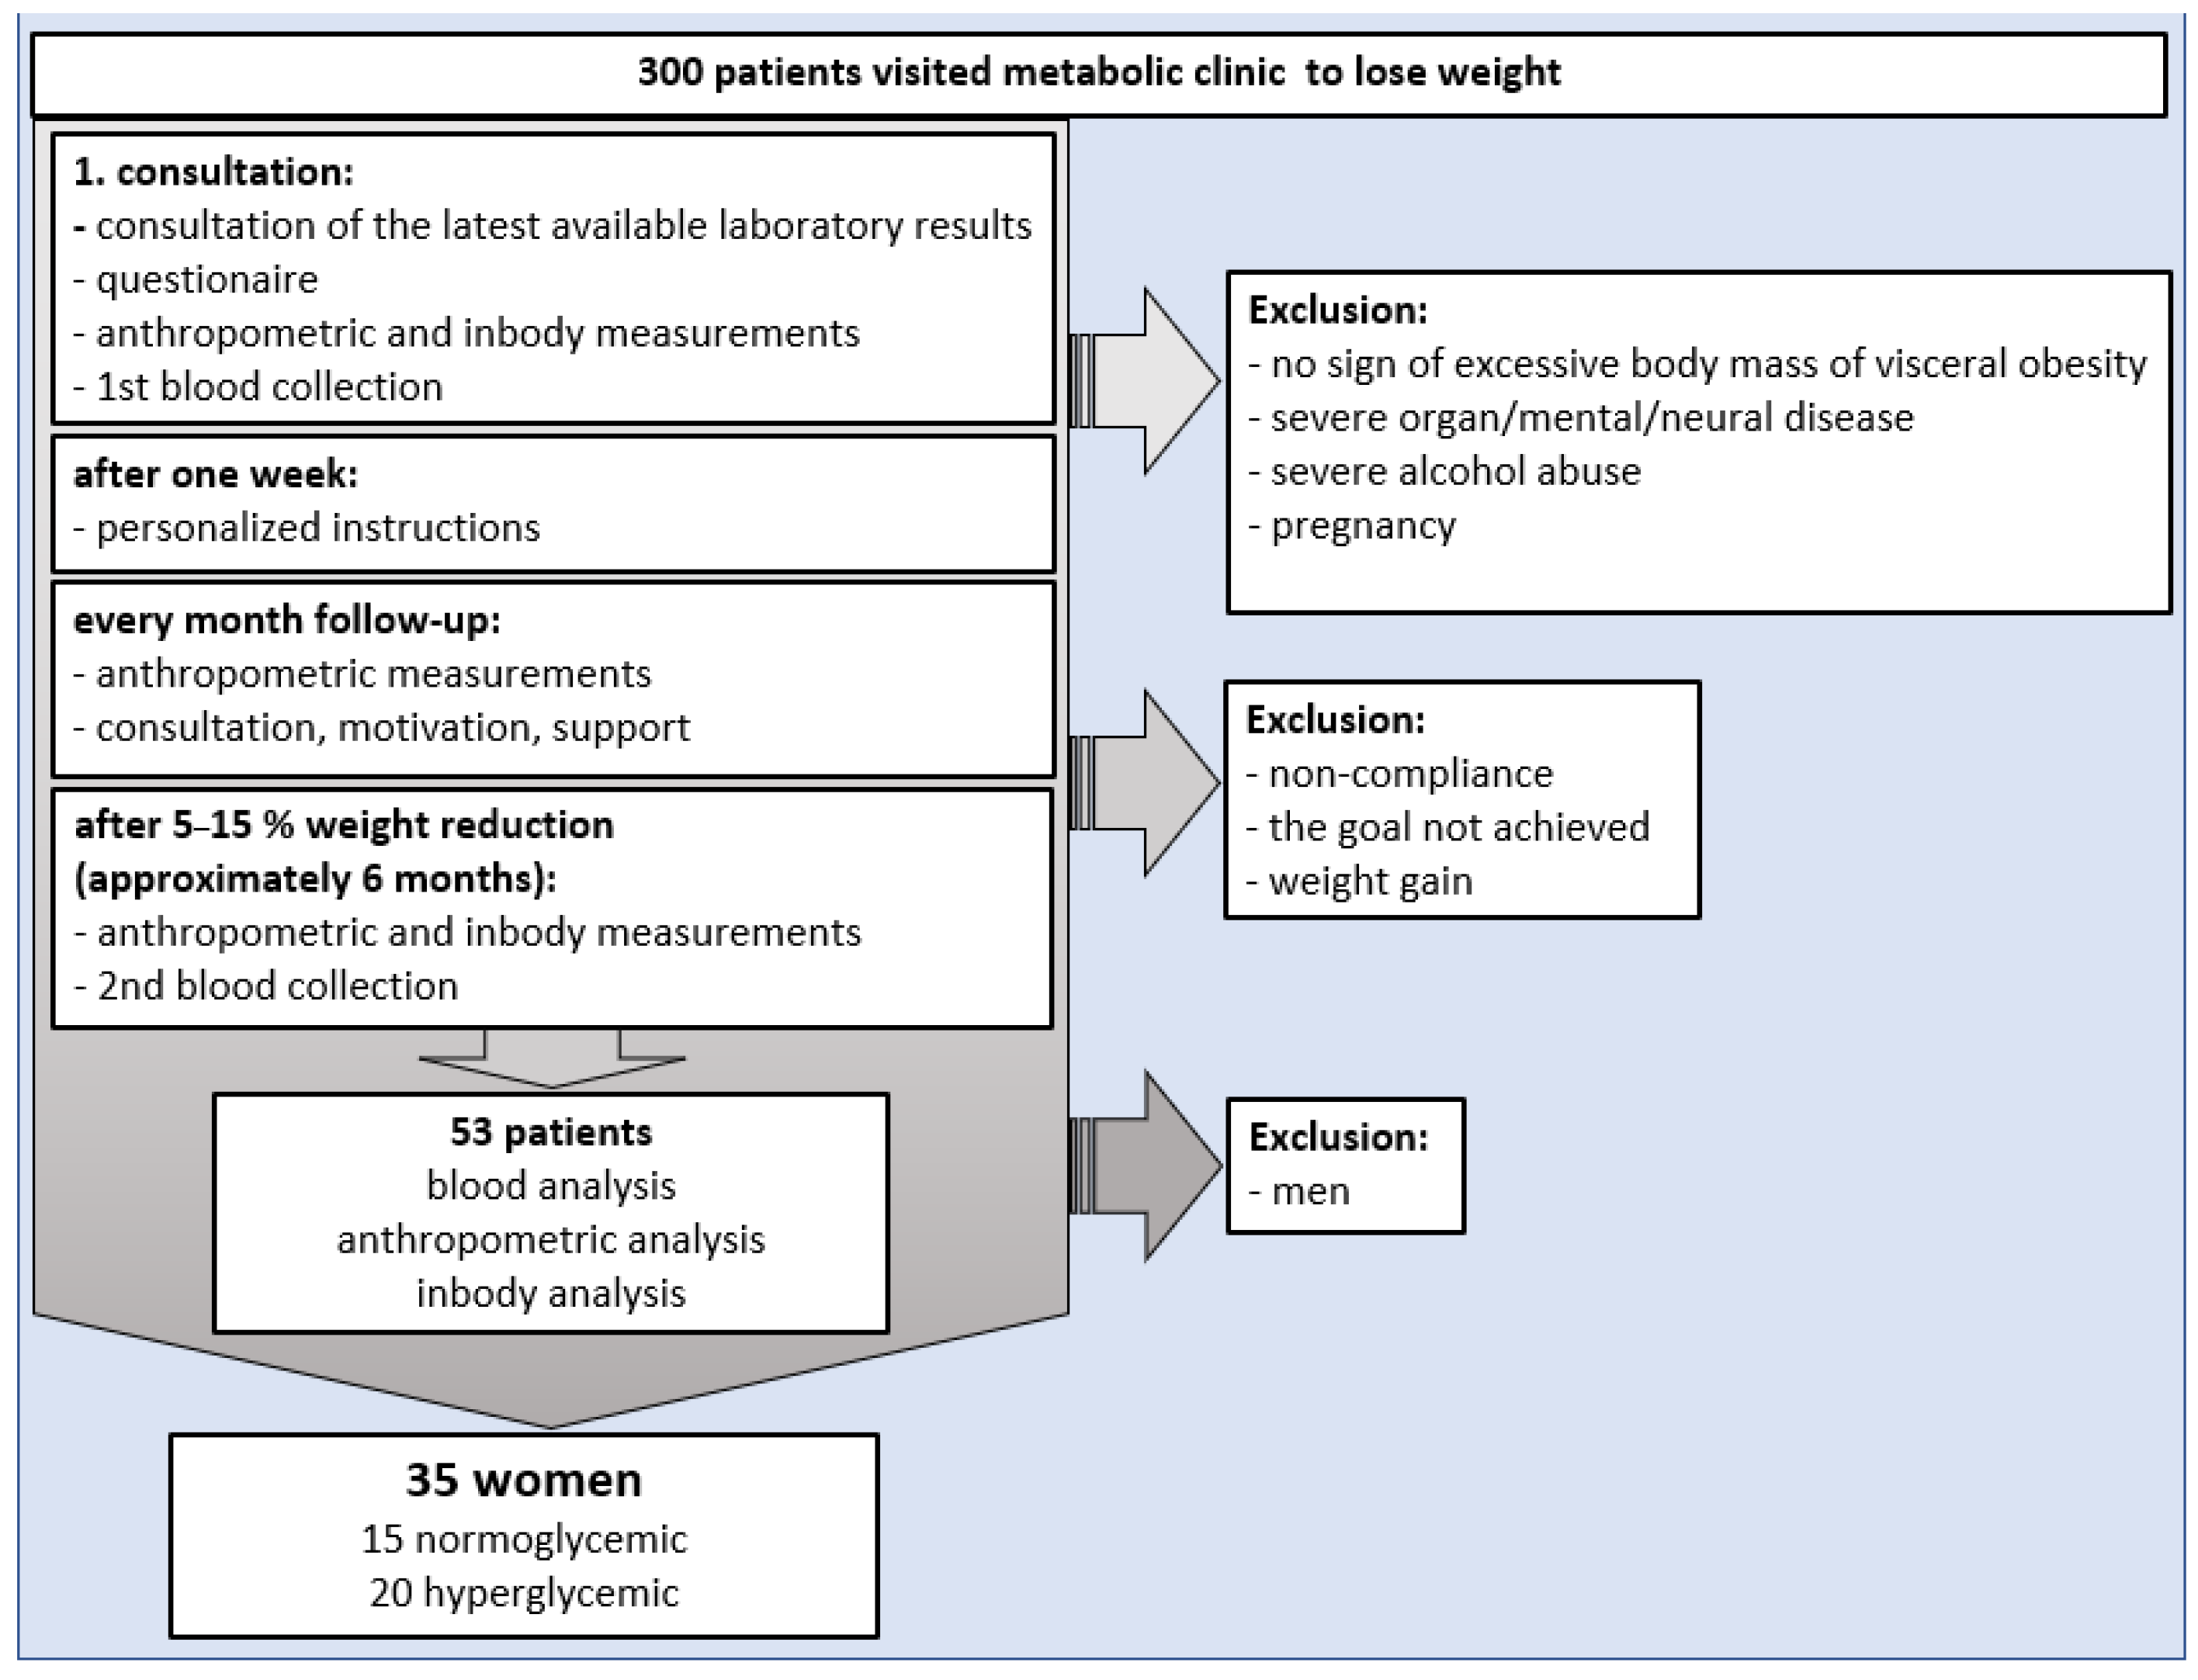
2.1. Study Design
2.2. Participants
2.3. Classification of Patients into Study Groups
2.4. The First and Follow-Up Visit Plan, Diet Composition and Physical Activity Intervention, Variables, and Procedures to Avoid Study Bias
2.5. Biochemical Analysis
2.6. Body Mass Composition Using Bioimpedance Analysis
2.7. Statistical Analysis
3. Results
3.1. Characteristics of Participants and Study Limitation
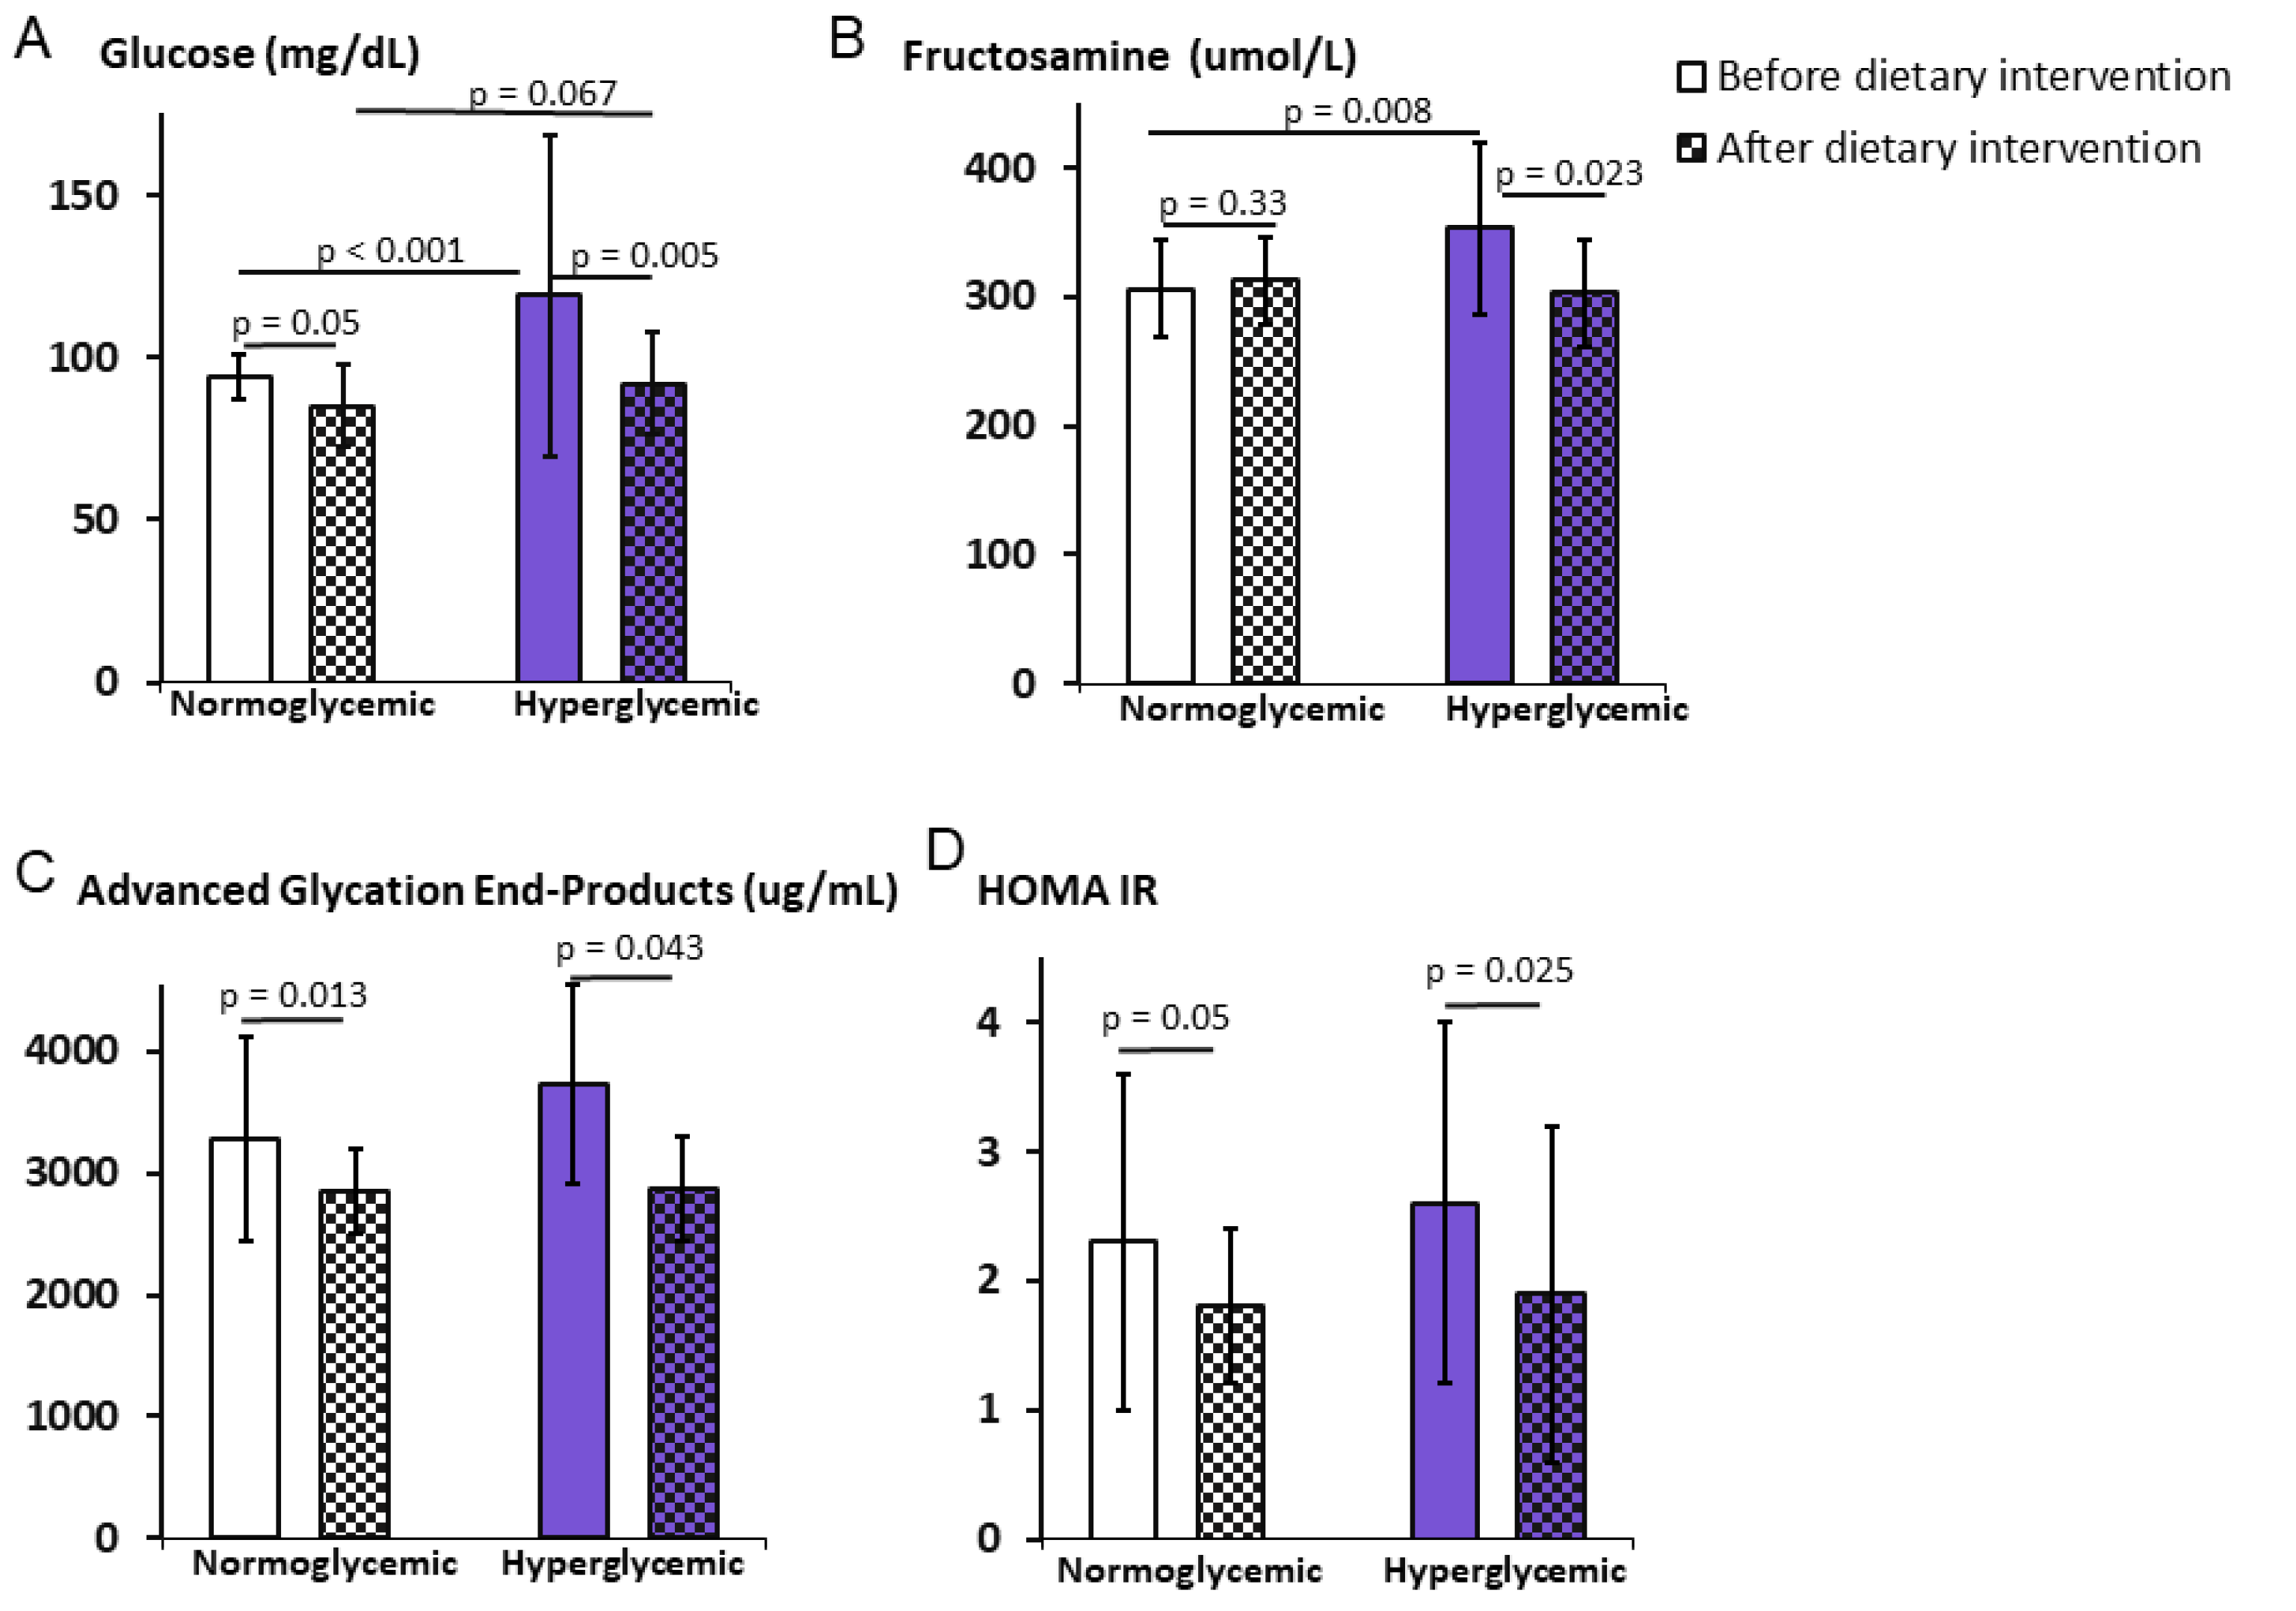
3.2. Impact of the Weight Reduction Program on Carbohydrate Metabolism
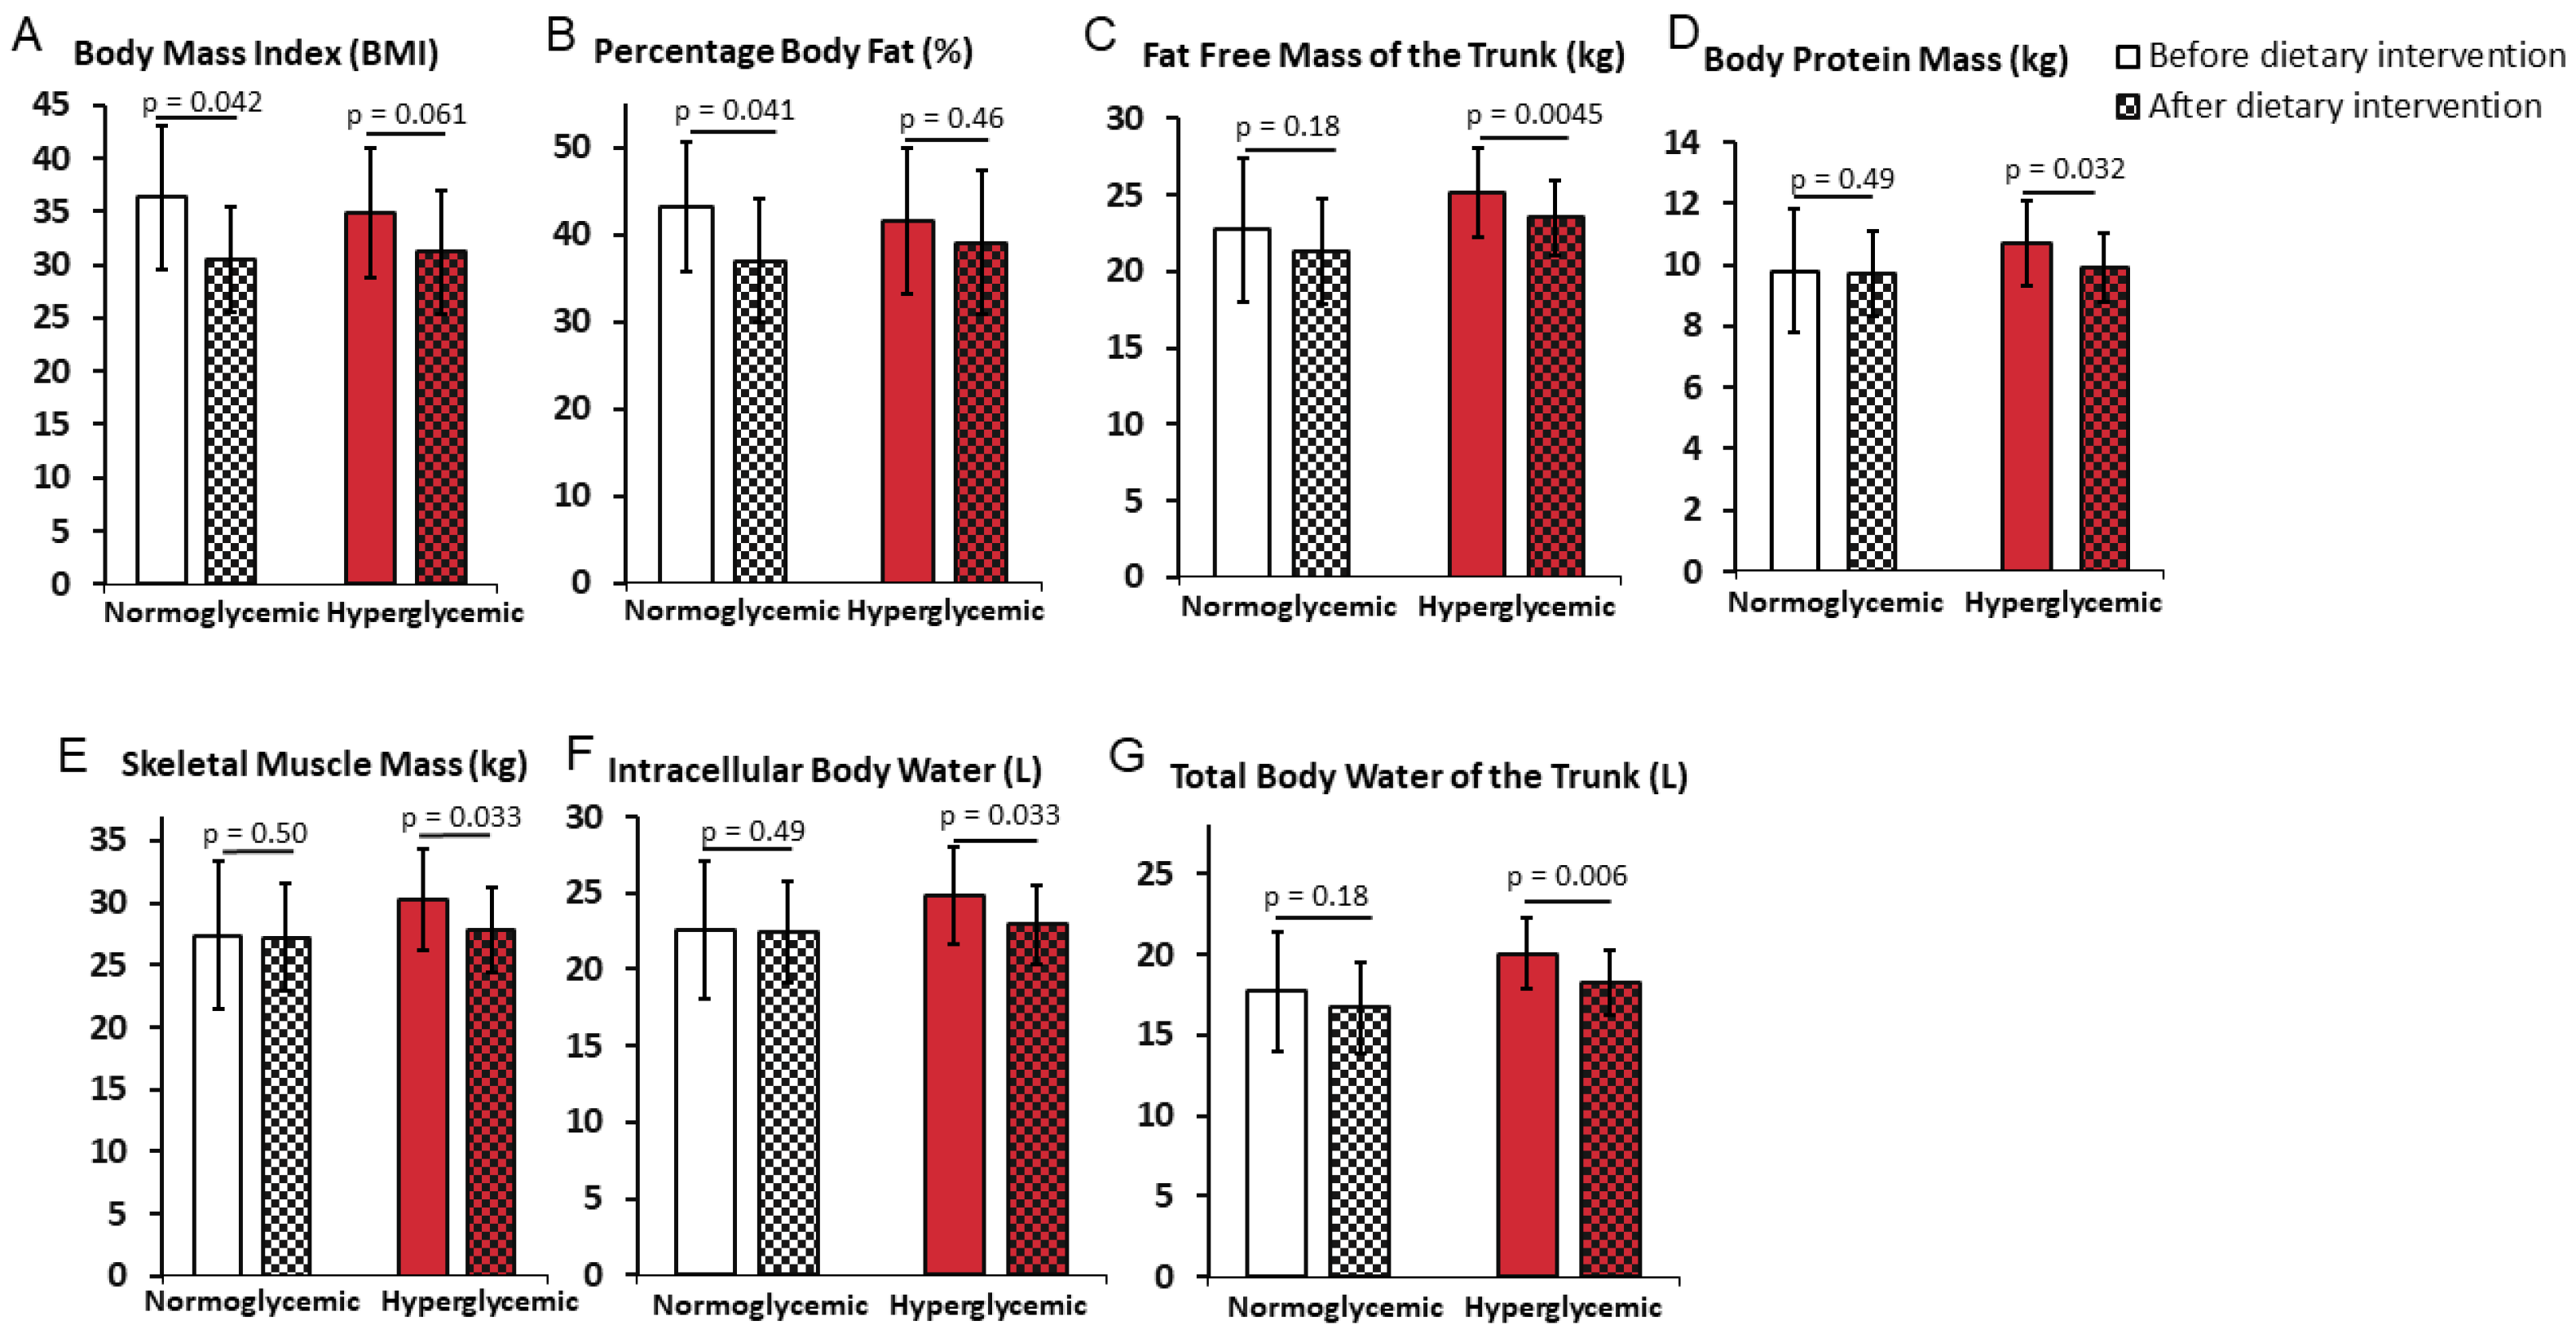
3.3. Differential Impact of the Weight Reduction Program on Weight Loss in Normoglycemic and Hyperglycemic Obese Women
3.4. Correlations between Carbohydrate Metabolism and Markers of Body Mass
4. Discussion
- Small study groups for reasons described in the Methods section.
- The study included only women.
- The obtained results cannot be applied to the whole population of hyperglycemia patients, as the study conducted only patients without treatment affecting glucose and lipid metabolism.
- The confirmation of the results in a long-term study is required.
5. Conclusions
Author Contributions
Funding
Institutional Review Board Statement
Informed Consent Statement
Data Availability Statement
Acknowledgments
Conflicts of Interest
Abbreviations
References
- Available online: https://www.who.int/health-topics/obesity#tab=tab_1 (accessed on 23 April 2021).
- Miazgowski, T. Obesity and diabetes. [Otyłość a cukrzyca]. Fam. Med. Prim. Care Rev. 2012, 14, 462–467. [Google Scholar]
- WHO. WHO|Diabetes Programme. 2019. Available online: https://www.who.int/diabetes/en/ (accessed on 19 April 2021).
- Cho, N.H.; Shaw, J.E.; Karuranga, S.; Huang, Y.; da Rocha Fernandes, J.D.; Ohlrogge, A.W.; Malanda, B. IDF Diabetes Atlas: Global estimates of diabetes prevalence for 2017 and projections for 2045. Diabetes Res. Clin. Pract. 2018, 138, 271–281. [Google Scholar] [CrossRef] [PubMed]
- Zalejska-Fiolka, J.; Hubková, B.; Birková, A.; Veliká, B.; Puchalska, B.; Kasperczyk, S.; Błaszczyk, U.; Fiolka, R.; Bożek, A.; Maksym, B.; et al. Prognostic Value of the Modified Atherogenic Index of Plasma during Body Mass Reduction in Polish Obese/Overweight People. Int. J. Environ. Res. Public Health 2018, 16, 68. [Google Scholar] [CrossRef] [PubMed] [Green Version]
- Ruiz-Castell, M.; Samouda, H.; Bocquet, V.; Fagherazzi, G.; Stranges, S.; Huiart, L. Estimated visceral adiposity is associated with risk of cardiometabolic conditions in a population based study. Sci. Rep. 2021, 11, 9121. [Google Scholar] [CrossRef] [PubMed]
- Apovian, C.M. Obesity: Definition, comorbidities, causes, and burden. Am. J. Manag. Care. 2016, 22, 176–185. [Google Scholar]
- Hong, H.-R.; Jeong, J.-O.; Kong, J.-Y.; Lee, S.-H.; Yang, S.-H.; Ha, C.-D.; Kang, H.-S. Effect of walking exercise on abdominal fat, insulin resistance and serum cytokines in obese women. J. Exerc. Nutr. Biochem. 2014, 18, 277–285. [Google Scholar] [CrossRef] [Green Version]
- Peters, S.A.E.; Bots, S.H.; Woodward, M. Sex Differences in the Association Between Measures of General and Central Adiposity and the Risk of Myocardial Infarction: Results From the UK Biobank. J. Am. Heart Assoc. 2018, 7, e008507. [Google Scholar] [CrossRef] [PubMed] [Green Version]
- Peters, S.A.; Colantonio, L.D.; Dai, Y.; Zhao, H.; Bittner, V.A.; Farkouh, M.E.; Dluzniewski, P.; Poudel, B.; Muntner, P.; Woodward, M. Trends in Recurrent Coronary Heart Disease After Myocardial Infarction Among US Women and Men Between 2008 and 2017. Circulation 2021, 143, 650–660. [Google Scholar] [CrossRef] [PubMed]
- Ahmadizar, F.; Wang, K.; Aribas, E.; Fani, L.; Heshmatollah, A.; Ikram, M.K.; Kavousi, M. Impaired fasting glucose, type 2 diabetes mellitus, and lifetime risk of cardiovascular disease among women and men: The Rotterdam Study. BMJ Open Diabetes Res. Care 2021, 9, e002406. [Google Scholar] [CrossRef]
- Püschner, F.; Wetzel, S.; Urbanski-Rini, D.; Bertram, N.; Schliffke, M.; Göhl, M.; Petersen, C. The association between the risk of developing type 2 diabetes mellitus and health-related quality of life: Baseline results from the Dimini lifestyle intervention. Qual. Life Res. 2021, 30, 3523–3533. [Google Scholar] [CrossRef]
- Sundquist, K.; Johansson, S.-E.; Memon, A.A.; Calling, S.; Ohlsson, H.; Szulkin, R.; Jimenez, E.; Sundquist, J. Elucidating causal effects of type 2 diabetes on ischemic heart disease from observational data on middle-aged Swedish women: A triangular analytical approach. Sci. Rep. 2021, 11, 12579. [Google Scholar] [CrossRef]
- Wang, Y.; O’Neil, A.; Jiao, Y.; Wang, L.; Huang, J.; Lan, Y.; Zhu, Y.; Yu, C. Sex differences in the association between diabetes and risk of cardiovascular disease, cancer, and all-cause and cause-specific mortality: A systematic review and meta-analysis of 5,162,654 participants. BMC Med. 2019, 17, 136. [Google Scholar] [CrossRef]
- Gallagher, E.J.; LeRoith, D. Obesity and Diabetes: The Increased Risk of Cancer and Cancer-Related Mortality. Physiol. Rev. 2015, 95, 727–748. [Google Scholar] [CrossRef] [Green Version]
- Bray, G.A.; Frühbeck, G.; Ryan, D.H.; Wilding, J. Management of obesity. Lancet 2016, 387, 1947–1956. [Google Scholar] [CrossRef] [Green Version]
- Bray, G.A.; Heisel, W.E.; Afshin, A.; Jensen, M.D.; Dietz, W.H.; Long, M.; Kushner, R.F.; Daniels, S.R.; Wadden, T.A.; Tsai, A.G.; et al. The Science of Obesity Management: An Endocrine Society Scientific Statement. Endocr. Rev. 2018, 39, 79–132. [Google Scholar] [CrossRef] [PubMed] [Green Version]
- Garvey, W.T.; Mechanick, J.I.; Brett, E.M.; Garber, A.J.; Hurley, D.L.; Jastreboff, A.M.; Nadolsky, K.; Pessah-Pollack, R.; Plodkowski, R. American Association of Clinical Endocrinologists and American College of Endocrinology Comprehensive Clinical Practice Guidelines for Medical Care of Patients with Obesity. Endocr. Pract. 2016, 22, 842–884. [Google Scholar] [CrossRef] [Green Version]
- Thomas, D.T.; Erdman, K.A.; Burke, L.M. American college of sports medicine joint position statement. nutrition and athletic performance. Med. Sci. Sports Exerc. 2016, 48, 543–568. [Google Scholar] [CrossRef] [PubMed]
- Pi-Sunyer, X. Changes in body composition and metabolic disease risk. Eur. J. Clin. Nutr. 2018, 73, 231–235. [Google Scholar] [CrossRef] [PubMed]
- Pérez, A.E.; González, P.M.; Martínez-Espinosa, R.M.; Vila, M.D.; Reig García-Galbis, M. Practical Guidance for Interventions in Adults with Metabolic Syndrome: Diet and Exercise vs. Changes in Body Composition. Int. J. Environ. Res. Public Health 2019, 16, 3481. [Google Scholar] [CrossRef] [PubMed] [Green Version]
- Burgess, E.; Hassmén, P.; Pumpa, K. Determinants of adherence to lifestyle intervention in adults with obesity: A systematic review. Clin. Obes. 2017, 7, 123–135. [Google Scholar] [CrossRef]
- Cava, E.; Yeat, N.C.; Mittendorfer, B. Preserving Healthy Muscle during Weight Loss. Adv. Nutr. Int. Rev. J. 2017, 8, 511–519. [Google Scholar] [CrossRef] [Green Version]
- Fielding, R.A.; Vellas, B.; Evans, W.J.; Bhasin, S.; Morley, J.E.; Newman, A.B.; van Kan, G.A.; Andrieu, S.; Bauer, J.; Breuille, D.; et al. Sarcopenia: An Undiagnosed Condition in Older Adults. Current Consensus Definition: Prevalence, Etiology, and Consequences. International Working Group on Sarcopenia. J. Am. Med. Dir. Assoc. 2011, 12, 249–256. [Google Scholar] [CrossRef] [PubMed] [Green Version]
- Pasiakos, S.M.; Cao, J.J.; Margolis, L.M.; Sauter, E.R.; Whigham, L.D.; McClung, J.P.; Rood, J.C.; Carbone, J.W.; Combs, C.F., Jr.; Young, A.J. Effects of high-protein diets on fat-free mass and muscle protein synthesis following weight loss: A randomized controlled trial. FASEB J. 2013, 27, 3837–3847. [Google Scholar] [CrossRef] [PubMed] [Green Version]
- Villareal, D.T.; Smith, G.; Shah, K.; Mittendorfer, B. Effect of Weight Loss on the Rate of Muscle Protein Synthesis During Fasted and Fed Conditions in Obese Older Adults. Obesity 2012, 20, 1780–1786. [Google Scholar] [CrossRef] [Green Version]
- Thomas, D.T.; Erdman, K.A.; Burke, L.M. Position of the Academy of Nutrition and Dietetics, Dietitians of Canada, and the American College of Sports Medicine: Nutrition and Athletic Performance. J. Acad. Nutr. Diet 2016, 116, 501–528. [Google Scholar] [CrossRef] [PubMed]
- American Diabetes Association. 4. Lifestyle Management. Diabetes Care 2017, 40, 33–43. [Google Scholar] [CrossRef] [PubMed] [Green Version]
- Indyk, D.; Bronowicka-Szydełko, A.; Gamian, A.; Kuzan, A. Advanced glycation end products and their receptors in serum of patients with type 2 diabetes. Sci. Rep. 2021, 11, 13264. [Google Scholar] [CrossRef]
- Gamian, A.; Staniszewska, M. Patent No. 202257. Method for Obtaining a Diagnostic Immunological Preparation and Determining the Level of Advanced Glycation in Serum and Biological Samples Using Specific Immunochemical Tests. Institute of Immunology and experimenthal therapy PAN. Available online: https://ewyszukiwarka.pue.uprp.gov.pl/search/pwp-details/P.360969 (accessed on 23 November 2021).
- Chung, Y.J.; Kim, E.Y. Usefulness of bioelectrical impedance analysis and ECW ratio as a guidance for fluid management in critically ill patients after operation. Sci. Rep. 2021, 11, 12168. [Google Scholar] [CrossRef]
- Montefusco, L.; D’Addio, F.; Loretelli, C.; Ben Nasr, M.; Garziano, M.; Rossi, A.; Pastore, I.; Plebani, L.; Lunati, M.E.; Bolla, A.M.; et al. Anti-inflammatory effects of diet and caloric restriction in metabolic syndrome. J. Endocrinol. Investig. 2021, 44, 2407–2415. [Google Scholar] [CrossRef] [PubMed]
- Bailey, R.R.; Singleton, J.R.; Majersik, J.J. Association of obesity and diabetes with physical activity and fruit and vegetable consumption in stroke survivors. Fam. Pract. 2020, 38, 56–61. [Google Scholar] [CrossRef]
- Voglhuber, J.; Ljubojevic-Holzer, S.; Abdellatif, M.; Sedej, S. Targeting Cardiovascular Risk Factors Through Dietary Adaptations and Caloric Restriction Mimetics. Front. Nutr. 2021, 8, 758058. [Google Scholar] [CrossRef] [PubMed]
- MacDonald, C.S.; Nielsen, S.M.; Bjørner, J.; Johansen, M.Y.; Christensen, R.; Vaag, A.; E Lieberman, D.; Pedersen, B.K.; Langberg, H.; Ried-Larsen, M.; et al. One-year intensive lifestyle intervention and improvements in health-related quality of life and mental health in persons with type 2 diabetes: A secondary analysis of the U-TURN randomized controlled trial. BMJ Open Diabetes Res. Care 2021, 9, e001840. [Google Scholar] [CrossRef] [PubMed]
- McCracken, E.; Monaghan, M.; Sreenivasan, S. Pathophysiology of the metabolic syndrome. Clin. Dermatol. 2018, 36, 14–20. [Google Scholar] [CrossRef] [PubMed]
- Bovolini, A.; Garcia, J.; Andrade, M.A.; Duarte, J.A. Metabolic Syndrome Pathophysiology and Predisposing Factors. Int. J. Sports Med. 2020, 42, 199–214. [Google Scholar] [CrossRef]
- Rosique-Esteban, N.; Díaz-López, A.; Martínez-González, M.A.; Corella, D.; Goday, A.; Martínez, J.A.; Romaguera, D.; Vioque, J.; Arós, F.; Garcia-Rios, A.; et al. Leisure-time physical activity, sedentary behaviors, sleep, and cardiometabolic risk factors at baseline in the PREDIMED-PLUS intervention trial. PLoS ONE 2017, 12, e0172253. [Google Scholar] [CrossRef] [PubMed] [Green Version]
- Devaraj, S.M.; Rockette-Wagner, B.; Miller, R.G.; Arena, V.C.; Napoleone, J.M.; Conroy, M.B.; Kriska, A.M. The Impact of a Yearlong Diabetes Prevention Program-Based Lifestyle Intervention on Cardiovascular Health Metrics. J. Prim. Care Community Health 2021, 12, 21501327211029816. [Google Scholar] [CrossRef] [PubMed]

| Nutrient | % of Total Energy Intake | Note |
|---|---|---|
| Carbohydrates | 45–55% | Limiting intake of free sugars to less than 10% of total energy intake. |
| Fats | 25–35% | Limiting intake of saturated fatty acids to less than 10% of total energy intake, and intake of 3–6% mono- and polyunsaturated fatty acids in the form of vegetable oils and fish oils; omega-3: omega6 1:4 (5); trans-fatty acids ˂2% of total energy. |
| Proteins | 15–25% | Animal: vegetable sources in 1:2 ratio. |
| Fiber | About 1% | |
| Vegetable | 500 g/day in portions | Low and medium glycemic index (IG). |
| Fruits | 200/300 g/day | Low and medium glycemic index (IG). |
| Clean water | ≥1.5–2 L/day | |
| Salt | ˂4 g/day |
| Parameter | Normoglycemic Group (NG) (n = 15) | Hyperglycemic Group (HG) (n = 20) | NG vs. HG p | |||
|---|---|---|---|---|---|---|
| Before Program | After Program | Before Program | After Program | Before Program | After Program | |
| Age [year] | 51 ± 13.3 | 47.5 ± 7.8 | 0.81 | |||
| Weight [kg] | 95.5 ± 21.0 | 83 ± 14.9 | 89.7 ± 16.3 | 80.8 ± 14.7 | 0.65 | 0,98 |
| p | 0.069 | 0.057 | ||||
| BMI | 36.3 ± 6.7 | 30.5 ± 4.9 | 34.8 ± 6.1 | 31.2 ± 5.8 | 0.98 | 0.59 |
| p | 0.042 * | 0.061 | ||||
| WC (cm) | 107 ± 15 | 94 ± 11 | 103 ± 13 | 93 ± 14 | 0.89 | 0.51 |
| p | 0.016 * | 0.027 * | ||||
| Glucose (mg/dL) | 94 ± 7.0 | 85 ± 12.8 | 119 ± 49.5 | 92.0 ± 15.5 | <0.001 ** | 0.067 |
| p | 0.05 * | 0.005 ** | ||||
| Normoglycemic Group (NG) (n = 15) | Hyperglycemic Group (HG) (n = 20) | NG vs. HG p | ||||
|---|---|---|---|---|---|---|
| Parameter | Before Program | After Program | Before Program | After Program | Before Program | After Program |
| HbA1 (%) | 5.2 ± 0.8 | 5.1 ± 0.7 | 5.2 ± 0.5 | 5.2 ± 0.6 | 0.52 | 0.46 |
| p | 0.55 | 0.43 | ||||
| Insulin (µIU/mL) | 10.2 ± 5.3 | 8.6 ± 3.7 | 9.0 ± 3.4 | 8.8 ± 4.9 | 0.56 | 0.94 |
| p | 0.34 | 0.66 | ||||
| Normoglycemic Group (NG) (n = 15) | Hyperglycemic Group (HG) (n = 20) | NG vs. HG p | ||||
|---|---|---|---|---|---|---|
| Parameter | Before Program | After Program | Before Program | After Program | Before Program | After Program |
| Weight (kg) | 95.5 ± 21.0 | 83 ± 14.9 | 89.7 ± 16.3 | 80.8 ± 14.7 | 0.65 | 0.98 |
| p | 0.069 | 0.057 | ||||
| WC (cm) | 107 ± 15 | 94 ± 11 | 103 ± 13 | 93 ± 14 | 0.89 | 0.51 |
| p | 0.016 * | 0.027 * | ||||
| AC (cm) | 38.7 ± 5.8 | 33 ± 3.8 | 39.2 ± 6.3 | 34.8 ± 3.2 | 0.38 | 0.16 |
| p | 0.012 * | 0.003 ** | ||||
| AMC (cm) | 29.8 ± 4.5 | 27.2 ± 2.6 | 32.2 ± 5.0 | 29.0 ± 2.5 | 0.15 | 0.07 |
| p | 0.023 * | 0.003 ** | ||||
| VFA (cm2) | 153.5 ± 35.3 | 109.2 ± 31.9 | 134.7 ± 32.3 | 110.4 ± 28.9 | 0.28 | 0.74 |
| p | 0.020 * | 0.030 * | ||||
| FFM (kg) | 49.6 ± 9.9 | 49.5 ± 7.4 | 54.2 ± 6.7 | 50.6 ± 6.2 | 0.55 | 0.97 |
| p | 0.49 | 0.064 | ||||
| BMC (kg) | 2.8 ± 0.6 | 2.8 ± 0.5 | 3.0 ± 0.4 | 2.9 ± 0.5 | 0.93 | 0.62 |
| p | 0.87 | 0.35 | ||||
| TBW (L) | 36.5 ± 7.2 | 36.4 ± 5.4 | 39.8 ± 5 | 37.2 ± 4.6 | 0.57 | 0.99 |
| p | 0.47 | 0.068 | ||||
| ECW (L) | 14.0 ± 2.7 | 13.8 ± 2.2 | 14.5 ± 2.0 | 14.2 ± 2.0 | 0.91 | 0.97 |
| p | 0.44 | 0.21 | ||||
| ECW/TBW | 0.384 ± 0.008 | 0.382 ± 0.011 | 0.38 ± 0.018 | 0.38 ± 0.010 | 0.047 * | 0.76 |
| p | 0.58 | 0.20 | ||||
| ECW/TBW TR | 0.384 ± 0.009 | 0.383 ± 0.010 | 0.38 ± 0.017 | 0.38 ± 0.011 | 0.052 | 0.83 |
| p | 0.78 | 0.15 | ||||
| Pearson’s R p | ∆AC | ∆AMC | ∆VFA | ∆PBF |
|---|---|---|---|---|
| ∆Weight | 0.97 | 0.87 | 0.88 | 0.74 |
| 0.000 ** | 0.000 ** | 0.000 ** | 0.004 ** | |
| ∆BMI | 0.96 | 0.86 | 0.90 | 0.73 |
| 0.000 ** | 0.000 ** | 0.000 ** | 0.005 ** | |
| ∆WC | 0.88 | 0.85 | 0.82 | 0.40 |
| 0.000 ** | 0.000 ** | 0.000 ** | 0.18 | |
| ∆Glucose | 0.22 | 0.25 | −0.16 | −0.18 |
| 0.47 | 0.41 | 0.59 | 0.57 | |
| ∆HbA1 | 0.28 | 0.30 | 0.04 | 0.09 |
| 0.35 | 0.32 | 0.88 | 0.78 | |
| ∆Fructosamine | 0.03 | −0.07 | −0.15 | 0.31 |
| 0.92 | 0.83 | 0.62 | 0.33 | |
| ∆AGEs | 0.58 | 0.62 | 0.35 | 0.39 |
| 0.039 * | 0.023 * | 0.22 | 0.19 | |
| ∆Insulin | 0.39 | 0.49 | 0.20 | −0.01 |
| 0.21 | 0.11 | 0.52 | 0.98 | |
| ∆HOMA IR | 0.35 | 0.44 | 0.08 | −0.08 |
| 0.26 | 0.15 | 0.81 | 0.80 |
| Pearson´s R p | ∆AC | ∆AMC | ∆VFA | ∆FFM | ∆FFM TRUNK | ∆SMM | ∆PROT | ∆TBW TRUNK | ∆ICW |
|---|---|---|---|---|---|---|---|---|---|
| ∆Weight | 0.66 | 0.00 | 0.47 | −0.16 | −0.07 | −0.10 | −0.10 | −0.08 | −0.10 |
| 0.004 ** | 0.99 | 0.036 * | 0.54 | 0.80 | 0.69 | 0.69 | 0.75 | 0.71 | |
| ∆BMI | 0.64 | −0.02 | 0.48 | −0.17 | −0.08 | −0.11 | −0.11 | −0.10 | −0.11 |
| 0.005 ** | 0.93 | 0.031 * | 0.52 | 0.77 | 0.67 | 0.66 | 0.72 | 0.69 | |
| ∆WC | 0.54 | 0.07 | 0.51 | −0.19 | −0.10 | −0.18 | −0.18 | −0.10 | 0.82 |
| 0.024 * | 0.80 | 0.023 * | 0.47 | 0.71 | 0.50 | 0.50 | 0.70 | 0.001 ** | |
| ∆Glucose | 0.43 | 0.07 | 0.16 | 0.00 | 0.04 | 0.06 | 0.07 | 0.002 | 0.32 |
| 0.09 | 0.78 | 0.49 | 0.99 | 0.89 | 0.83 | 0.78 | 0.94 | 0.28 | |
| ∆HbA1 | −0.09 | −0.00 | −0.11 | 0.04 | −0.08 | 0.06 | 0.06 | −0.10 | 0.43 |
| 0.74 | 0.99 | 0.63 | 0.89 | 0.77 | 0.83 | 0.81 | 0.72 | 0.15 | |
| ∆Fructosamine | 0.11 | −0.13 | 0.13 | −0.09 | −0.28 | −0.05 | −0.03 | −0.31 | 0.06 |
| 0.68 | 0.63 | 0.59 | 0.74 | 0.28 | 0.86 | 0.92 | 0.23 | 0.86 | |
| ∆AGEs | −0.42 | −0.02 | 0.58 | −0.41 | −0.45 | −0.39 | −0.38 | −0.46 | 0.56 |
| 0.10 | 0.95 | 0.007 ** | 0.10 | 0.07 | 0.12 | 0.13 | 0.06 | 0.045 * | |
| ∆Insulin | −0.17 | −0.42 | 0.10 | 0.02 | −0.23 | 0.08 | 0.07 | −0.22 | 0.47 |
| 0.54 | 0.12 | 0.69 | 0.95 | 0.42 | 0.79 | 0.80 | 0.43 | 0.13 | |
| ∆HOMA IR | −0.20 | −0.51 | 0.11 | 0.11 | −0.30 | 0.18 | 0.18 | −0.34 | 0.19 |
| 0.50 | 0.061 | 0.68 | 0.70 | 0.30 | 0.54 | 0.53 | 0.24 | 0.52 |
Publisher’s Note: MDPI stays neutral with regard to jurisdictional claims in published maps and institutional affiliations. |
© 2022 by the authors. Licensee MDPI, Basel, Switzerland. This article is an open access article distributed under the terms and conditions of the Creative Commons Attribution (CC BY) license (https://creativecommons.org/licenses/by/4.0/).
Share and Cite
Zalejska-Fiolka, J.; Birková, A.; Wielkoszyński, T.; Hubková, B.; Szlachta, B.; Fiolka, R.; Błaszczyk, U.; Kuzan, A.; Gamian, A.; Mareková, M.; et al. Loss of Skeletal Muscle Mass and Intracellular Water as Undesired Outcomes of Weight Reduction in Obese Hyperglycemic Women: A Short-Term Longitudinal Study. Int. J. Environ. Res. Public Health 2022, 19, 1001. https://doi.org/10.3390/ijerph19021001
Zalejska-Fiolka J, Birková A, Wielkoszyński T, Hubková B, Szlachta B, Fiolka R, Błaszczyk U, Kuzan A, Gamian A, Mareková M, et al. Loss of Skeletal Muscle Mass and Intracellular Water as Undesired Outcomes of Weight Reduction in Obese Hyperglycemic Women: A Short-Term Longitudinal Study. International Journal of Environmental Research and Public Health. 2022; 19(2):1001. https://doi.org/10.3390/ijerph19021001
Chicago/Turabian StyleZalejska-Fiolka, Jolanta, Anna Birková, Tomasz Wielkoszyński, Beáta Hubková, Beata Szlachta, Rafał Fiolka, Urszula Błaszczyk, Aleksandra Kuzan, Andrzej Gamian, Mária Mareková, and et al. 2022. "Loss of Skeletal Muscle Mass and Intracellular Water as Undesired Outcomes of Weight Reduction in Obese Hyperglycemic Women: A Short-Term Longitudinal Study" International Journal of Environmental Research and Public Health 19, no. 2: 1001. https://doi.org/10.3390/ijerph19021001
APA StyleZalejska-Fiolka, J., Birková, A., Wielkoszyński, T., Hubková, B., Szlachta, B., Fiolka, R., Błaszczyk, U., Kuzan, A., Gamian, A., Mareková, M., & Toborek, M. (2022). Loss of Skeletal Muscle Mass and Intracellular Water as Undesired Outcomes of Weight Reduction in Obese Hyperglycemic Women: A Short-Term Longitudinal Study. International Journal of Environmental Research and Public Health, 19(2), 1001. https://doi.org/10.3390/ijerph19021001