
Religion and Death in the United States: A Meta-Regression Comparative Assessment of Between-County Mortality Heterogeneity in the United States

 ,
,  , ,
, ,
Abstract
:1. Introduction
- What is the direction and strength of the association, if at all, between religion variables and mortality, uncontrolled and controlled for county demographics and health factors?
- Do religion variables explain less, more, or comparable levels of population mortality heterogeneity as do demographic and health factor variables?
- Does the inclusion of religion variables have added value when studying population mortality controlling for demographics and health factors?
2. Materials and Methods
2.1. Data
- Demographic
- ○
- Rurality;
- ○
- Race and Language: African American (non-Hispanic), American Indian or Alaskan Native, Asian, Hispanic, Native Hawaiian or other Pacific Islander, White (non-Hispanic), English language proficiency;
- ○
- Age and Gender: age less than 18, age 65 and older, female.
- Health Factors
- ○
- Individual Behaviors: adult smoking, adult obesity, food environment index, physical inactivity, access to exercise opportunities, excessive drinking, alchohol-impaired driving deaths, sexually transmitted infections, teen births;
- ○
- Clinical Care: uninsured, primary care physicians, dentists, preventable hospital stays, diabetes monitoring, mammography screening;
- ○
- Social and Economic: high school graduation, some college education, unemployment, children in poverty, income inequality, inadequate social support, single parent households, violent crime, injury deaths;
- ○
- Physical Environment: air pollution, drinking water violations, severe housing problems, driving alone to work, long commute when driving alone.
2.2. Variables for Descriptive Analyses
2.3. Variables for Meta-Regression Analyses
2.4. Analyses
3. Results
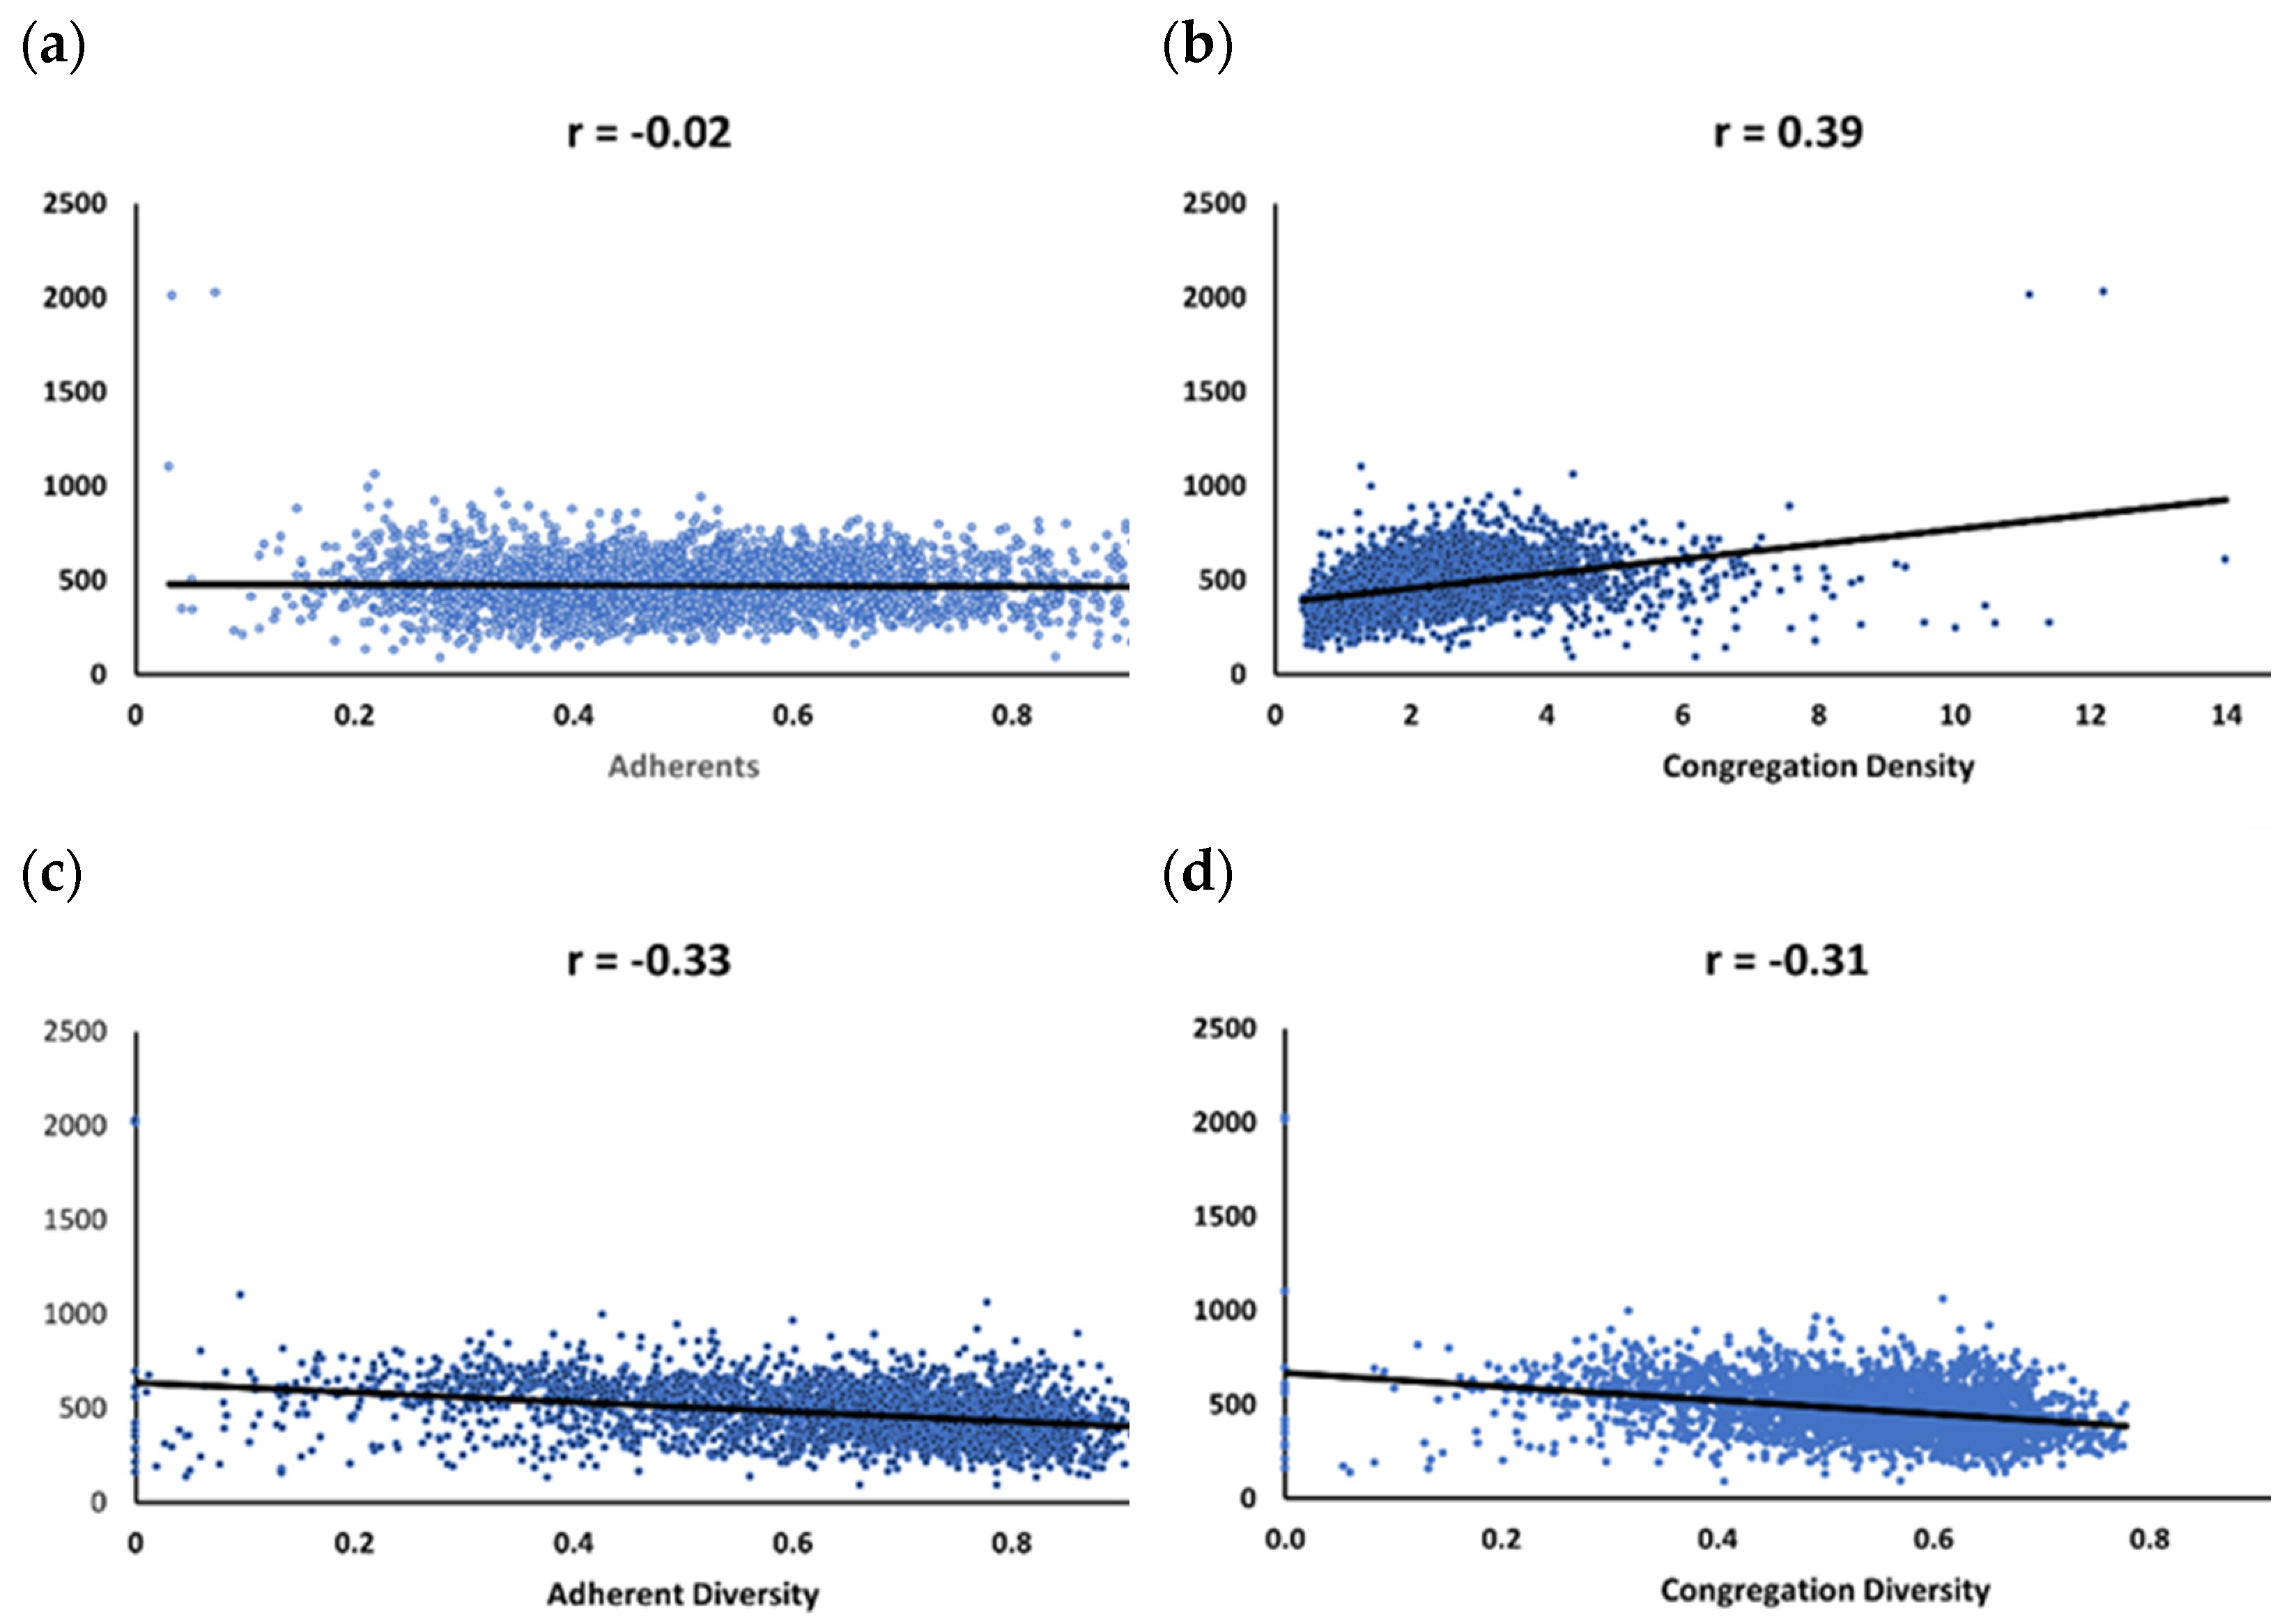
3.1. Descriptive Statistics
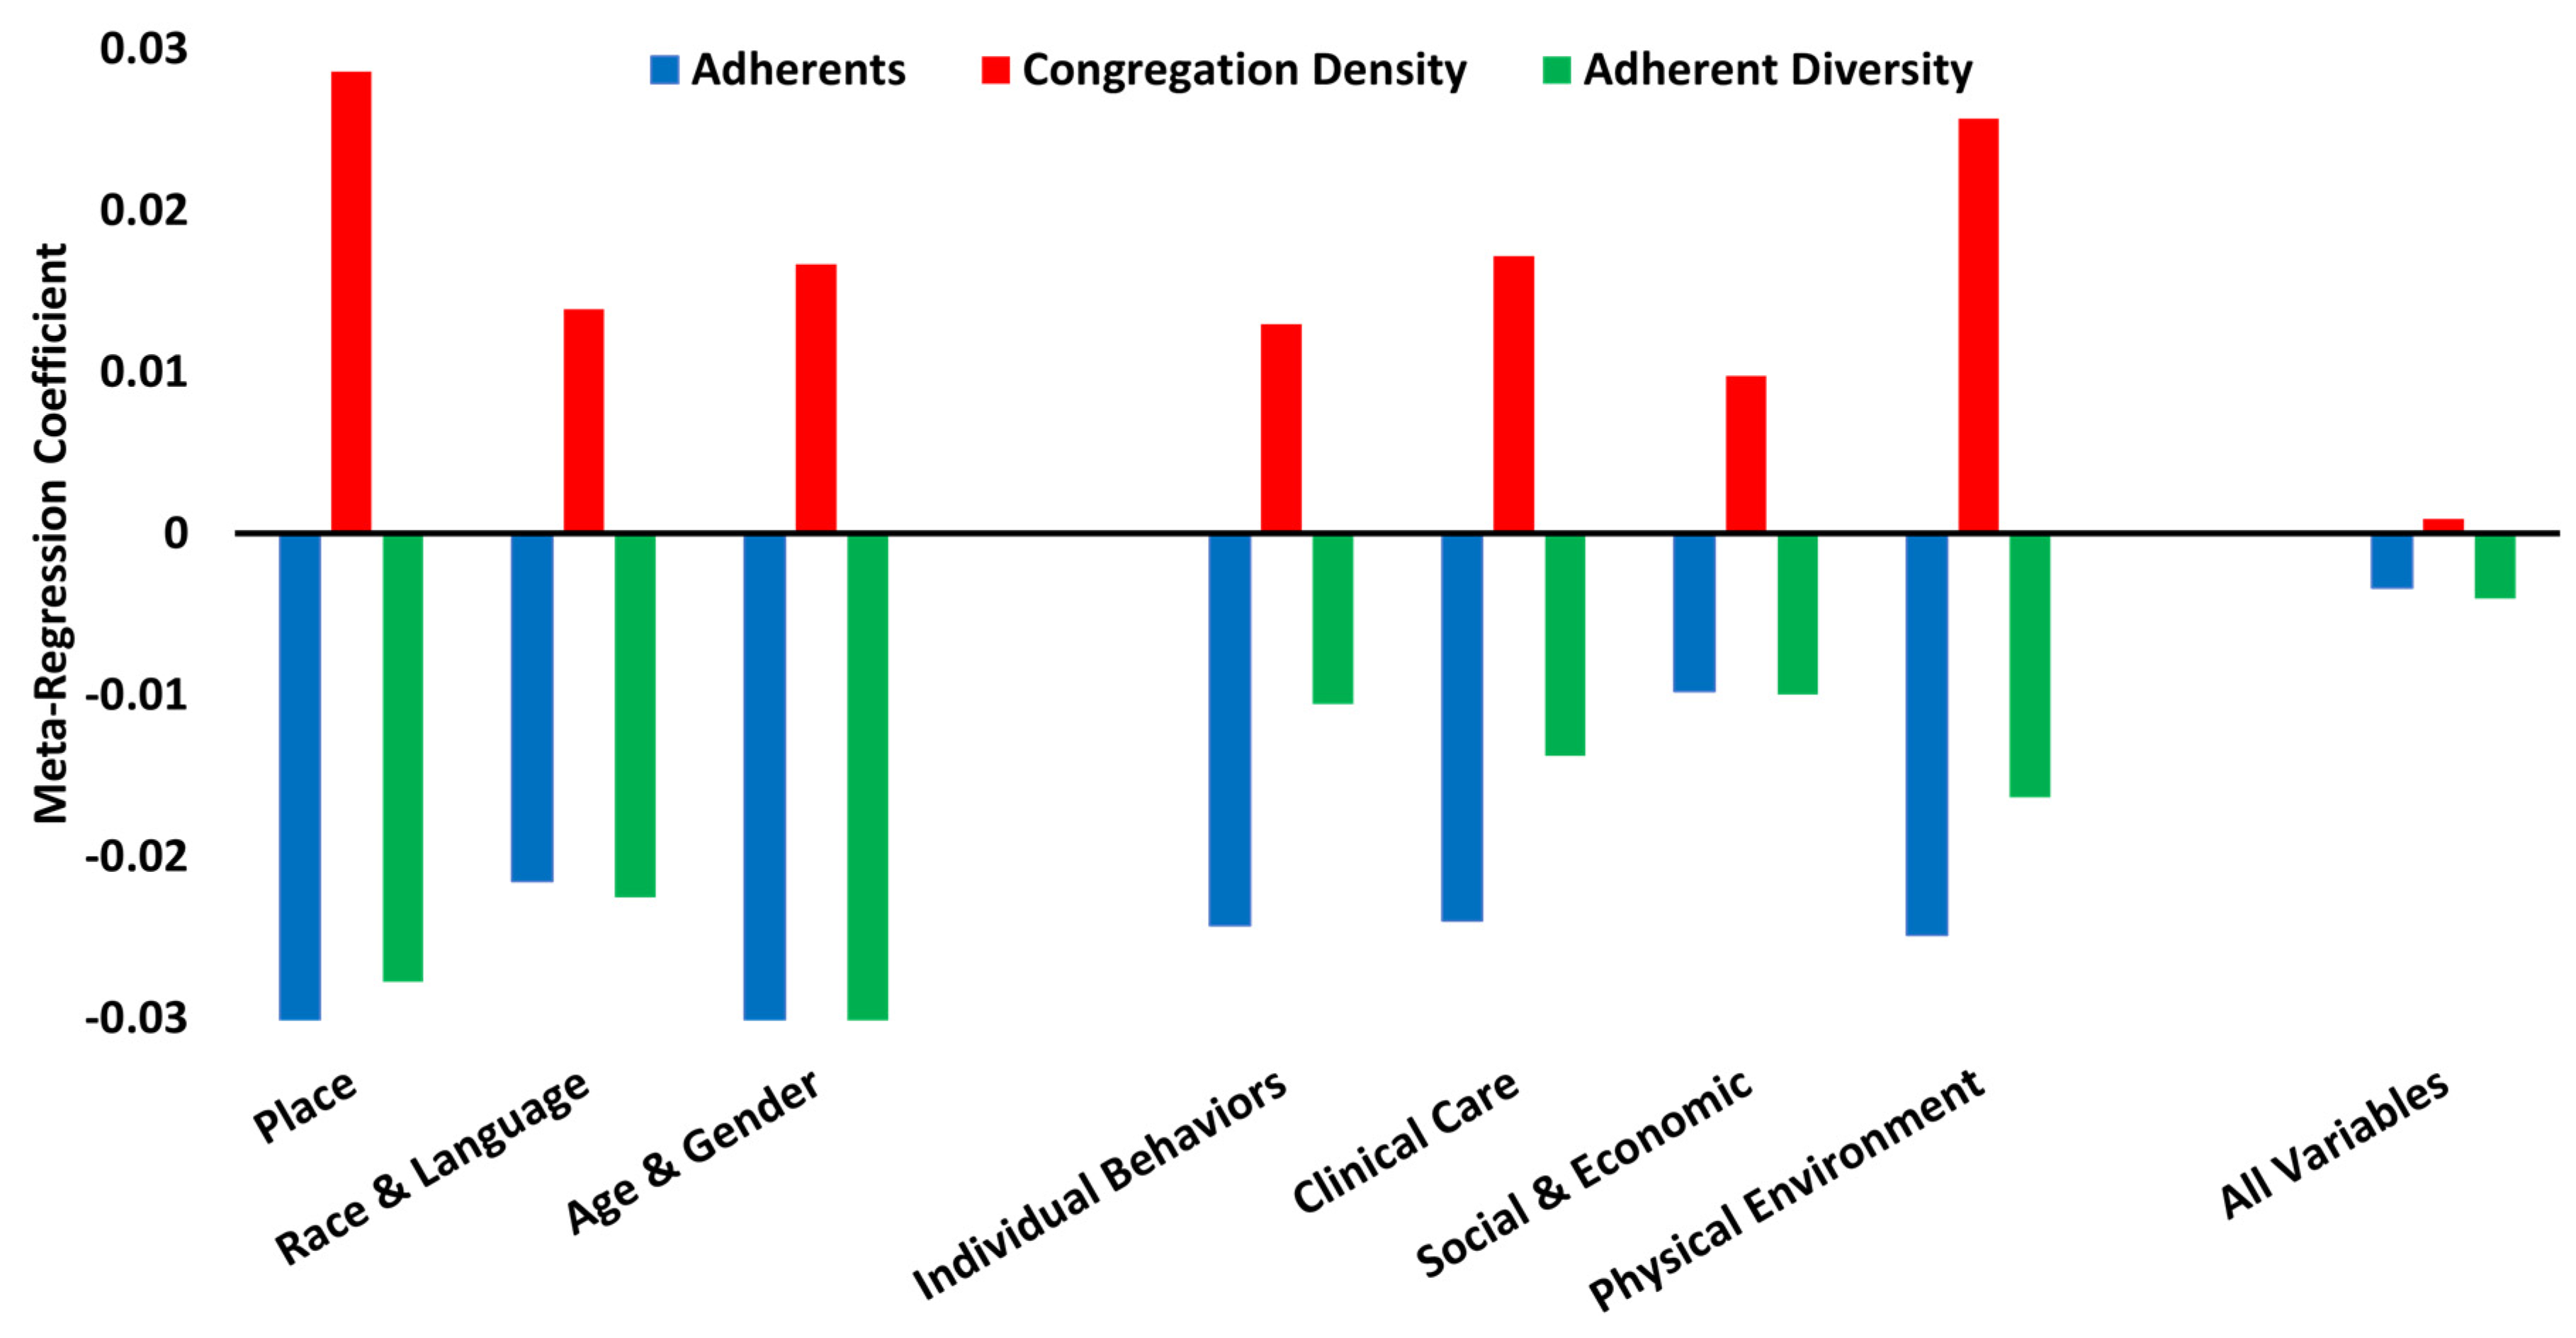
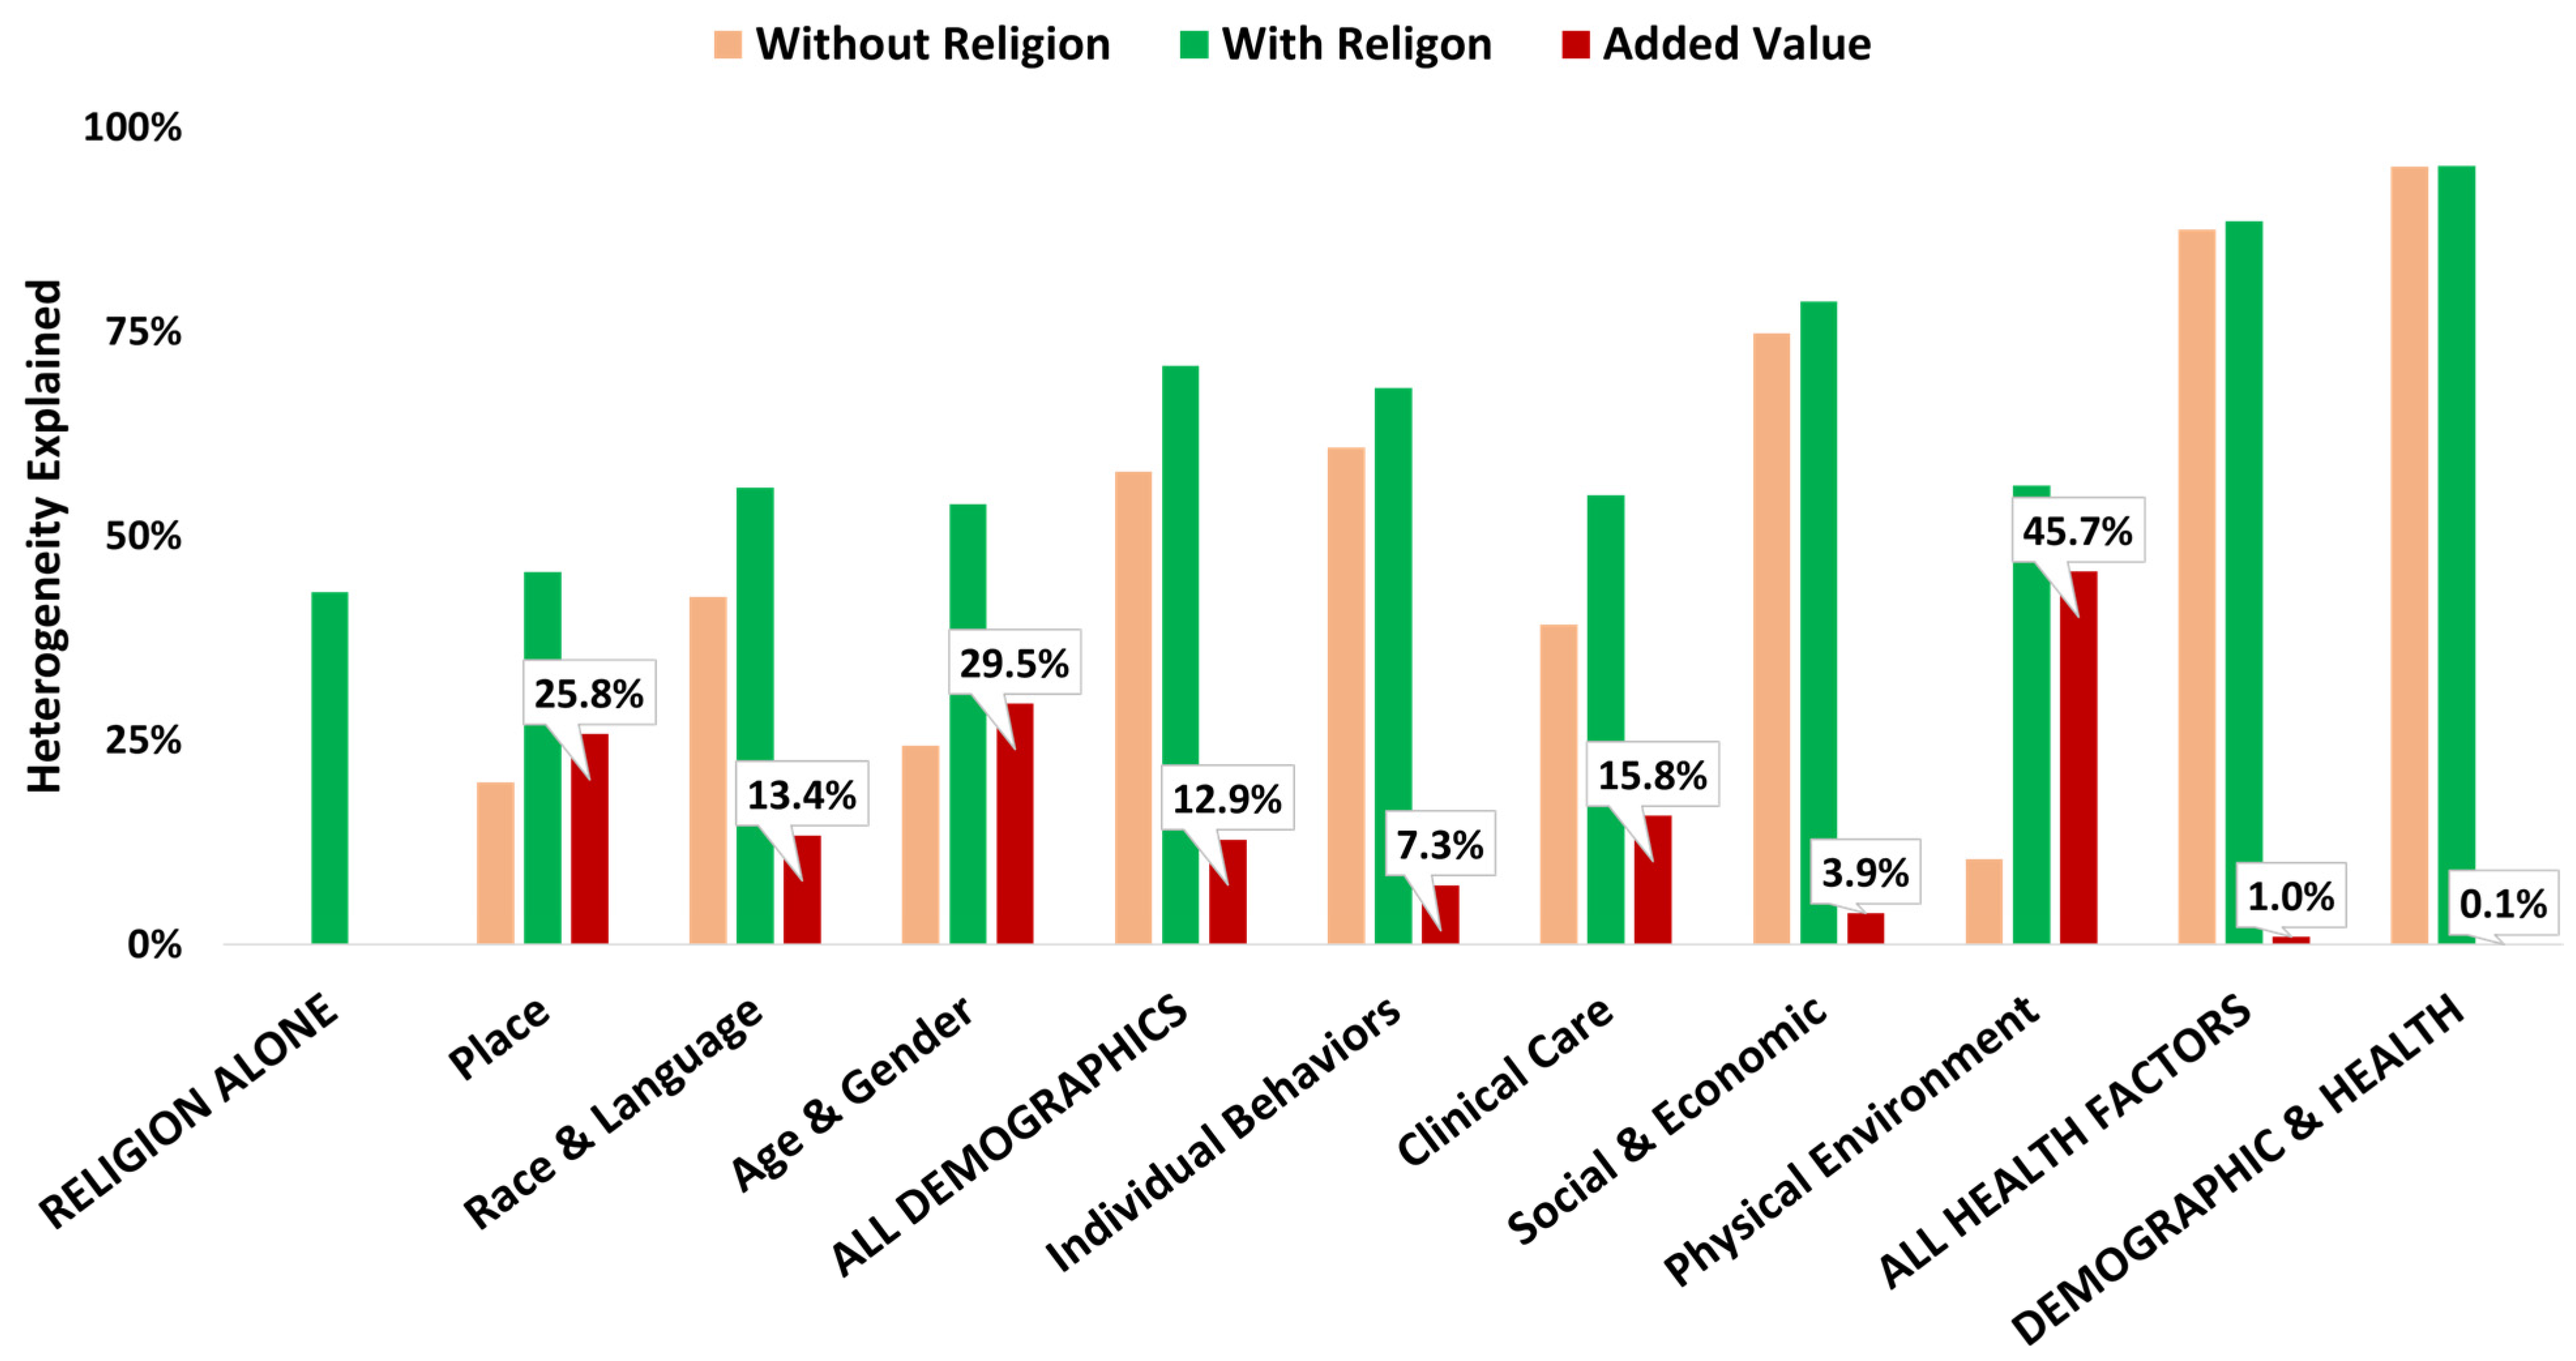
3.2. Meta-Regression Results
4. Discussion
- The direction and strength of any association between religion and mortality, uncontrolled and when controlled for known demographic and health factor mortality determinants.
- Whether religion explained more, less, or was comparable to demographics and health factors.
- If the data suggest religion has added value to population health research of mortality.
5. Conclusions
Author Contributions
Funding
Institutional Review Board Statement
Informed Consent Statement
Data Availability Statement
Conflicts of Interest
Appendix A

| 2010 US Religion Census Data 1 | |||||
| Variable | Label | Measure | |||
| Adherents | Adherents | Percentage of number of persons reported having an affiliation to a congregation (children, members, and attendees who are not members) based on county population size. | |||
| Congregation Density | Congregations | Number of congregations per 100 K based on county population size. | |||
| Population Size | Population | Number of persons living in the county. | |||
| Religion Diversity Index | Adherent Diversity | Diversity of adherents. | Estimated using US Religion Census data. | ||
| Denominational Pluralism Index | Congregation Diversity | Diversity of congregations. | |||
| RWJF Healthy County Data 2 | |||||
| Variable | Label | Measure | Data Source & RWJF Report Year(s) | Data Timeframes 3 | |
| Primary Source | Year | ||||
| Mortality | Death | Crude death rate per 100 K. | National Center for Health Statistics | 2014 & 2015 | 2008–2010, 2010–2012 |
| Demographic Data | |||||
| Rurality | Rural | Percentage of population living in a rural area. | US Census Bureau Population Estimates Program (PEP) | 2013 | 2010 |
| African American (non-Hispanic) | Black | Percentage of population that is non-Hispanic African American. | US Census Bureau Population Estimates Program (PEP) | 2012, 2013 | 2009, 2011 |
| American Indian or Alaskan Native | Indigenous | Percentage of population that is American Indian or Alaskan Native. | US Census Bureau Population Estimates Program (PEP) | 2012, 2013 | 2009, 2011 |
| Asian | Asian | Percentage of population that is Asian. | US Census Bureau Population Estimates Program (PEP) | 2012, 2013 | 2009, 2011 |
| Hispanic | Hispanic | Percentage of population that is Hispanic. | US Census Bureau Population Estimates Program (PEP) | 2012, 2013 | 2009, 2011 |
| Native Hawaiian or other Pacific Islander | Pacific Islander | Percentage of population that is Native Hawaiian or other Pacific Islander. | US Census Bureau Population Estimates Program (PEP) | 2012, 2013 | 2009, 2011 |
| White (non-Hispanic) | White | Percentage of population that is non-Hispanic White. | US Census Bureau Population Estimates Program (PEP) | 2013 | 2011 |
| English language proficiency | Language | Percentage of population that is not proficient in English. | American Community Survey (ACS) | 2014 | 2008–2012 |
| Age less than 18 years | Age < 18 | Percentage of population below 18 years of age. | US Census Bureau Population Estimates Program (PEP) | 2012, 2013 | 2009, 2011 |
| Age 65 years and older | Age 65+ | Percentage of population ages 65 and older. | US Census Bureau Population Estimates Program (PEP) | 2012, 2013 | 2009, 2011 |
| Gender female | Female | Percentage of population that is female. | US Census Bureau Population Estimates Program (PEP) | 2012, 2013 | 2009, 2011 |
| Individual Behaviors Data | |||||
| Adult Smoking | Smoking | Percentage of adults who are current smokers. | Behavioral Risk Factor Surveillance System (BRFSS) | 2014 | 2006–2012 |
| Adult Obesity | Obesity | Percentage of the adult population (age 20 and older) that reports a body mass index (BMI) greater than or equal to 30 kg/m2. | CDC Diabetes Interactive Atlas | 2014 | 2010 |
| Food Environment Index | Healthy Food | Index of factors that contribute to a healthy food environment, from 0 (worst) to 10 (best). | USDA Food Environment Atlas, Map the Meal Gap from Feeding America | 2014 | 2010–2011 |
| Physical Inactivity | Inactivity | Percentage of adults age 20 and over reporting no leisure-time physical activity. | CDC Diabetes Interactive Atlas | 2014 | 2010 |
| Access to Exercise Opportunities | Exercise Access | Percentage of population with adequate access to locations for physical activity. | OneSource Global Business Browser, Delorme map data, ESRI, & US Census Tigerline Files | 2014 | 2010 & 2012 |
| Excessive Drinking | Excess Drink | Percentage of adults reporting binge or heavy drinking. | Behavioral Risk Factor Surveillance System (BRFSS) | 2014 | 2006–2012 |
| Alcohol-Impaired Driving Deaths | Drinking Deaths | Percentage of driving deaths with alcohol involvement. | Fatality Analysis Reporting System | 2014 | 2008–2012 |
| Sexually Transmitted Infections | STI | Number of newly diagnosed chlamydia cases per 100,000 population. | National Center for HIV/AIDS, Viral Hepatitis, STD, and TB Prevention (NCHHSTP) | 2013 | 2010 |
| Teen Births | Teen Births | Number of births per 1000 female population ages 15–19. | National Center for Health Statistics - Natality files | 2016 | 2007–2013 |
| Clinical Care Data | |||||
| Uninsured | Uninsured | Percentage of population under age 65 without health insurance. | US Census Bureau Small Area Health Insurance Estimates (SAHIE) | 2013 | 2010 |
| Primary Care Physicians | Primary Care | Number of primary care physicians (MD and DO) per 100,000 population. | HRSA Area Resource File | 2013 | 2010 |
| Dentists | Dentists | Number of dentists per 100,000 population. | HRSA Area Resource File | 2013 | 2010 |
| Preventable Hospital Stays | Hospitalization | Rate of hospital stays for ambulatory-care sensitive conditions per 1000 Medicare enrollees. | Dartmouth Atlas of Health Care | 2013 | 2010 |
| Diabetes Monitoring | Diabetes | Percentage of diabetic Medicare enrollees ages 65–75 that receive HbA1c monitoring. | Dartmouth Atlas of Health Care | 2013 | 2010 |
| Mammography Screening | Mammography | Percentage of female Medicare enrollees ages 67–69 that receive mammography screening. | Dartmouth Atlas of Health Care | 2013 | 2010 |
| Social and Economic Factors Data | |||||
| High School Graduation | High School | Percentage of ninth-grade cohort that graduates in four years. | Individual state Department of Education websites | 2012 & 2013 | 2009–2010 & 2010–2011 |
| Some College | College | Percentage of adults ages 25–44 with some post-secondary education. | American Community Survey, 5-year estimates | 2014 | 2008–2012 |
| Unemployment | Unemployed | Percentage of population ages 16 and older unemployed but seeking work. | Bureau of Labor Statistics: Local Area Unemployment Statistics (LAUS) | 2012 | 2010 |
| Children in Poverty | Poverty | Percentage of people under age 18 in poverty. | US Census Bureau: Small Area Income and Poverty Estimates (SAIPE) | 2012 | 2010 |
| Income Inequality | Income | Ratio of household income at the 80th percentile to income at the 20th percentile. | American Community Survey, 5-year estimates | 2015 | 2009–2013 |
| Inadequate Social Support | Social Support | Percentage of adults without adequate social/emotional support. | Behavioral Risk Factor Surveillance System (BRFSS) | 2014 | 2005–2010 |
| Single Parent Households | Single Parent | Percentage of children that live in a household headed by single parent. | American Community Survey, 5-year estimates | 2014 | 2008–2012 |
| Violent Crime | Violent Crime | Number of reported violent crime offenses per 100,000 population. | Uniform Crime Reporting - FBI | 2014 | 2010–2011 |
| Injury Deaths | Injury Deaths | Number of deaths due to injury per 100,000 population. | CDC WONDER mortality data | 2015 | 2008–2012 |
| Physical Environment Data | |||||
| Air Pollution—Particulate Matter | Air Quality | Average daily density of fine particulate matter in micrograms per cubic meter (PM2.5). | CDC WONDER Environmental data | 2014 | 2011 |
| Drinking Water Violations | Water Quality | Percentage of population potentially exposed to water exceeding a violation limit during the past year. | EPA Safe Drinking Water Information System (SDWIS) | 2013 | FY 2012 |
| Severe Housing Problems | Poor Housing | Percentage of households with at least 1 of 4 housing problems: overcrowding, high housing costs, lack of kitchen facilities, or lack of plumbing facilities. | Comprehensive Housing Affordability Strategy (CHAS) data | 2016 | 2008–2012 |
| Driving Alone to Work | Drive Alone | Percentage of the workforce that drives alone to work. | American Community Survey, 5-year estimates | 2014 | 2008–2012 |
| Long Commute—Driving Alone | Long Commute | Among workers who commute in their car alone, the percentage that commute more than 30 min. | American Community Survey, 5-year estimates | 2014 | 2008–2012 |
References
- Keyes, K.M.; Galea, S. Population Health Science; Oxford University Press: New York, NY, USA, 2016; p. 29. [Google Scholar]
- Koenig, H.G. Religion, Spirituality, and Health: The Research and Clinical Implications. ISRN Psychiatry 2012, 2012, 278730. [Google Scholar] [CrossRef] [Green Version]
- Zimmerman, F.J. Population Health Science: Fulfilling the Mission of Public Health. Milbank Q. 2020, 99, 9–23. [Google Scholar] [CrossRef]
- Gunderson, G.R.; Cochrane, J.R. Religion and the Health of the Public: Shifting the Paradigm, 1st ed.; Palgrave Macmillan: New York, NY, USA, 2012; p. 15. [Google Scholar]
- Idler, E.L. (Ed.) Religion as a Social Determinant of Public Health, 1st ed.; Oxford University Press: New York, NY, USA, 2014; pp. 4–9. [Google Scholar]
- Oman, D. (Ed.) Why Religion and Spirituality Matter for Public Health: Evidence, Implications, and Resources; Springer International Publishing: Cham, Switzerland, 2018; p. 15. [Google Scholar]
- Grammich, C.; Hadaway, K.; Houseal, R.; Jones, D.E.; Krindatch, A.; Stanley, R.; Taylor, R.H. 2010 U.S. Religion Census: Religious Congregations & Membership Study; Association of Statisticians of American Religious Bodies: Kansas City, MO, USA, 2012. [Google Scholar]
- Steensland, B.; Park, J.; Regnerus, M.D.; Robinson, L.D.; Wilcox, W.B.; Woodberry, R. The Measure of American Religion: Toward Improving the State of the Art. Soc. Forces 2000, 79, 291. [Google Scholar] [CrossRef]
- U.S. Religion Census. Data Collected. Available online: http://www.usreligioncensus.org/data_collected (accessed on 14 November 2021).
- County Health Rankings & Roadmaps. Available online: https://www.countyhealthrankings.org/ (accessed on 14 November 2021).
- The American Religious Landscape in 2020. Available online: https://www.prri.org/wp-content/uploads/2021/07/PRRI-Jul-2021-Religion.pdf (accessed on 14 November 2021).
- Blanchard, T.; Stroope, S.; Tolbert, C. Bringing the Congregations Back in: Religious Markets, Congregational Density, and American Religious Participation. Religions 2014, 5, 929–947. [Google Scholar] [CrossRef] [Green Version]
- Barendregt, J.J.; Doi, S.; Lee, Y.Y.; Norman, R.E.; Vos, T. Meta-analysis of prevalence. J. Epidemiol. Community Health 2013, 67, 974–978. [Google Scholar] [CrossRef]
- Miller, J.J. The Inverse of the Freeman–Tukey Double Arcsine Transformation. Am. Stat. 1978, 32, 138. [Google Scholar] [CrossRef]
- Carey, G. Transformations. Available online: http://psych.colorado.edu/~carey/Courses/PSYC5741/handouts/Transformations.pdf (accessed on 14 November 2021).
- Population Health Methods. Meta-Regression. Available online: https://www.publichealth.columbia.edu/research/population-health-methods/meta-regression (accessed on 14 November 2021).
- Love, C.W. Religion and Politics at the Dinner Table: Challenging the Old Maxim. Available online: https://www.thepublicdiscourse.com/2017/08/19790/ (accessed on 14 November 2021).
- Curan, J.W. Foreword. In Religion and the Health of the Public: Shifting the Paradigm, 1st ed.; Palgrave Macmillan: New York, NY, USA, 2012; p. xvii. [Google Scholar]
- Galea, S. On Religion and Public Health. Available online: https://www.bu.edu/sph/news/articles/2016/on-religion-and-public-health/ (accessed on 14 November 2021).


| Construct and Variables | Descriptive Statistics | DA 1 & % | ||||
|---|---|---|---|---|---|---|
| n | Mean | Median | Low | High | ||
| Health Outcome: Mortality | 3141 | 473.5 | 463.9 | 91.2 | 2028.4 | na |
| Religion | ||||||
| Adherents | 3141 | 51.3% | 49.7% | 3.1% | 100% | <0.01 |
| Congregation Density | 2.4 | 2.2 | 0.4 | 14.0 | 33.2 | |
| Adherent Diversity | 0.64 | 0.69 | 0 | 0.96 | 11.0 | |
| Congregation Diversity | 0.54 | 0.56 | 0 | 0.78 | 9.8 | |
| Place | ||||||
| Population Size | 3141 | 98,295.3 | 25,887 | 82 | 9,818,605 | 14.8 |
| Rurality | 58.6% | 59.5% | 0% | 100.0% | 19.2 | |
| Race and Language | ||||||
| African American (non-Hispanic) | 3141 | 9.0% | 2.2% | 0% | 85.4% | 5.4 |
| American Indian or Alaskan Native | 2.1% | 0.5% | 0% | 92.0% | 0.3 | |
| Asian | 1.2% | 0.5% | 0% | 43.8% | 29.8 | |
| Hispanic | 8.3% | 3.3% | 0.1% | 96.4% | 8.8 | |
| Native Hawaiian or other Pacific Islander | 0.1% | 0.03% | 0% | 46.7% | 7.0 | |
| White (non-Hispanic) | 78.7% | 86.4% | 2.6% | 99.0% | <0.01 | |
| English language non-proficiency | 1.8% | 0.8% | 0% | 29.4% | 14.5 | |
| Age and Gender | ||||||
| Age less than 18 years | 3141 | 23.3% | 23.2% | 0% | 40.5% | 3.3 |
| Age 65 years and older | 15.9% | 15.5% | 3.2% | 35.6% | 23.4 | |
| Gender female | 50.1% | 50.5% | 26.9% | 57.4% | 2.0 | |
| Individual Behaviors | ||||||
| Adult Smoking | 2711 | 21.3% | 20.8% | 3.1% | 51.1% | 40.4 |
| Adult Obesity | 3141 | 30.6% | 30.7% | 13.1% | 47.9% | 30.0 |
| Food Environment Index | 7.4 | 7.6 | 0 | 10 | 13.6 | |
| Physical Inactivity | 27.8% | 28.1% | 10.4% | 44.9% | 49.11 | |
| Access to Exercise Opportunities | 3117 | 52.4% | 53.6% | 0% | 100% | 16.2 |
| Excessive Drinking | 2225 | 16.5% | 16.3% | 3.2% | 56.2% | 13.4 |
| Alcohol-Impaired Driving Deaths | 3115 | 32.0% | 31.5% | 0% | 100% | <0.01 |
| Sexually Transmitted Infections | 3135 | 309.3 | 231.8 | 0 | 2812.9 | 2.4 |
| Teen Births | 3042 | 41.7 | 39.9 | 3.7 | 123.7 | 39.5 |
| Clinical Care | ||||||
| Uninsured | 3140 | 18.5% | 18.2% | 3.6% | 41.4% | 11.9 |
| Primary Care Physicians | 3017 | 55.2 | 50.6 | 0 | 458.9 | 7.8 |
| Dentists | 3054 | 38.4 | 34.7 | 0 | 323.2 | 14.7 |
| Preventable Hospital Stays | 3011 | 78.8 | 73.0 | 19.8 | 342.4 | 29.3 |
| Diabetes Monitoring | 3094 | 83.6% | 84.7% | 16.9% | 100% | 4.4 |
| Mammography Screening | 3055 | 63.1% | 63.6% | 30.0% | 95% | 14.0 |
| Social and Economic | ||||||
| High School Graduation | 3117 | 82.5% | 83.3% | 14.0% | 100% | 5.6 |
| Some College | 3141 | 55.1% | 55.1% | 2.6% | 100% | 41.0 |
| Unemployment | 3140 | 9.2% | 9.0% | 1.6% | 29.7% | 14.6 |
| Children in Poverty | 24.2% | 23.5% | 2.7% | 61.1% | 49.3 | |
| Income Inequality | 3141 | 4.5 | 4.4 | 2.6 | 9.6 | 8.7 |
| Inadequate Social Support | 2471 | 19.3% | 19.05 | 0% | 100% | 15.0 |
| Single Parent Households | 3139 | 31.6% | 30.8% | 0% | 78.7% | 21.6 |
| Violent Crime | 2917 | 257.1 | 202.1 | 0 | 1989.5 | 0.04 |
| Injury Deaths | 3020 | 77.3 | 73.8 | 23.7 | 257.6 | 52.5 |
| Physical Environment | ||||||
| Air Pollution—Particulate Matter | 3108 | 11.6 | 11.9 | 7.2 | 14.9 | 2.6 |
| Drinking Water Violations | 3083 | 9.6% | 0.2% | 0% | 100% | 0.7 |
| Severe Housing Problems | 3141 | 14.5% | 13.9% | 2.2% | 71.3% | 0.9 |
| Driving Alone to Work | 78.2% | 79.7% | 3.9% | 93.9% | 7.0 | |
| Long Commute—Driving Alone | 29.6% | 28.7% | 0% | 71.2% | 2.0 | |
| Variable | Mortality R2 | Variables with r ≥ 0.60 | |||
|---|---|---|---|---|---|
| Top 10 Variables: Single Covariate Meta-Regression R2s and Other Variables | |||||
| Injury Deaths | 52.54 | none | |||
| Poverty | 49.34 | 0.736 Teen Births | −0.652 College | −0.644 Healthy Food | 0.637 Single Parent |
| Inactivity | 49.11 | 0.713 Obesity | |||
| College | 40.97 | −0.672 Teen Births | |||
| Smoking | 40.44 | none | |||
| Teen Births | 39.52 | 0.605 Uninsured | |||
| Congregations | 33.24 | −0.804 Population | 0.695 Rural | −0.606 Asian | |
| Obesity | 30.02 | 0.713 Inactivity | |||
| Asian | 29.75 | 0.611 Population | −0.601 Rural | ||
| Hospitalization | 29.33 | none | |||
| Other Variables with r ≥ 0.60 | |||||
| Hispanic | 0.847 Language | −0.619 White | |||
| Population | −0.770 Rural | ||||
| STI | 0.688 Black | −0.675 White | 0.661 Single Parent | ||
| Adherent Diversity | 0.681 Congregation Diversity | ||||
| Black | 0.646 Single Parent | −0.635 White | |||
| Construct and Variables | Single Covariate Model | Multivariate Models | |||||||
|---|---|---|---|---|---|---|---|---|---|
| Full | Parsimonious | ||||||||
| n | Coeff | % | n | Coeff | % | n | Coeff | % | |
| Religion | |||||||||
| Adherents | 3141 | 0.001 | <0.01 | 3141 | −0.028 | 43.2 | 3141 | −0.028 | 43.2 |
| Congregations | 0.019 | 33.2 | 0.020 | 0.020 | |||||
| Adherent Diversity | −0.036 | 11.0 | −0.026 | −0.027 | |||||
| Congregation Diversity | −0.051 | 9.8 | −0.001 | ||||||
| Place | |||||||||
| Population | 3141 | −0.005 | 14.8 | 3141 | −0.001 | 19.9 | 3141 | −0.001 | 19.9 |
| Rural | 0.019 | 19.2 | 0.016 | 0.016 | |||||
| Race and Language | |||||||||
| Black | 3141 | 0.021 | 5.4 | 3141 | 0.029 | 42.6 | 3141 | 0.029 | 42.6 |
| Indigenous | 0.009 | 0.3 | 0.019 | 0.019 | |||||
| Asian | −0.162 | 29.8 | −0.164 | −0.163 | |||||
| Hispanic | −0.030 | 8.8 | −0.001 | ||||||
| Pacific Islander | −0.242 | 7.0 | 0.102 | 0.101 | |||||
| White | 0.001 | <0.01 | |||||||
| Language | −0.089 | 14.5 | −0.045 | −0.049 | |||||
| Age and Gender | |||||||||
| Age < 18 | 3141 | −0.089 | 3.3 | 3141 | 0.037 | 24.4 | 3141 | 0.037 | 24.4 |
| Age ≥ 65 | 0.161 | 23.4 | 0.172 | 0.172 | |||||
| Female | 0.133 | 2.0 | 0.056 | 0.056 | |||||
| Individual Behaviors | |||||||||
| Smoking | 2711 | 0.160 | 40.4 | 3010 | 60.9 | 3010 | 60.9 | ||
| Obesity | 3141 | 0.221 | 30.0 | 0.014 | |||||
| Healthy Food | −0.006 | 13.6 | −0.002 | −0.002 | |||||
| Inactivity | 0.218 | 49.1 | 0.147 | 0.154 | |||||
| Exercise Access | 3117 | −0.026 | 16.2 | −0.002 | −0.003 | ||||
| Excess Drink | 2225 | −0.098 | 13.4 | ||||||
| Driving Deaths | 3115 | 0.001 | <0.01 | 0.003 | 0.003 | ||||
| STI | 3135 | 0.149 | 2.4 | −0.138 | −0.132 | ||||
| Teen Births | 3042 | 0.250 | 39.5 | 0.136 | 0.136 | ||||
| Clinical Care | |||||||||
| Uninsured | 3140 | 0.090 | 11.9 | 2843 | 0.054 | 39.8 | 2925 | 0.053 | 39.2 |
| Primary Care | 3017 | −0.000 | 7.8 | −0.000 | |||||
| Dentist | 3054 | −0.000 | 14.7 | −0.000 | −0.000 | ||||
| Hospitalization | 3011 | 0.000 | 29.3 | 0.000 | 0.000 | ||||
| Diabetes | 3094 | −0.048 | 4.4 | −0.002 | |||||
| Mammography | 3055 | −0.083 | 14.0 | −0.010 | −0.012 | ||||
| Social and Economic | |||||||||
| High School | 3117 | −0.036 | 5.6 | 3009 | 0.016 | 74.9 | 3009 | 0.016 | 74.9 |
| College | 3141 | −0.101 | 41.0 | −0.033 | −0.033 | ||||
| Unemployed | 3140 | 0.138 | 14.6 | 0.029 | 0.029 | ||||
| Poverty | 0.126 | 49.3 | 0.046 | 0.044 | |||||
| Income | 3141 | 0.008 | 8.7 | −0.000 | |||||
| Social Support | 2471 | 0.108 | 15.0 | ||||||
| Single Parent | 3139 | 0.081 | 21.6 | 0.028 | 0.027 | ||||
| Violent Crime | 2917 | 0.000 | 0.04 | ||||||
| Injury Deaths | 3020 | 0.001 | 52.5 | 0.000 | 0.000 | ||||
| Physical Environment | |||||||||
| Air Pollution | 3108 | 0.002 | 2.6 | 3056 | 0.001 | 10.5 | 3056 | 0.001 | 10.5 |
| Water Quality | 3083 | 0.005 | 0.7 | 0.007 | 0.007 | ||||
| Poor Housing | 3141 | −0.025 | 0.9 | −0.012 | −0.012 | ||||
| Drive Alone | 0.060 | 7.0 | 0.061 | 0.061 | |||||
| Long Commute | 0.021 | 2.0 | 0.016 | 0.016 | |||||
Publisher’s Note: MDPI stays neutral with regard to jurisdictional claims in published maps and institutional affiliations. |
© 2022 by the authors. Licensee MDPI, Basel, Switzerland. This article is an open access article distributed under the terms and conditions of the Creative Commons Attribution (CC BY) license (https://creativecommons.org/licenses/by/4.0/).
Share and Cite
Sissamis, F.; Villalba, K.; Garcia, J.; Melus, V.; Markentell, E.J.; Perez, L.D.; Ramirez, G. Religion and Death in the United States: A Meta-Regression Comparative Assessment of Between-County Mortality Heterogeneity in the United States. Int. J. Environ. Res. Public Health 2022, 19, 757. https://doi.org/10.3390/ijerph19020757
Sissamis F, Villalba K, Garcia J, Melus V, Markentell EJ, Perez LD, Ramirez G. Religion and Death in the United States: A Meta-Regression Comparative Assessment of Between-County Mortality Heterogeneity in the United States. International Journal of Environmental Research and Public Health. 2022; 19(2):757. https://doi.org/10.3390/ijerph19020757
Chicago/Turabian StyleSissamis, Frances, Karina Villalba, Jordan Garcia, Vickie Melus, Emily J. Markentell, Ligia D. Perez, and Gilbert Ramirez. 2022. "Religion and Death in the United States: A Meta-Regression Comparative Assessment of Between-County Mortality Heterogeneity in the United States" International Journal of Environmental Research and Public Health 19, no. 2: 757. https://doi.org/10.3390/ijerph19020757