
The Changing Landscape of Food Deserts and Swamps over More than a Decade in Flanders, Belgium

Abstract
:1. Background
2. Methods
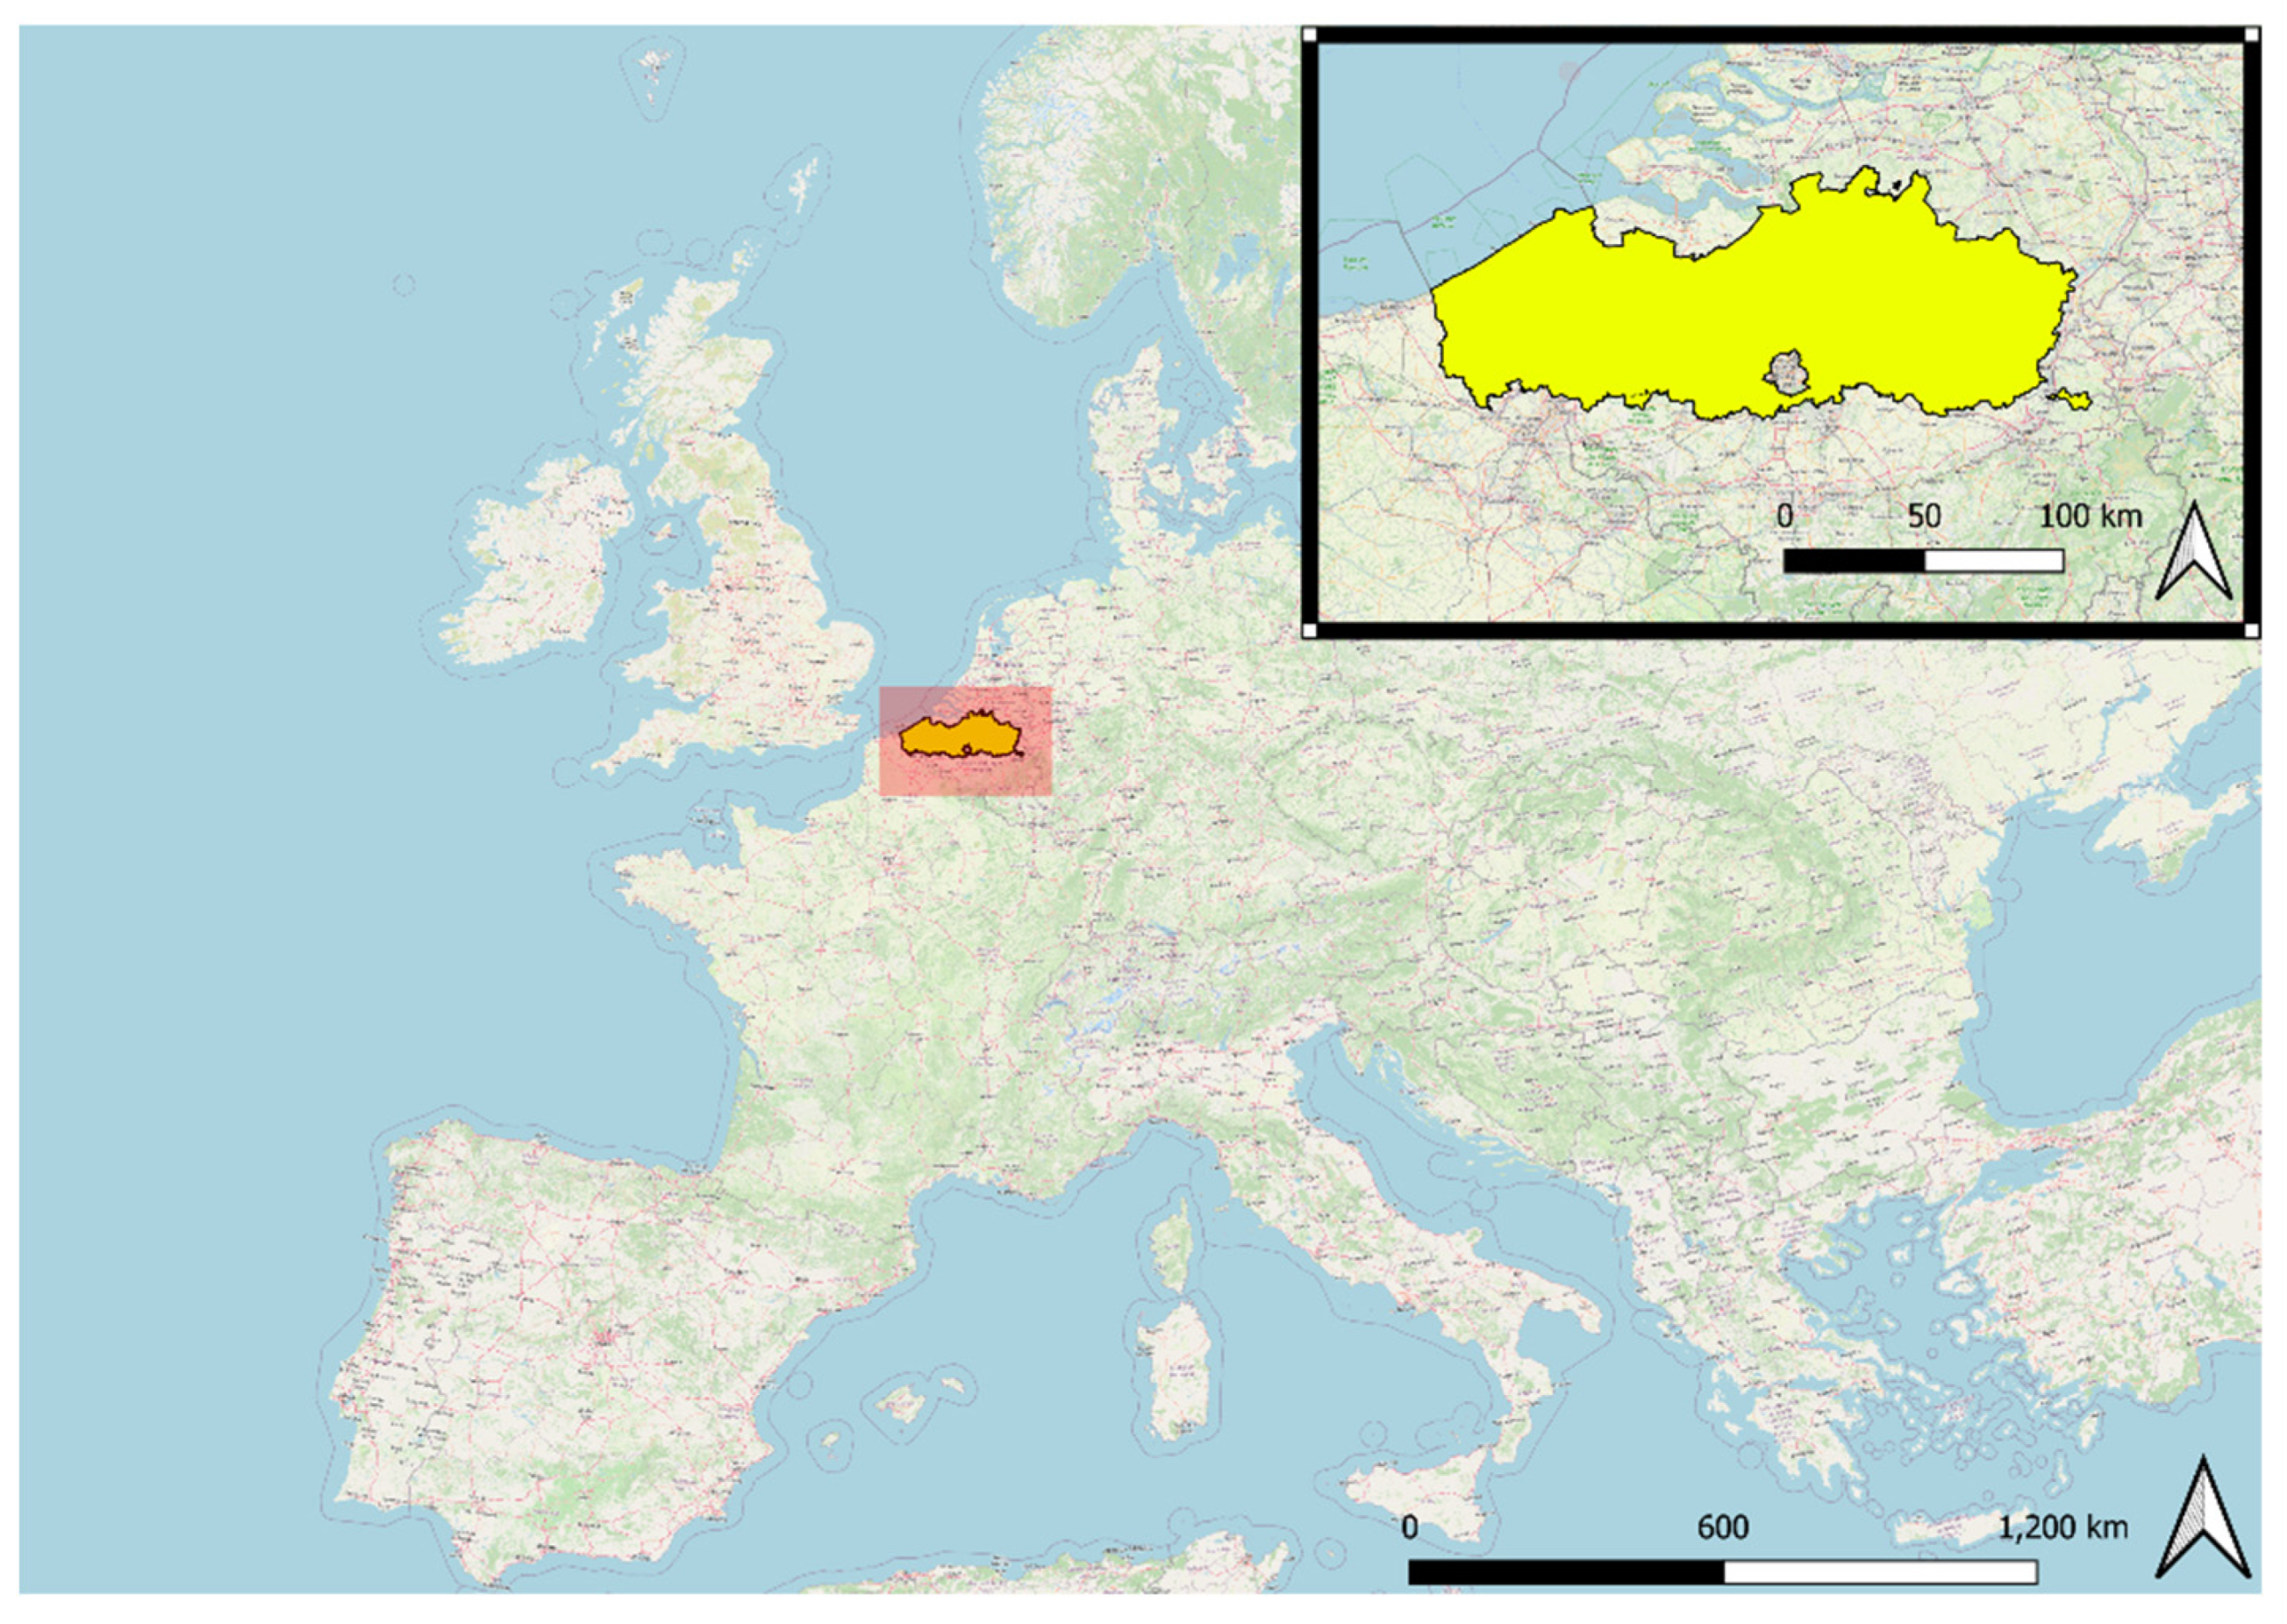
2.1. Study Area
2.2. Data Sources
2.2.1. Technical Roadmap
2.2.2. Residential Areas
2.3. Food Deserts
2.4. Food Swamps
3. Results
3.1. Food Deserts
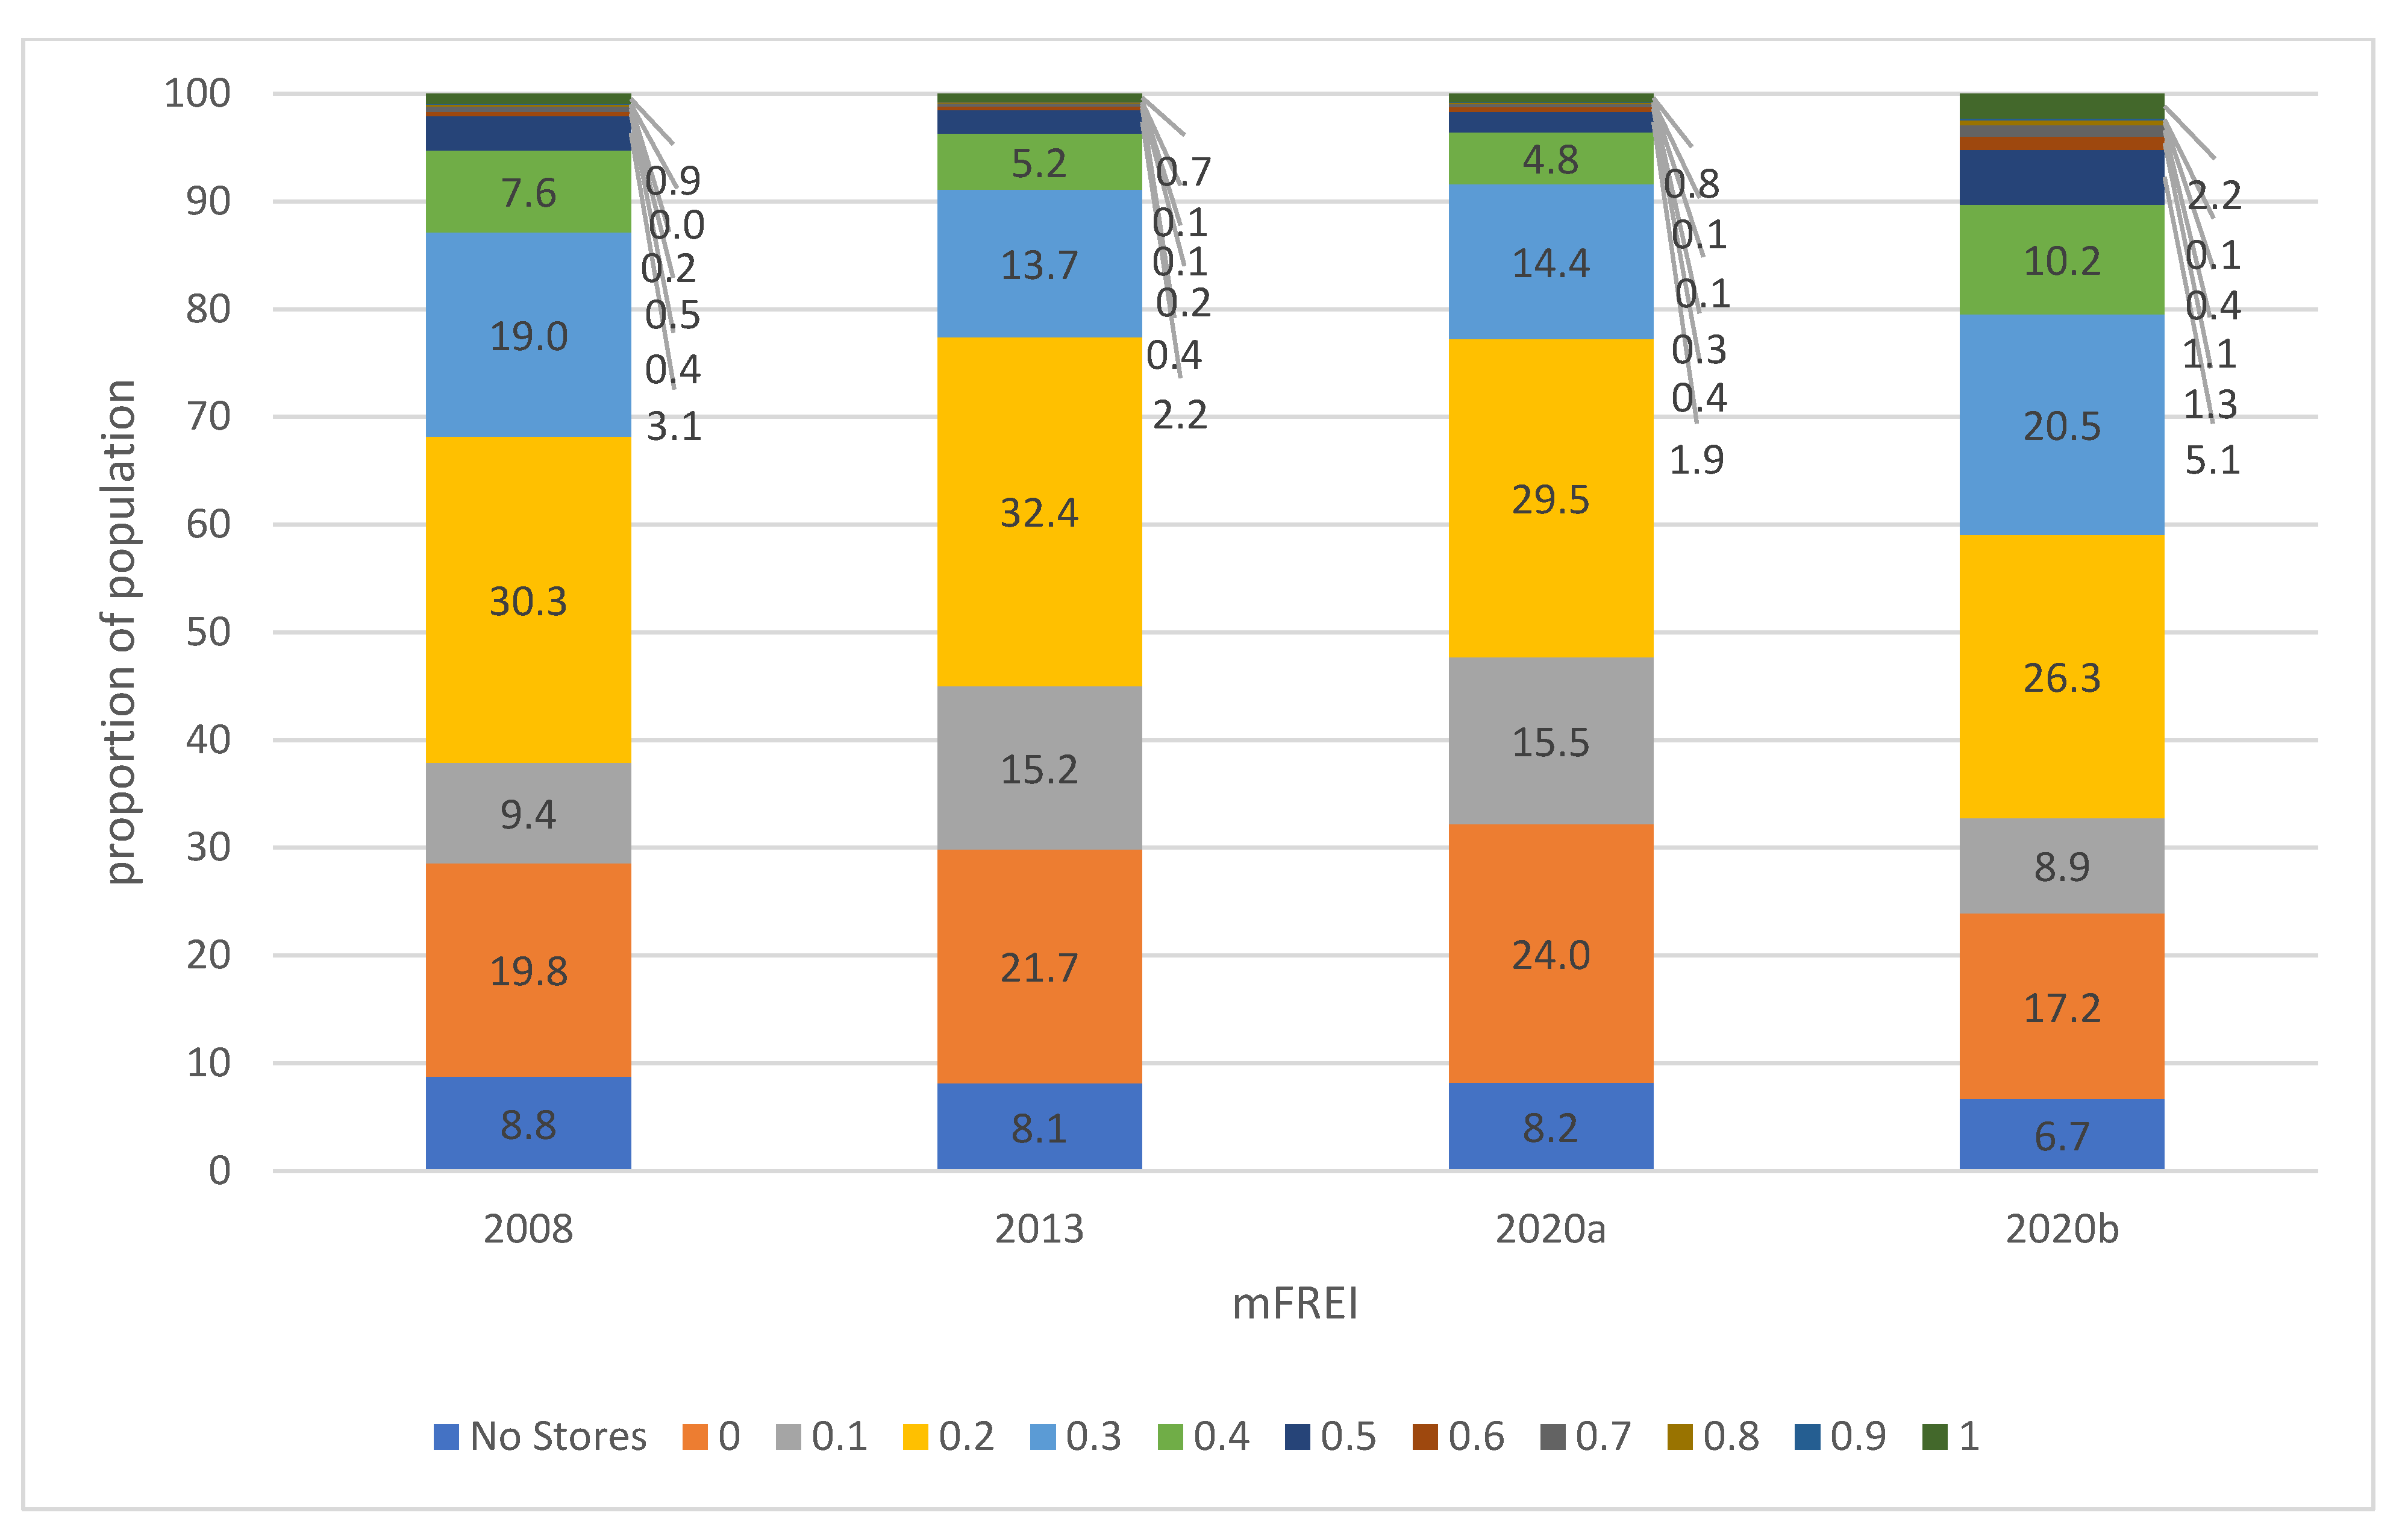
3.2. Food Swamps
4. Discussion
4.1. Food Deserts
4.2. Food Swamps
4.3. Strengths and Limitations
4.4. Policy Recommendations and Future Research
5. Conclusions
Supplementary Materials
Author Contributions
Funding
Institutional Review Board Statement
Informed Consent Statement
Data Availability Statement
Conflicts of Interest
Abbreviations
References
- Swinburn, B.A.; Sacks, G.; Hall, K.D.; McPherson, K.; Finegood, D.T.; Moodie, M.L.; Gortmaker, S.L. The global obesity pandemic: Shaped by global drivers and local environments. The Lancet 2011, 378, 804–814. [Google Scholar] [CrossRef]
- Van der Heyden, J.; Nguyen, D.; Renard, F.; Scohy, A.; Demarest, S.; Drieskens, S.; Gysle, L. Enquete de Sante par Examen Belge; Report No.: D/2019/14.440/90; Sciensano: Bruxelles, Belgique, 2019; Available online: www.enquetesante.be (accessed on 29 November 2021).
- Abbasi, F.; Brown, B.W.; Lamendola, C.; McLaughlin, T.; Reaven, G.M. Relationship between obesity, insulin resistance, and coronary heart disease risk. J. Am. Coll. Cardiol. 2002, 40, 937–943. [Google Scholar] [CrossRef] [Green Version]
- Wolin, K.Y.; Carson, K.; Colditz, G.A. Obesity and Cancer. Oncologist 2010, 15, 556–565. [Google Scholar] [CrossRef]
- Ross, S.E.; Flynn, J.I.; Pate, R.R. What is really causing the obesity epidemic? A review of reviews in children and adults. J. Sport. Sci. 2016, 34, 1148–1153. [Google Scholar] [CrossRef]
- Vandevijvere, S.; De Ridder, K.; Fiolet, T.; Bel, S.; Tafforeau, J. Consumption of ultra-processed food products and diet quality among children, adolescents and adults in Belgium. Eur. J. Nutr. 2019, 58, 3267–3278. [Google Scholar] [CrossRef]
- Hall, K.D. Did the Food Environment Cause the Obesity Epidemic? Obesity 2018, 26, 11–13. [Google Scholar] [CrossRef] [PubMed]
- Cobb, L.K.; Appel, L.J.; Franco, M.; Jones-Smith, J.C.; Nur, A.; Anderson, C.A.M. The relationship of the local food environment with obesity: A systematic review of methods, study quality, and results: The Local Food Environment and Obesity. Obesity 2015, 23, 1331–1344. [Google Scholar] [CrossRef] [PubMed] [Green Version]
- EPHA. What Are “Food Environments”?-EPHA. 2019. Available online: https://epha.org/what-are-food-environments (accessed on 19 July 2021).
- The Lancet. The Lancet Series on Obesity. 2015. Available online: https://www.thelancet.com/series/obesity-2015 (accessed on 8 April 2021).
- Ranjit, N.; Wilkinson, A.V.; Lytle, L.M.; Evans, A.E.; Saxton, D.; Hoelscher, D.M. Socioeconomic inequalities in children’s diet: The role of the home food environment. Int. J. Behav. Nutr. Phys. Act. 2015, 12, S4. [Google Scholar] [CrossRef] [Green Version]
- Salinas, J.; Abdelbary, B.; Klaas, K.; Tapia, B.; Sexton, K. Socioeconomic Context and the Food Landscape in Texas: Results from Hotspot Analysis and Border/Non-Border Comparison of Unhealthy Food Environments. Int. J. Environ. Res. Public Health 2014, 11, 5640–5650. [Google Scholar] [CrossRef]
- Torres de Araújo, J.R.; Tomaz de Lima, R.R.; Ferreira-Bendassolli, I.M.; Costa-de Lima, K. Functional, nutritional and social factors associated with mobility limitations in the elderly: A systematic review. Salud Publica Mex. 2018, 60, 579. [Google Scholar] [CrossRef]
- Hensher, D.A. Some Insights into the Key Influences on Trip-Chaining Activity and Public Transport Use of Seniors and the Elderly. Int. J. Sustain. Transp. 2007, 1, 53–68. [Google Scholar] [CrossRef]
- Ryan, J.; Wretstrand, A. What’s mode got to do with it? Exploring the links between public transport and car access and opportunities for everyday activities among older people. Travel Behav. Soc. 2019, 14, 107–118. [Google Scholar] [CrossRef]
- Payn, T.; Pfeiffer, K.A.; Hutto, B.; Vena, J.E.; LaMonte, M.J.; Blair, S.N.; Hooker, S.P. Daily Steps in Midlife and Older Adults. Null 2008, 79, 128–132. [Google Scholar] [CrossRef]
- He, M.; Tucker, P.; Gilliland, J.; Irwin, J.D.; Larsen, K.; Hess, P. The Influence of Local Food Environments on Adolescents’ Food Purchasing Behaviors. Int. J. Environ. Res. Public Health 2012, 9, 1458–1471. [Google Scholar] [CrossRef] [PubMed] [Green Version]
- World Health Organization. Food Marketing Exposure and Power and Their Associations with Food-Related Attitudes, Beliefs and Behaviours: A Narrative Review; World Health Organization: Geneva, Switzerland, 2022; Available online: https://apps.who.int/iris/handle/10665/351521 (accessed on 23 March 2022).
- Boyland, E.J.; Nolan, S.; Kelly, B.; Tudur-Smith, C.; Jones, A.; Halford, J.C.; Robinson, E. Advertising as a cue to consume: A systematic review and meta-analysis of the effects of acute exposure to unhealthy food and nonalcoholic beverage advertising on intake in children and adults. Am. J. Clin. Nutr. 2016, 103, 519–533. [Google Scholar] [CrossRef] [PubMed] [Green Version]
- Qutteina, Y.; De Backer, C.; Smits, T. Media food marketing and eating outcomes among pre-adolescents and adolescents: A systematic review and meta-analysis. Obes. Rev. 2019, 20, 1708–1719. [Google Scholar] [CrossRef] [PubMed]
- Neufeld, L.M.; Andrade, E.B.; Suleiman, A.B.; Barker, M.; Beal, T.; Blum, L.S.; Demmler, K.M.; Dogra, S.; Hardy-Johnson, P.; Lahiri, A.; et al. Food choice in transition: Adolescent autonomy, agency, and the food environment. Lancet 2022, 399, 185–197. [Google Scholar] [CrossRef]
- Beaulac, J.; Kristjansson, E.; Cummins, S. A Systematic Review of Food Deserts, 1966–2007. Prev. Chronic Dis. 2009, 6, 10. [Google Scholar]
- Cooksey-Stowers, K.; Schwartz, M.; Brownell, K. Food Swamps Predict Obesity Rates Better Than Food Deserts in the United States. Int. J. Environ. Res. Public Health 2017, 14, 1366. [Google Scholar] [CrossRef] [Green Version]
- Hager, E.R.; Cockerham, A.; O’Reilly, N.; Harrington, D.; Harding, J.; Hurley, K.M.; Black, M.M. Food swamps and food deserts in Baltimore City, MD, USA: Associations with dietary behaviours among urban adolescent girls. Public Health Nutr. 2017, 20, 2598–2607. [Google Scholar] [CrossRef] [Green Version]
- Ghosh-Dastidar, B.; Cohen, D.; Hunter, G.; Zenk, S.N.; Huang, C.; Beckman, R.; Dubowitz, T. Distance to Store, Food Prices, and Obesity in Urban Food Deserts. Am. J. Prev. Med. 2014, 45, 587–595. [Google Scholar] [CrossRef] [PubMed]
- Dubowitz, T.; Ghosh-Dastidar, M.; Cohen, D.A.; Beckman, R.; Steiner, E.D.; Hunter, G.P.; Flórez, K.; Huang, C.; Vaughan, C.A.; Sloan, J.C.; et al. Diet and Perceptions Change with Supermarket Introduction in a Food Desert, But Not Because of Supermarket Use. Health Aff. 2015, 34, 1858–1868. [Google Scholar] [CrossRef] [PubMed] [Green Version]
- Michimi, A.; Wimberly, M.C. Associations of supermarket accessibility with obesity and fruit and vegetable consumption in the conterminous United States. Int. J. Health Geogr. 2010, 9, 49. [Google Scholar] [CrossRef] [Green Version]
- Testa, A.; Jackson, D.B.; Semenza, D.C.; Vaughn, M.G. Food deserts and cardiovascular health among young adults. Public Health Nutr. 2021, 24, 117–124. [Google Scholar] [CrossRef] [PubMed]
- Fong, A.J.; Lafaro, K.; Ituarte, P.H.G.; Fong, Y. Association of Living in Urban Food Deserts with Mortality from Breast and Colorectal Cancer. Ann. Surg. Oncol. 2021, 28, 1311–1319. [Google Scholar] [CrossRef]
- Phillips, A.Z.; Rodriguez, H.P. Adults with diabetes residing in “food swamps” have higher hospitalization rates. Health Services Research. 2019, 54, 217–225. [Google Scholar] [CrossRef] [PubMed] [Green Version]
- Hamidi, S. Urban sprawl and the emergence of food deserts in the USA. Urban Stud. 2020, 57, 1660–1675. [Google Scholar] [CrossRef]
- Slater, J.; Epp-Koop, S.; Jakilazek, M.; Green, C. Food deserts in Winnipeg, Canada: A novel method for measuring a complex and contested construct. Health Promot. Chronic Dis. Prev. Can. 2017, 37, 350–356. [Google Scholar] [CrossRef] [Green Version]
- Sushil, Z.; Vandevijvere, S.; Exeter, D.J.; Swinburn, B. Food swamps by area socioeconomic deprivation in New Zealand: A national study. Int. J. Public Health. 2017, 62, 869–877. [Google Scholar] [CrossRef]
- Helbich, M.; Schadenberg, B.; Hagenauer, J.; Poelman, M. Food deserts? Healthy food access in Amsterdam. Appl. Geogr. 2017, 83, 1–12. [Google Scholar] [CrossRef]
- Križan, F.; Bilková, K.; Kita, P.; Horňák, M. Potential food deserts and food oases in a post-communist city: Access, quality, variability and price of food in Bratislava-Petržalka. Appl. Geogr. 2015, 62, 8–18. [Google Scholar] [CrossRef]
- Trembošová, M.; Jakab, I. Spreading of Food Deserts in Time and Space: The Case of the City of Nitra (Slovakia). Sustainability 2021, 13, 7138. [Google Scholar] [CrossRef]
- Neumeier, S.; Kokorsch, M. Supermarket and discounter accessibility in rural Germany–identifying food deserts using a GIS accessibility model. J. Rural. Stud. 2021, 86, 247–261. [Google Scholar] [CrossRef]
- Poelmans, L.; Van Rompaey, A. Detecting and modelling spatial patterns of urban sprawl in highly fragmented areas: A case study in the Flanders–Brussels region. Landsc. Urban Plan. 2009, 93, 10–19. [Google Scholar] [CrossRef]
- Roser, M.; Ortiz-Ospina, E. Income Inequality. Our World in Data, 5 December 2013. Available online: https://ourworldindata.org/income-inequality(accessed on 11 October 2022).
- Ritchie, H.; Roser, M. Age Structure. Our World in Data, 20 September 2019. Available online: https://ourworldindata.org/age-structure(accessed on 11 October 2022).
- Cant, J. Food Inaccessibility in Flanders Identifying Spatial Mismatches between Retail and Residential Patterns. Ph.D. Thesis, University of Antwerp, Antwerp, Belgium, 2019. Available online: https://repository.uantwerpen.be/docman/irua/3ee5e1/157248.pdf (accessed on 3 April 2021).
- Atelier Romain; Instituut Gezond Leven; Let Us. Voedselomgevingen in Kaart en Beeld. 2021. Available online: https://omgeving.vlaanderen.be/sites/default/files/atoms/files/20211008_Rapport%20Voedselomgevingen%20in%20kaart%20en%20beeld_AR-GL-Let%20Us_compr.pdf (accessed on 22 March 2021).
- Statbel. Structuur van de Bevolking. 2021. Available online: https://statbel.fgov.be/nl/themas/bevolking/structuur-van-de-bevolking (accessed on 7 September 2021).
- Locatus. Locatus. 2020. Available online: https://locatus.com/ (accessed on 2 August 2021).
- Canalia, C.; Pinho, M.; Lakerveld, J.; Mackenbach, J. Field Validation of Commercially Available Food Retailer Data in the Netherlands. Int. J. Environ. Res. Public Health 2016, 17, 1946. [Google Scholar] [CrossRef] [Green Version]
- CDC. Census Tract Level State Maps of the Modified Retail Food Environment Index (mRFEI); CDC: Atlanta, GE, USA, 2011; p. 54. Available online: https://www.cdc.gov/obesity/downloads/census-tract-level-state-maps-mrfei_TAG508.pdf (accessed on 5 February 2021).
- Luan, H.; Law, J.; Quick, M. Identifying food deserts and swamps based on relative healthy food access: A spatio-temporal Bayesian approach. Int. J. Health Geogr. 2015, 14, 37. [Google Scholar] [CrossRef] [Green Version]
- Miller, M.K. The Relationship between Food Environments and Obesity Rates in the United States; Measured by the Modified Retail Food Environment Index. 2021. Available online: https://tigerprints.clemson.edu/cgi/viewcontent.cgi?article=4713&context=all_theses (accessed on 2 May 2022).
- Informatie Vlaanderen. Centraal Referentieadressenbestand (CRAB). 2022. Available online: https://overheid.vlaanderen.be/informatie-vlaanderen/producten-diensten/centraal-referentieadressenbestand-crab (accessed on 19 January 2022).
- Vlaanderen. Geopunt. 2022. Available online: www.geopunt.be (accessed on 19 January 2022).
- Vlaanderen. VKBO Ondernemingen en Vestigingseenheden. 2022. Available online: https://www.geopunt.be/catalogus/datasetfolder/ecc4e0d3-e7be-4755-be91-48985559495d (accessed on 19 January 2022).
- Vlaanderen, O. Basiskaart Vlaanderen (GRB). 2021. Available online: https://overheid.vlaanderen.be/informatie-vlaanderen/producten-diensten/basiskaart-vlaanderen-grb (accessed on 12 January 2022).
- Statistiek Vlaanderen. Persoonlijk Inkomen. 2021. Available online: https://www.statistiekvlaanderen.be/nl/persoonlijk-inkomen (accessed on 12 January 2022).
- Vlaams Instituut Gezond Leven. Walkability Score Tool. 2022. Available online: https://www.gezondleven.be/settings/gezonde-gemeente/gezonde-publieke-ruimte/walkability-tool (accessed on 2 July 2022).
- Koh, K.; Grady, S.C.; Vojnovic, I. Using simulated data to investigate the spatial patterns of obesity prevalence at the census tract level in metropolitan Detroit. Appl. Geogr. 2015, 62, 19–28. [Google Scholar] [CrossRef]
- Sadler, R.C.; Gilliland, J.A.; Arku, G. An application of the edge effect in measuring accessibility to multiple food retailer types in Southwestern Ontario, Canada. Int. J. Health Geogr. 2011, 10, 34. [Google Scholar] [CrossRef] [Green Version]
- Scharadin, B.; Ver Ploeg, M.; Dicken, C. Geographic Boundary Definitions and the Robustness of Common Food Retail Environment Measures. Null 2021, 112, 1403–1423. [Google Scholar] [CrossRef]
- Euromonitor International. Supermarkets in Belgium. 2022. Available online: https://www.euromonitor.com/supermarkets-in-belgium/report# (accessed on 12 January 2022).
- European Commission; Ernst&Young; Arcadia International; Cambridge Econometrics. The Economic Impact of Modern Retail on Choice and Innovation in the EU Food Sector: Final Report; Publications Office: Luxembourg, 2014. Available online: https://data.europa.eu/doi/10.2763/77405 (accessed on 19 January 2022).
- Karpyn, A.E.; Riser, D.; Tracy, T.; Wang, R.; Shen, Y. The changing landscape of food deserts. UNSCN Nutr. 2019, 44, 46. [Google Scholar]
- Statistiek Vlaanderen. Bevolking Onder de Armoededrempel. 2021. Available online: https://www.statistiekvlaanderen.be/nl/bevolking-onder-de-armoededrempel (accessed on 19 January 2022).
- Robitaille, É.; Paquette, M.C. Development of a Method to Locate Deserts and Food Swamps Following the Experience of a Region in Quebec, Canada. Int. J. Environ. Res. Public Health 2020, 17, 3359. [Google Scholar] [CrossRef] [PubMed]
- Cephir. Is Rotterdam een Fastfoodparadijs? De Voedselomgeving van 2004 to 2018. 2019. Available online: https://www.cephir.nl/onderzoek/Rotterdam-voedselomgeving_Rapport_CEPHIR_WEB.pdf (accessed on 12 January 2022).
- Smets, V.; Vandevijvere, S. Changes in retail food environments around schools over 12 years and associations with overweight and obesity among children and adolescents in Flanders, Belgium. BMC Public Health 2022, 22, 1570. [Google Scholar] [CrossRef] [PubMed]
- Hood, N.; Clarke, G.; Clarke, M. Segmenting the growing UK convenience store market for retail location planning. Null 2016, 26, 113–136. [Google Scholar] [CrossRef]


| Dataset | Source | Description |
|---|---|---|
| Locatus | Locatus company | Dataset containing all food retailers and restaurants in Flanders for the years 2008, 2013 and 2020. |
| GRB | Flemish government | Dataset containing all roads, census tract boundaries, bus stops and the degree of urbanization in Flanders. |
| CRAB | Flemish government | Central reference addresses database. Contains all official addresses in Flanders. |
| VKBO | Flemish government | Dataset containing all addresses of public and private companies in Flanders. |
| Income related data | National and Flemish statistical services | Dataset containing income related data on the census tract level. |
| Age related data | National and Flemish statistical services | Dataset containing age related data on the census tract level. |
| Walkability score | Flemish institute of healthy living | Dataset that scores each area based on its walkability. |
| Indicator | 2008 | 2013 | 2020 |
|---|---|---|---|
| Potential food desert [km2] | 3903.9 | 3873 | 3956.6 |
| Potential food desert [% area] | 56.3 | 55.7 | 56.9 |
| Potential food desert [% population] | 27.4 | 26.9 | 28.3 |
| Food desert >65Y [km2] | 180.2 | 191.7 | 218.7 |
| Food desert >65Y [% area] | 2.5 | 2.7 | 3.1 |
| Food desert >65Y [% population] | 2.2 | 2.3 | 2.8 |
| Food desert low incomes [km2] | 546.2 | 408.1 | 333.8 |
| Food desert low incomes [% area] | 7.8 | 5.9 | 4.7 |
| Food desert low incomes [% population] | 1.7 | 1.2 | 1.1 |
| Food desert low walkability [km2] | n.a. | n.a. | 340.2 |
| Food desert low walkability [% area] | n.a. | n.a. | 4.9 |
| Food desert low walkability [% population] | n.a. | n.a. | 1.0 |
| Food desert total [km2] | 712.6 * | 583.0 * | 811.5 |
| Food desert total [% area] | 10.2 * | 8.4 * | 11.8 |
| Food desert total [% population] | 3.8 * | 3.7 * | 4.9 |
| >65Y | <15Y | Low Income | Low Walkability | |
|---|---|---|---|---|
| % area | 19.1% | 19.6% | 13.7% | 5.2% |
| % population | 42.9% | 44.0% | 20.0% | 1.3% |
Publisher’s Note: MDPI stays neutral with regard to jurisdictional claims in published maps and institutional affiliations. |
© 2022 by the authors. Licensee MDPI, Basel, Switzerland. This article is an open access article distributed under the terms and conditions of the Creative Commons Attribution (CC BY) license (https://creativecommons.org/licenses/by/4.0/).
Share and Cite
Smets, V.; Cant, J.; Vandevijvere, S. The Changing Landscape of Food Deserts and Swamps over More than a Decade in Flanders, Belgium. Int. J. Environ. Res. Public Health 2022, 19, 13854. https://doi.org/10.3390/ijerph192113854
Smets V, Cant J, Vandevijvere S. The Changing Landscape of Food Deserts and Swamps over More than a Decade in Flanders, Belgium. International Journal of Environmental Research and Public Health. 2022; 19(21):13854. https://doi.org/10.3390/ijerph192113854
Chicago/Turabian StyleSmets, Vincent, Jeroen Cant, and Stefanie Vandevijvere. 2022. "The Changing Landscape of Food Deserts and Swamps over More than a Decade in Flanders, Belgium" International Journal of Environmental Research and Public Health 19, no. 21: 13854. https://doi.org/10.3390/ijerph192113854
APA StyleSmets, V., Cant, J., & Vandevijvere, S. (2022). The Changing Landscape of Food Deserts and Swamps over More than a Decade in Flanders, Belgium. International Journal of Environmental Research and Public Health, 19(21), 13854. https://doi.org/10.3390/ijerph192113854