
Analysis of Blood Biochemistry and Pituitary-Gonadal Histology after Chronic Exposure to Bisphenol-A of Mice
 , , and
Abstract
:1. Introduction
2. Materials and Methods
2.1. Animals
2.2. Experiment Design
2.3. Determination of Biochemical Parameters from Serum
2.4. Gonads, Absolute and Relative Weights
2.5. Histopathological Analysis of Gonads and Pituitary Gland
2.6. Statistical Analysis
3. Results
3.1. Clinical Evaluation
3.2. Biochemical Parameters
3.2.1. Glucose
3.2.2. Triglycerides
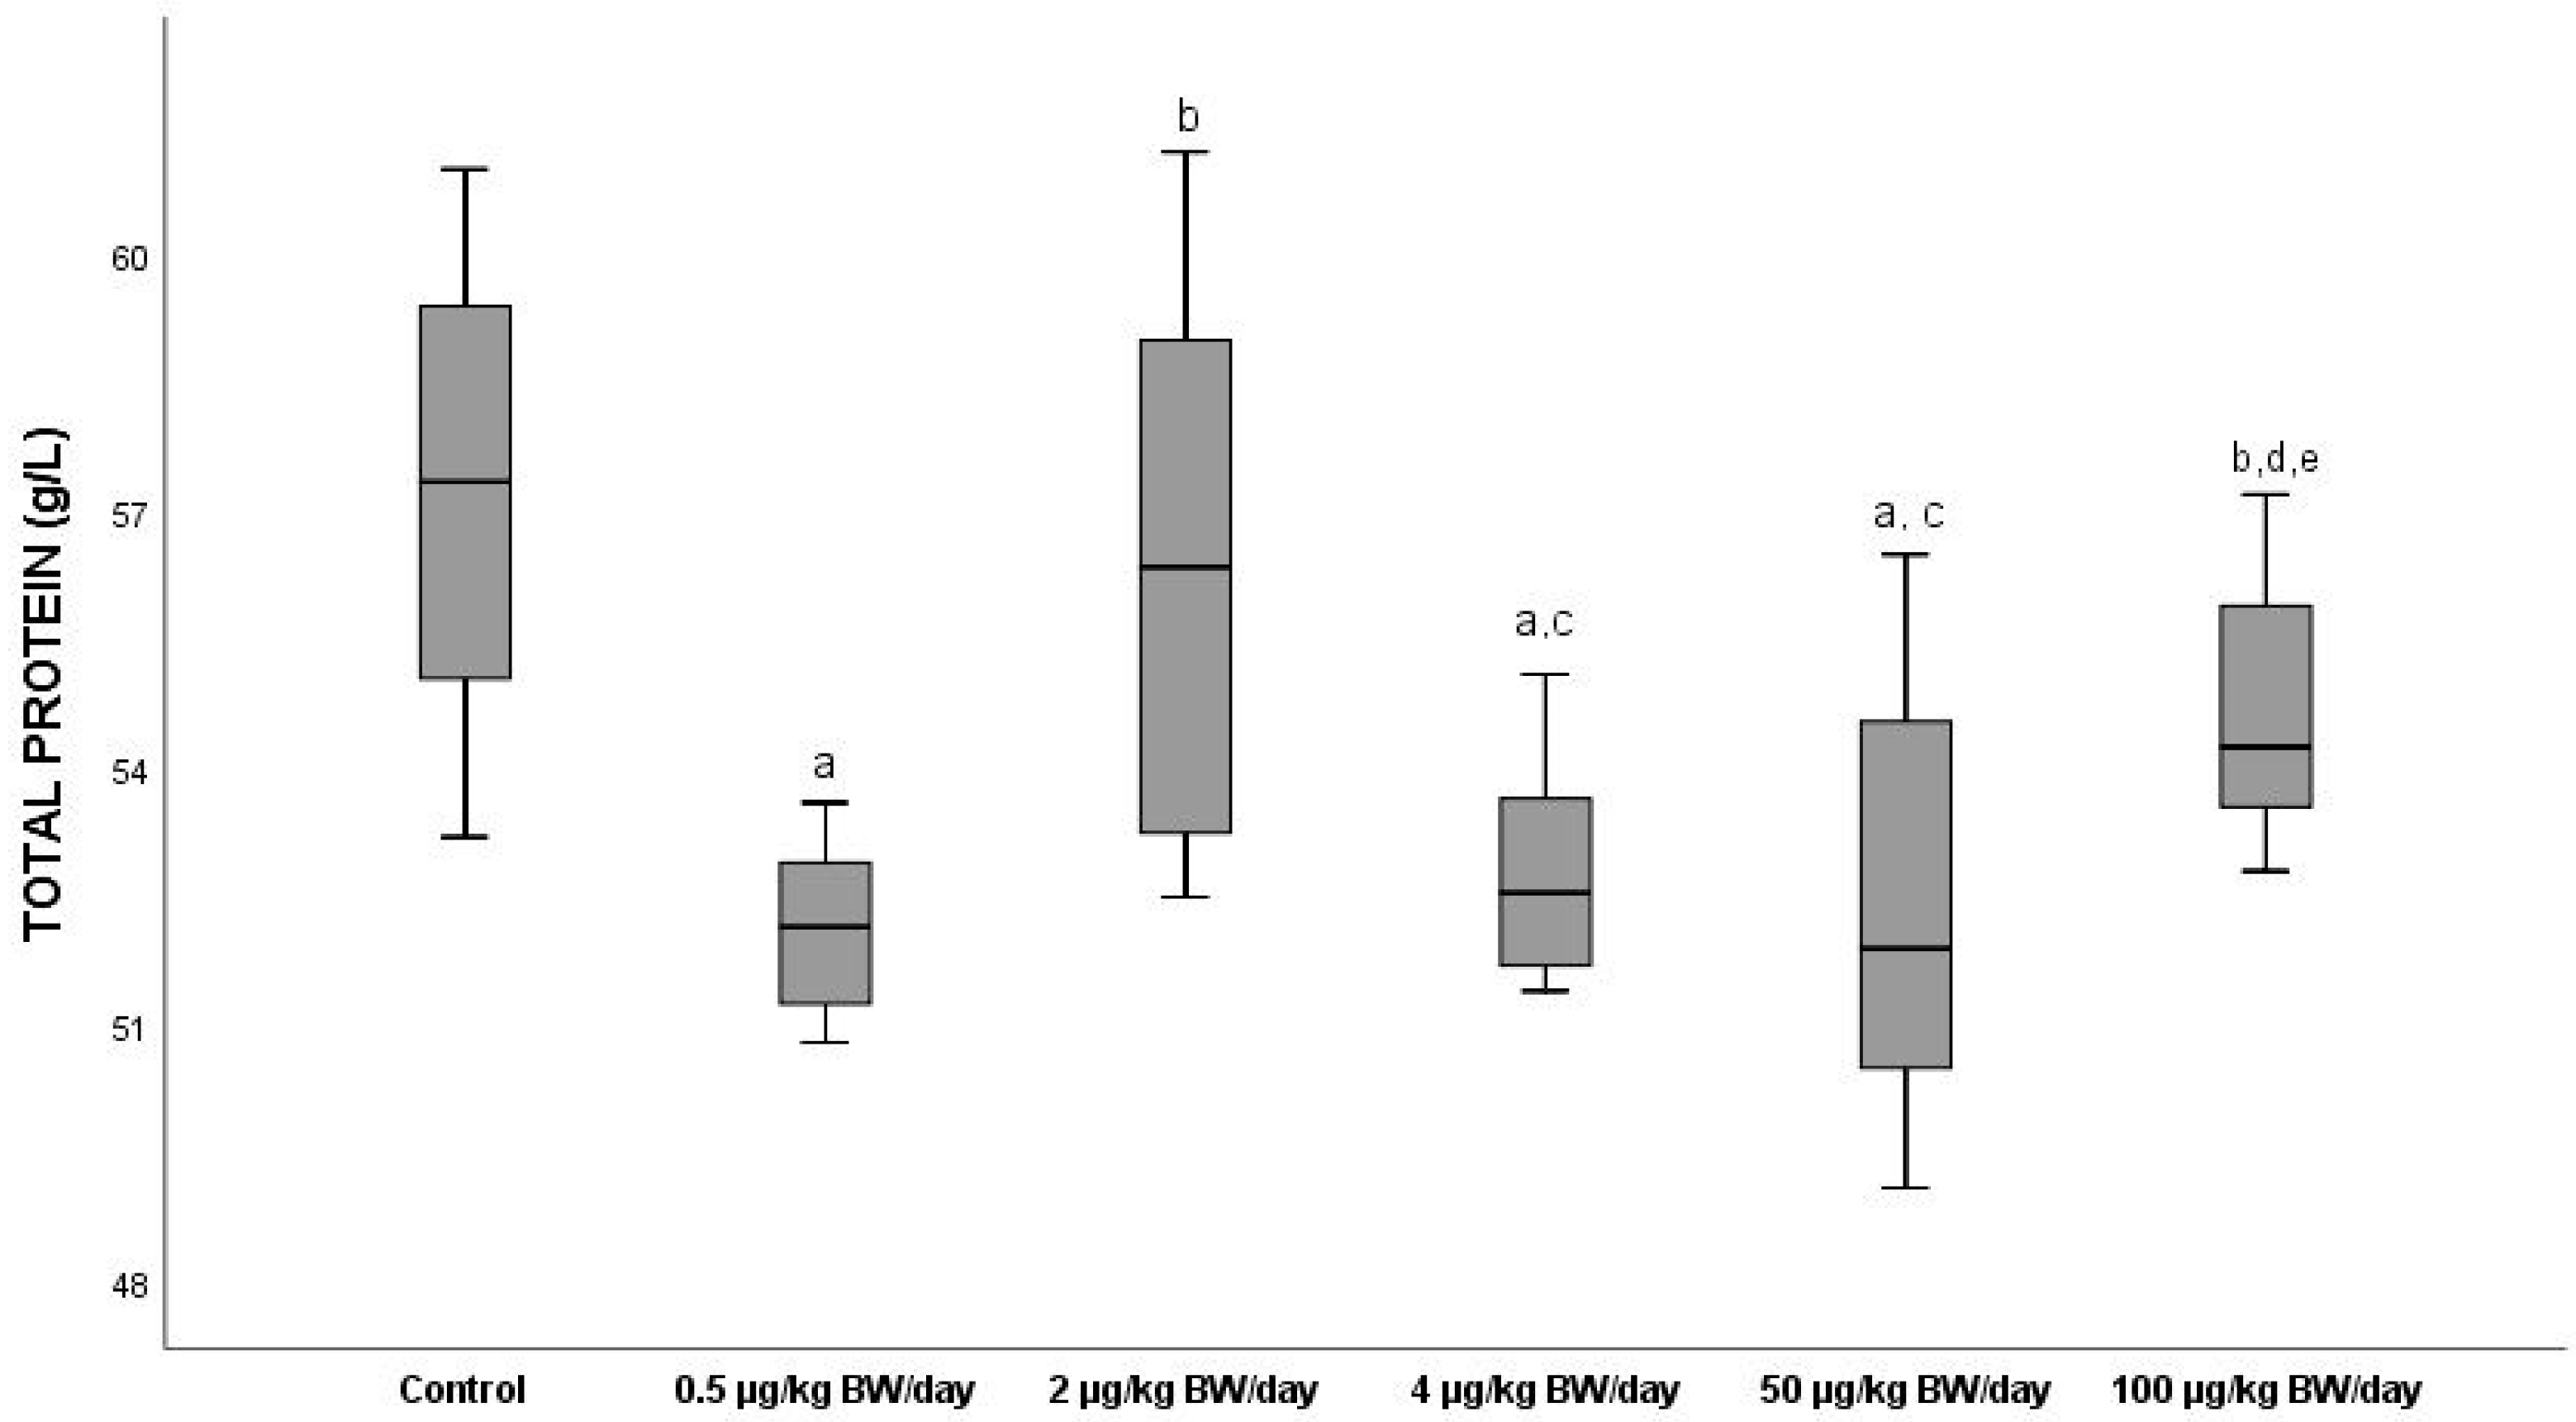
3.2.3. Total Proteins
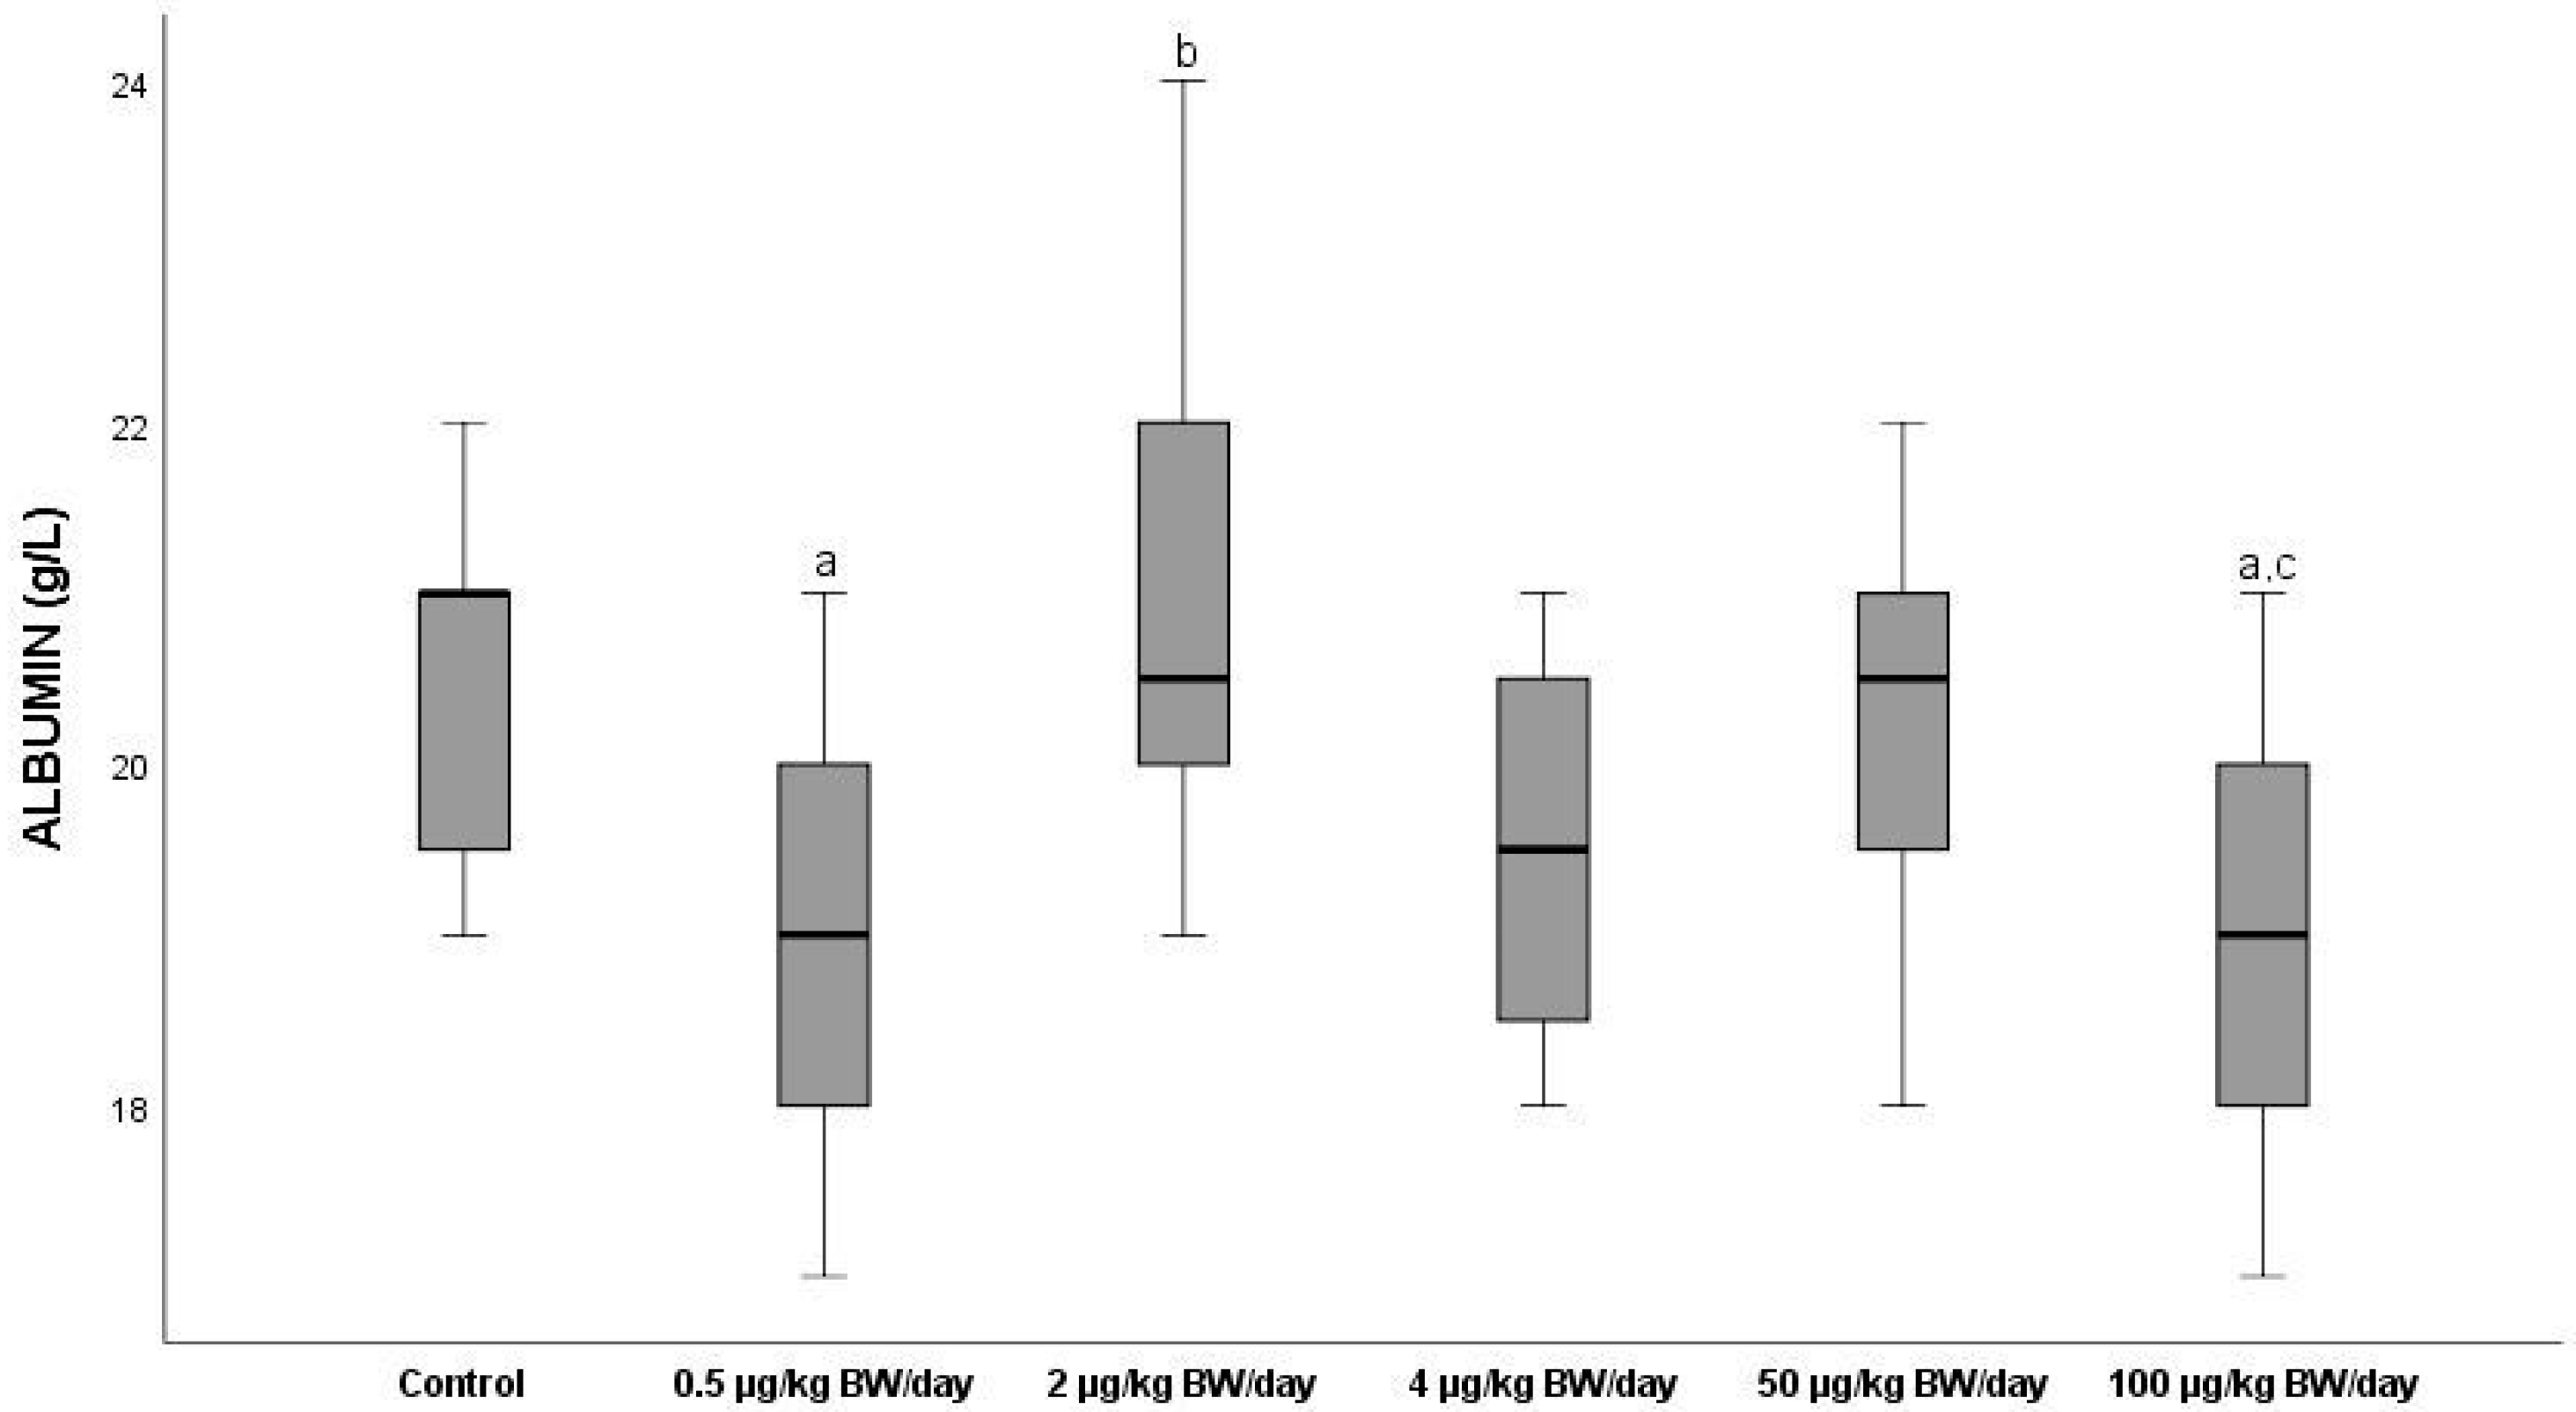
3.2.4. Albumin
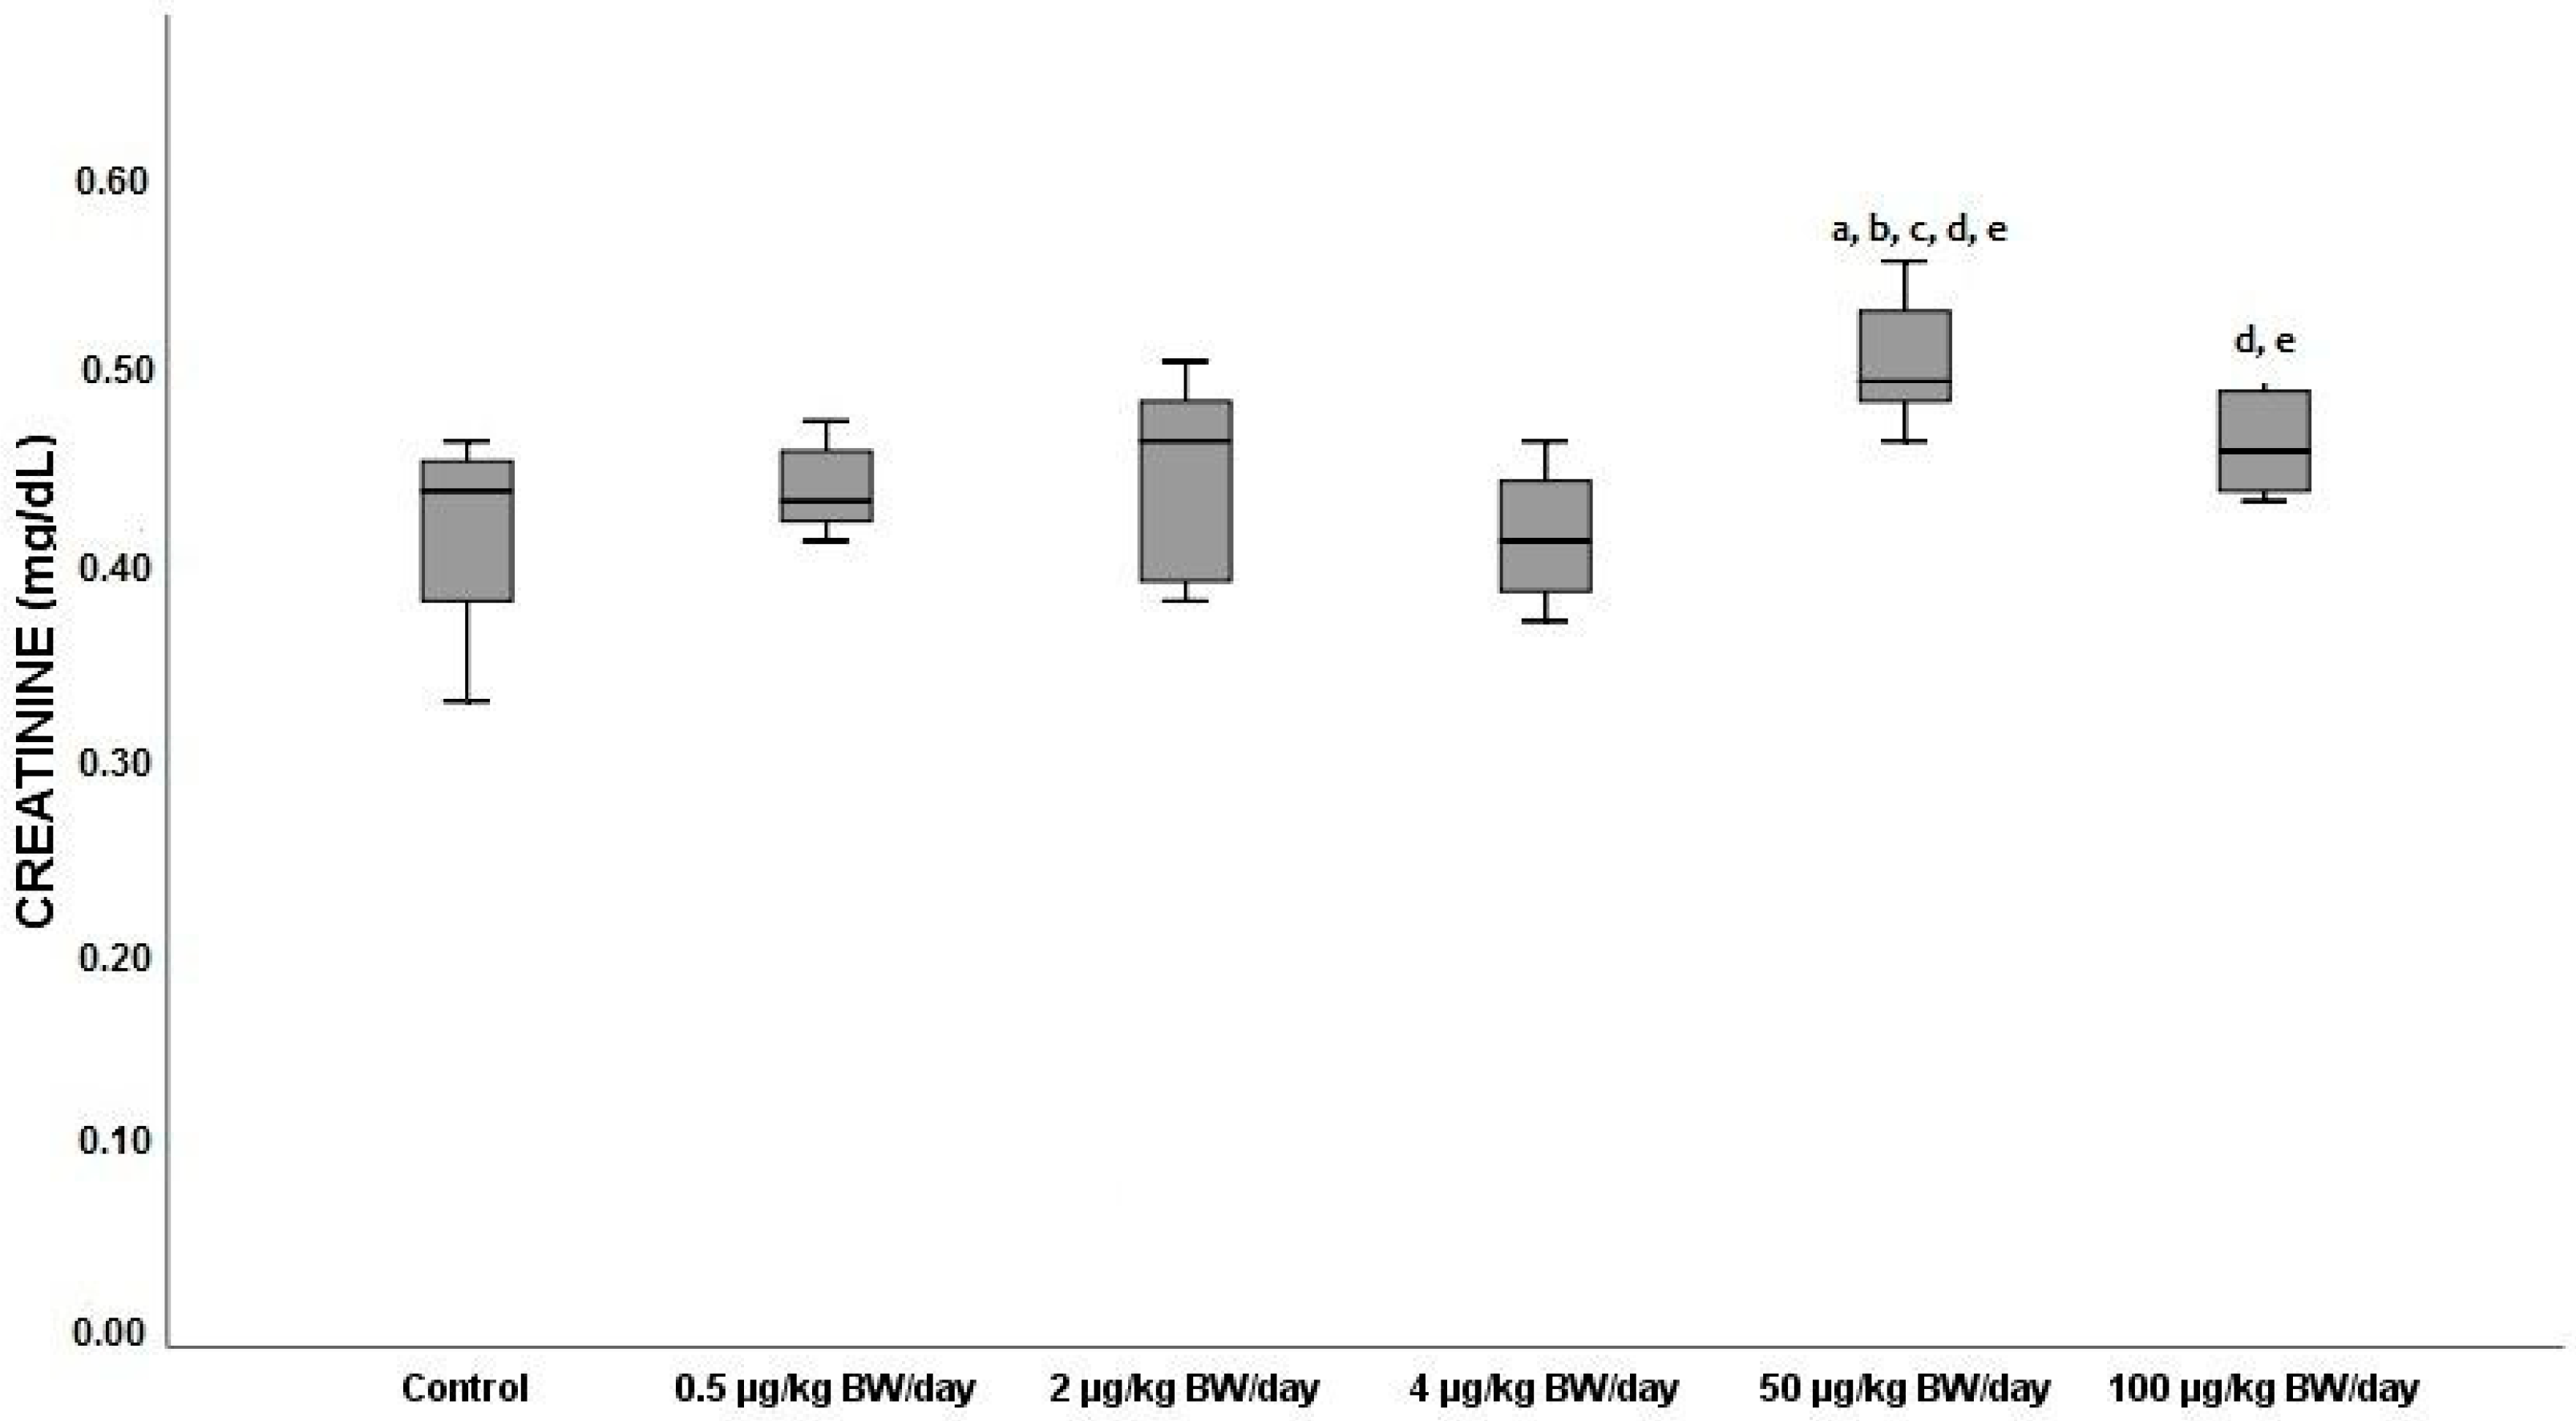
3.2.5. Creatinine
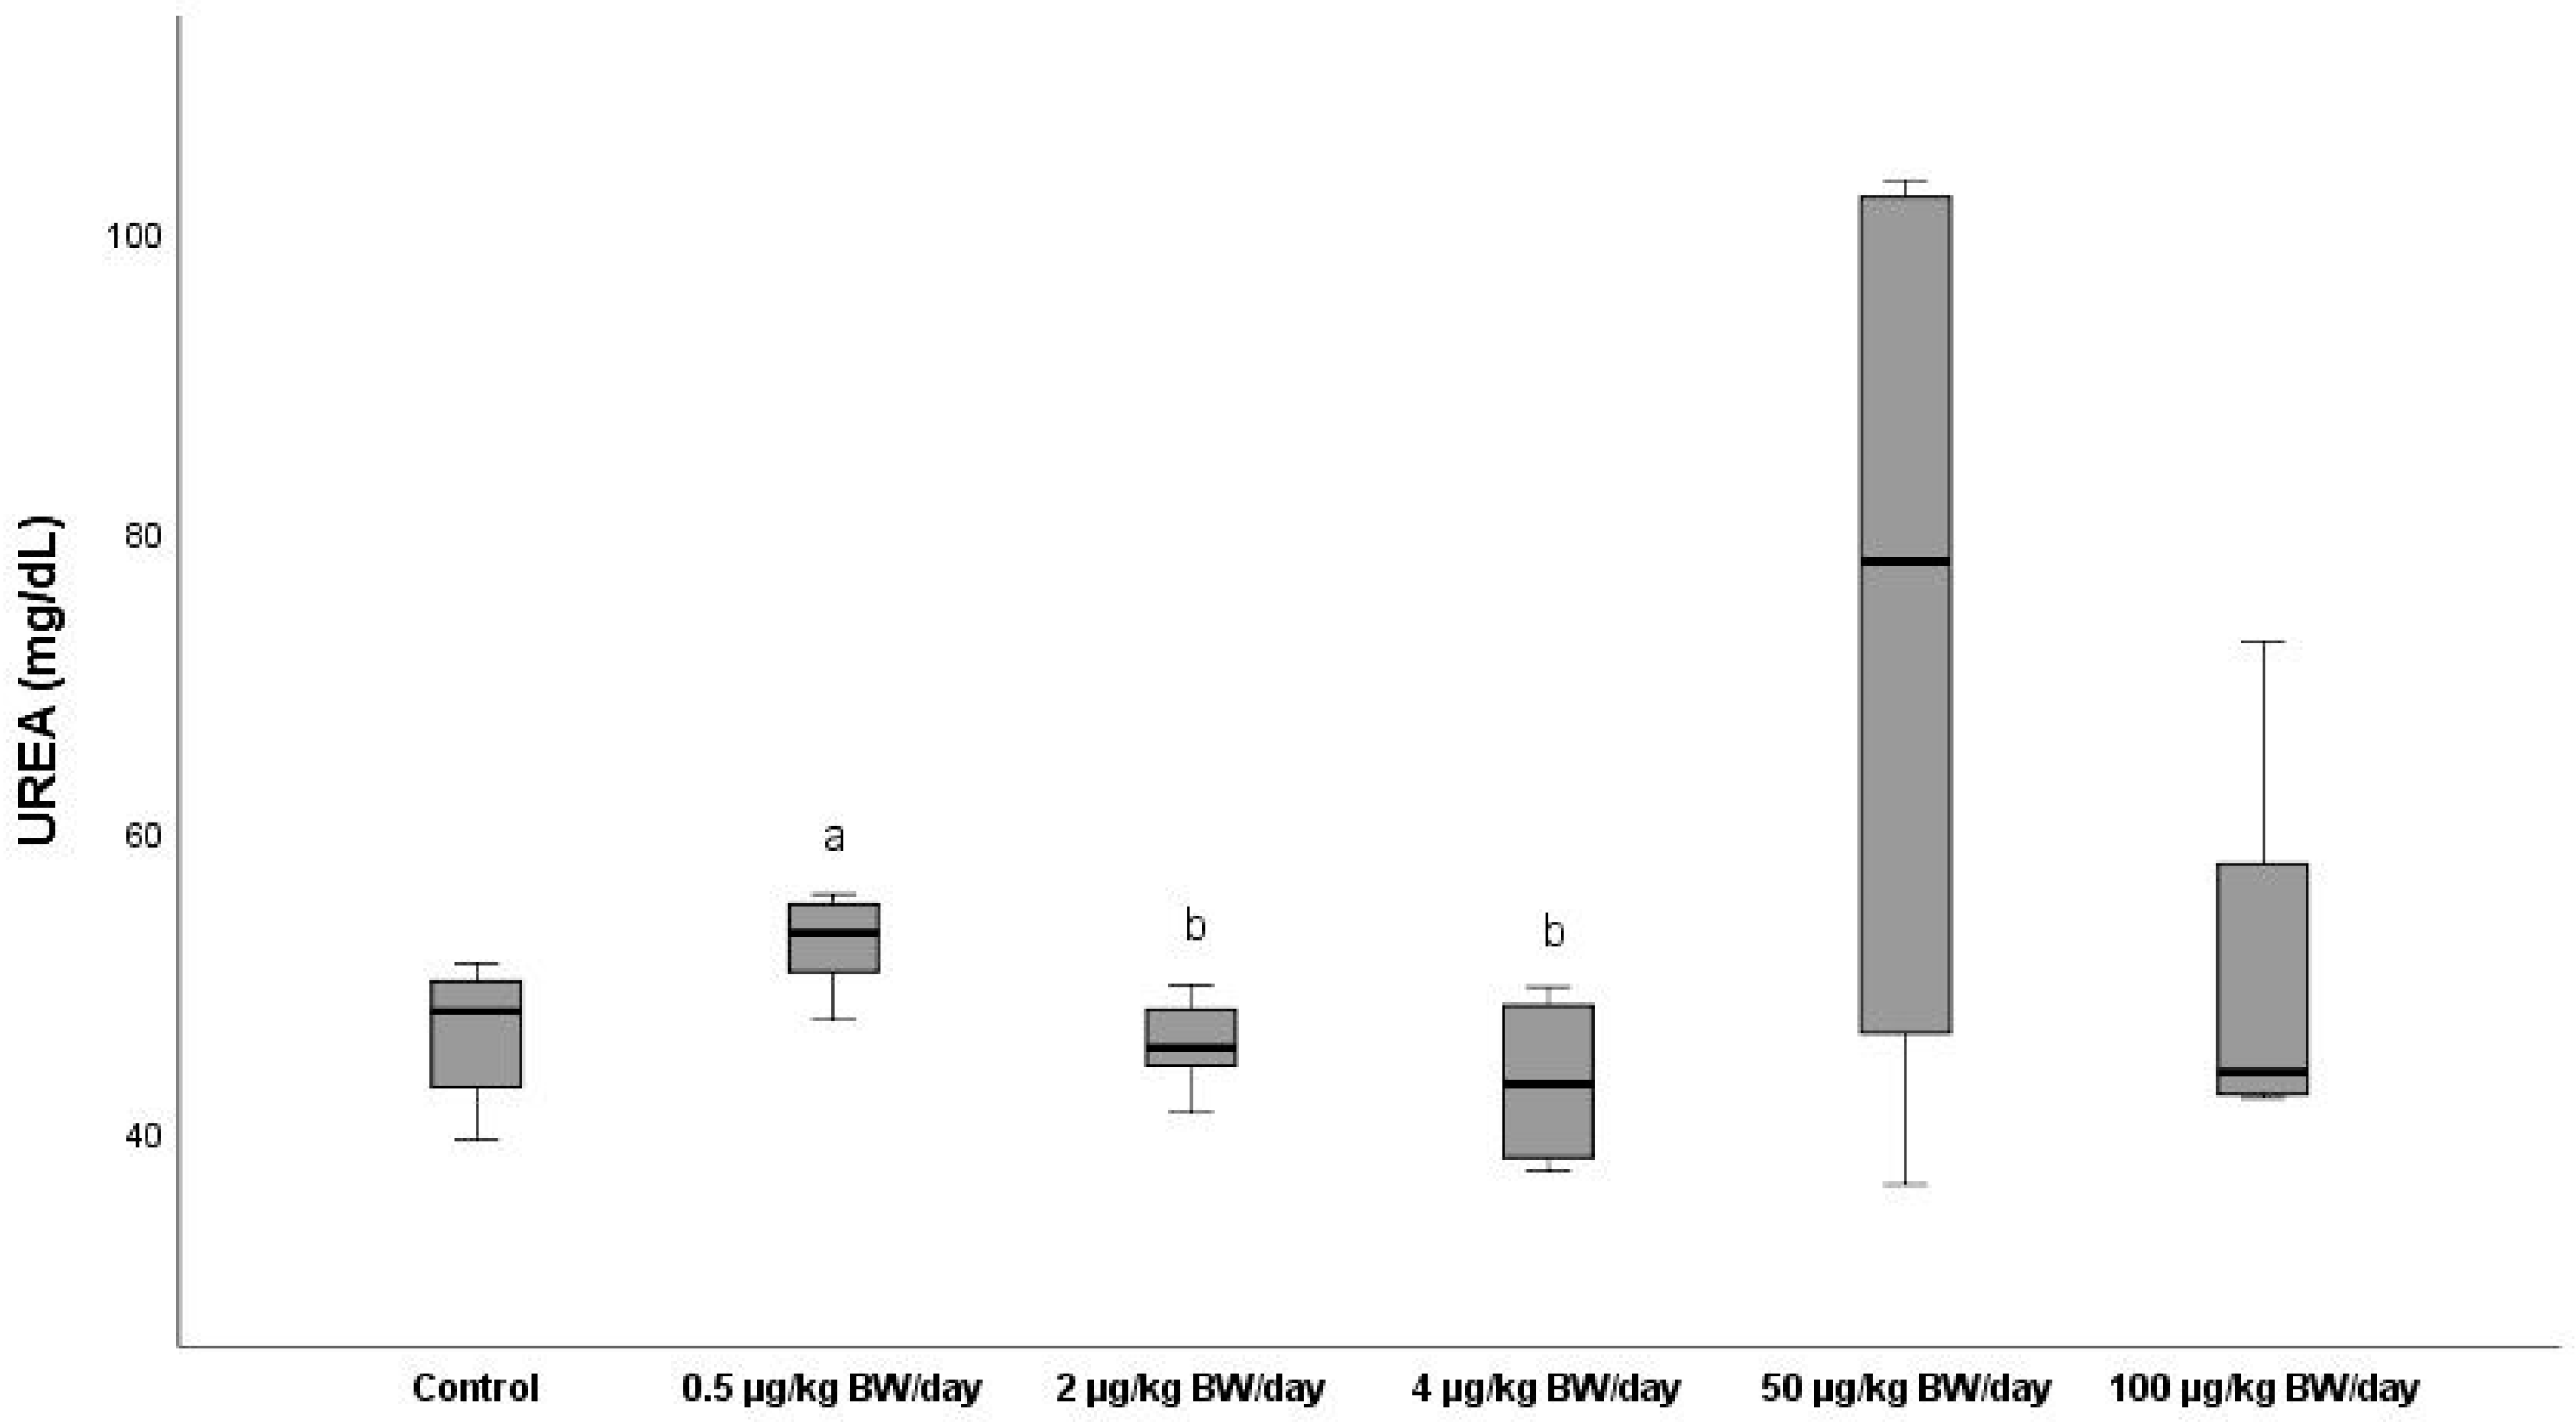
3.2.6. Urea
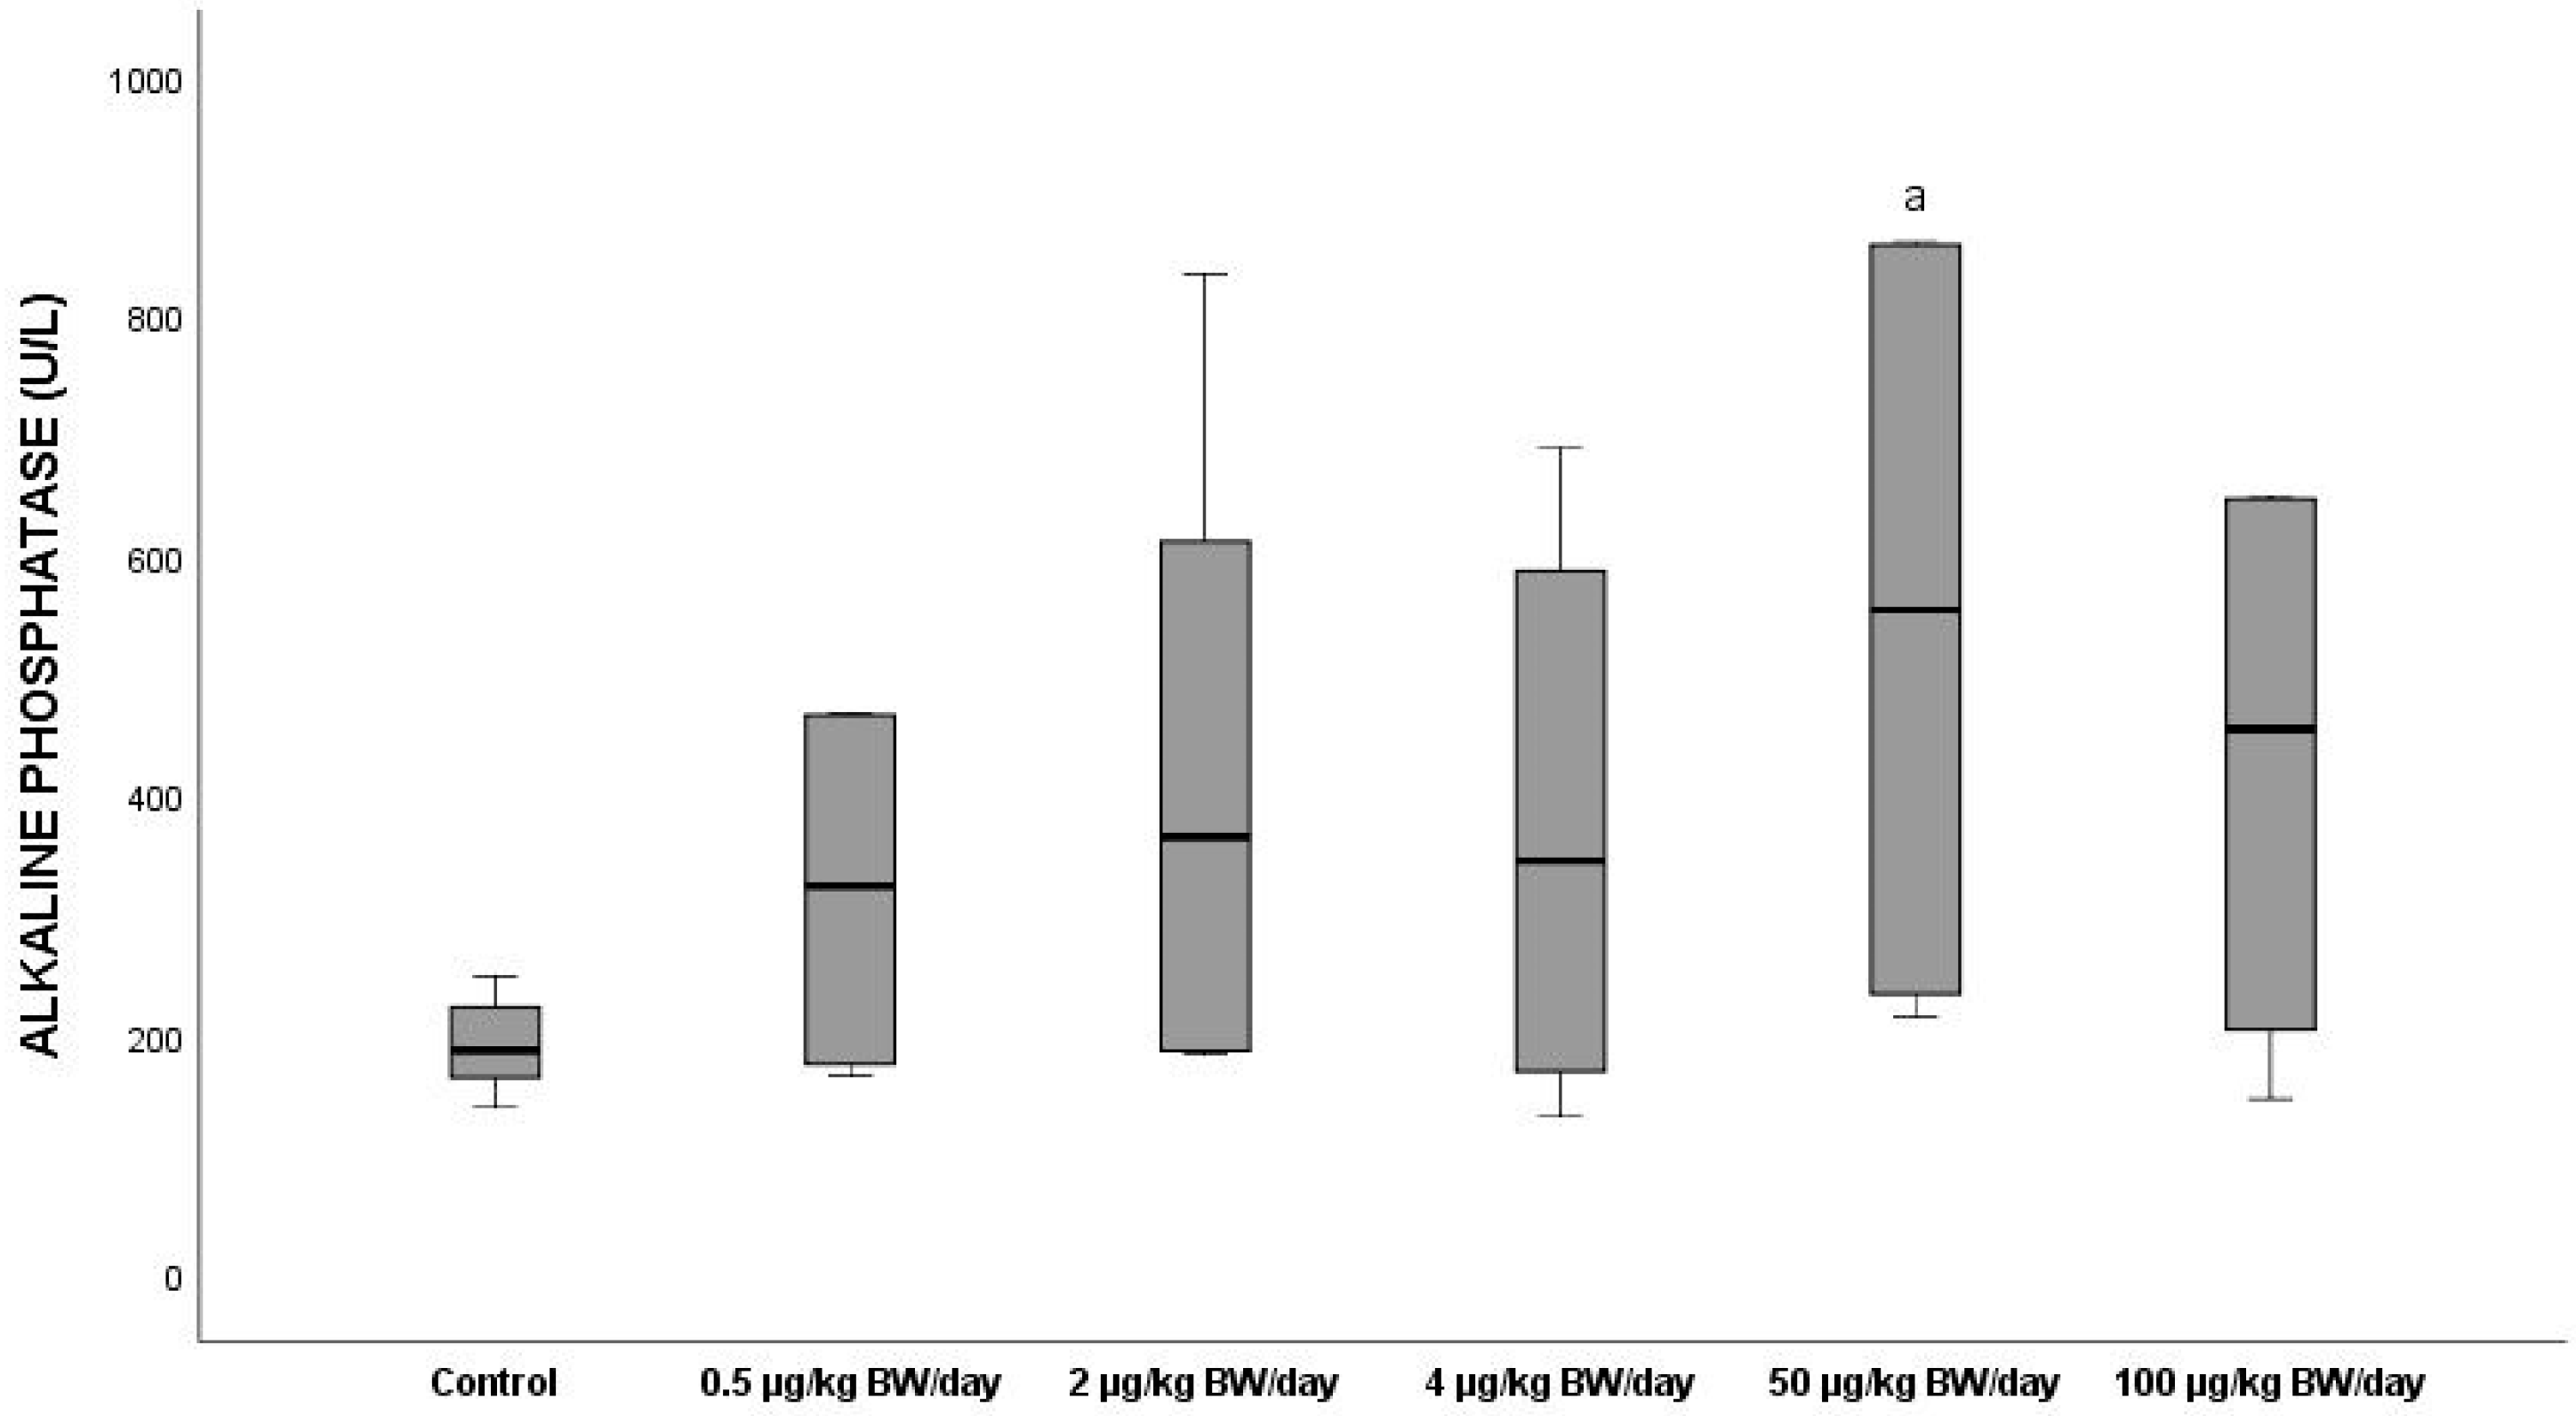
3.2.7. Alkaline Phosphatase
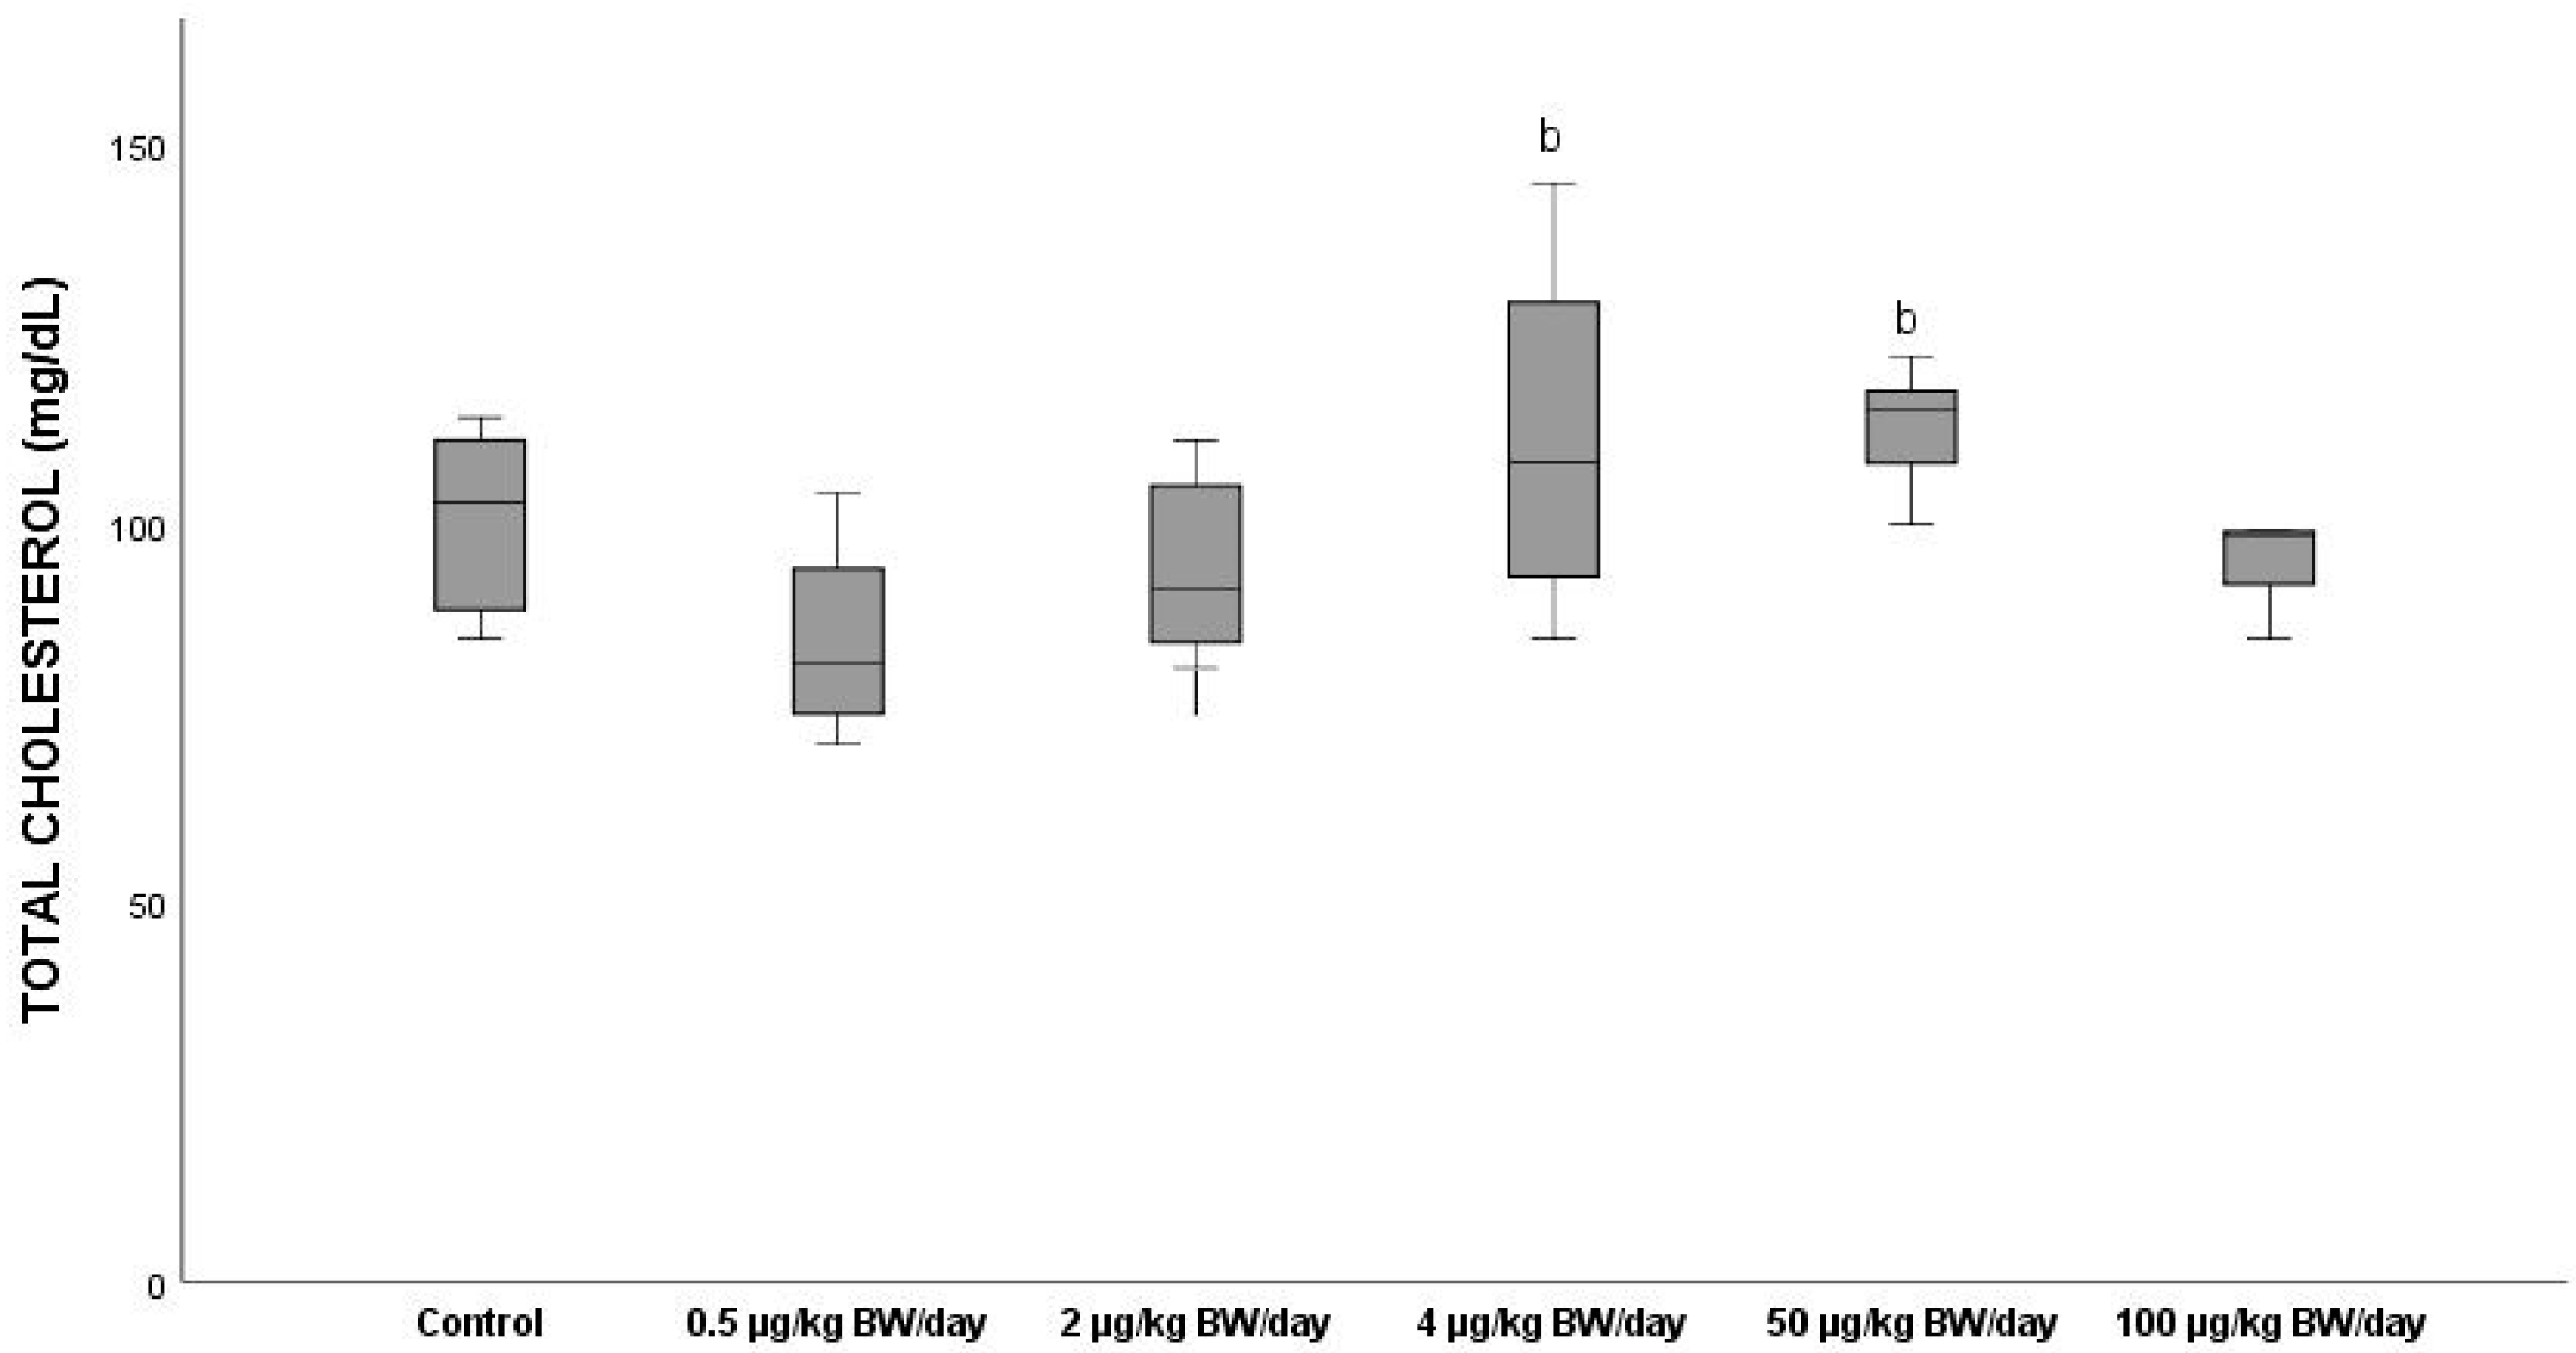
3.2.8. Total Cholesterol
3.3. Gonads, Absolute and Relative Weights
3.4. Histopathological Analysis of Hypophysis and Gonads
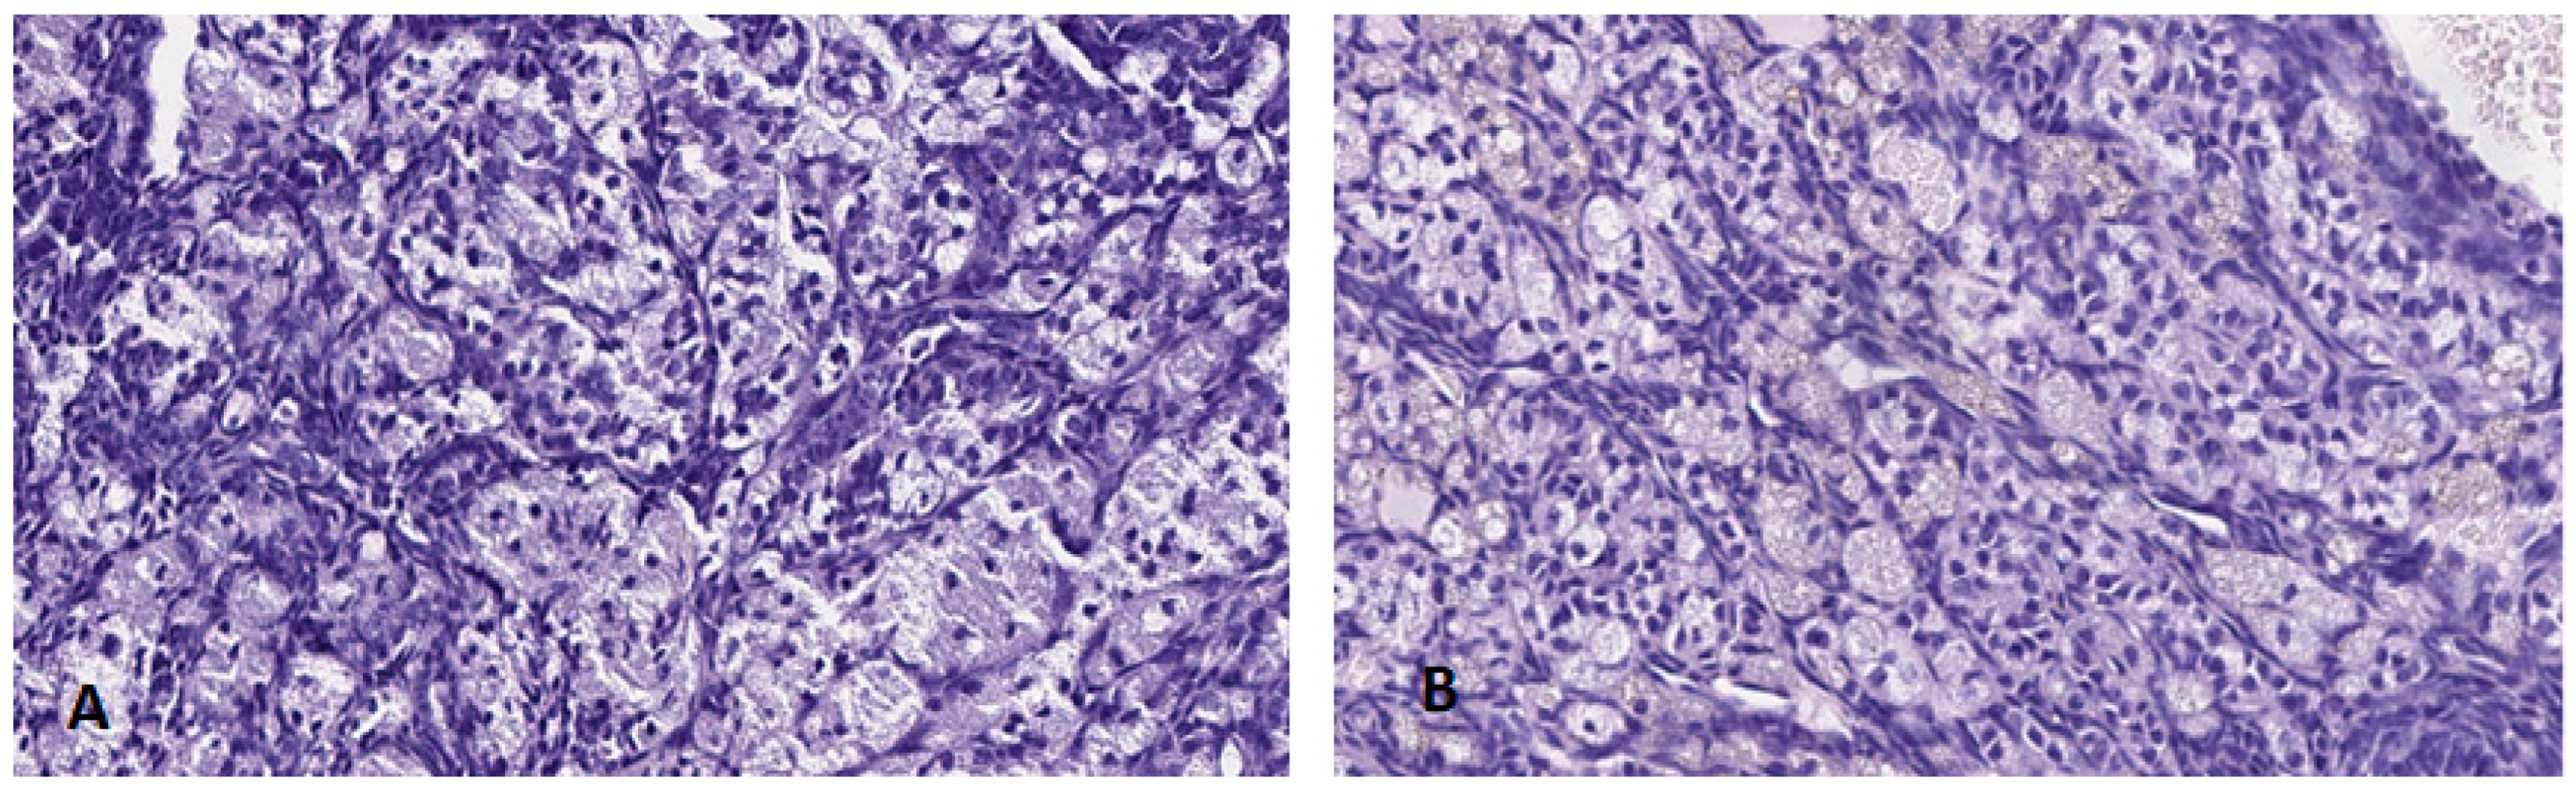
3.4.1. Hypophysis
3.4.2. Ovary
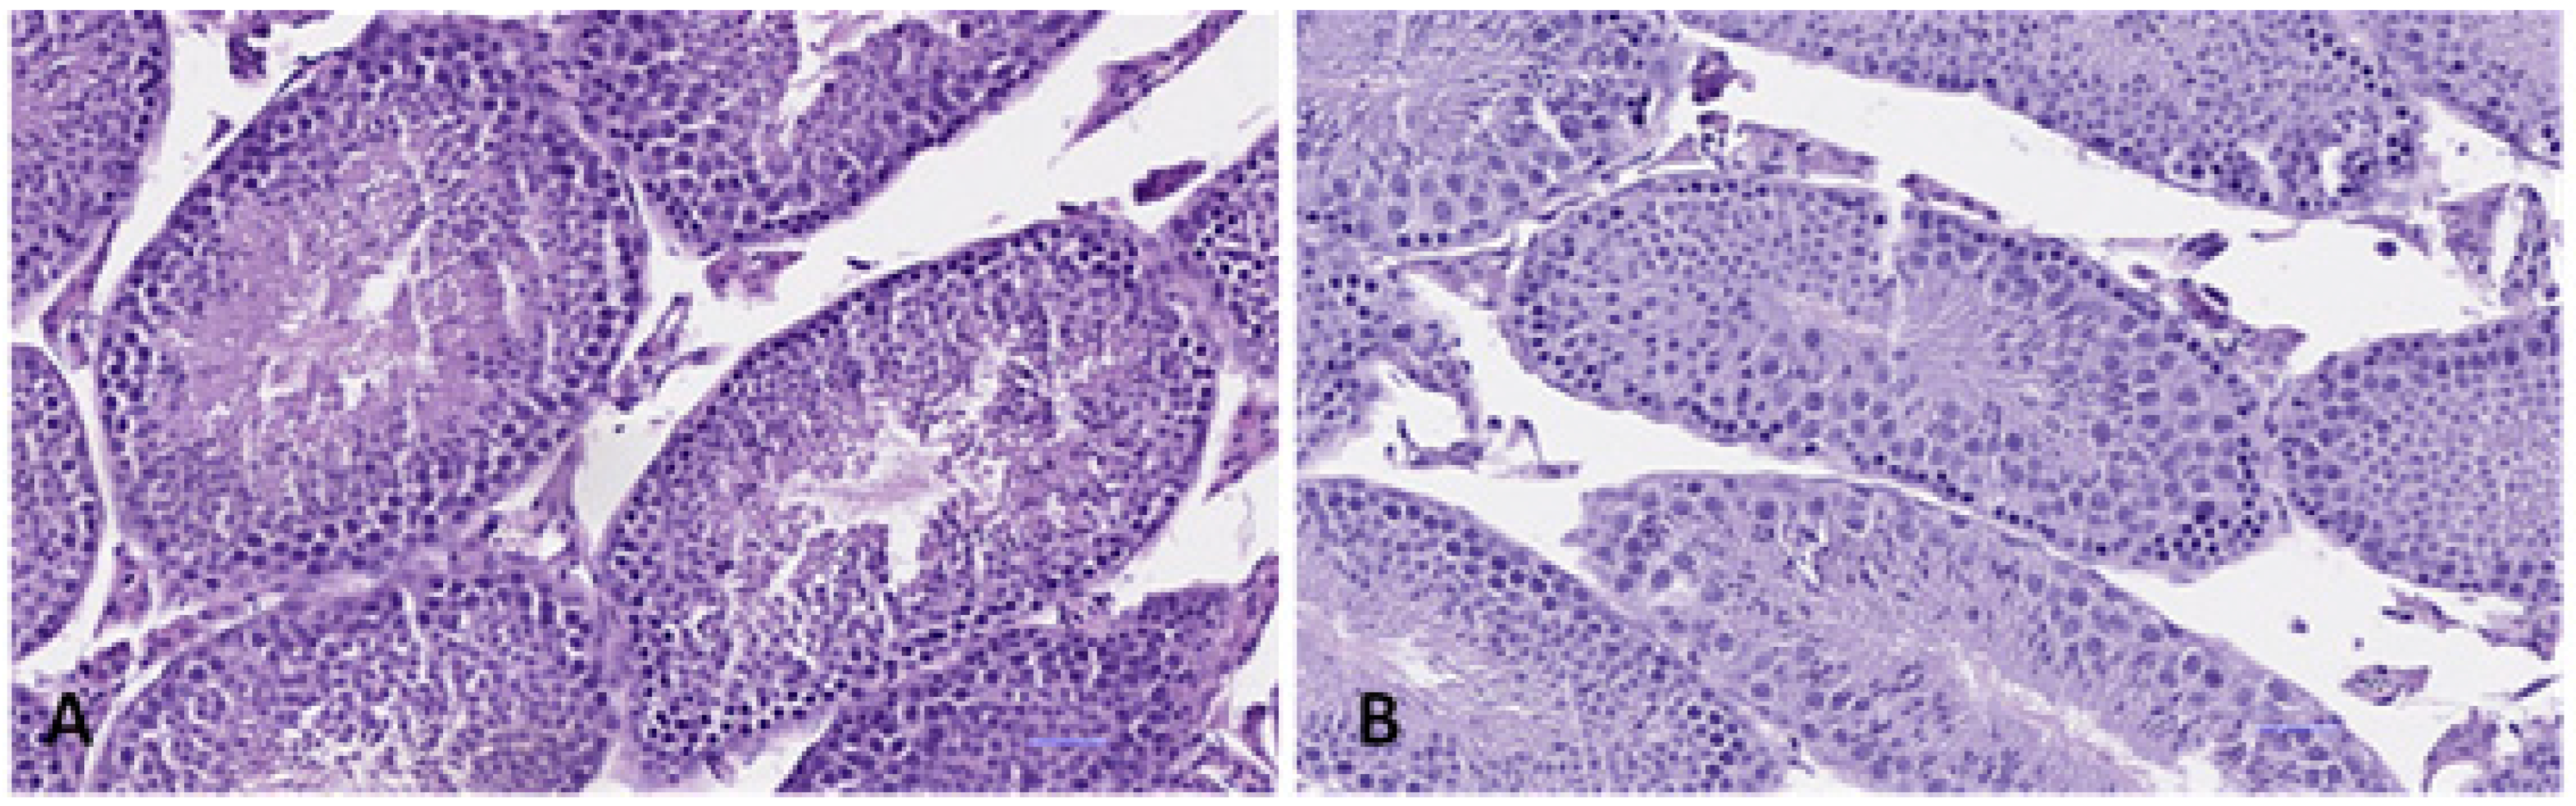
3.4.3. Testis
4. Discussion
5. Conclusions
Supplementary Materials
Author Contributions
Funding
Institutional Review Board Statement
Informed Consent Statement
Data Availability Statement
Acknowledgments
Conflicts of Interest
References
- Huang, Y.Q.; Wong, C.K.; Zheng, J.S.; Bouwman, H.; Barra, R.; Wahlström, B.; Neretin, L.; Wong, M.H. Bisphenol A (BPA) in China: A review of sources, environmental levels, and potential human health impacts. Environ. Int. 2012, 42, 91–99. [Google Scholar] [CrossRef] [PubMed]
- Abraham, A.; Chakraborty, P. A review on sources and health impacts of bisphenol A. Rev. Environ. Health 2020, 35, 201–210. [Google Scholar] [CrossRef] [PubMed]
- Geens, T.; Aerts, D.; Berthot, C.; Bourguignon, J.P.; Goeyens, L.; Lecomte, P.; Maghuin-Rogister, G.; Pironnet, A.M.; Pussemier, L.; Scippo, M.L.; et al. A review of dietary and non-dietary exposure to bisphenol-A. Food Chem. Toxicol. 2012, 50, 3725–3740. [Google Scholar] [CrossRef] [PubMed]
- Fan, R.; Zeng, B.; Liu, X.; Chen, C.; Zhuang, Q.; Wang, Y.; Hu, M.; Lv, Y.; Li, J.; Zhou, Y.; et al. Levels of bisphenol-A in different paper products in Guangzhou, China, and assessment of human exposure via dermal contact. Environ. Sci. Processes Impacts. 2015, 17, 667–673. [Google Scholar] [CrossRef] [PubMed]
- Vandenberg, L.N.; Hauser, R.; Marcus, M.; Olea, N.; Welshons, W.V. Human exposure to bisphenol A (BPA). Reprod. Toxicol. 2007, 24, 139–177. [Google Scholar] [CrossRef]
- Canesi, L.; Fabbri, E. Environmental Effects of BPA: Focus on Aquatic Species. Dose Response 2015, 13, 1559325815598304. [Google Scholar] [CrossRef] [Green Version]
- Peillex, C.; Kerever, A.; Lachhab, A.; Pelletier, M. Bisphenol A, bisphenol S and their glucuronidated metabolites modulate glycolysis and functional responses of human neutrophils. Environ. Res. 2021, 196, 110336. [Google Scholar] [CrossRef]
- Corrales, J.; Kristofco, L.A.; Steele, W.B.; Yates, B.S.; Breed, C.S.; Williams, E.S.; Brooks, B.W. Global Assessment of Bisphenol A in the Environment: Review and Analysis of Its Occurrence and Bioaccumulation. Dose Response 2015, 13, 1559325815598308. [Google Scholar] [CrossRef] [Green Version]
- Manfo, F.P.; Jubendradass, R.; Nantia, E.A.; Moundipa, P.F.; Mathur, P.P. Adverse effects of bisphenol A on male reproductive function. Rev. Environ. Contam. Toxicol. 2014, 228, 57–82. [Google Scholar] [CrossRef]
- Ward, J.L.; Blum, M.J. Exposure to an environmental estrogen breaks down sexual isolation between native and invasive species. Evol. Appl. 2012, 5, 901–912. [Google Scholar] [CrossRef]
- Akram, R.; Iqbal, R.; Hussain, R.; Jabeen, F.; Ali, M. Evaluation of Oxidative stress, antioxidant enzymes and genotoxic potential of bisphenol A in fresh water bighead carp (Aristichthysnobils) fish at low concentrations. Environ. Pollut. 2021, 268 Pt A, 115896. [Google Scholar] [CrossRef]
- Molina, A.M.; Lora, A.J.; Blanco, A.; Monterde, J.G.; Ayala, N.; Moyano, R. Endocrine-active compound evaluation: Qualitative and quantitative histomorphological assessment of zebrafish gonads after bisphenol-A exposure. Ecotoxicol. Environ. Saf. 2013, 88, 155–162. [Google Scholar] [CrossRef] [PubMed]
- Huo, X.; Chen, D.; He, Y.; Zhu, W.; Zhou, W.; Zhang, J. Bisphenol-A and Female Infertility: A Possible Role of Gene-Environment Interactions. Int. J. Environ. Res. Public Health 2015, 12, 11101–11116. [Google Scholar] [CrossRef] [PubMed]
- Inagaki, T.; Smith, N.L.; Sherva, K.M.; Ramakrishnan, S. Cross-generational effects of parental low dose BPA exposure on the Gonadotropin-Releasing Hormone3 system and larval behavior in medaka (Oryziaslatipes). Neurotoxicology 2016, 57, 163–173. [Google Scholar] [CrossRef] [PubMed]
- Jedeon, K.; Houari, S.; Loiodice, S.; Thuy, T.T.; Le Normand, M.; Berdal, A.; Babajko, S. Chronic Exposure to Bisphenol A Exacerbates Dental Fluorosis in Growing Rats. J. Bone Miner. Res. 2016, 31, 1955–1966. [Google Scholar] [CrossRef] [PubMed]
- Rahman, M.S.; Kwon, W.S.; Karmakar, P.C.; Yoon, S.J.; Ryu, B.Y.; Pang, M.G. Gestational Exposure to Bisphenol A Affects the Function and Proteome Profile of F1 Spermatozoa in Adult Mice. Environ. Health Perspect. 2017, 125, 238–245. [Google Scholar] [CrossRef]
- Vandenberg, L.N.; Hunt, P.A.; Gore, A.C. Endocrine disruptors and the future of toxicology testing-lessons from CLARITY-BPA. Nat. Rev. Endocrinol. 2019, 15, 366–374. [Google Scholar] [CrossRef]
- National Toxicology Program. NTP Research Report on the CLARITY-BPA Core Study: A Perinatal and Chronic Extended-Dose-Range Study of Bisphenol A in Rats: Research Report 9. Res. Triangle Park (NC) Natl. Toxicol. Program 2018. [Google Scholar]
- Birnbaum, L.S.; Bucher, J.R.; Collman, G.W.; Zeldin, D.C.; Johnson, A.F.; Schug, T.T.; Heindel, J.J. Consortium-based science: The NIEHS’s multipronged, collaborative approach to assessing the health effects of bisphenol A. Environ. Health Perspect. 2012, 120, 1640–1644. [Google Scholar] [CrossRef]
- Rubin, B.S.; Schaeberle, C.M.; Soto, A.M. The Case for BPA as an Obesogen: Contributors to the Controversy. Front. Endocrinol. 2019, 10, 30. [Google Scholar] [CrossRef] [Green Version]
- Vandenberg, L.N.; Colborn, T.; Hayes, T.B.; Heindel, J.J.; Jacobs, D.R., Jr.; Lee, D.H.; Shioda, T.; Soto, A.M.; vom Saal, F.S.; Welshons, W.V.; et al. Hormones and endocrine-disrupting chemicals: Low-dose effects and non-monotonic dose responses. Endocr. Rev. 2012, 33, 378–455. [Google Scholar] [CrossRef] [PubMed]
- Vandenberg, L.N.; Hunt, P.A.; Myers, J.P.; Vom Saal, F.S. Human exposures to bisphenol A: Mismatches between data and assumptions. Rev. Environ. Health 2013, 28, 37–58. [Google Scholar] [CrossRef] [PubMed]
- Zoeller, R.T.; Brown, T.R.; Doan, L.L.; Gore, A.C.; Skakkebaek, N.E.; Soto, A.M.; Woodruff, T.J.; Vom Saal, F.S. Endocrine-disrupting chemicals and public health protection: A statement of principles from The Endocrine Society. Endocrinology 2012, 153, 4097–4110. [Google Scholar] [CrossRef] [PubMed]
- Kim, E.J.; Lee, D.; Chung, B.C.; Pyo, H.; Lee, J. Association between urinary levels of bisphenol-A and estrogen metabolism in Korean adults. Sci. Total Environ. 2014, 470–471, 1401–1407. [Google Scholar] [CrossRef]
- Rochester, J.R. Bisphenol A and human health: A review of the literature. Reprod. Toxicol. 2013, 42, 132–155. [Google Scholar] [CrossRef]
- Kabir, E.R.; Rahman, M.S.; Rahman, I. A review on endocrine disruptors and their possible impacts on human health. Environ. Toxicol. Pharmacol. 2015, 40, 241–258. [Google Scholar] [CrossRef]
- Morgan, M.; Deoraj, A.; Felty, Q.; Roy, D. Environmental estrogen-like endocrine disrupting chemicals and breast cancer. Mol. Cell Endocrinol. 2017, 457, 89–102. [Google Scholar] [CrossRef]
- Hwang, S.; Lim, J.E.; Choi, Y.; Jee, S.H. Bisphenol A exposure and type 2 diabetes mellitus risk: A meta-analysis. BMC Endocr. Disord. 2018, 18, 81. [Google Scholar] [CrossRef] [Green Version]
- Wu, W.; Li, M.; Liu, A.; Wu, C.; Li, D.; Deng, Q.; Zhang, B.; Du, J.; Gao, X.; Hong, Y. Bisphenol A and the Risk of Obesity a Systematic Review with Meta-Analysis of the Epidemiological Evidence. Dose Response 2020, 18, 1559325820916949. [Google Scholar] [CrossRef] [Green Version]
- Zhang, X.; Liu, R. Advances in BPA-induced Oxidative Stress and Related Effects and Mechanisms in Liver, 1991-2017. Mini Rev. Med. Chem. 2020, 20, 432–443. [Google Scholar] [CrossRef]
- Moon, S.; Seo, M.Y.; Choi, K.; Chang, Y.S.; Kim, S.H.; Park, M.J. Urinary bisphenol A concentrations and the risk of obesity in Korean adults. Sci. Rep. 2021, 11, 1603. [Google Scholar] [CrossRef] [PubMed]
- García-Arevalo, M.; Alonso-Magdalena, P.; Rebelo Dos Santos, J.; Quesada, I.; Carneiro, E.M.; Nadal, A. Exposure to bisphenol-A during pregnancy partially mimics the effects of a high-fat diet altering glucose homeostasis and gene expression in adult male mice. PLoS ONE 2014, 9, e100214. [Google Scholar] [CrossRef] [PubMed] [Green Version]
- Marmugi, A.; Lasserre, F.; Beuzelin, D.; Ducheix, S.; Huc, L.; Polizzi, A.; Chetivaux, M.; Pineau, T.; Martin, P.; Guillou, H.; et al. Adverse effects of long-term exposure to bisphenol A during adulthood leading to hyperglycaemia and hypercholesterolemia in mice. Toxicology 2014, 325, 133–143. [Google Scholar] [CrossRef]
- Lejonklou, M.H.; Dunder, L.; Bladin, E.; Pettersson, V.; Rönn, M.; Lind, L.; Waldén, T.B.; Lind, P.M. Effects of Low-Dose Developmental Bisphenol A Exposure on Metabolic Parameters and Gene Expression in Male and Female Fischer 344 Rat Offspring. Environ. Health Perspect. 2017, 125, 067018. [Google Scholar] [CrossRef]
- Le Magueresse-Battistoni, B.; Multigner, L.; Beausoleil, C.; Rousselle, C. Effects of bisphenol A on metabolism and evidence of a mode of action mediated through endocrine disruption. Mol. Cell Endocrinol. 2018, 475, 74–91. [Google Scholar] [CrossRef] [PubMed]
- Wade, M.; Delawder, V.; Reneau, P.; Dos Santos, J.M. The effect of BPA exposure on insulin resistance and type 2 diabetes—The impact of muscle contraction. Med. Hypotheses 2020, 140, 109675. [Google Scholar] [CrossRef] [PubMed]
- Moon, M.K.; Jeong, I.K.; Jung, O.T.; Ahn, H.Y.; Kim, H.H.; Park, Y.J.; Jang, H.C.; Park, K.S. Long-term oral exposure to bisphenol A induces glucose intolerance and insulin resistance. J. Endocrinol. 2015, 226, 35–42. [Google Scholar] [CrossRef] [Green Version]
- Oliveira, K.M.; Figueiredo, L.S.; Araujo, T.R.; Freitas, I.N.; Silva, J.N.; Boschero, A.C.; Ribeiro, R.A. Prolonged bisphenol-A exposure decreases endocrine pancreatic proliferation in response to obesogenic diet in ovariectomized mice. Steroids 2020, 160, 108658. [Google Scholar] [CrossRef]
- Loganathan, N.; McIlwraith, E.K.; Belsham, D.D. BPA Differentially Regulates NPY Expression in Hypothalamic Neurons Through a Mechanism Involving Oxidative Stress. Endocrinology 2020, 161, bqaa170. [Google Scholar] [CrossRef]
- Vahdati, H.F.; Masjedi, E.; Hosseinzadeh, H.; Bedrood, Z.; Abnous, K.; Mehri, S. Protective effect of crocin on bisphenol A-induced spatial learning and memory impairment in adult male rats: Role of oxidative stress and AMPA receptor. Iran. J. Basic Med. Sci. 2020, 23, 1146–1154. [Google Scholar] [CrossRef]
- Abdel-Latif, H.M.R.; Khashaba, A.M.A. Subchronic toxicity of Nile tilapia with different exposure routes to Microcystis aeruginosa: Histopathology, liver functions, and oxidative stress biomarkers. Vet. World 2017, 10, 955–963. [Google Scholar] [CrossRef] [PubMed]
- Rochester, J.R.; Bolden, A.L. Bisphenol S and F: A Systematic Review and Comparison of the Hormonal Activity of Bisphenol A Substitutes. Environ. Health Perspect. 2015, 123, 643–650. [Google Scholar] [CrossRef] [PubMed]
- Alonso-Magdalena, P.; García-Arévalo, M.; Quesada, I.; Nadal, Á. Bisphenol-A treatment during pregnancy in mice: A new window of susceptibility for the development of diabetes in mothers later in life. Endocrinology 2015, 156, 1659–1670. [Google Scholar] [CrossRef] [Green Version]
- Ji, H.; Song, N.; Ren, J.; Li, W.; Xu, B.; Li, H.; Shen, G. Metabonomics reveals bisphenol A affects fatty acid and glucose metabolism through activation of LXR in the liver of male mice. Sci. Total Environ. 2020, 703, 134681. [Google Scholar] [CrossRef] [PubMed]
- Alonso-Magdalena, P.; Morimoto, S.; Ripoll, C.; Fuentes, E.; Nadal, A. The estrogenic effect of bisphenol A disrupts pancreatic beta-cell function in vivo and induces insulin resistance. Environ. Health Perspect. 2006, 114, 106–112. [Google Scholar] [CrossRef] [Green Version]
- Azevedo, L.F.; Hornos Carneiro, M.F.; Dechandt, C.R.P.; Cassoli, J.S.; Alberici, L.C.; Barbosa, F., Jr. Global liver proteomic analysis of Wistar rats chronically exposed to low levels of bisphenol A and S. Environ. Res. 2020, 182, 109080. [Google Scholar] [CrossRef]
- Haq, M.E.U.; Akash, M.S.H.; Rehman, K.; Mahmood, M.H. Chronic exposure of bisphenol A impairs carbohydrate and lipid metabolism by altering corresponding enzymatic and metabolic pathways. Environ. Toxicol. Pharmacol. 2020, 78, 103387. [Google Scholar] [CrossRef]
- Somm, E.; Schwitzgebel, V.M.; Toulotte, A.; Cederroth, C.R.; Combescure, C.; Nef, S.; Aubert, M.L.; Hüppi, P.S. Perinatal exposure to bisphenol a alters early adipogenesis in the rat. Environ. Health Perspect. 2009, 117, 1549–1555. [Google Scholar] [CrossRef] [Green Version]
- Carnevali, O.; Notarstefano, V.; Olivotto, I.; Graziano, M.; Gallo, P.; Di Marco Pisciottano, I.; Vaccari, L.; Mandich, A.; Giorgini, E.; Maradonna, F. Dietary administration of EDC mixtures: A focus on fish lipid metabolism. Aquat Toxicol. 2017, 185, 95–104. [Google Scholar] [CrossRef]
- Marmugi, A.; Ducheix, S.; Lasserre, F.; Polizzi, A.; Paris, A.; Priymenko, N.; Bertrand-Michel, J.; Pineau, T.; Guillou, H.; Martin, P.G.; et al. Low doses of bisphenol A induce gene expression related to lipid synthesis and trigger triglyceride accumulation in adult mouse liver. Hepatology 2012, 55, 395–407. [Google Scholar] [CrossRef]
- Wei, J.; Sun, X.; Chen, Y.; Li, Y.; Song, L.; Zhou, Z.; Xu, B.; Lin, Y.; Xu, S. Perinatal exposure to bisphenol A exacerbates nonalcoholic steatohepatitis-like phenotype in male rat offspring fed on a high-fat diet. J. Endocrinol. 2014, 222, 313–325. [Google Scholar] [CrossRef] [PubMed]
- Moon, M.K.; Kim, M.J.; Jung, I.K.; Koo, Y.D.; Ann, H.Y.; Lee, K.J.; Kim, S.H.; Yoon, Y.C.; Cho, B.J.; Park, K.S.; et al. Bisphenol A impairs mitochondrial function in the liver at doses below the no observed adverse effect level. J. Korean Med. Sci. 2012, 27, 644–652. [Google Scholar] [CrossRef] [PubMed] [Green Version]
- Chitra, K.C.; Latchoumycandane, C.; Mathur, P.P. Induction of oxidative stress by bisphenol A in the epididymal sperm of rats. Toxicology 2003, 185, 119–127. [Google Scholar] [CrossRef] [PubMed]
- Korkmaz, A.; Aydoğan, M.; Kolankaya, D.; Barlas, N. Vitamin C coadministration augments bisphenol A, nonylphenol, and octylphenol induced oxidative damage on kidney of rats. Environ. Toxicol. 2011, 26, 325–337. [Google Scholar] [CrossRef]
- Shi, R.; Liu, Z.; Liu, T. The antagonistic effect of bisphenol A and nonylphenol on liver and kidney injury in rats. Immunopharmacol. Immunotoxicol. 2021, 43, 527–535. [Google Scholar] [CrossRef]
- Kazemi, S.; MousaviKani, S.N.; Rezazadeh, L.; Pouramir, M.; Ghasemi-Kasman, M.; Moghadamnia, A.A. Low dose administration of Bisphenol A induces liver toxicity in adult rats. Biochem. Biophys Res. Commun. 2017, 494, 107–112. [Google Scholar] [CrossRef]
- Kobroob, A.; Peerapanyasut, W.; Chattipakorn, N.; Wongmekiat, O. Damaging Effects of Bisphenol A on the Kidney and the Protection by Melatonin: Emerging Evidences from In Vivo and In Vitro Studies. Oxid Med. Cell Longev. 2018, 2018, 3082438. [Google Scholar] [CrossRef] [Green Version]
- Esplugas, R.; LLovet, M.I.; Bellés, M.; Serra, N.; Vallvé, J.C.; Domingo, J.L.; Linares, V. Renal and hepatic effects following neonatal exposure to low doses of Bisphenol-A and 137Cs. Food Chem. Toxicol. 2018, 114, 270–277. [Google Scholar] [CrossRef]
- Jiang, Y.; Li, J.; Xu, S.; Zhou, Y.; Zhao, H.; Li, Y.; Xiong, C.; Sun, X.; Liu, H.; Liu, W.; et al. Prenatal exposure to bisphenol A and its alternatives and child neurodevelopment at 2 years. J. Hazard. Mater. 2020, 388, 121774. [Google Scholar] [CrossRef]
- Wei, J.; Lin, Y.; Li, Y.; Ying, C.; Chen, J.; Song, L.; Zhou, Z.; Lv, Z.; Xia, W.; Chen, X.; et al. Perinatal exposure to bisphenol A at reference dose predisposes offspring to metabolic syndrome in adult rats on a high-fat diet. Endocrinology 2011, 152, 3049–3061. [Google Scholar] [CrossRef] [Green Version]
- Angle, B.M.; Do, R.P.; Ponzi, D.; Stahlhut, R.W.; Drury, B.E.; Nagel, S.C.; Welshons, W.V.; Besch-Williford, C.L.; Palanza, P.; Parmigiani, S.; et al. Metabolic disruption in male mice due to fetal exposure to low but not high doses of bisphenol A (BPA): Evidence for effects on body weight, food intake, adipocytes, leptin, adiponectin, insulin and glucose regulation. Reprod. Toxicol. 2013, 42, 256–268. [Google Scholar] [CrossRef] [PubMed]
- Welshons, W.V.; Thayer, K.A.; Judy, B.M.; Taylor, J.A.; Curran, E.M.; vom Saal, F.S. Large effects from small exposures. I. Mechanisms for endocrine-disrupting chemicals with estrogenic activity. Environ. Health Perspect. 2003, 111, 994–1006. [Google Scholar] [CrossRef] [PubMed] [Green Version]
- Santangeli, S.; Notarstefano, V.; Maradonna, F.; Giorgini, E.; Gioacchini, G.; Forner-Piquer, I.; Habibi, H.R.; Carnevali, O. Effects of diethylene glycol dibenzoate and Bisphenol A on the lipid metabolism of Danio rerio. Sci. Total Environ. 2018, 636, 641–655. [Google Scholar] [CrossRef]
- Jones, B.A.; Shimell, J.J.; Watson, N.V. Pre- and postnatal bisphenol A treatment results in persistent deficits in the sexual behavior of male rats, but not female rats, in adulthood. Horm. Behav. 2011, 59, 246–251. [Google Scholar] [CrossRef] [PubMed]
- Badding, M.A.; Barraj, L.; Williams, A.L.; Scrafford, C.; Reiss, R. CLARITY-BPA Core Study: Analysis for non-monotonic dose-responses and biological relevance. Food Chem. Toxicol. 2019, 131, 110554. [Google Scholar] [CrossRef]
- Wu, C.C.; Shields, J.N.; Akemann, C.; Meyer, D.N.; Connell, M.; Baker, B.B.; Pitts, D.K.; Baker, T.R. The phenotypic and transcriptomic effects of developmental exposure to nanomolar levels of estrone and bisphenol A in zebrafish. Sci. Total Environ. 2021, 757, 143736. [Google Scholar] [CrossRef]
- Camacho, L.; Lewis, S.M.; Vanlandingham, M.M.; Olson, G.R.; Davis, K.J.; Patton, R.E.; Twaddle, N.C.; Doerge, D.R.; Churchwell, M.I.; Bryant, M.S.; et al. A two-year toxicology study of bisphenol A (BPA) in Sprague-Dawley rats: CLARITY-BPA core study results. Food Chem. Toxicol. 2019, 132, 110728. [Google Scholar] [CrossRef]
- Santamaría, C.; Durando, M.; Muñoz de Toro, M.; Luque, E.H.; Rodriguez, H.A. Ovarian dysfunctions in adult female rat offspring born to mothers perinatally exposed to low doses of bisphenol A. J. Steroid Biochem. Mol. Biol. 2016, 158, 220–230. [Google Scholar] [CrossRef]
- Tian, J.; Ding, Y.; She, R.; Ma, L.; Du, F.; Xia, K.; Chen, L. Histologic study of testis injury after bisphenol A exposure in mice. Toxicol. Ind. Health 2017, 33, 36–45. [Google Scholar] [CrossRef]
- Jia, J.; Xu, H.; Chen, C.; Zhang, X.; Zhang, X.; Li, W.; Ma, J. Quantitative proteomic analysis of mouse testis uncovers cellular pathways associated with bisphenol A (BPA)-induced male infertility. Gen. Physiol. Biophys. 2020, 39, 331–341. [Google Scholar] [CrossRef]
- Sencar, L.; Coskun, G.; Şaker, D.; Sapmaz, T.; Tuli, A.; Özgür, H.; Polat, S. Bisphenol A decreases expression of Insulin-like factor 3 and induces histopathological changes in the Testes of Rats. Toxicol. Ind. Health 2021, 37, 314–327. [Google Scholar] [CrossRef] [PubMed]
- Ullah, A.; Pirzada, M.; Jahan, S.; Ullah, H.; Shaheen, G.; Rehman, H.; Siddiqui, M.F.; Butt, M.A. Bisphenol A and its analogs bisphenol B, bisphenol F, and bisphenol S: Comparative in vitro and in vivo studies on the sperms and testicular tissues of rats. Chemosphere 2018, 209, 508–516. [Google Scholar] [CrossRef] [PubMed]


| Target Concentration | Group Designation |
|---|---|
| Control | Group 0 (G0) |
| 0.5 µg/kg BW/day | Group 1 (G1) |
| 2 µg/kg BW/day | Group 2 (G2) |
| 4 µg/kg BW/day | Group 3 (G3) |
| 50 µg/kg BW/day | Group 4 (G4) |
| 100 µg/kg BW/day | Group 5 (G5) |
| Area Considered | Parts Considered | Detailed Observation and Reporting |
|---|---|---|
| General | Oversight | Nutritional and developmental status. Condition of the coat; Abnormal behaviour. Locomotor abnormalities |
| Head | Head (total) | Shape, size of parts and symmetry |
| Nasal orifices | Opening, colour, moisture, discharges | |
| Mouth | Position, moisture, any wounds or deformities | |
| Eyes, eyelids | Position and close fit of the eyelids and eyeball. Transparency of cornea and any discolorations or discharge | |
| Ear (pinna, ear canal) | Shape of the pinna, inspection of the ear canal, any abnormal content or discharge | |
| Neck | Part between head and shoulders | Shape and any wounds or masses |
| Trunk | Back | Position, symmetry, muscles |
| Thorax | Respiratory movements | |
| Abdomen | Shape, tension, (respiratory) movements | |
| Pelvis | Mammary glands in this area, and inguinal lymph nodes. | |
| Limbs | Front limbs | Wounds or deformities, proper use versus lameness |
| Hindlimbs | Wounds or deformities, abnormal proper use versus lameness | |
| Tail | Position, motility, tension (laxness or rigidity), any wounds or deformities. |
| Body Weight | Testis Weight | Ratio TES/BW | ||
| Dose Group | Sex | Mean ± SD | Mean ± SD | Mean ± SD |
| G0 | MALE | 32.26 ±5.38 | 0.200 ± 0.01 | 0.625 b,c,d,e,f ± 0.06 |
| G1 | MALE | 33.76 ± 3.98 | 0.225 ± 0.01 | 0.667 a,c,d,e ± 0.02 |
| G2 | MALE | 36.43 ± 1.68 | 0.205 ± 0.03 | 0.562 a,b,c,e,f ± 0.01 |
| G3 | MALE | 35.22 ± 5.64 | 0.205 ± 0.03 | 0.584 a,b,d,e,f ± 0.12 |
| G4 | MALE | 29.48 ± 5.45 | 0.215 ± 0.01 | 0.730 a,b,c,d,f ± 0.05 |
| G5 | MALE | 32.91 ± 0.82 | 0.215 ± 0.01 | 0.657 a,c,d,e,f ± 0.06 |
| Body Weight | Ovary Weight | Ratio OV/BW | ||
| Dose Group | Sex | Mean ± SD | Mean ± SD | Mean ± SD |
| G0 | FEMALE | 28.02 ± 0.77 | 0.025 ± 0.01 | 0.090 c,d,e,f ± 0.03 |
| G1 | FEMALE | 30.59 ± 2.25 | 0.035 ± 0.02 | 0.113 c,d ± 0.06 |
| G2 | FEMALE | 28.86 ± 2.44 | 0.075 ± 0.03 | 0.259 a,b,d,e,f ± 0.12 |
| G3 | FEMALE | 28.47 ± 0.19 | 0.050 ± 0.01 | 0.175 a,b,c ± 0.04 |
| G4 | FEMALE | 25.27 ± 1.35 | 0.040 ± 0.001 | 0.158 a,c ± 0.06 |
| G5 | FEMALE | 29.95 ± 4.00 | 0.05 ± 0.001 | 0.150 a,b,c ± 0.03 |
Publisher’s Note: MDPI stays neutral with regard to jurisdictional claims in published maps and institutional affiliations. |
© 2022 by the authors. Licensee MDPI, Basel, Switzerland. This article is an open access article distributed under the terms and conditions of the Creative Commons Attribution (CC BY) license (https://creativecommons.org/licenses/by/4.0/).
Share and Cite
Molina-López, A.M.; Bujalance-Reyes, F.; Urbano, M.T.; Lora-Benítez, A.; Ayala-Soldado, N.; Moyano-Salvago, R. Analysis of Blood Biochemistry and Pituitary-Gonadal Histology after Chronic Exposure to Bisphenol-A of Mice. Int. J. Environ. Res. Public Health 2022, 19, 13894. https://doi.org/10.3390/ijerph192113894
Molina-López AM, Bujalance-Reyes F, Urbano MT, Lora-Benítez A, Ayala-Soldado N, Moyano-Salvago R. Analysis of Blood Biochemistry and Pituitary-Gonadal Histology after Chronic Exposure to Bisphenol-A of Mice. International Journal of Environmental Research and Public Health. 2022; 19(21):13894. https://doi.org/10.3390/ijerph192113894
Chicago/Turabian StyleMolina-López, Ana M., Francisca Bujalance-Reyes, María Teresa Urbano, Antonio Lora-Benítez, Nahúm Ayala-Soldado, and Rosario Moyano-Salvago. 2022. "Analysis of Blood Biochemistry and Pituitary-Gonadal Histology after Chronic Exposure to Bisphenol-A of Mice" International Journal of Environmental Research and Public Health 19, no. 21: 13894. https://doi.org/10.3390/ijerph192113894