

Influence of Primary Palatal Surgery on Craniofacial Morphology in Patients with Cleft Palate Only (CPO)—Systematic Review with Meta-Analysis


Abstract
:1. Introduction
2. Materials and Methods
2.1. Search Strategy
2.2. Eligibility Criteria
- Type of study: observational studies, cohort studies, case-control studies, retrospective studies on craniofacial morphology of patients with cleft palate only.
- Outcome of interest: hard and soft tissue craniofacial morphology in lateral cephalometric analysis.
- Subject of the study: human subjects
2.3. Data Extraction
2.4. Quality Assessment
2.5. Meta-Analysis
3. Results
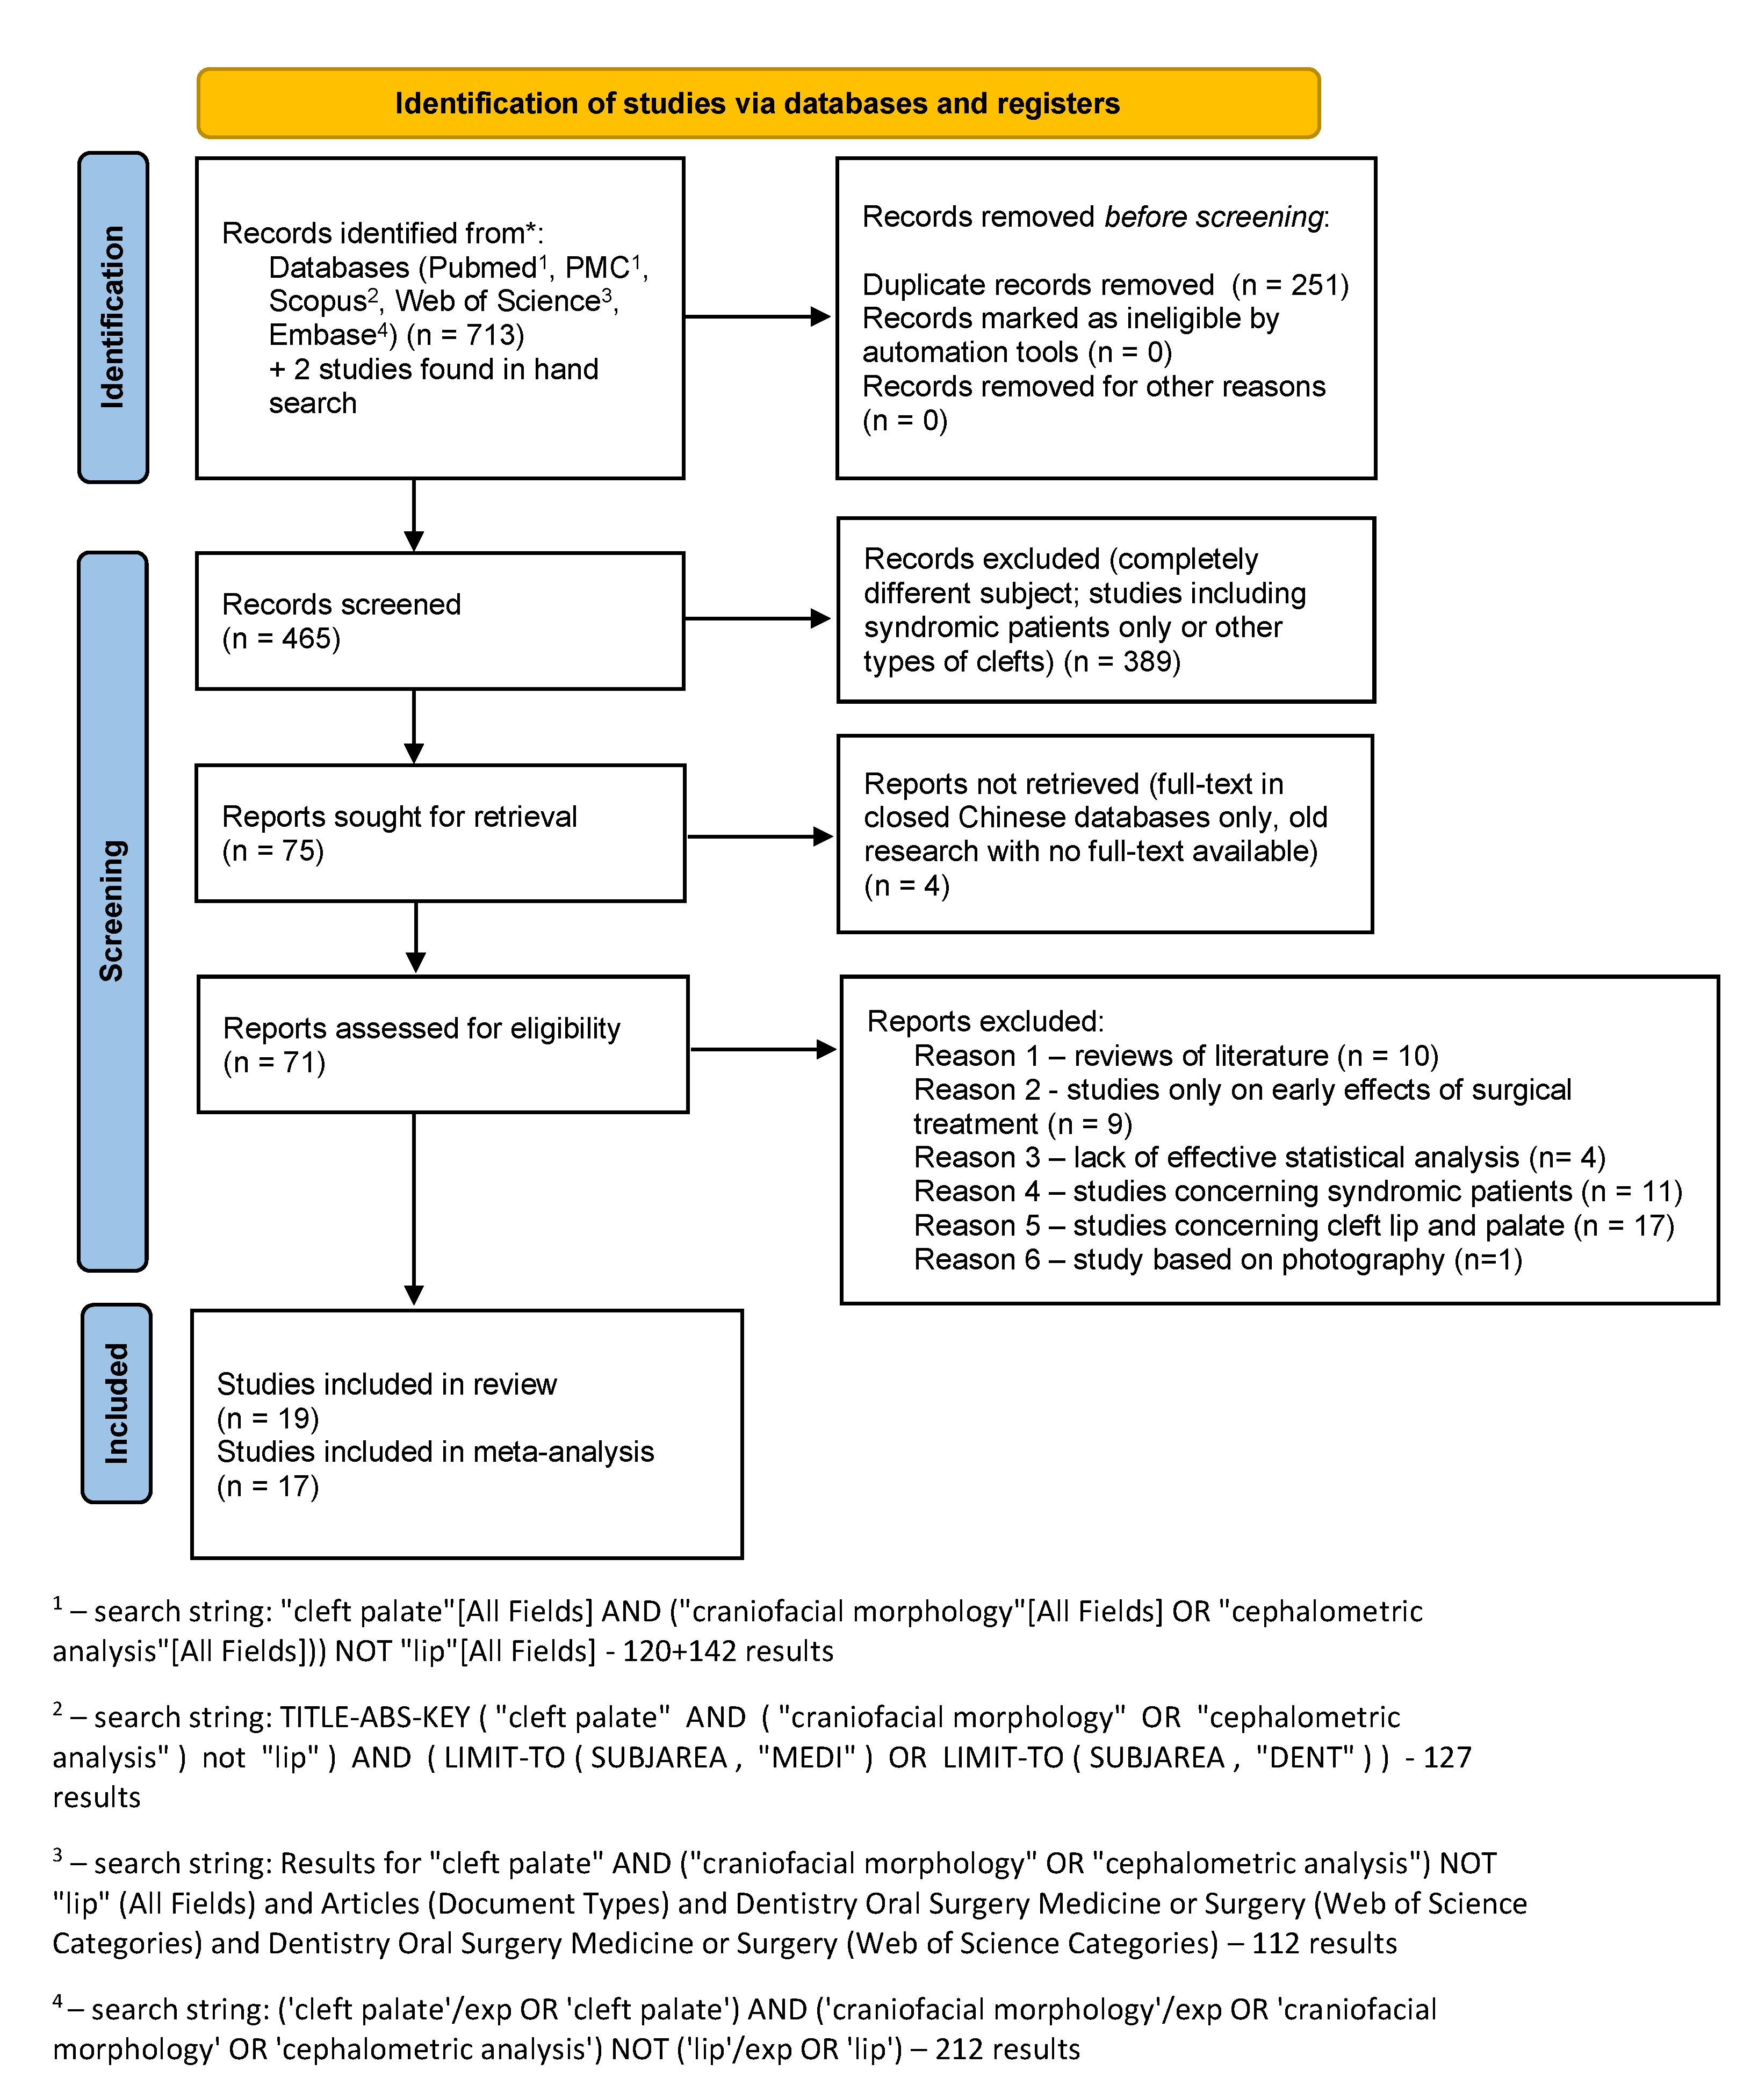
3.1. Results of the Search
3.2. Quality Assesment
3.3. Meta-Analysis
3.3.1. Patients with Untreated Cleft Palate Only vs. Non-Cleft Healthy Population
SNA
ANB
3.3.2. Patients with Untreated Submucous Cleft Palate vs. Non-Cleft Healthy Population
SNA
ANB
3.3.3. Patients with Cleft Palate Only Treated Surgically and Orthodontically vs. Non-Cleft Healthy Population
SNA
ANB
3.3.4. Patients with Submucous Cleft Palate Treated Surgically and Orthodontically vs. Non-Cleft Healthy Population
SNA
ANB
3.3.5. The Influence of Severity of Cleft Palate on the Following Skeletal Changes of Face over the Course of Life of Treated Patients
SNA
ANB
4. Discussion
5. Conclusions
- Unoperated CPO patients are characterized by a sagittal maxillary deficiency compared to non-cleft individuals;
- No direct scientific evidence could be found allowing for the direct assessment of the influence of palatal surgery in CPO on craniofacial morphology;
- A negative effect of palatal surgery in CPO on the sagittal jaw relationship in the patients affected can be indirectly seen in the following comparisons: in patients who have undergone surgical and orthodontic treatment comparing to non-cleft individuals, the size effect of SNA angle is bigger than in untreated CPO individuals compared to non-cleft;
- Cleft severity has a limited influence on SNA and ANB in operated CPO patients;
- Ethnic differences seems to be of importance when analyzing craniofacial morphology in CPO.
Supplementary Materials
Author Contributions
Funding
Institutional Review Board Statement
Informed Consent Statement
Data Availability Statement
Conflicts of Interest
References
- Mossey, P.A.; Little, J. Epidemiology of oral clefts: An international perspective. In Cleft Lip and Palate; From origin to treatment; Wyszynski, D.F., Ed.; New York University Press: New York, NY, USA, 2002; pp. 127–144. [Google Scholar]
- Mitchell, L.E. Epidemiology of Cleft Lip and palate. In Comprehensive Cleft Care; Losee, J.E., Kirschner, R.E., Eds.; McGraw Hill: New York, NY, USA, 2009; pp. 35–42. [Google Scholar]
- Suzuki, A.; Mukai, Y.; Ohishi, M.; Miyanoshita, Y.; Tashiro, H. Relationship between Cleft Severity and Dentocraniofacial Morphology in Japanese Subjects with Isolated Cleft Palate and Complete Unilateral Cleft Lip and Palate. Cleft Palate-Craniofacial. J. 1993, 30, 175–181. [Google Scholar] [CrossRef] [PubMed]
- Yoshida, H.; Nakamura, A.; Michi, K.-I.; Go-Ming, W.; Kan, L.; Wei-Liu, Q. Cephalometric Analysis of Maxillofacial Morphology in Unoperated Cleft Palate Patients. Cleft Palate-Craniofacial. J. 1992, 29, 419–424. [Google Scholar] [CrossRef] [PubMed]
- Madachi, K.; Takagi, R.; Asahito, T.; Kodama, Y.; Ominato, R.; Iida, A.; Ono, K.; Saito, I. Cephalometric Evaluation after Two-Stage Palatoplasty Combined with a Hotz Plate: A Comparative Study between the Modified Furlow and Widmaier–Perko Methods. Int. J. Oral Maxillofac. Surg. 2017, 46, 539–547. [Google Scholar] [CrossRef] [PubMed]
- Glander, K.; Cisneros, G.J. Comparison of the Craniofacial Characteristics of Two Syndromes Associated with the Pierre Robin Sequence. Cleft Palate-Craniofacial. J. 1992, 29, 210–219. [Google Scholar] [CrossRef] [PubMed]
- Kato, R.M.; Moura, P.P.; Zechi-Ceide, R.M.; Tonello, C.; Peixoto, A.P.; Garib, D. Comparison Between Treacher Collins Syndrome and Pierre Robin Sequence: A Cephalometric Study. Cleft Palate-Craniofacial. J. 2021, 58, 78–83. [Google Scholar] [CrossRef]
- Page, M.J.; McKenzie, J.E.; Bossuyt, P.M.; Boutron, I.; Hoffmann, T.C.; Mulrow, C.D.; Shamseer, L.; Tetzlaff, J.M.; Akl, E.A.; Brennan, S.E.; et al. The PRISMA 2020 statement: An updated guideline for reporting systematic reviews. BMJ 2021, 372, n71. [Google Scholar] [CrossRef]
- Beller, E.M.; Glasziou, P.P.; Altman, D.G.; Hopewell, S.; Bastian, H.; Chalmers, I.; Gøtzsche, P.C.; Lasserson, T.; Tovey, D. PRISMA for abstracts: Reporting systematic reviews in journal and conference abstracts. PLoS Med. 2013, 10, e1001419. [Google Scholar] [CrossRef] [Green Version]
- Rethlefsen, M.L.; Kirtley, S.; Waffenschmidt, S.; Ayala, A.P.; Moher, D.; Page, M.J.; Koffel, J.B. PRISMA-S: An extension to the PRISMA statement for reporting literature searches in systematic reviews. Syst. Rev. 2021, 10, 39. [Google Scholar] [CrossRef]
- Higgins, J.P.; Thomas, J.; Chandler, J.; Cumpston, M.; Li, T.; Page, M.J.; Welch, V.A. (Eds.) Cochrane Handbook for Systematic Reviews of Interventions, 2nd ed.; Wiley: Chichester, UK, 2019. [Google Scholar] [CrossRef]
- Sackett, D.L.; Strauss, S.E.; Richardson, W.S.; Rosenberg, W.; Haynes, B.R. Evidencebased Medicine: How to Practice and Teach EBM, 2nd ed.; Elsevier Churchill Livingstone: Philadelphia, PA, USA, 2000. [Google Scholar]
- Arrivé, L.; Renard, R.; Carrat, F.; Belkacem, A.; Dahan, H.; Le Hir, P.; Monnier-Cholley, L.; Tubiana, J.M. A scale of methodological quality for clinical studies of radiologic examinations. Radiology 2000, 217, 69–74. [Google Scholar] [CrossRef]
- Del Re, A.C. A practical tutorial on conducting meta-analysis in R. Quant Methods Psychol. 2015, 11, 37–50. [Google Scholar] [CrossRef] [Green Version]
- Higgins, J.P.T.; Thompson, S.G. Quantifying heterogeneity in a meta-analysis. Stat Med. 2002, 21, 1539–1558. [Google Scholar] [CrossRef]
- Hein, J.L. Discrete Structures, Logic, and Computability, 2nd ed.; Jones and Bartlett Publishers, Inc.: Sudbury, MA, USA, 2002. [Google Scholar]
- Caillot, A.; Ambroise, B.; Bénateau, H.; Veyssiere, A. Impact of Early Intravelar Veloplasty at Six Months on Mandibular Growth in Patients with Pierre Robin Sequence. J. Cranio-Maxillofac. Surg. 2018, 46, 1059–1064. [Google Scholar] [CrossRef]
- Cao, C.; Xu, X.; Shi, B.; Zheng, Q.; Li, J. Is Cleft Severity Correlated With Intrinsic Growth Pattern? Observation From Unoperated Adult Patients With Submucous Cleft Palate. J. Craniofacial. Surg. 2017, 28, 1451–1455. [Google Scholar] [CrossRef]
- Cvicelova, M.; Francisciova, Z.; Lysakova, L.; Fedeles, J.; Kroupova, D.; Molnarova, A. Kefalometrická analýza diaĺkových rtg snímok detí s orofaciálnymi rázstepmi [Cephalometric analysis of distance x-ray images in children with orofacial clefts]. Bratisl. Lek Listy. 2000, 101, 102–106. [Google Scholar]
- David, D.J.; Anderson, P.J.; Schnitt, D.E.; Nugent, M.A.C.; Sells, R. From Birth to Maturity: A Group of Patients Who Have Completed Their Protocol Management. Part II. Isol. Cleft Palate: Plast. Reconstr. Surg. 2006, 117, 515–526. [Google Scholar] [CrossRef]
- Diah, E.; Lo, L.-J.; Huang, C.-S.; Sudjatmiko, G.; Susanto, I.; Chen, Y.-R. Maxillary Growth of Adult Patients with Unoperated Cleft: Answers to the Debates. J. Plast. Reconstr. Aesthetic Surg. 2007, 60, 407–413. [Google Scholar] [CrossRef]
- Fujita, S.; Suzuki, A.; Nakamura, N.; Sasaguri, M.; Kubota, Y.; Ohishi, M. Retrospective Evaluation of Craniofacial Growth of Japanese Children with Isolated Cleft Palate: From Palatoplasty to Adolescence. Cleft Palate-Craniofacial. J. 2005, 42, 625–632. [Google Scholar] [CrossRef]
- Heliövaara, A.; Ranta, R.; Rautio, J. Craniofacial Cephalometric Morphology in Six-year-old Girls with Submucous Cleft Palate and Isolated Cleft Palate. Acta Odontol. Scand. 2003, 61, 363–366. [Google Scholar] [CrossRef]
- Iwasaki, H.; Kudo, M.; Yamamoto, Y. Does Congenital Cleft Palate Intrinsically Influence Craniofacial Morphology?: Craniofacial Features in Unoperated Submucous Cleft Palate Children in Prepuberty. J. Oral. Maxillofac. Surg. 2009, 67, 477–484. [Google Scholar] [CrossRef]
- Iwasaki, H.; Kudo, M.; Yamamoto, Y. Intrinsic Effects of Congenital Cleft Palate on Craniofacial Morphology and Growth Characteristics in Puberty. J. Craniofacial. Surg. 2010, 21, 1480–1487. [Google Scholar] [CrossRef]
- Iwasaki, H.; Kudo, M.; Yamamoto, Y. Influences of Palatoplasty by the Push-Back Procedure on Craniofacial Morphology and Growth. J. Cranio-Maxillofac. Surg. 2012, 40, 638–646. [Google Scholar] [CrossRef] [PubMed]
- Iwasaki, H.; Kudo, M.; Yamamoto, Y. The Influence of the Extend of Isolated Palatal Cleft on Craniofacial Morphology. J. Cranio-Maxillofac. Surg. 2014, 42, e125–e129. [Google Scholar] [CrossRef] [PubMed]
- Jonsson, G.; Thilander, B. Occlusion, arch dimensions, and craniofacial morphology after palatal surgery in a group of children with clefts in the secondary palate. Am. J Orthod. 1979, 76, 243–255. [Google Scholar] [CrossRef]
- Parikakis, K.; Larson, O.; Karsten, A. Facial Growth in Patients with Isolated Cleft Palate Treated with Minimal Incision Technique Compared to a Normal Population—A Cephalometric Study at 10 and 16 Years of Age. Eur. J. Orthod. 2019, 42, 36–43. [Google Scholar] [CrossRef] [PubMed]
- Parikakis, K.; Larson, O.; Karsten, A. Minimal Incision Palatoplasty with or without Muscle Reconstruction in Patients with Isolated Cleft Palate—A Cephalometric Study at 5 and 10 Years. Eur. J. Orthod. 2019, 41, 420–427. [Google Scholar] [CrossRef]
- Parikakis, K.; Larson, O.; Larson, M.; Karsten, A. Facial Growth at 5 and 10 Years After Veau-Wardill-Kilner Versus Minimal-Incision Technique Repair of Isolated Cleft Palate. Cleft Palate-Craniofacial. J. 2018, 55, 79–87. [Google Scholar] [CrossRef]
- Smahel, Z.; Hradiský, D.; Müllerová, Z. Multivariate comparison of craniofacial morphology in different types of facial clefts. Acta Chir Plast. 1999, 41, 59–65. [Google Scholar]
- Suri, S.; Ross, R.B.; Tompson, B.D. Mandibular Morphology and Growth with and without Hypodontia in Subjects with Pierre Robin Sequence. Am. J. Orthod. Dentofac. Orthop. 2006, 130, 37–46.e1. [Google Scholar] [CrossRef]
- Xu, Y.; Yang, C.; Schreuder, W.H.; Shi, J.; Shi, B.; Zheng, Q.; Wang, Y. Cephalometric Analysis of Craniofacial Morphology and Growth in Unrepaired Isolated Cleft Palate Patients. J. Cranio-Maxillofac. Surg. 2014, 42, 1853–1860. [Google Scholar] [CrossRef]
- Ye, Z.; Xu, X.; Ahmatjian, A.; Bing, S. The Craniofacial Morphology in Adult Patients with Unoperated Isolated Cleft Palate. Bone Res. 2013, 1, 195–200. [Google Scholar] [CrossRef]
- Heliövaara, A.; Ranta, R. One-Stage Closure of Isolated Cleft Palate with the Veau-Wardill-Kilner V-Y Push-Back Method or the Cronin Modification. Cephalometric Comparison of Nasopharynx. Int. J. Oral Maxillofac. Surg. 1993, 22, 267–271. [Google Scholar] [CrossRef]
- Silva Filho, O.G.D.; Rosa, L.A.D.A.; Lauris, R.D.C.M.C. Influence of Isolated Cleft Palate and Palatoplasty on the Face. J. Appl. Oral Sci. 2007, 15, 199–208. [Google Scholar] [CrossRef] [Green Version]
- Heliövaara, A.; Ranta, R. One-Stage Closure of Isolated Cleft Palate with the Veau-Wardill-Kilner V to Y Pushback Procedure or the Cronin Modification: III. Comparison of Lateral Craniofacial Morphology. Null 1993, 51, 313–321. [Google Scholar] [CrossRef]


| Author and Year | Study Groups | Outcome Measured | Results | |
|---|---|---|---|---|
| Caillot et al., 2017 [17] | patients with Pierre-Robin sequence at age 6 years operated at mean age 6 months (n = 15) | patients with Pierre-Robin sequence at age 6 years operated at ages 12–18 months (n = 10) | Lateral cephalometric analysis | SNA and SNB angles present smaller values in patients operated at earlier ages. ANB angle was similar between the groups. |
| Cao et al., 2017 [18] | unoperated adults with submucous cleft palate (sCPO) (n = 20) and unoperated CPO adult patients (n = 20) | non-cleft controls aged 18–30 years (n = 32) | Lateral cephalometric analysis | Sagittal maxillary length (ANS-PMP, A-PMP and Ba-ANS) in CPO patients was smaller than in SCPO and in sCPO was smaller than in non-cleft group. |
| Cvicelova et al. [19] | operated CPO aged 7–9 years old (n = 40) | non-cleft controls aged 7–9 years (n = 46) | Lateral cephalometric analysis | SNA (angle F) presents smaller values in CPO patients. Mandibular angle (angle G) was significantly lower. Mandibule was significantly retracted in respect to maxilla and cranial base. |
| David et al., 2006 [20] | Patients with sCPO (n = 8) aged 15–18 years old | Patients with non-syndromic CPO aged 16–20 years old (n = 15) | Lateral cephalometric analysis and audiometry | Cephalometric analysis at skeletal maturity revealed a reduced SNA angle in CPO compared to sCPO. Hearing was within the defined normal limits for all but two patients. One patient was severely impaired on one side (–40 dB) and required a hearing aid, and the other patient also had a unilateral loss; in this case, –30 dB. Speech results were judged to be within normal limits, many still had mild articulation errors. Resonance was similarly very common at some stage during development in both male and female patients, with 28 of the 32 patients affected. |
| Diah et al., 2007 [21] | Patients with unoperated CPO (n = 10) | Non-cleft healthy individuals (n = 29) | Lateral cephalometric analysis and 3D digital models analysis | SNA value is significantly lower in CPO patients. Additionally, their palatal surface is much smaller |
| Fujita et al., 2005 [22] | Patients after prepubertal growth spurt (mean 17.6 years) with operated CPO (n = 18) | Non-cleft healthy controls after prepubertal growth spurt (mean 17.6 years) (n = 34) | Lateral cephalometric analysis | In CPO patients maxillary length was shorter and the nasomaxillary complex was positioned more posteriorly in relation to the anterior cranial base, compared with the controls. The craniofacial pattern in the CPO patients was characterized as a bimaxillary retrusion, a more counterclockwise rotation of the mandible, and a shorter mandible than in non-cleft subjects. |
| Heliovaara et al., 2003 [23] | CPO girls aged 6 years (n = 60) | CPO girls aged 6 years (n = 53) | Lateral cephalometric analysis | Both maxilla and mandible were retruded, sCPO patients had a higher degree of maxillary and mandibular soft tissue prominence masking the skeletal retrusion. |
| Iwasaki 2009 [24] | children with unoperated sCPO at age 9 (n = 12) | non-cleft children with normal occlusion aged 9 (n = 60) | Lateral cephalometric analysis | Maxillary length was reduced in sCPO children compared to unaffected individuals. |
| Iwasaki et al., 2010 [25] | patients with sCPO aged 14 (n = 12) | non-cleft children with normal occlusion aged 14 (n = 60) | Lateral cephalometric analysis | In sCPO patients maxillary length was shorter, anterior part of the maxilla was retruded and posterior part of the maxilla was in a more anterior position, the inclination of the palatal plane was more pronounced compared to non-cleft children |
| Iwasaki et al., 2012 [26] | Patients with sCPO: operated at mean ages 3.7 years at 9 and 14 years old (n = 28) | unoperated patients, examined at ages 9 and 14 (n = 13) | Lateral cephalometric analysis | Posterior facial height was significantly shorter and palatal plane was more inclined in operated patients. Posterior part of the maxilla was positioned more posteriorly in operated versus unoperated patients. |
| Iwasaki et al., 2014 [27] | patients with sCPO (n = 12), CPO patients not extending as far as incisive foramen (n = 13), patients reaching to incisive foramen (n = 12); all age-matched | Lateral cephalometric analysis | In children with CPO anteroposterior maxillary length was shorter, and anterior part of the maxilla was positioned more posteriorly. | |
| Jonsson et al., 1979 [28] | patients with sCPO (n = 26) | CPO patients (n = 29) | Lateral cephalometric analysis | CPO children had lower SNA values, higher gonial angle and higher posterior face height. |
| Parikakis et al., 2019 [29] | CPO patients operated at age 13 months with cephalograms made at ages 10 and 16 years (n = 55) | non-cleft children with 55 cephalograms made at age 10 years and 55 at age of 16 years, results presented for boys and girls separately (n = 110/2) | Lateral cephalometric analysis | SNA and SNB were smaller, palatal plane and mandibular length were shorter and posterior upper face height was shorter in CPO patients compared to non-cleft individuals. |
| Parikakis et al., 2018 [30] | 170 Caucasian operated patients with CPO The patients were treated surgically with minimal-incicsion (n = 85) or minial-incision with muscle reconstruction (n = 85) palatoplasty and divided further into two subgroups: clefts within the soft palate only (n = 51) and within the hard and soft palate (n = 119) | Lateral cephalometric analysis | At 5 years of age, an increased inclination of the palatal plane to anterior cranial base, decreased posterior upper face height, and a shorter mandibular length were found in the CPO group. At 10 years of age, an increased inclination of the palatal plane, a decreased posterior upper face height, and a longer palatal length were found in the minimal-incision group with muscle reconstruction. | |
| Parikakis et al., 2018 [31] | 145 children with non-syndromic CPO: with sCPO (n = 34) and with soft and hard palate repaired with Veau-Wardill-Kilner technique (n = 25) | children with sCPO (n = 30), children with CPO repaired (n = 56) with minimal incision technique | Lateral cephalometry at ages 5 and 10 | Mandibular length at age 5 was shorter in minimal incision group. ANB angle was smaller in Veau-Wardill-Kilner technique group. No significant differences were found at age 10. |
| Smahel et al. 1999 [32] | 187 adult men patients with different types of cleft palate including patients with sCPO (n = 17) and CPO patients (n = 32) | Lateral cephalometrics | SNA was lower, inclination of upper incisors to nasion-pogonion line was lower, proportion of posterior to anterior face height was lower than in uncleft controls. | |
| Suri et al. 2021 [33] | 34 patientes with operated non-syndormic cleft palate (n = 34) | Non-cleft healthy controls (n = 34) | Lateral cephalometrics | Significant differences were noted in CPO group regarding smaller cranial base length, shorter maxillary length, increased palatal and mandibular plane inclinations. |
| Xu et al., 2014 [34] | Unoperated Chineese CPO patients (n = 106) | Non-cleft healthy controls (n = 102) | Anteroposterior and lateral cephalometrics | Unoperated children showed a shorter cranial base length (S-N, S-Ba, N-Ba), a reduced maxillary horizontal length (ANS-Pmp), reduced maxillary vertical dimension (N-ANS) and retruded maxilla (SNA). The mandibular body, ramus and total mandibular length were shortened. However, sagittal mandibular position (SNB) and chin (Sn-Pg) were not significantly different from unaffected controls. Maxillary transverse dimensions were normal. |
| Ye et al. 2013 [35] | Nonsyndromic isolated CPO (n = 37) | Age and gender matched non-clefts (n = 39) | Lateral cephalometrics | Patients with isolated cleft palate were characterized by maxillary retrusion. Mandible morphology and cranial basal morphology in CPO showed no significant difference with controls. Patients with CPO are more vulnerable to cross bite. Intrinsic deficiencies did detrimental effect on maxilla sagittal length, but did no detrimental effect on maxilla position, mandible size and position. |
| Authors and Year of Publication | Study Design | Study Purpose | Reference Standard | Inclusion Criteria | Indeterminate Results | Exclusion Criteria | Spectrum of Patients | Analysis Method | Analysis Criteria | Avoided Work-Up Bias | Avoided Diagnostic-Review Bias | Avoided Test-Review Bias | Intraobserver Reliability | Interobserver Reliability | Statistical Analysis |
|---|---|---|---|---|---|---|---|---|---|---|---|---|---|---|---|
| Caillot et al., 2018 [17] | 1 | 1 | 1 | 1 | 1 | 1 | 1 | 1 | 1 | 1 | 1 | 1 | 1 | 0 | 1 |
| Cao et al., 2017 [18] | 1 | 1 | 1 | 1 | 1 | 1 | 1 | 1 | 1 | 1 | 1 | 0 | 1 | 0 | 1 |
| Cvicelova et al. [19] | 1 | 1 | 1 | 1 | 0 | 0 | 1 | 1 | 1 | 1 | 0 | 0 | 0 | 0 | 1 |
| David et al., 2006 [20] | 1 | 1 | 1 | 1 | 0 | 1 | 1 | 1 | 1 | 1 | 1 | 1 | 0 | 0 | 1 |
| Diah et al., 2007 [21] | 1 | 1 | 1 | 1 | 1 | 1 | 1 | 1 | 1 | 1 | 1 | 1 | 1 | 0 | 1 |
| Fujita et al., 2005 [22] | 1 | 1 | 1 | 1 | 1 | 1 | 1 | 1 | 1 | 1 | 1 | 1 | 1 | 0 | 1 |
| Heliovaara et al., 2003 [23] | 1 | 1 | 1 | 1 | 1 | 0 | 1 | 1 | 1 | 0 | 0 | 0 | 0 | 0 | 1 |
| Iwasaki 2009 [24] | 1 | 1 | 1 | 1 | 1 | 1 | 1 | 1 | 1 | 0 | 0 | 0 | 0 | 0 | 1 |
| Iwasaki et al. 2010 [25] | 1 | 1 | 1 | 1 | 1 | 1 | 1 | 1 | 1 | 0 | 0 | 0 | 0 | 0 | 1 |
| Iwasaki et al., 2012 [26] | 1 | 1 | 1 | 1 | 1 | 1 | 1 | 1 | 1 | 0 | 0 | 0 | 0 | 0 | 1 |
| Iwasaki et al., 2014 [27] | 1 | 1 | 1 | 1 | 0 | 1 | 0 | 1 | 1 | 0 | 0 | 0 | 0 | 0 | 1 |
| Jonsson et al., 1979 [28] | 1 | 1 | 1 | 1 | 1 | 0 | 0 | 1 | 1 | 1 | 0 | 0 | 0 | 0 | 1 |
| Parikakis et al., 2019 [29] | 1 | 1 | 1 | 1 | 1 | 1 | 1 | 1 | 1 | 1 | 1 | 1 | 1 | 0 | 1 |
| Parikakis et al., 2018 [30] | 1 | 1 | 1 | 1 | 1 | 1 | 1 | 1 | 1 | 1 | 1 | 1 | 1 | 0 | 1 |
| Parikakis et al., 2018 [31] | 1 | 1 | 1 | 1 | 1 | 1 | 1 | 1 | 1 | 1 | 1 | 1 | 1 | 0 | 1 |
| Smahel et al., 1999 [32] | 1 | 1 | 1 | 1 | 1 | 0 | 1 | 1 | 1 | 1 | 0 | 0 | 0 | 0 | 1 |
| Suri et al., 2021 [33] | 1 | 1 | 1 | 1 | 1 | 1 | 1 | 1 | 1 | 1 | 1 | 1 | 1 | 0 | 1 |
| Patients with Untreated Cleft Palate Only vs. Non-Cleft Healthy Population | ||||||||
| Author | Number of Cleft Patients | Age of Cleft Patients in Years | SNA Value in the Cleft Group | ANB Value in the Clef Group | Number of Healthy Patients | Age of Healthy Patients in Years | SNA Value in the Healthy Group | ANB Value in the Healthy Group |
| Cao et al., 2017 [18] | 20 | 25.43 ± 7.18 | 78.24 ± 3.55 | −0.71 ± 3.9 | 32 | 24.65 ± 6.16 | 81.54 ± 3.34 | 3.94 ± 1.48 |
| Xu et al., 2014 [34] | 36 | 5–7 | 77.5 ± 3.3 | 2.4 ± 2.3 | 32 | 5–7 | 80.4 ± 3.2 | 4.2 ± 2.0 |
| Xu et al., 2014 [34] | 40 | 12–14 | 80.2 ± 4.5 | 1.1 ± 3.0 | 40 | 12–14 | 81.2 ± 3.4 | 3.0 ± 1.6 |
| Xu et al., 2014 [34] | 30 | >18 | 79.4 ± 4.7 | 0.8 ± 3.6 | 30 | >18 | 81.4 ± 3.9 | 3.5 ± 1.8 |
| Ye et al., 2013 [35] | 37 | 22.19 ± 6.57 | 79.30 ± 4.39 | 0.51 ± 2.22 | 39 | 21.31 ± 5.27 | 80.27 ± 3.62 | 1.98 ± 2.45 |
| Patients with untreated submucous cleft palate vs. non-cleft healthy population | ||||||||
| Author | Number of cleft patients | Age of clef ± patients in years | SNA value in the cleft group | ANB value in the clef group | Number of healthy patients | Age of healthy patients in years | SNA value in the healthy group | ANB value in the healthy group |
| Cao et al., 2017 [18] | 20 | 24.32 ± 6.22 | 79.98 ± 4.23 | 2.02 ± 2.38 | 32 | 24.65 ± 6.16 | 81.54 ± 3.34 | 3.94 ± 1.48 |
| Diah et al., 2007 [21] | 10 | >16 | 80.8 ± 4.4 | Not provided | 29 | >18 | 84.1 ± 2.7 | Not provided |
| Iwasaki et al., 2009 [24] | 7 | 9.5 ± 0.4 | 80.35 ± 3.12 | 1.91 ± 2.22 | 30 | 9.5 ± 0.3 | 83.25 ± 3.60 | 4.64 ± 2.43 |
| Iwasaki et al., 2009 [24] | 5 | 9.5 ± 0.4 | 79.99 ± 2.55 | 1.82 ± 4.91 | 30 | 9.5 ± 0.4 | 82.87 ± 3.87 | 4.33 ± 2.28 |
| Iwasaki et al., 2010 [25] | 7 | 14 (14.1–14.9) | 85.40 ± 2.50 | Not provided | 30 | 14 (14.1–14.9) | 87.92 ± 3.78 | Not provided |
| Iwasaki et al., 2010 [25] | 5 | 14 (14.1–14.9) | 83.71 ± 1.84 | Not provided | 30 | 14 (14.1–14.9) | 87.50 ± 4.14 | Not provided |
| Patients with cleft palate only treated surgically and orthodontically vs. non-cleft healthy population | ||||||||
| Author | Number of cleft patients | Age of cleft patients in years | SNA value in the cleft group | ANB value in the clef group | Number of healthy patients | Age of healthy patients in years | SNA value in the healthy group | ANB value in the healthy group |
| Cvicelova et al., 2000 [19] | 40 | 7–9 | 80.14 ± 2.06 | Not provided | 46 | 7–9 | 84.05 ± 3.18 | Not provided |
| Fujita et al., 2005 [22] | 18 | Mean: 17 years 6 months; range: 14 years 7 months to 22 years 6 months | 78.6 ± 4.33 | 1.8 ± 2.18 | 50 | >18 | 82 ± 0.06 | 3.1 ± 2.03 |
| Parikakis et al., 2019 [29] | 25 | Mean 10 | 77.9 ± 3.2 | 2 ± 3.1 | 25 | Mean 10 | 83.5 ± 3.7 | 4.1 ± 2 |
| Parikakis et al., 2019 [29] | 30 | Mean 10 | 80.4 ± 4.2 | 2.9 ± 2.6 | 30 | Mean 10 | 84.0 ± 3.4 | 4 ± 2 |
| Parikakis et al., 2019 [29] | 25 | Mean 16 | 79.6 ± 3.5 | 1.02.8 | 25 | Mean 16 | 84.0 ± 3.5 | 2.2 ± 2.7 |
| Parikakis et al., 2019 [29] | 30 | Mean 16 | 81.1 ± 4.8 | 2.32.9 | 30 | Mean 16 | 84.7 ± 3.8 | 2.5 ± 1.9 |
| Smahel et al., 1999 [32] | 32 | 20–40 | 77.45 ± 0.08 | 0.59 ± 0.51 | 50 | 20–40 | 80.84 ± 0.68 | 2.64 ± 0.35 |
| Suri et al., 2010 [33] | 34 | 11 ± 0.7 | 76.53 ± 3.75 | 4.39 ± 2.97 | 34 | 11.9 ± 0.9 | 81.28 ± 3.09 | 3.22 ± 1.78 |
| Patients with submucous cleft palate treated surgically and orthodontically vs. non-cleft healthy population | ||||||||
| Author | Number of cleft patients | Age of cleft patients | SNA value in the cleft group | ANB value in the clef group | Number of healthy patients | Age of healthy patients in years | SNA value in the healthy group | ANB value in the healthy group |
| Iwasaki et al., 2012 [26] | 13 | 14 (14.1–14.9) | 83.2 ± 4.3 | Not provided | 30 | 14 (14.1–14.9) | 88.46 ± 3.23 | Not provided |
| Iwasaki et al., 2012 [26] | 15 | 14 (14.1–14.9) | 80.19 ± 3.96 | Not provided | 30 | 14 (14.1–14.9) | 88.56 ± 4.1 | Not provided |
| Smahel et al., 1999 [32] | 32 | 20–40 | 76.92 ± 0.92 | −0.03 ± 0.47 | 50 | 20–40 | 80.84 ± 0.68 | 2.64 ± 0.35 |
| The influence of severity of cleft palate on the following skeletal changes of face over the course of life of treated patients | ||||||||
| Author | Number of patients with submucosal cleft palate | Age of patients with submucosal cleft palate in years | SNA value in patients with submucosal cleft palate | ANB value in patients with submucosal cleft palate | Number of patients with cleft palate only | Age of patients with cleft palate only in years | SNA value in patients with cleft palate only | ANB value in patients with cleft palate only |
| David et al., 2006 [20] | 8 | 16.375 ± 0.99 | 83 ± 5.39 | 1.38 ± 2.82 | 15 | 17.3 ± 1.07 | 77.6 ± 3.9 | 1.8 ± 3.01 |
| Heliovaara et al., 2003 [23] | 53 | Mean: 6.2 (5.5–7.5) | 92.2 ± 4.2 | 8.3 ± 2.4 | 40 | Mean: 6.2 (5.8–6.8) | 89.4 ± 3.7 | 7.8 ± 2.3 |
| Iwasaki et al., 2014 [27] | 14 | Mean: 9.4 (9.0–9.9 years) | 85.57 ± 5.47 | Not provided | 13—not extending to incisive foramen | Mean: 9.4 (9.0–9.9 years) | 75.90 ± 4.92 | Not provided |
| Iwasaki et al., 2014 [27] | 14 | Mean: 9.4 (9.0–9.9 years) | 85.57 ± 5.47 | Not provided | 12—extending to incisive foramen | Mean: 9.4 (9.0–9.9 years) | 72.13 ± 3.71 | Not provided |
| Jonsson et al., 1979 [28] | 14 | 10 | 77.8 ± 3.2 | Not provided | 16 | 10 | 77.3 ± 3.2 | Not provided |
| Smahel et al., 1999 [32] | 32 | 20–40 | 76.92 ± 0.92 | −0.03 ± 0.47 | 32 | 20–40 | 77.45 ± 0.08 | 0.59 ± 0.51 |
| Parikakis et al., 2018—minimal incision technique [30] | 28 | 5 | 80.7 ± 0.7 | 3.8 ± 0.6 | 52 | 5 | 80.8 ± 0.5 | 4.8 ± 0.4 |
| Parikakis et al., 2018—modified minimal incision technique [30] | 17 | 5 | 82.8 ± 0.8 | 4.9 ± 0.7 | 55 | 5 | 80.1 ± 0.5 | 3.5 ± 0.5 |
| Parikakis et al., 2018—minimal incision technique [30] | 26 | 10 | 80.2 ± 0.7 | 2.9 ± 0.6 | 44 | 10 | 80.3 ± 0.6 | 3.2 ± 0.4 |
| Parikakis et al., 2018—modified minimal incision technique [30] | 16 | 10 | 80.1 ± 0.8 | 3.3 ± 0.6 | 55 | 10 | 80.1 ± 0.5 | 2.3 ± 0.4 |
Publisher’s Note: MDPI stays neutral with regard to jurisdictional claims in published maps and institutional affiliations. |
© 2022 by the authors. Licensee MDPI, Basel, Switzerland. This article is an open access article distributed under the terms and conditions of the Creative Commons Attribution (CC BY) license (https://creativecommons.org/licenses/by/4.0/).
Share and Cite
Janiszewska-Olszowska, J.; Grocholewicz, K.; Mazur, M.; Jedliński, M. Influence of Primary Palatal Surgery on Craniofacial Morphology in Patients with Cleft Palate Only (CPO)—Systematic Review with Meta-Analysis. Int. J. Environ. Res. Public Health 2022, 19, 14006. https://doi.org/10.3390/ijerph192114006
Janiszewska-Olszowska J, Grocholewicz K, Mazur M, Jedliński M. Influence of Primary Palatal Surgery on Craniofacial Morphology in Patients with Cleft Palate Only (CPO)—Systematic Review with Meta-Analysis. International Journal of Environmental Research and Public Health. 2022; 19(21):14006. https://doi.org/10.3390/ijerph192114006
Chicago/Turabian StyleJaniszewska-Olszowska, Joanna, Katarzyna Grocholewicz, Marta Mazur, and Maciej Jedliński. 2022. "Influence of Primary Palatal Surgery on Craniofacial Morphology in Patients with Cleft Palate Only (CPO)—Systematic Review with Meta-Analysis" International Journal of Environmental Research and Public Health 19, no. 21: 14006. https://doi.org/10.3390/ijerph192114006