
Community Concern about the Health Effects of Pollutants: Risk Perception in an Italian Geothermal Area
 ,
,  , , , , ,
Abstract
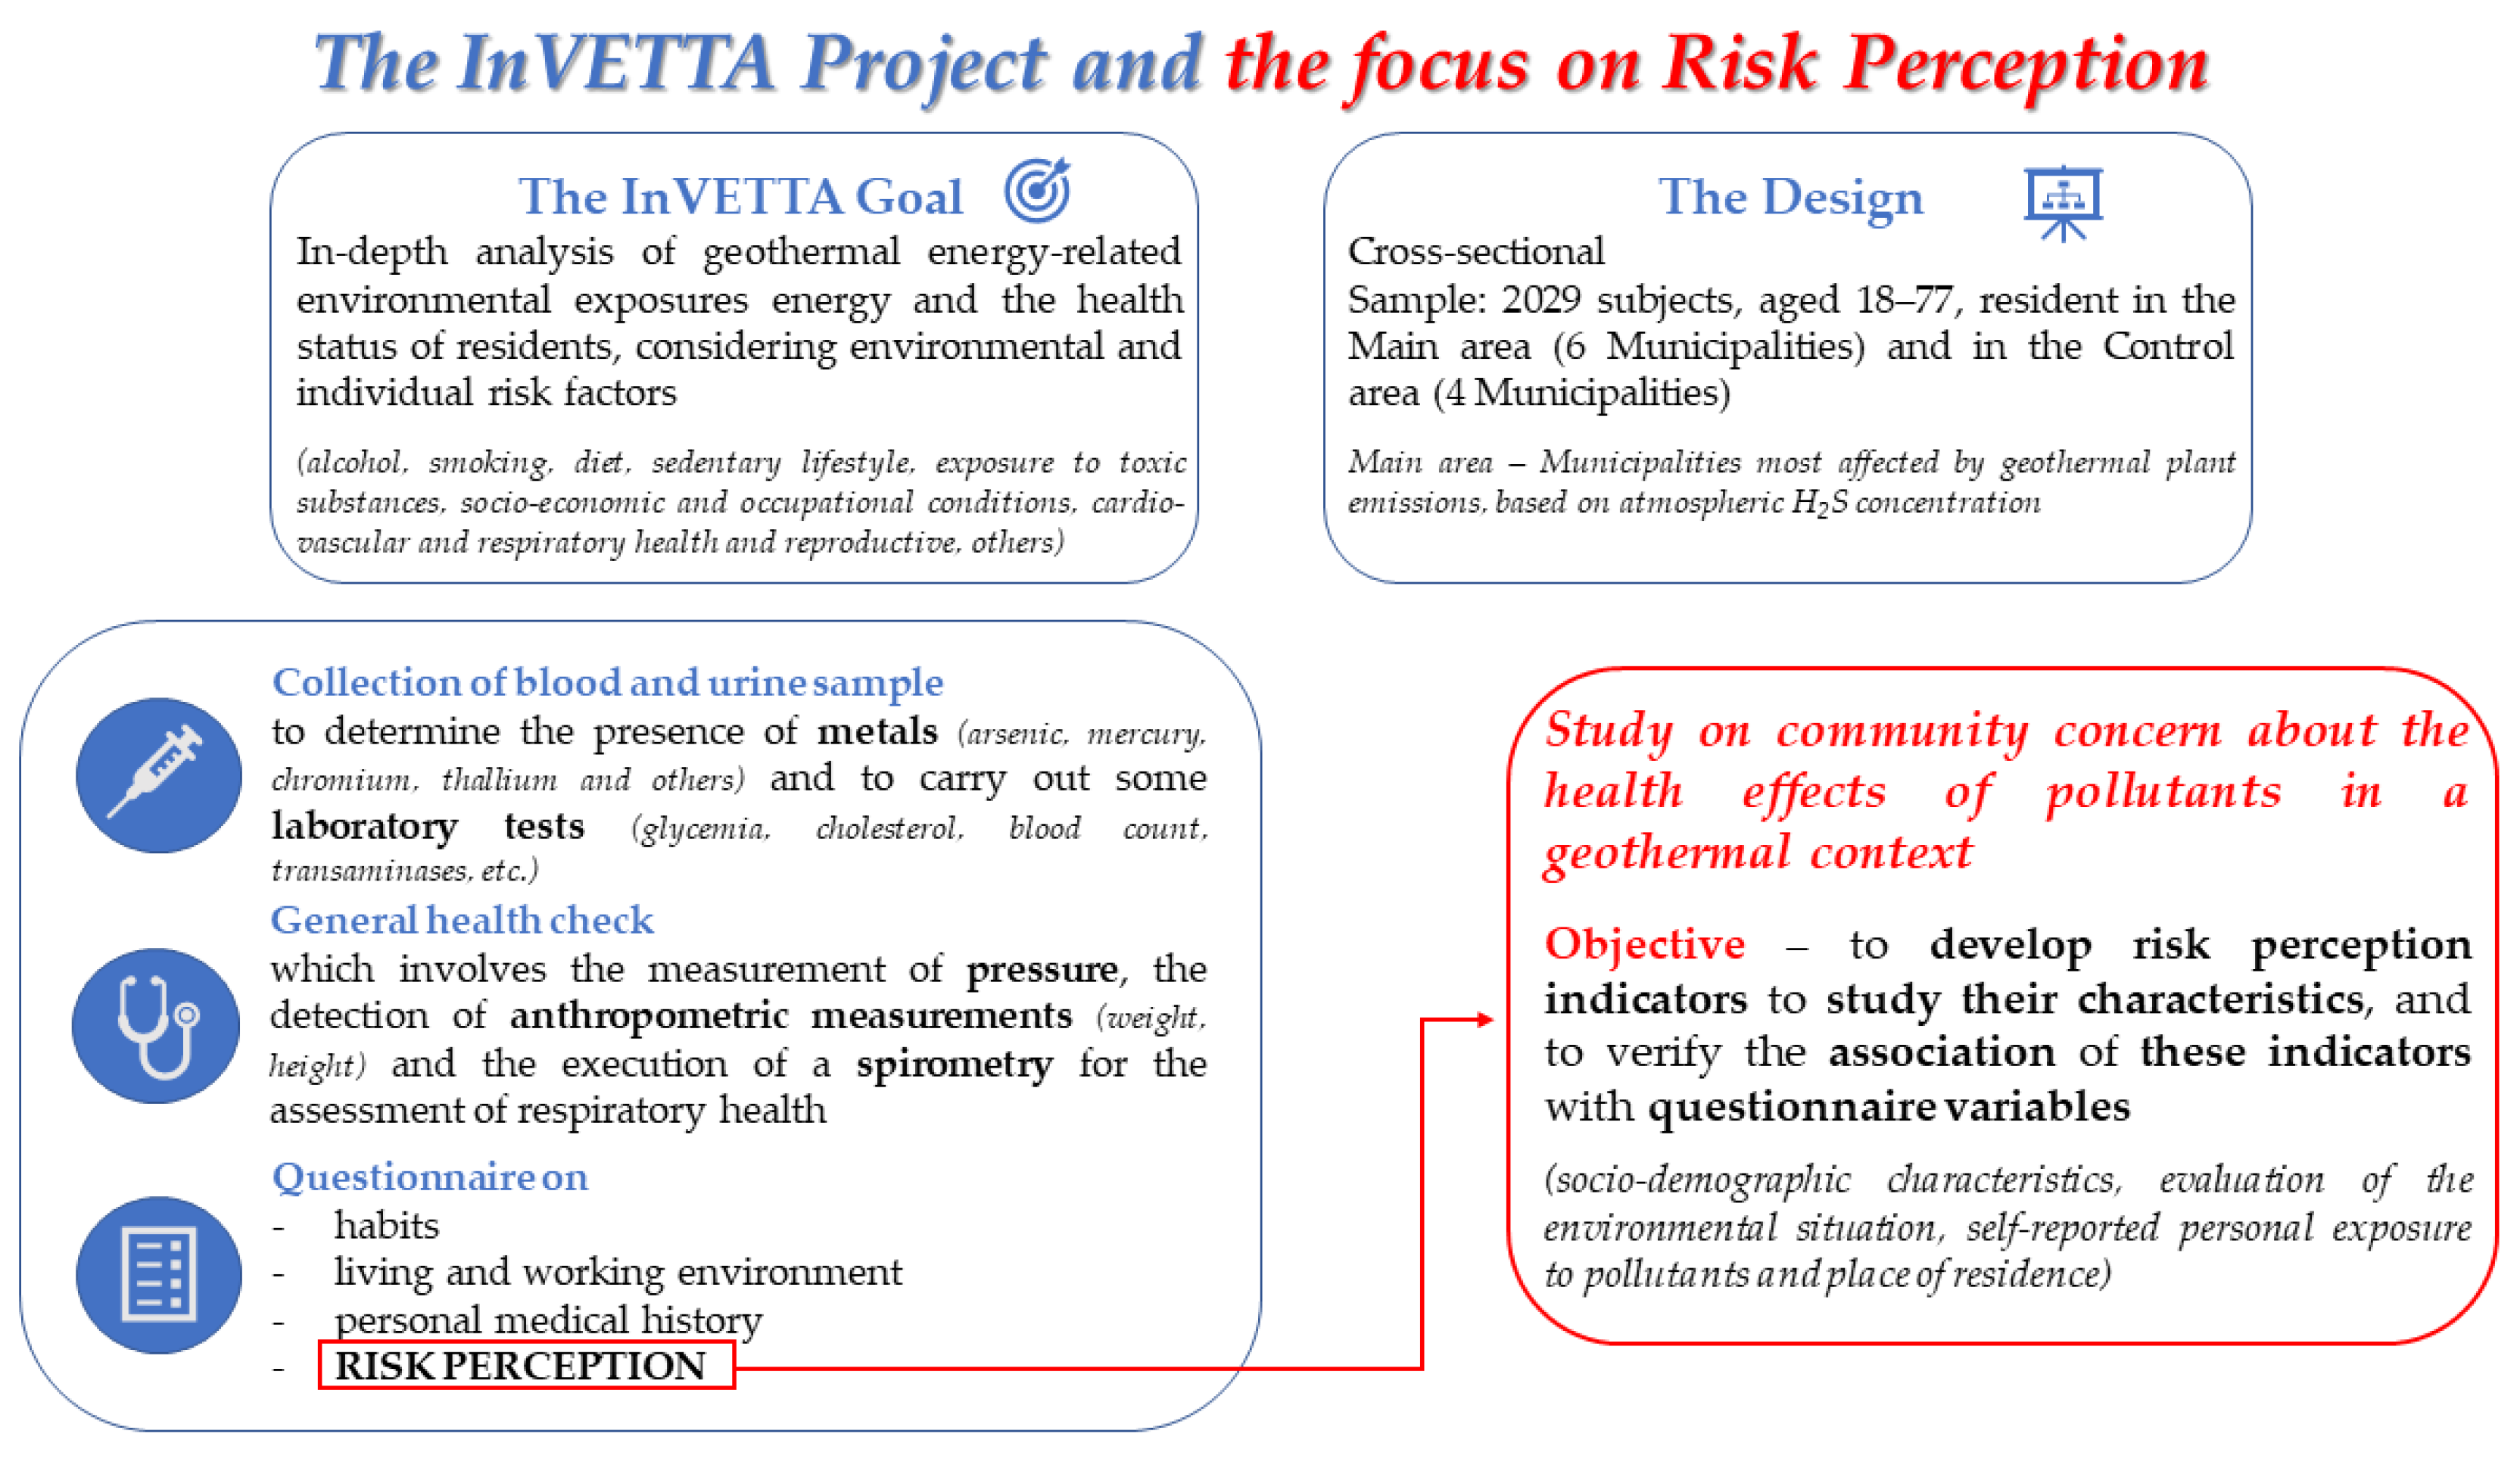
:1. Introduction
2. Materials and Methods
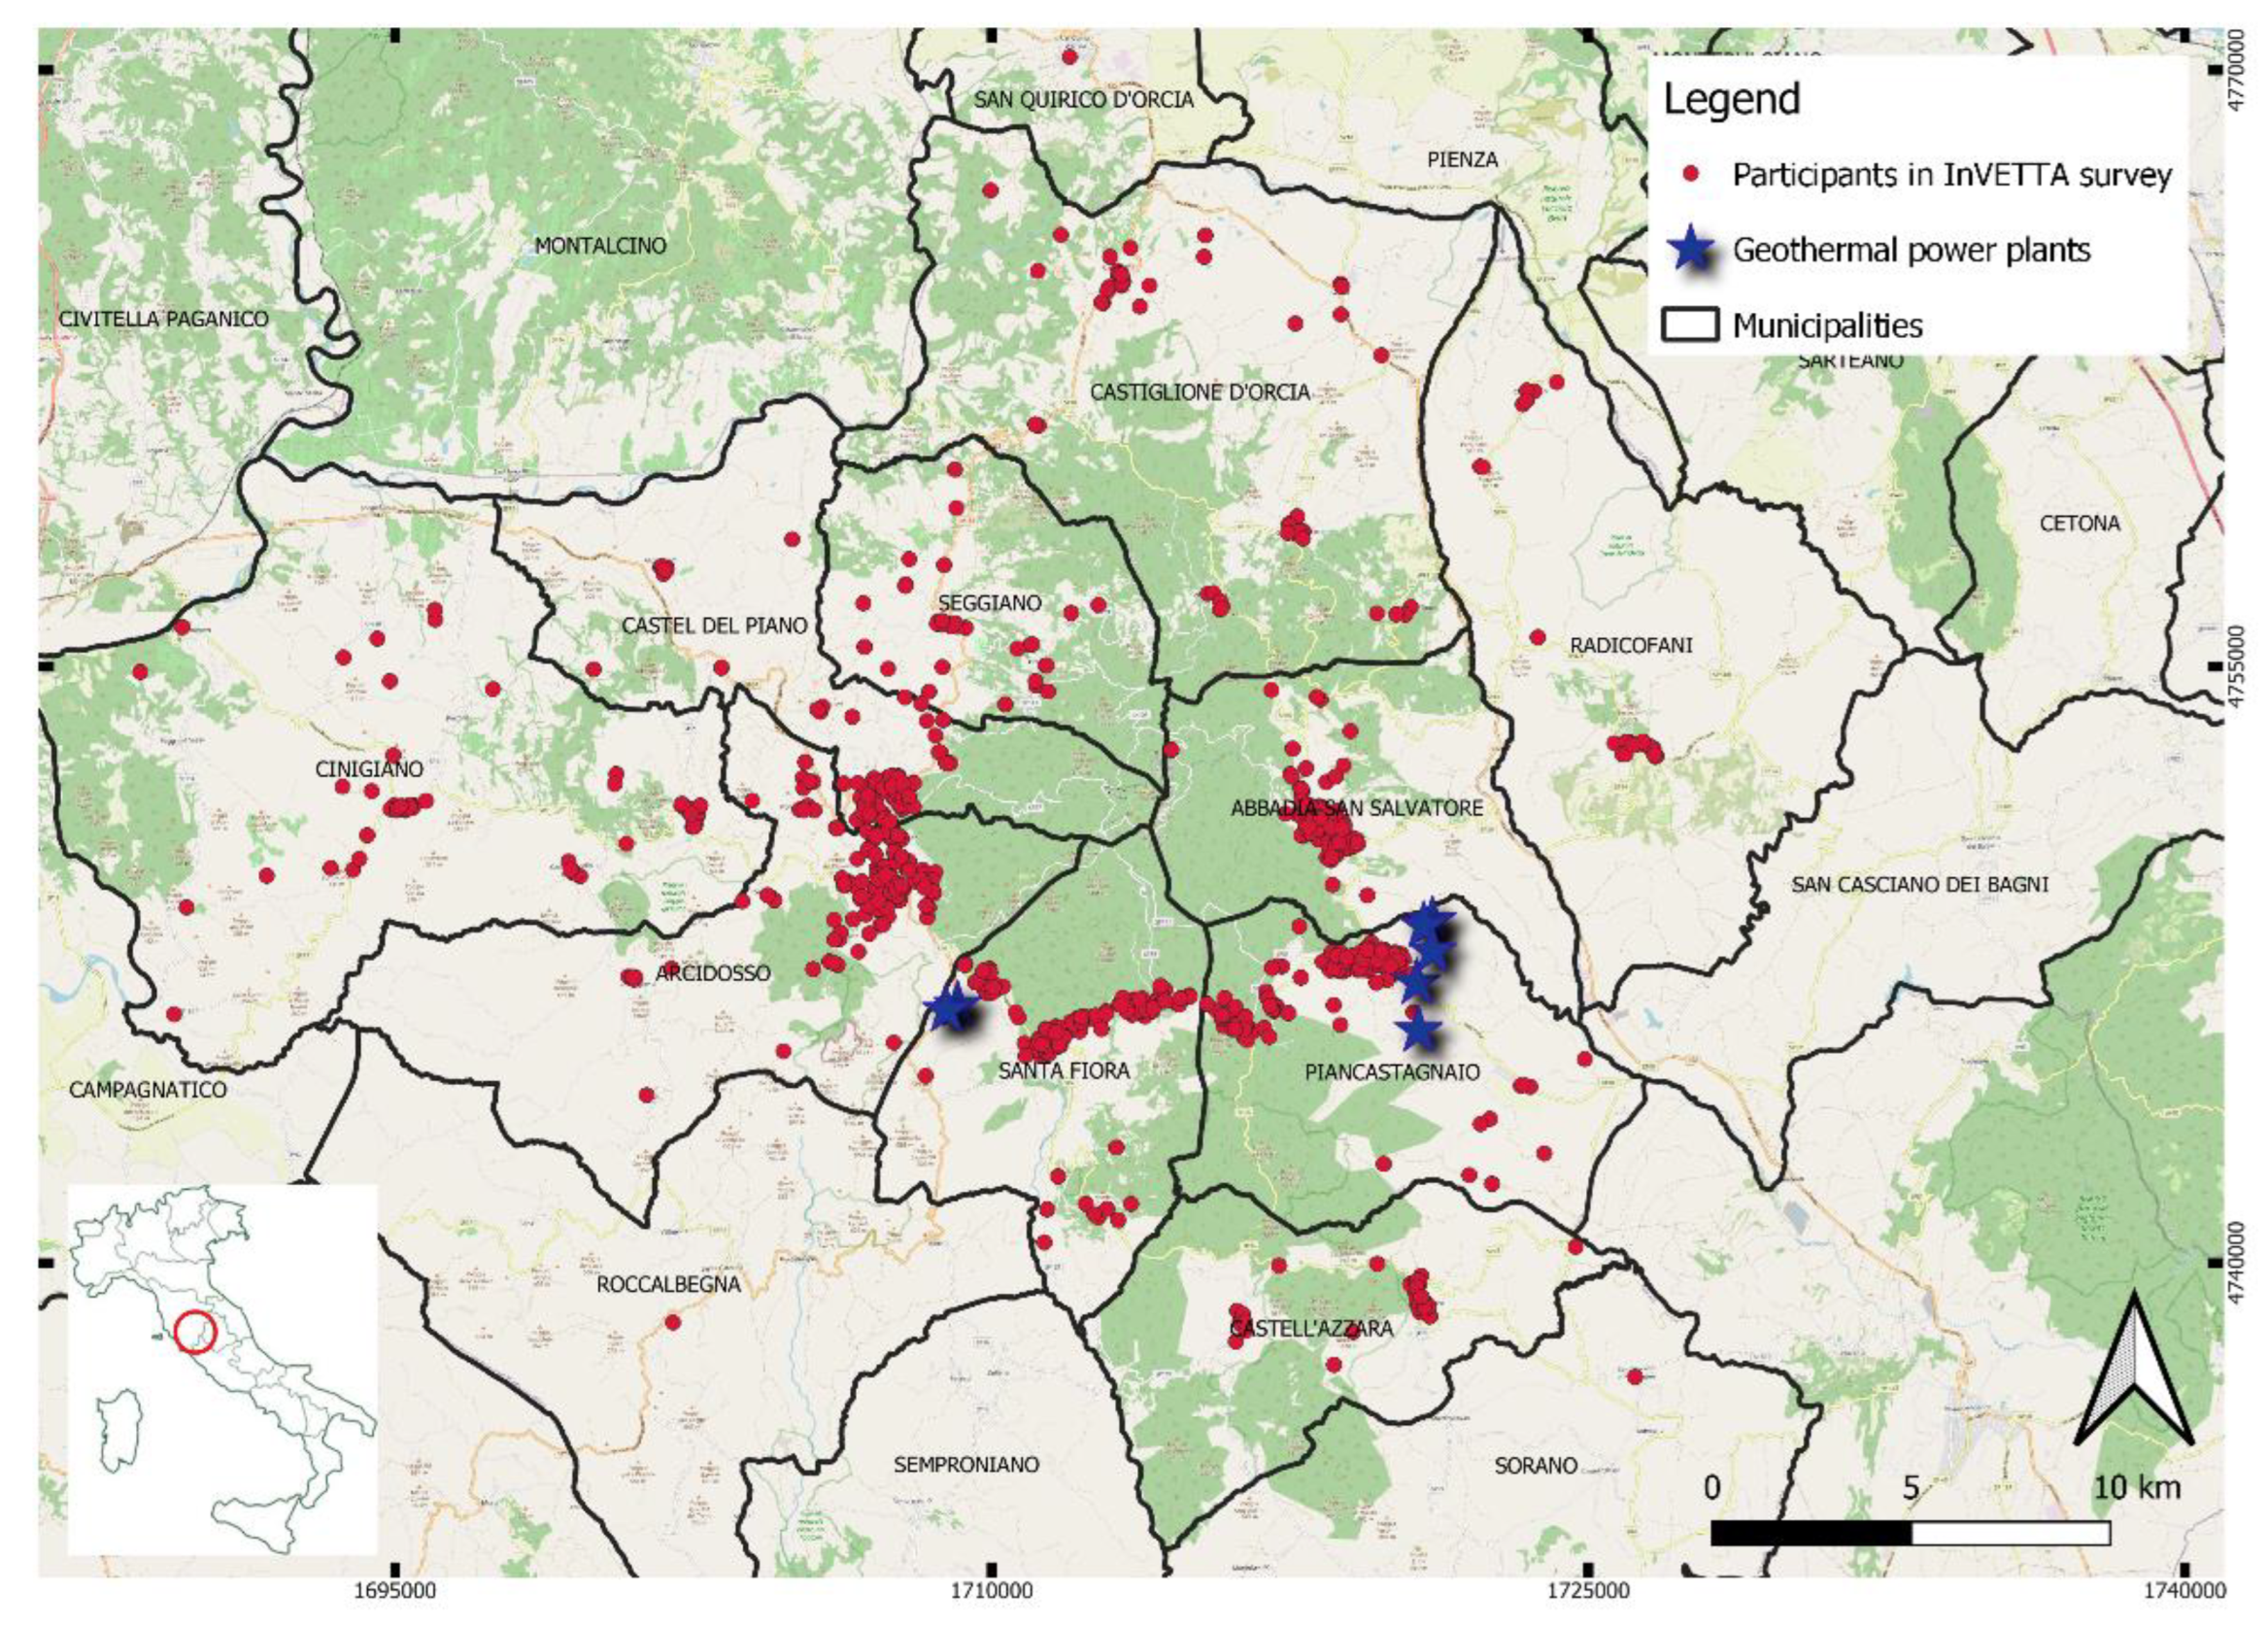
2.1. The Survey
2.2. The Questionnaire Section on Risk Perception
2.3. Development of the Risk Perception Indices (RPIs)
2.4. Statistical Analyses
2.5. Ethical Aspects
3. Results
- -
- women had a significantly higher perception than men (HPI 0.08, EHPI 0.06, HRPI 0.06, RPI 0.07);
- -
- with increasing age, the HPI, EHPI, RPI decreased significantly;
- -
- up to the age of 59, EHPI, HRPI and RPI remained constant and then decreased significantly in older subjects;
- -
- as education level increased, all types of perception increased significantly;
- -
- volunteers had a significantly higher perception of risk (HPI 0.05, EHPI 0.03, HRPI 0.04, RPI 0.04);
- -
- subjects who reported perceiving unpleasant odours had a significantly higher perception of hazard/exposure/risk (HPI 0.08, EHPI 0.08, HRPI 0.05, RPI 0.06);
- -
- subjects living in the Amiata municipalities most exposed to geothermal emissions (main area) had a significantly higher perception of hazard/exposure/risk (HPI 0.06, EHPI 0.06, HRPI 0.06, RPI 0.07);
- -
- subjects reporting occupational exposure to dust, chemicals, etc., had a significantly lower perception of hazard (HPI 0.04) exposure (EHPI 0.02) and risk (RPI 0.02).
4. Discussion
5. Conclusions
Author Contributions
Funding
Institutional Review Board Statement
Informed Consent Statement
Acknowledgments
Conflicts of Interest
References
- Manzella, A.; Allansdottir, A.; Pellizzone, A. Geothermal Energy and Society; Lecture Notes in Energy 67; Springer: Berlin/Heidelberg, Germany, 2018; p. 228. [Google Scholar] [CrossRef]
- Shortall, R.; Uihlein, A.; Carrara, S. Geothermal Energy: Technology Market Report; EU Publications Office: Luxembourg, 2019; Available online: https://data.europa.eu/doi/10.2760/683878 (accessed on 27 July 2022).
- ARPAT. Monitoraggio Delle Aree Geotermiche Toscane—Anno 2015—Controllo Alle Emissioni Delle Centrali Geotermoelettriche. Italia. Available online: http://www.arpat.toscana.it/documentazione/report/report-geotermia/monitoraggio-delle-aree-geotermiche-toscane-anno-2015 (accessed on 27 July 2022).
- Bertani, R. Geothermal Power Generation in the World 2010–2014 Update Report. Geothermics 2016, 60, 31–43. [Google Scholar] [CrossRef]
- ARPAT. Annuario Dei Dati Ambientali 2021—ARPAT—Agenzia Regionale Per La Protezione Ambientale Della Toscana. Available online: http://www.arpat.toscana.it/documentazione/catalogo-pubblicazioni-arpat/annuario-dei-dati-ambientali-2021 (accessed on 27 July 2022).
- ARPAT. Monitoraggio Delle Aree Geotermiche Toscane—Anno 2019—Controllo Alle Emissioni Delle Centrali Geotermoelettriche di ENEL GPI. Available online: http://www.arpat.toscana.it/documentazione/report/report-geotermia/monitoraggio-delle-aree-geotermiche-toscane-anno-2019 (accessed on 27 July 2022).
- Bustaffa, E.; Minichilli, F.; Andreassi, M.A.; Carone, S.; Coi, A.; Cori, L.; Faita, F.; Faita, F.; Grecchi, S.; Minoia, C.; et al. SEPIAS Working Group. Studies on markers of exposure and early effect in areas with arsenic pollution: Methods and results of the project SEpiAs. Epidemiological surveillance in areas with environmental pollution by natural or anthropogenic arsenic. Epidemiol. Prev. 2014, 38, 27–94. [Google Scholar] [PubMed]
- Minichilli, F.; Nuvolone, D.; Bustaffa, E.; Cipriani, F.; Vigotti, M.A.; Bianchi, F. State of health of populations residing in geothermal areas of Tuscany. Epidemiol. Prev. 2012, 36, 1–104. [Google Scholar]
- Nuvolone, D.; Petri, D.; Pepe, P.; Voller, F. Health Effects Associated with Chronic Exposure to Low-Level Hydrogen Sulfide from Geothermoelectric Power Plants. A Residential Cohort Study in the Geothermal Area of Mt. Amiata in Tuscany. Sci. Total Environ. 2019, 659, 973–982. [Google Scholar] [CrossRef] [PubMed]
- European Environment Agency (EU body or agency). Mercury in Europe’s Environment: A Priority for European and Global Action; Publications Office of the European Union: Luxembourg. Available online: https://data.europa.eu/doi/10.2800/558803 (accessed on 27 July 2022).
- Bustaffa, E.; Minichilli, F.; Nuvolone, D.; Voller, F.; Cipriani, F.; Bianchi, F. Mortality of Populations Residing in Geothermal Areas of Tuscany during the Period 2003-2012. Ann. Ist. Super Sanita 2017, 53, 108–117. [Google Scholar] [CrossRef] [PubMed]
- Manzella, A.; Bonciani, R.; Allansdottir, A.; Botteghi, S.; Donato, A.; Giamberini, S.; Lenzi, A.; Paci, M.; Pellizzone, A.; Scrocca, D. Environmental and Social Aspects of Geothermal Energy in Italy. Geothermics 2018, 72, 232–248. [Google Scholar] [CrossRef]
- Ministero della Transizione Ecologica. Strategia Energetica Nazionale 2017. Available online: https://www.mite.gov.it/comunicati/strategia-energetica-nazionale-2017 (accessed on 27 July 2022).
- Pellizzone, A.; Allansdottir, A.; De Franco, R.; Muttoni, G.; Manzella, A. Geothermal Energy and the Public: A Case Study on Deliberative Citizens’ Engagement in Central Italy. Energy Policy 2017, 101, 561–570. [Google Scholar] [CrossRef]
- Bianchi, F.; Bustaffa, E.; Coi, A.; Curzio, O.; Gorini, F.; Minichilli, F.; Santoro, M. La percezione del rischio. In Geotermia e Salute in Toscana; Florence, Italy, 2021; Volume 2, pp. 259–278. Available online: chrome-extension://efaidnbmnnnibpcajpcglclefindmkaj/https://www.ars.toscana.it/images/pubblicazioni/Collana_ARS/2021/Geotermia_e_salute/Volume_2.pdf (accessed on 27 July 2022).
- Nuvolone, D.; Stoppa, G.; Petri, D.; Profili, F.; Bartolacci, S.; Monnini, M.; Crocetti, M.; Voller, F. Geotermia e salute in Toscana. Florence, Italy, 2021; Volume 1-3. Available online: https://www.ars.toscana.it/2-articoli/4688-geotermia-e-salute-in-toscana-rapporto-2021.html (accessed on 27 July 2022).
- Bena, A.; Gandini, M.; Cadum, E.; Procopio, E.; Salamina, G.; Orengia, M.; Farina, E. Risk Perception in the Population Living near the Turin Municipal Solid Waste Incineration Plant: Survey Results before Start-up and Communication Strategies. BMC Public Health 2019, 19, 483. [Google Scholar] [CrossRef] [PubMed]
- Bianchi, F.; Minoia, C.; Minichilli, F.; Cori, L.; Bustaffa, E.; Leoni, E.; Migliore, S.; Ronchi, A.; Turci, R. Biomonitoring Studies: Bioaccumulation of Polychlorinated Biphenyls and Heavy Metals. In Human Health in Areas with Indutrial Contamination; WHO Regional Office for Europe: Copenaghen, Denmark, 2014; Available online: https://www.euro.who.int/__data/assets/pdf_file/0006/264813/Human-Health-in-Areas-with-Industrial-Contamination-Eng.pdf (accessed on 27 July 2022).
- Coi, A.; Minichilli, F.; Bustaffa, E.; Carone, S.; Santoro, M.; Bianchi, F.; Cori, L. Risk Perception and Access to Environmental Information in Four Areas in Italy Affected by Natural or Anthropogenic Pollution. Environ. Int. 2016, 95, 8–15. [Google Scholar] [CrossRef] [PubMed]
- De Felip, E.; Bianchi, F.; Bove, C.; Cori, L.; D’Argenzio, A.; D’Orsi, G.; Fusco, M.; Miniero, R.; Ortolani, R.; Palombino, R.; et al. Priority Persistent Contaminants in People Dwelling in Critical Areas of Campania Region, Italy (SEBIOREC Biomonitoring Study). Sci. Total Environ. 2014, 487, 420–435. [Google Scholar] [CrossRef] [PubMed]
- Ruggieri, S.; Maltese, S.; Drago, G.; Panunzi, S.; Cibella, F.; Bianchi, F.; Minichilli, F.; Cori, L. Measuring Risk Perception in Pregnant Women in Heavily Polluted Areas: A New Methodological Approach from the NEHO Birth Cohort. Int. J. Environ. Res. Public Health 2021, 18, 10616. [Google Scholar] [CrossRef] [PubMed]
- Paek, H.J.; Hove, T. Risk Perceptions and Risk Characteristics; Oxford Research Encyclopedia of Communication: Oxford, UK, 2017. [Google Scholar] [CrossRef]
- Florin, M.V.; Parker, S.D. Involving Stakeholders in the Risk Governance Process; EPFL International Risk Governance Center: Lausanne, Switzerland, 2020. [Google Scholar] [CrossRef]
- Renn, O.; Rohrmann, B. Cross-Cultural Risk Perception: A Survey of Empirical Studies; Kluwer: Dordrecht, The Netherlands; London, UK, 2000. [Google Scholar]
- Kunze, C.; Hertel, M. Contested Deep Geothermal Energy in Germany—The Emergence of an Environmental Protest Movement. Environ. Res. Soc. Sci. 2017, 27, 174–180. [Google Scholar] [CrossRef]
- Covello, V.T. Risk Comparisons and Risk Communication: Issues and Problems in Comparing Health and Environmental Risks. In Communicating Risks to the Public: International Perspectives; Kasperson, R.E., Stallen, P.J.M., Eds.; Technology, Risk, and Society; Springer: Dordrecht, The Netherlands, 1991; pp. 79–124. [Google Scholar] [CrossRef]
- Rafliana, I.; Jalayer, F.; Cerase, A.; Cugliari, L.; Baiguera, M.; Salmanidou, D.; Necmioğlu, Ö.; Aguirre Ayerbei, I.; Lorito, S.; Fraser, S.; et al. Tsunami Risk Communication and Management: Contemporary Gaps and Challenges. Int. J. Disaster Risk Reduct. 2022, 70, 102771. [Google Scholar] [CrossRef]
- Slovic, P. The Perception of Risk; Earthscan Publications: London, UK; Sterling, VA, USA, 2000. [Google Scholar]
- Slovic, P.; Fischhoff, B.; Lichtenstein, S. Facts and Fears: Understanding Perceived Risk. In Societal Risk Assessment: How Safe Is Safe Enough? Schwing, R.C., Albers, W.A., Eds.; General Motors Research Laboratories; Springer: Boston, MA, USA, 1980; pp. 181–216. [Google Scholar] [CrossRef] [Green Version]
- Douglas, M.; Wildavsky, A. Risk and Culture: An Essay on the Selection of Technological and Environmental Dangers; Univ of California Press: Berkeley, CA, USA, 1983. [Google Scholar]
- Teuber, A. Justifying Risk. Dedalus Am. Acad. Arts Sci. 1990, 119, 237–251. [Google Scholar]
- Walaski, P.F. Risk and Crisis Communications: Methods and Messages; Wiley: Hoboken, NJ, USA, 2021; Available online: https://www.wiley.com/en-us/Risk+and+Crisis+Communications%3A+Methods+and+Messages-p-9780470592731 (accessed on 27 July 2022).
- Signorino, G.; Beck, E. Risk Perception Survey in Two High-Risk Areas. In Human Health in Areas with Industrial Contamination; World Health Organization: Geneva, Switzerland, 2014; pp. 232–245. [Google Scholar]
- Polizou, O.; Stamataki, S. Geothermal Energy and Local Societies—A NIMBY Syndrome Contradiction? In Proceedings of the World Geothermal Congress, Bali, Indonesia, 25–29 April 2010. [Google Scholar]
- Carr-Cornish, S.; Romanach, L. Differences in Public Perceptions of Geothermal Energy Technology in Australia. Energies 2014, 7, 1555–1575. [Google Scholar] [CrossRef] [Green Version]
- Zaunbrecher, B.; Kluge, J.; Ziefle, M. Exploring Mental Models of Geothermal Energy among Laypeople in Germany as Hidden Drivers for Acceptance. J. Sustain. Dev. Energy Water Environ. Syst. 2018, 6, 446–463. [Google Scholar] [CrossRef]
- Im, D.-H.; Chung, J.-B.; Kim, E.-S.; Moo, J.B.-W. Public Perception of Geothermal Power Plants in Korea Following the Pohang Earthquake: A Social Representation Theory Study. Public Underst Sci. 2021, 30, 724–739. [Google Scholar] [CrossRef] [PubMed]
- Galea, S.; Tracy, M. Participation Rates in Epidemiologic Studies. Ann. Epidemiol. 2007, 17, 643–653. [Google Scholar] [CrossRef] [PubMed]
- Nohr, E.A.; Frydenberg, M.; Henriksen, T.B.; Olsen, J. Does Low Participation in Cohort Studies Induce Bias? Epidemiology 2007, 17, 413–418. [Google Scholar] [CrossRef] [PubMed]
- Aven, T.; Renn, O. Some Foundational Issues Related to Risk Governance and Different Types of Risks. J. Risk Res. 2020, 23, 1121–1134. [Google Scholar] [CrossRef]

| Question Number | Question * | Answer Options for Each Sub Question | Index Defined |
|---|---|---|---|
| 12.1 | You are faced with a list of different hazards. To what extent do you personally feel exposed to each of them? b. Noise c. Bad smells g. Air pollution j. Water pollution k. Hazardous industries l. Earthquake m. Food contamination | 0. Not at all 1. A little 2. Moderately 3. Very 4. Extremely | Exposure Hazard Perception Index-EHPI |
| 12.2 ** | Among the hazards listed above, which do you think are present in the area you live? b. Noise c. Bad smells g. Air pollution j. Water pollution k. Hazardous industries l. Earthquake m. Food contamination | 0. Present 1. Not present | Hazard Perception Index-HPI |
| 12.5 *** | How do you judge the environmental situation in your residence municipality? | 1. Excellent 2. Acceptable 3. Serious but reversible 4. Serious and irreversible | |
| 12.9 | In your opinion, how likely it is, in your residence area to fill ill due to a. Allergies; b. Acute respiratory diseases; c. Chronic respiratory diseases; d. Cardiovascular diseases; e. Infertility; f. Various form of cancer; g. Leukemia; h. Congenital Malformations | 0. Not at all 1. Unlikely 2. Medium probability 3. Very likely 4. Sure | Health Risk Perception Index-HRPI |
| 12.1 12.2 12.9 | These questions were used to calculate the Risk Perception Index (RPI), an overall indicator of environmental and health risk perception. | ||
| General Characteristics | Classification | N | % |
|---|---|---|---|
| Total subjects | 2029 | 100.0 | |
| Subjects’ origin | Municipal registries | 1027 | 50.6 |
| Volunteers | 978 | 48.2 | |
| ENEL workers | 24 | 1.2 | |
| Sex | Men | 885 | 43.6 |
| Women | 1144 | 56.4 | |
| Age in quartiles (years) Average = 49.3; SD = 13.7 years) | 18–39 | 508 | 25.0 |
| 40–50 | 507 | 25.0 | |
| 51–59 | 507 | 25.0 | |
| 60–77 | 507 | 25.0 | |
| Residence municipality | Main Area | ||
| Abbadia San Salvatore | 465 | 22.9 | |
| Arcidosso | 299 | 14.7 | |
| Castel del Piano | 172 | 8.5 | |
| Castell’Azzara | 104 | 5.1 | |
| Piancastagnaio | 492 | 24.2 | |
| Santa Fiora | 243 | 12.0 | |
| Control Area | |||
| Castiglione d’Orcia | 73 | 3.6 | |
| Cinigiano | 84 | 4.1 | |
| Radicofani | 44 | 2.2 | |
| Seggiano | 41 | 2.0 | |
| Others | 12 | 0.7 | |
| Marital status | Unmarried/Maiden | 645 | 31.8 |
| Married | 1204 | 59.3 | |
| Divorced | 70 | 3.4 | |
| Separated | 51 | 2.5 | |
| Widowed | 56 | 2.8 | |
| Other | 3 | 0.1 | |
| Educational qualification | Primary school license | 75 | 3.7 |
| Middle school license/Professional start-up | 549 | 27.1 | |
| High school diploma | 1000 | 49.3 | |
| Degree/University diploma | 381 | 18.8 | |
| Specialization/Master | 19 | 0.9 | |
| Other | 5 | 0.2 | |
| Occupation | Employee | 83 | 4.1 |
| Housewife | 82 | 4.0 | |
| Autonomous | 10 | 0.5 | |
| Chief worker | 162 | 8.0 | |
| Farmer/Breeder | 24 | 1.2 | |
| Senior Executive/Supervisor/High school teacher | 72 | 3.5 | |
| Manager | 38 | 1.9 | |
| Executive Employee | 306 | 15.1 | |
| Entrepreneur | 95 | 4.7 | |
| Agricultural worker | 12 | 0.6 | |
| Self-employed worker | 213 | 10.5 | |
| Freelance | 125 | 6.2 | |
| Generic worker | 355 | 17.5 | |
| Student | 74 | 3.6 | |
| Technician/Employee | 284 | 14.0 | |
| Other | 94 | 4.6 | |
| Indices | N | Mean | SD | Minimum | 25p | 50p | 75p | 90p | Maximum |
|---|---|---|---|---|---|---|---|---|---|
| HPI | 1868 | 0.40 | 0.28 | 0.00 | 0.14 | 0.43 | 0.57 | 0.71 | 1.00 |
| EHPI | 1868 | 0.39 | 0.20 | 0.00 | 0.25 | 0.39 | 0.54 | 0.68 | 0.93 |
| HRPI * | 1806 | 0.45 | 0.17 | 0.00 | 0.34 | 0.47 | 0.56 | 0.66 | 0.97 |
| RPI | 1806 | 0.41 | 0.17 | 0.00 | 0.27 | 0.42 | 0.53 | 0.64 | 0.91 |
| HPI | EHPI | HRPI | |
|---|---|---|---|
| EHPI (rho) | 0.66 | ||
| (p-value) | <0.001 | ||
| HRPI (rho) | 0.31 | 0.36 | |
| (p-value) | <0.001 | <0.001 | |
| RPI (rho) | 0.88 | 0.84 | 0.64 |
| (p-value) | <0.001 | <0.001 | <0.001 |
| Factors | N | HPI | EHPI | HRPI | RPI | ||||||||
|---|---|---|---|---|---|---|---|---|---|---|---|---|---|
| Mean | SD | p | Mean | SD | p | Mean | SD | p | Mean | SD | p | ||
| Sex | <0.001 | <0.001 | <0.001 | <0.001 | |||||||||
| Men | 778 | 0.36 | 0.27 | 0.36 | 0.19 | 0.42 | 0.16 | 0.37 | 0.17 | ||||
| Women | 1090 | 0.44 | 0.28 | 0.42 | 0.20 | 0.48 | 0.17 | 0.44 | 0.17 | ||||
| Age classes (years) | 0.007 | <0.001 | 0.041 | <0.001 | |||||||||
| 18–39 | 484 | 0.43 | 0.28 | 0.41 | 0.18 | 0.45 | 0.18 | 0.43 | 0.17 | ||||
| 40–49 | 481 | 0.42 | 0.27 | 0.41 | 0.20 | 0.46 | 0.17 | 0.43 | 0.17 | ||||
| 50–59 | 469 | 0.40 | 0.27 | 0.40 | 0.20 | 0.46 | 0.16 | 0.42 | 0.17 | ||||
| 60+ | 434 | 0.37 | 0.28 | 0.35 | 0.22 | 0.43 | 0.16 | 0.38 | 0.18 | ||||
| Education | <0.001 | 0.001 | 0.034 | <0.001 | |||||||||
| ≤Middle school license | 545 | 0.37 | 0.28 | 0.37 | 0.21 | 0.45 | 0.17 | 0.39 | 0.18 | ||||
| High school or diploma | 932 | 0.41 | 0.27 | 0.40 | 0.20 | 0.44 | 0.17 | 0.41 | 0.17 | ||||
| University or more | 389 | 0.44 | 0.27 | 0.42 | 0.19 | 0.47 | 0.16 | 0.44 | 0.16 | ||||
| Volunteer | <0.001 | <0.001 | <0.001 | <0.001 | |||||||||
| No | 923 | 0.38 | 0.28 | 0.34 | 0.19 | 0.42 | 0.17 | 0.37 | 0.16 | ||||
| Yes | 945 | 0.43 | 0.27 | 0.42 | 0.20 | 0.47 | 0.17 | 0.43 | 0.17 | ||||
| Odours Perception | <0.001 | <0.001 | <0.001 | <0.001 | |||||||||
| No | 536 | 0.35 | 0.27 | 0.34 | 0.19 | 0.42 | 0.17 | 0.37 | 0.16 | ||||
| Yes | 1332 | 0.43 | 0.27 | 0.42 | 0.20 | 0.47 | 0.17 | 0.43 | 0.17 | ||||
| Exposure Area | <0.001 | <0.001 | <0.001 | <0.001 | |||||||||
| Control Area * | 423 | 0.36 | 0.30 | 0.35 | 0.19 | 0.41 | 0.17 | 0.36 | 0.18 | ||||
| Main Area ** | 1445 | 0.42 | 0.27 | 0.41 | 0.20 | 0.46 | 0.17 | 0.43 | 0.17 | ||||
| Residence Municipality | <0.001 | <0.001 | <0.001 | <0.001 | |||||||||
| Main Area | |||||||||||||
| Abbadia San Salvatore | 455 | 0.42 | 0.26 | 0.43 | 0.20 | 0.48 | 0.15 | 0.44 | 0.16 | ||||
| Arcidosso | 284 | 0.44 | 0.27 | 0.42 | 0.20 | 0.45 | 0.17 | 0.43 | 0.17 | ||||
| Castel del Piano | 167 | 0.40 | 0.27 | 0.41 | 0.19 | 0.48 | 0.17 | 0.43 | 0.17 | ||||
| Castell’Azzara | 100 | 0.27 | 0.22 | 0.30 | 0.19 | 0.40 | 0.16 | 0.32 | 0.15 | ||||
| Piancastagnaio | 439 | 0.44 | 0.27 | 0.41 | 0.20 | 0.46 | 0.17 | 0.43 | 0.18 | ||||
| Santa Fiora | 225 | 0.40 | 0.25 | 0.38 | 0.18 | 0.42 | 0.17 | 0.40 | 0.16 | ||||
| Control Area | |||||||||||||
| Castiglione d’Orcia | 65 | 0.20 | 0.29 | 0.30 | 0.18 | 0.40 | 0.19 | 0.30 | 0.17 | ||||
| Cinigiano | 50 | 0.30 | 0.27 | 0.29 | 0.21 | 0.40 | 0.14 | 0.33 | 0.18 | ||||
| Radicofani | 43 | 0.36 | 0.42 | 0.27 | 0.21 | 0.42 | 0.14 | 0.30 | 0.21 | ||||
| Seggiano | 30 | 0.48 | 0.31 | 0.39 | 0.22 | 0.43 | 0.17 | 0.43 | 0.20 | ||||
| Occupational exposure to dusts, chemicals, pesticides, gas or radiation | 0.003 | 0.052 | 0.387 | 0.005 | |||||||||
| No | 1110 | 0.42 | 0.28 | 0.40 | 0.20 | 0.45 | 0.17 | 0.42 | 0.17 | ||||
| Yes | 753 | 0.38 | 0.27 | 0.38 | 0.20 | 0.45 | 0.17 | 0.40 | 0.17 | ||||
| Ranking Position | HPI | EHPI | HRPI | RPI |
|---|---|---|---|---|
| 1st | Seggiano (C) | Abbadia San Salvatore (M) | Abbadia San Salvatore (M) | Abbadia San Salvatore (M) |
| 2nd | Arcidosso (M) Piancastagnaio (M) | Arcidosso (MA) | Castel del Piano (M) | Arcidosso (M) Castel del Piano (M) Piancastagnaio (M) Seggiano (CA) |
| 3rd | Abbadia San Salvatore (MA) | Castel del Piano (M) Piancastagnaio (M) | Piancastagnaio (M) | Santa Fiora (M) |
| 4th | Castel del Piano (M) Santa Fiora (M) | Seggiano (C) | Arcidosso (M) | Cingiano (C) |
| 5th | Radicofani (C) | Santa Fiora (M) | Seggiano (C) | Castell’Azzara (M) |
| 6th | Cinigiano (C) | Castell’Azzara (M) Castiglione d’Orcia (C) | Radicofani (C) Santa Fiora (M) | Castiglione d’Orcia (C) Radicofani (C) |
| 7th | Castell’Azzara (M) | Cinigiano (C) | Castell’Azzara (M) Castiglione d’Orcia (C) Cingiano (C) | |
| 8th | Castiglione d’Orcia (C) | Radicofani (C) |
| Environmental Situation | N | HPI | EHPI | HRPI | RPI | ||||
|---|---|---|---|---|---|---|---|---|---|
| Mean | SD | Mean | SD | Mean | SD | Mean | SD | ||
| Excellent | 125 (6.71%) | 0.19 | 0.22 | 0.24 | 0.19 | 0.36 | 0.16 | 0.26 | 0.14 |
| Acceptable | 1057 (56.77%) | 0.35 | 0.26 | 0.35 | 0.18 | 0.41 | 0.16 | 0.37 | 0.16 |
| Serious but reversible | 602 (32.33%) | 0.52 | 0.26 | 0.49 | 0.18 | 0.53 | 0.15 | 0.51 | 0.15 |
| Serious and irreversible | 78 (4.19%) | 0.58 | 0.23 | 0.54 | 0.18 | 0.55 | 0.18 | 0.56 | 0.15 |
| p-value | <0.001 | <0.001 | <0.001 | <0.001 | |||||
| Factors | Environmental Situation—n (%) | ||||||
|---|---|---|---|---|---|---|---|
| Excellent | Acceptable | Serious but Reversible | Serious and Irreversible | Total | p-Value | ||
| Sex (a) | Men | 82 (10.59) | 447 (57.75) | 220 (28.42) | 25 (3.23) | 774 (100) | <0.001 |
| Women | 43 (3.95) | 610 (56.07) | 382 (35.11) | 53 (4.87) | 1088 (100) | ||
| Total | 125 (6.71) | 1057 (56.77) | 602 (32.33) | 78 (4.19) | 1862 (100) | ||
| Age classes (years) (b) | 18–39 | 27 (5.58) | 276 (57.02) | 168 (34.71) | 13 (2.69) | 484 (100) | 0.077 |
| 40–50 | 24 (5.01) | 273 (56.99) | 163 (34.03) | 19 (3.97) | 479 (100) | ||
| 51–59 | 37 (7.92) | 257 (55.03) | 151 (32.33) | 22 (4.71) | 467 (100) | ||
| 60–77 | 37 (8.56) | 251 (58.10) | 120 (27.78) | 24 (5.56) | 432 (100) | ||
| Volunteer (c) | No | 67 (7.30) | 584 (63.62) | 234 (25.49) | 33 (3.59) | 918 (100) | <0.001 |
| Yes | 58 (6.14) | 473 (50.11) | 368 (38.98) | 45 (4.77) | 944 (100) | ||
| Main/Control Area (d) | Main | 79 (5.49) | 770 (53.47) | 529 (36.74) | 62 (4.31) | 1440 (100) | <0.001 |
| Control | 46 (10.90) | 287 (68.01) | 73 (17.30) | 16 (3.79) | 422 (100) | ||
| Main area (e) | Abbadia San Salvatore | 17 (3.75) | 228 (50.33) | 184 (40.62) | 24 (5.30) | 453 (100) | <0.001 |
| Arcidosso | 14 (4.93) | 126 (44.37) | 132 (46.48) | 12 (4.23) | 284 (100) | ||
| Castel del Piano | 15 (9.04) | 86 (51.81) | 55 (33.13) | 10 (6.02) | 166 (100) | ||
| Castell’Azzara | 4 (8.00) | 40 (80.00) | 5 (10.00) | 1 (2.00) | 50 (100) | ||
| Piancastagnaio | 11 (2.52) | 261 (59.73) | 150 (34.32) | 15 (3.43) | 437 (100) | ||
| Santa Fiora | 19 (8.50) | 140 (62.50) | 55 (24.50) | 10 (4.50) | 224 (100) | ||
Publisher’s Note: MDPI stays neutral with regard to jurisdictional claims in published maps and institutional affiliations. |
© 2022 by the authors. Licensee MDPI, Basel, Switzerland. This article is an open access article distributed under the terms and conditions of the Creative Commons Attribution (CC BY) license (https://creativecommons.org/licenses/by/4.0/).
Share and Cite
Bustaffa, E.; Curzio, O.; Bianchi, F.; Minichilli, F.; Nuvolone, D.; Petri, D.; Stoppa, G.; Voller, F.; Cori, L. Community Concern about the Health Effects of Pollutants: Risk Perception in an Italian Geothermal Area. Int. J. Environ. Res. Public Health 2022, 19, 14145. https://doi.org/10.3390/ijerph192114145
Bustaffa E, Curzio O, Bianchi F, Minichilli F, Nuvolone D, Petri D, Stoppa G, Voller F, Cori L. Community Concern about the Health Effects of Pollutants: Risk Perception in an Italian Geothermal Area. International Journal of Environmental Research and Public Health. 2022; 19(21):14145. https://doi.org/10.3390/ijerph192114145
Chicago/Turabian StyleBustaffa, Elisa, Olivia Curzio, Fabrizio Bianchi, Fabrizio Minichilli, Daniela Nuvolone, Davide Petri, Giorgia Stoppa, Fabio Voller, and Liliana Cori. 2022. "Community Concern about the Health Effects of Pollutants: Risk Perception in an Italian Geothermal Area" International Journal of Environmental Research and Public Health 19, no. 21: 14145. https://doi.org/10.3390/ijerph192114145