
Determining Association between Lung Cancer Mortality Worldwide and Risk Factors Using Fuzzy Inference Modeling and Random Forest Modeling

Abstract
:1. Introduction
2. Materials and Methods
2.1. Data
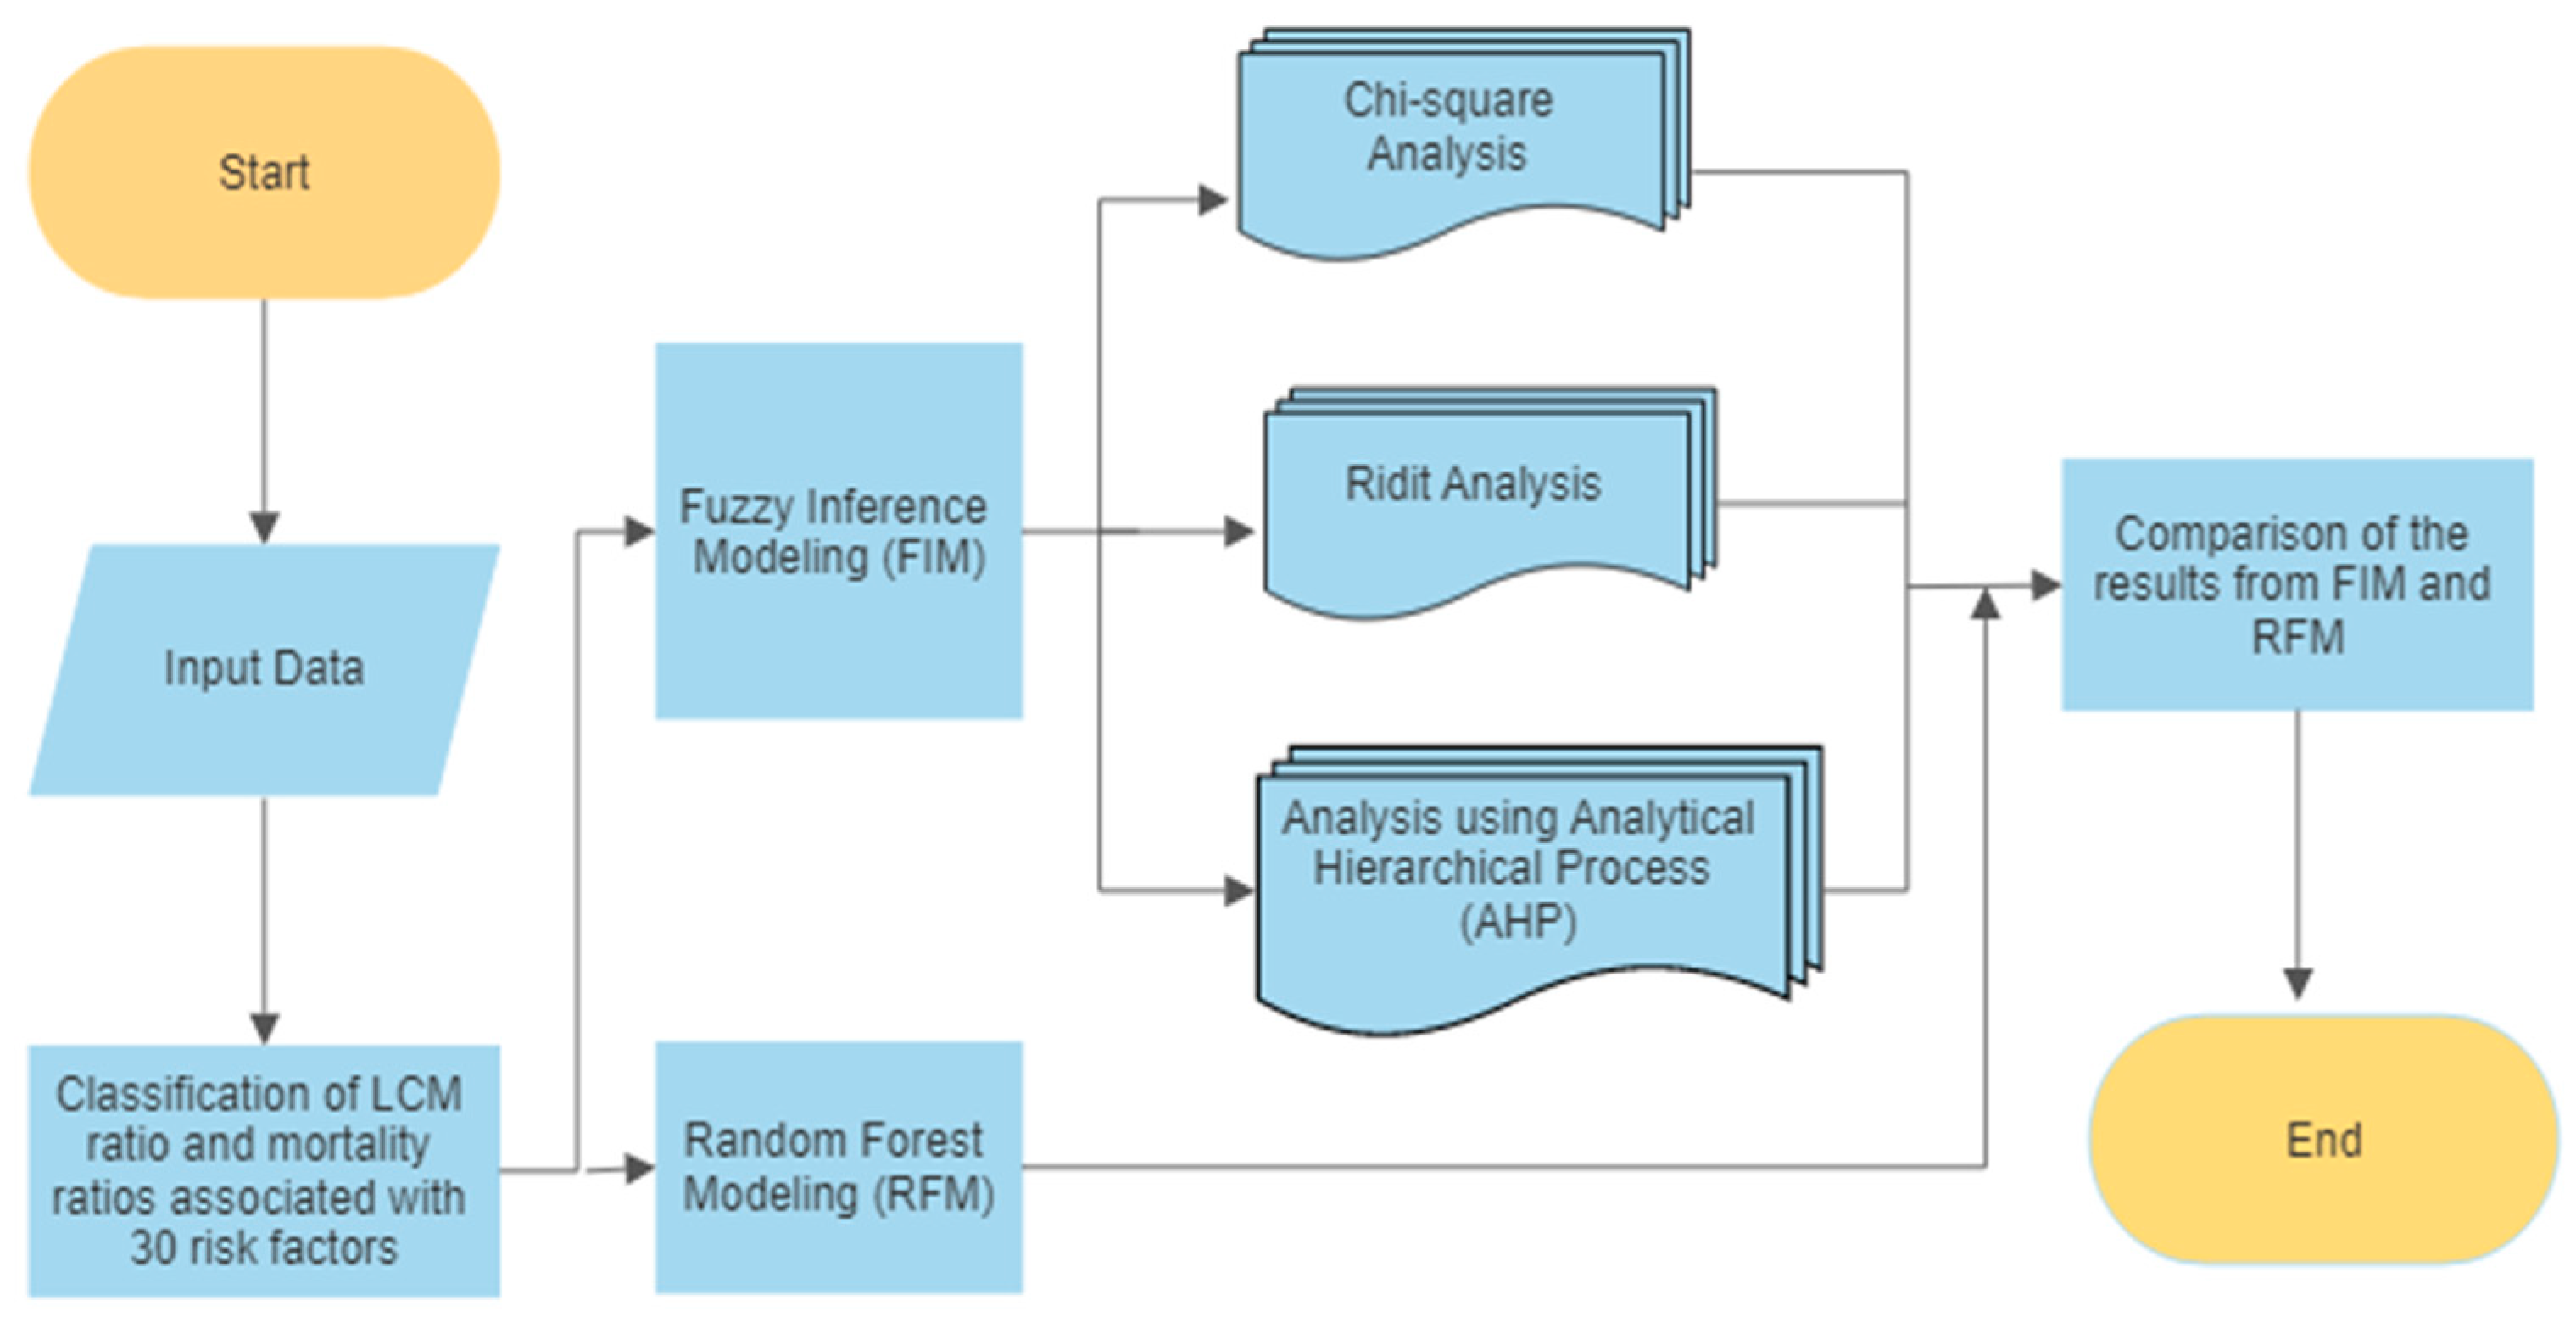
2.2. Analysis Procedure
2.3. Fuzzy Inference Methods
3. Results
3.1. Fuzzy Inference Modeling
3.1.1. Chi-Square Analysis
3.1.2. RIDIT Analysis
3.1.3. AHP Analysis
3.1.4. Overall Results of Fuzzy Inference Modeling
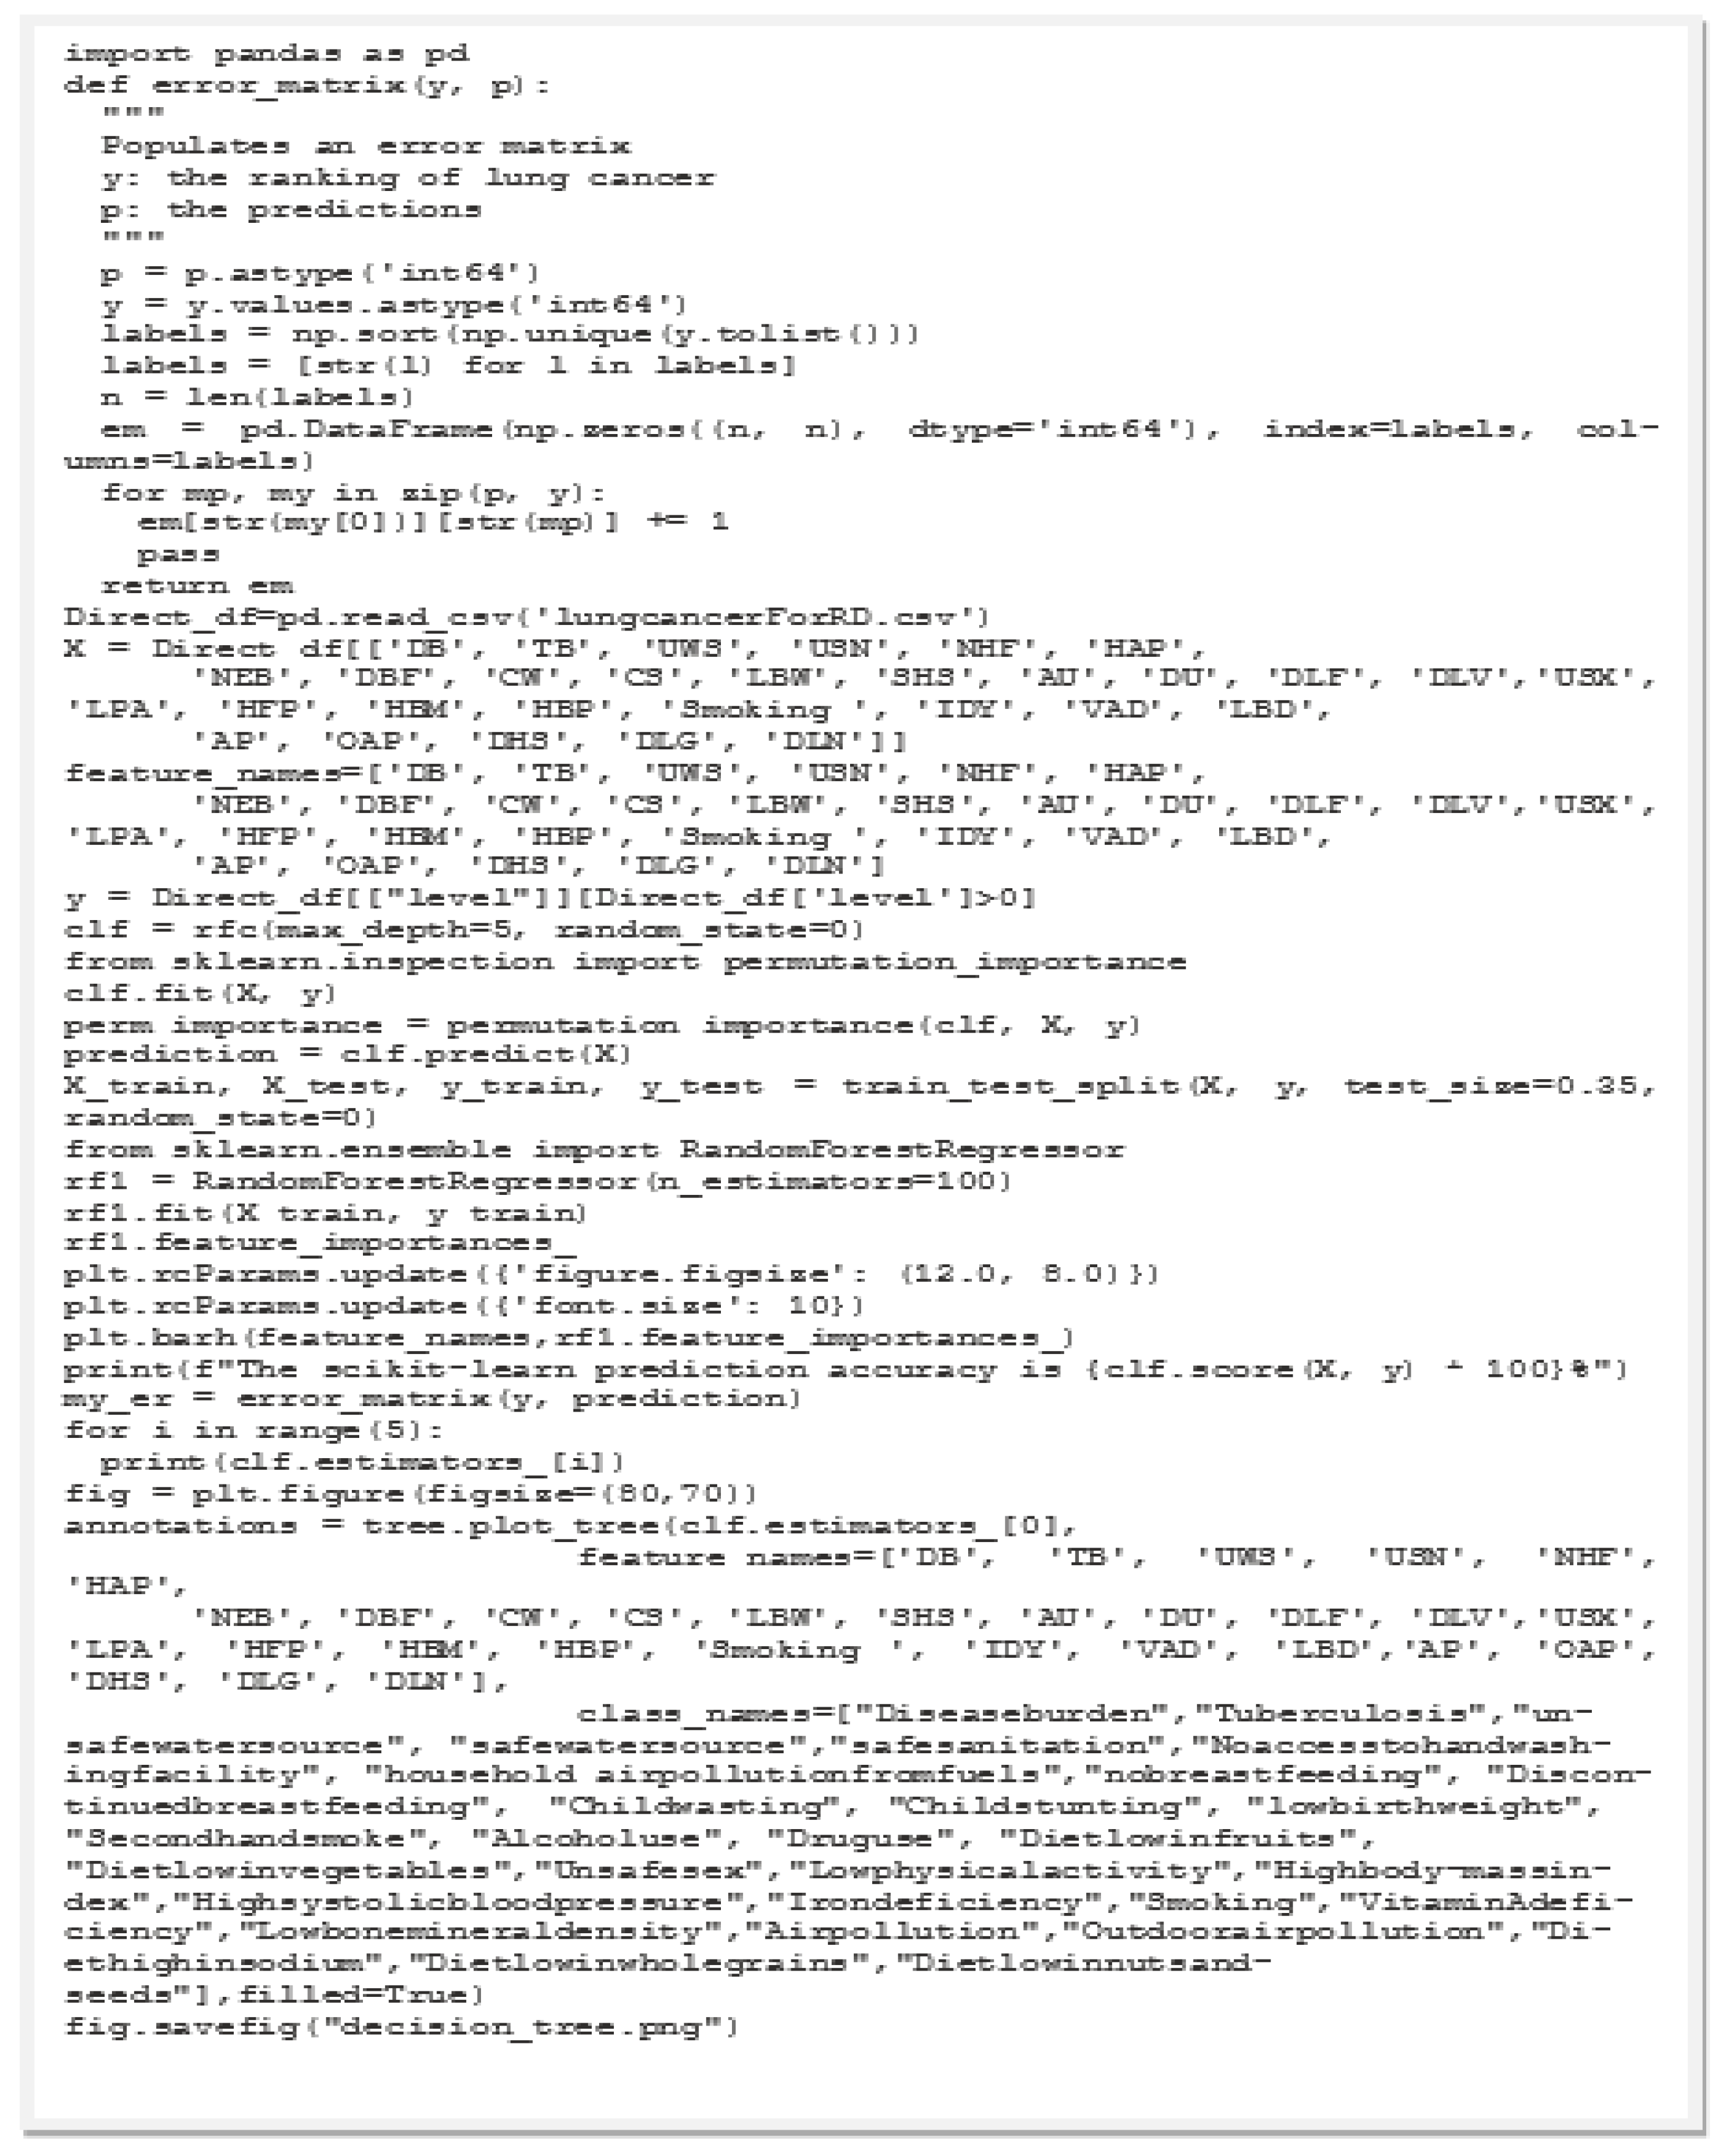
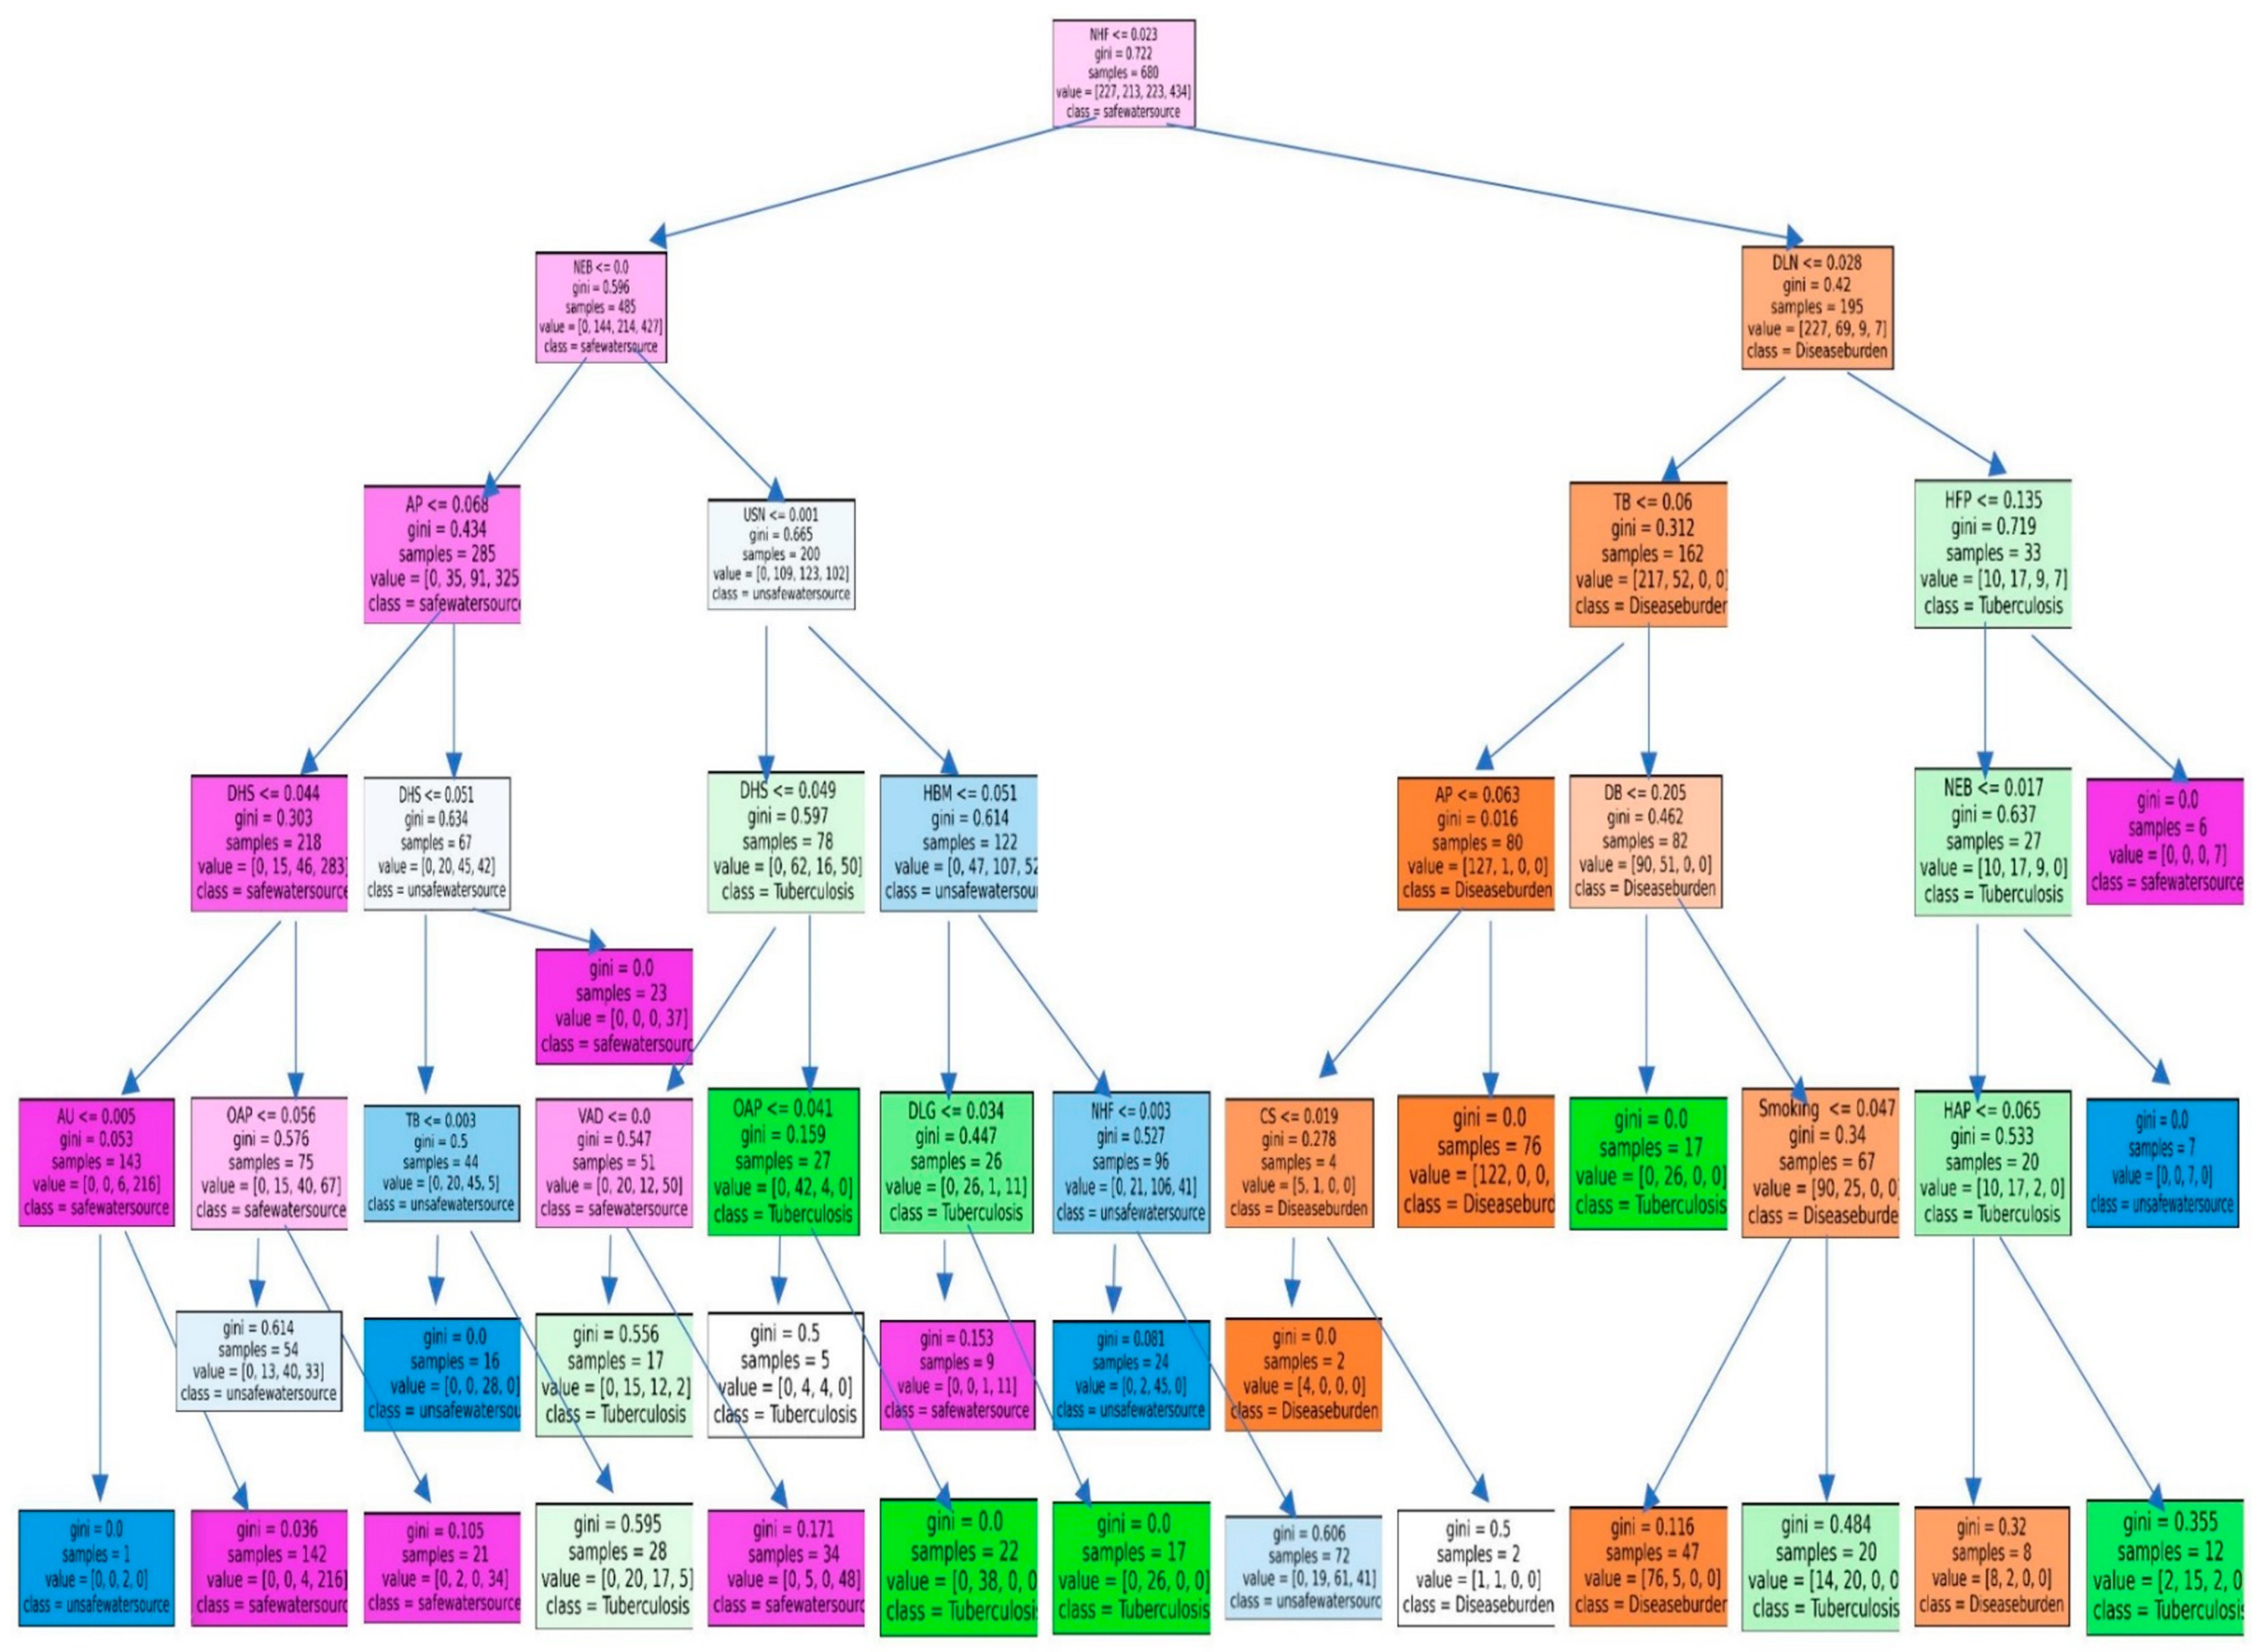
3.2. Results of the RFM
4. Discussion
5. Conclusions
Author Contributions
Funding
Institutional Review Board Statement
Informed Consent Statement
Data Availability Statement
Acknowledgments
Conflicts of Interest
References
- White, V.; Ruparelia, P. Chapter 28—Respiratory disease. Kumar Clark’s Clin. Med. 2021, 22, 927–999. [Google Scholar] [CrossRef]
- Hernandez, J.B.R.; Kim, P.Y.; NCBI. Mortality and Morbidity; National Center for Biotechnology Information; U.S. Laboratory of Medicine: Washington, DC, USA, 2021. Available online: https://www.ncbi.nlm.nih.gov/books/NBK547668/ (accessed on 4 October 2022).
- Sung, H.; Ferlay, J.; Siegel, R.L.; Laversanne, M.; Soerjomataram, I.; Jemal, A.; Bray, F. Global Cancer Statistics 2020: GLOBOCAN Estimates of Incidence and Mortality Worldwide for 36 Cancers in 185 Countries. CA Cancer J. Clin. 2021, 71, 209–249. [Google Scholar] [CrossRef] [PubMed]
- LENNARTSSON, C.; HEIMERSON, I. Elderly people’s health: Health in Sweden: The National Public Health Report 2012. Chapter 5. Scand. J. Public Health Suppl. 2012, 9, 95–120. [Google Scholar] [CrossRef] [PubMed]
- Turner, M.C.; Andersen, Z.J.; Baccarelli, A.; Diver, W.R.; Gapstur, S.M.; Pope III, C.A.; Prada, D.; Samet, J.; Thurston, G.; Cohen, A. Outdoor air pollution and cancer: An overview of the current evidence and public health recommendations. CA Cancer J. Clin. 2020, 70, 460–479. [Google Scholar] [CrossRef] [PubMed]
- Yingxian, D.; Daojun, Z.H.U.; Guowei, C.H.E.; Lunxu, L.I.U.; Kun, Z.H.O.U.; Tao, Z.H.U.; Hongsheng, M.A. Clinical Effect of Day Surgery in Patients with Lung Cancer by Optimize Operating Process. Chin. J. Lung Cancer 2020, 23, 77–83. [Google Scholar] [CrossRef]
- Shang, Y.; Zang, A.; Li, J.; Jia, Y.; Li, X.; Zhang, L.; Huo, R.; Yang, J.; Feng, J.; Ge, K.; et al. MicroRNA-383 is a tumor suppressor and potential prognostic biomarker in human non-small cell lung cancer. Biomed. Pharmacother. 2016, 83, 1175–1181. [Google Scholar] [CrossRef]
- Ningning, D.; Yousheng, M. Advances in Lymph Node Metastasis and the Modes of Lymph Node Dissection in Early Stage Non-small Cell Lung Cancer. Chin. J. Lung Cancer 2016, 19, 359–363. [Google Scholar] [CrossRef]
- Tan, A.S.L.; Potter, J. How the Expansion of the U.S. Preventive Services Task Force Lung Cancer Screening Eligibility May Improve Health Equity Among Diverse Sexual and Gender Minority Populations. LGBT Health 2021, 8, 503–506. [Google Scholar] [CrossRef]
- Al Khayat, M.; Eijsink, J.; Postma, M.; van de Garde, E.; van Hulst, M. Cost-effectiveness of screening smokers and ex-smokers for lung cancer in the Netherlands in different age groups. Eur. J. Health Econ. 2022, 23, 1221–1227. [Google Scholar] [CrossRef]
- Williams, R.M.; Li, T.; Luta, G.; Wang, M.Q.; Adams-Campbell, L.; Meza, R.; Tammemägi, M.C.; Taylor, K.L. Lung cancer screening use and implications of varying eligibility criteria by race and ethnicity: 2019 Behavioral Risk Factor Surveillance System data. Cancer 2022, 128, 1812–1819. [Google Scholar] [CrossRef]
- Shi, J.; Yang, Y.; Xie, H.; Wang, X.; Wu, J.; Long, J.; Courtney, R.; Shu, X.; Zheng, W.; Blot, W.J.; et al. Association of oral microbiota with lung cancer risk in a low-income population in the Southeastern USA. Cancer Causes Control Int. J. Stud. Cancer Hum. Popul. 2021, 32, 1423–1432. [Google Scholar] [CrossRef] [PubMed]
- Wei, X.; Zhu, C.; Ji, M.; Fan, J.; Xie, J.; Huang, Y.; Jiang, X.; Xu, J.; Yin, R.; Du, L.; et al. Diet and Risk of Incident Lung Cancer: A Large Prospective Cohort Study in UK Biobank. Am. J. Clin. Nutr. 2021, 114, 2043–2051. [Google Scholar] [CrossRef]
- Wenwei, S.; Kwong, A.; Han, W.; Chia, Y.; Yao, W. Improved trends of lung cancer mortality-to-incidence ratios in countries with high healthcare expenditure. Thorac. Cancer 2021, 12, 1656–1661. [Google Scholar] [CrossRef]
- Cheng, B.; Wang, C.; Zou, B.; Huang, D.; Yu, J.; Cheng, Y.; Meng, X. A nomogram to predict outcomes of lung cancer patients after pneumonectomy based on 47 indicators. Cancer Med. 2020, 9, 1430–1440. [Google Scholar] [CrossRef] [PubMed] [Green Version]
- Felip, E. El cáncer de pulmón en mujeres. Arbor Cienc. Pensam. Y Cult. 2015, 191, a235. [Google Scholar] [CrossRef] [Green Version]
- Timmermann, C. A History of Lung Cancer: The Recalcitrant Disease. Stud. Hist. Philos. Biol. Biomed. Sci. 2014, 48, 122–125. [Google Scholar]
- Jussawalla, D.; Jain, D. Lung cancer in Greater Bombay: Correlations with religion and smoking habits. Br. J. Cancer 1979, 40, 437–448. [Google Scholar] [CrossRef] [Green Version]
- Du, S.; Wang, X.; Feng, C.C.; Zhang, X. Classifying natural-language spatial relation terms with random forest algorithm. Int. J. Geogr. Inf. Sci. 2017, 31, 542–568. [Google Scholar] [CrossRef]
- Kaur, H.; Singh, G.; Minhas, J. A review of machine learning based anomaly detection techniques. arXiv 2013, arXiv:1307.7286. [Google Scholar] [CrossRef]
- Fernando, T.; Gammulle, H.; Denman, S.; Sridharan, S.; Fookes, C. Deep Learning for Medical Anomaly Detection—A Survey. ACM Comput. Surv. 2021, 54, 1–37. [Google Scholar] [CrossRef]
- Shi, B.; Chen, N.; Wang, J. A credit rating model of microfinance based on fuzzy cluster analysis and fuzzy pattern recognition: Empirical evidence from Chinese 2157 small private businesses. J. Intell. Fuzzy Syst. 2016, 31, 3095–3102. [Google Scholar] [CrossRef]
- Panchal, J.; Majumdar, B.B.; Ram, V.V.; Basu, D. Analysis of user perception towards a key set of attributes related to Bicycle-Metro integration: A case study of Hyderabad, India. Transp. Res. Procedia 2020, 48, 3532–3544. [Google Scholar] [CrossRef]
- Bross, I.D.J. How to use RIDIT analysis. Biometrics 1958, 14, 18–38. [Google Scholar] [CrossRef]
- Bojian, Z.; Hong, Z. The Application of Fuzzy Mathematics in the Chronic diseases Research. Dis. Surveill. 1989, 4, 38–41. [Google Scholar] [CrossRef]
- Hayashi, I. Smoking: Health Effects, Psychological Aspects and Cessation; Nova Science Publishers, Inc.: Hauppauge, NY, USA, 2012. [Google Scholar]
- Slovic, P. Smoking: Risk, Perception & Policy; Sage Publications: New York, NY, USA, 2001. [Google Scholar]
- Barnett, J.R.; Moon, G.; Pearce, J.; Thompson, L.; Twigg, L. Smoking Geographies: Space, Place and Tobacco; Wiley Blackwell: New York, NY, USA, 2017. [Google Scholar]
- Rogers, T.J.; Criner, G.J.; Cornwell, W.D. Smoking and Lung Inflammation: Basic, Pre-Clinical and Clinical Research Advances; Springer: Berlin/Heidelberg, Germany, 2013. [Google Scholar]
- Putrik, P.; Otavova, M.; Faes, C.; Devleesschauwer, B. Variation in smoking attributable all-cause mortality across municipalities in Belgium, 2018: Application of a Bayesian approach for small area estimations. BMC Public Health 2022, 22, 1699. [Google Scholar] [CrossRef] [PubMed]
- Fox, K.R.; Hardy, R.Y.; Moons, P.; Kovacs, A.H.; Luyckx, K.; Apers, S.; Cook, S.C.; Veldtman, G.; Fernandes, S.M.; White, K.; et al. Smoking among adult congenital heart disease survivors in the United States: Prevalence and relationship with illness perceptions. J. Behav. Med. 2021, 44, 772–783. [Google Scholar] [CrossRef]
- Cope, G.F. Smoking: What All Healthcare Professionals Need to Know; M & K Publishing: Stuart, FL, USA, 2016. [Google Scholar]
- Spathis, D.; Vlamos, P. Diagnosing asthma and chronic obstructive pulmonary disease with machine learning. Health Inform. J. 2019, 25, 811–827. [Google Scholar] [CrossRef] [Green Version]
- Melnykova, N.; Kulievych, R.; Vycluk, Y.; Melnykova, K.; Melnykov, V. Anomalies Detecting in Medical Metrics Using Machine Learning Tools. Procedia Comput. Sci. 2022, 198, 718–723. [Google Scholar] [CrossRef]
- Pedrycz, W. Fuzzy Modelling: Paradigms and Practice; Springer: Manhattan, NY, USA, 1996. [Google Scholar]
- Lewandowska, A.M.; Rudzki, M.; Rudzki, S.; Lewandowski, T.; Laskowska, B. Environmental risk factors for cancer-review paper. Ann. Agric. Environ. Med. 2019, 26, 1–7. [Google Scholar] [CrossRef]
- Gourd, E. New evidence that air pollution contributes substantially to lung cancer. Lancet Oncol. 2022, 23, e448. [Google Scholar] [CrossRef]
- Hermans, K.E.P.E.; van den Brandt, P.A.; Loef, C.; Jansen, R.L.H.; Schouten, L.J. Adherence to the World Cancer Research Fund and the American Institute for Cancer Research lifestyle recommendations for cancer prevention and Cancer of Unknown Primary risk. Clin. Nutr. 2022, 41, 526–535. [Google Scholar] [CrossRef] [PubMed]
- Romaguera, D.; Vergnaud, A.-C.; Peeters, P.H.; Van Gils, C.H.; Chan, D.S.; Ferrari, P.; Romieu, I.; Jenab, M.; Slimani, N.; Clavel-Chapelon, F.; et al. Is concordance with World Cancer Research Fund/American Institute for Cancer Research guidelines for cancer prevention related to subsequent risk of cancer? Results from the EPIC study. Am. J. Clin. Nutr. 2012, 96, 150–163. [Google Scholar] [CrossRef] [PubMed] [Green Version]
- Vergnaud, A.-C.; Romaguera, D.; Peelers, P.H.; Van Gils, C.H.; Chan, D.S.; Romieu, I.; Freisling, H.; Ferrari, P.; Clavel-Chapelon, F.; Fagherazzi, G.; et al. Adherence to the World Cancer Research Fund/American Institute for Cancer Research guidelines and risk of death in Europe: Results from the European Prospective Investigation into Nutrition and Cancer cohort study. Am. J. Clin. Nutr. 2013, 97, 1107–1120. [Google Scholar] [CrossRef] [PubMed] [Green Version]
- Shams-White, M.M.; Brockton, N.T.; Mitrou, P.; Romaguera, D.; Brown, S.; Bender, A.; Kahle, L.L.; Reedy, J. Operationalizing the 2018 world cancer research fund/american institute for cancer research (WCRF/AICR) cancer prevention recommendations: A standardized scoring system. Nutrients 2019, 11, 1572. [Google Scholar] [CrossRef] [PubMed] [Green Version]
- Park, J.W.; Dobs, A.S.; Ho, K.S.; Palella, F.J.; Seaberg, E.C.; Weiss, R.E.; Detels, R. Characteristics and Longitudinal Patterns of Erectile Dysfunction Drug Use Among Men Who Have Sex with Men in the U.S. Arch. Sex. Behav. 2021, 50, 2887–2896. [Google Scholar] [CrossRef]
- Sirera, G.; Videla, S.; Saludes, V.; Castellà, E.; Sanz, C.; Ariza, A.; Clotet, B.; Martró, E. Prevalence of HPV-DNA and E6 mRNA in lung cancer of HIV-infected patients. Sci. Rep. 2022, 12, 13196. [Google Scholar] [CrossRef]
- Kim, C.H.; Lee, Y.C.A.; Hung, R.J.; McNallan, S.R.; Cote, M.L.; Lim, W.Y.; Chang, S.-C.; Kim, J.H.; Ugolini, D.; Chen, Y.; et al. Exposure to secondhand tobacco smoke and lung cancer by histological type: A pooled analysis of the International Lung Cancer Consortium (ILCCO). Int. J. Cancer 2014, 135, 1918–1930. [Google Scholar] [CrossRef] [Green Version]
- Khalil, A.A.; E Ibrahim, F.; Abbass, M.Y.; Haggag, N.; Mahrous, Y.; Sedik, A.; Elsherbeeny, Z.; Khalaf, A.A.M.; Rihan, M.; El, S.W.; et al. Efficient anomaly detection from medical signals and images with convolutional neural networks for Internet of medical things (IoMT) systems. Int. J. Numer. Methods Biomed. Eng. 2022, 38, e3530. [Google Scholar] [CrossRef]


| NO. | Variable Name | Acronym | Description |
|---|---|---|---|
| 1 | Disease burden | DB | Mortality rate from disease burden |
| 2 | Tuberculosis | TB | Mortality rate from Tuberculosis |
| 3 | Unsafe water source | UWS | Mortality rate from unsafe water source |
| 4 | Unsafe sanitation | USN | Mortality rate from unsafe sanitation |
| 5 | No access to handwashing facility | NHF | Mortality rate from no access to handwashing facility |
| 6 | Household air pollution from solid fuels | HAP | Mortality rate from household air pollution from solid fuel |
| 7 | Non-exclusive breastfeeding | NEB | Mortality rate from non-exclusive breastfeeding |
| 8 | Discontinued breastfeeding | DBF | Mortality rate from discontinued breastfeeding |
| 9 | Child wasting | CW | Mortality rate from child wasting |
| 10 | Child stunting | CS | Mortality rate from child stunting |
| 11 | Low birth weight due to short gestation | LBW | Mortality rate from low birth weight due to short gestation |
| 12 | Secondhand smoke | SHS | Mortality rate from secondhand smoke |
| 13 | Alcohol use | AU | Mortality rate from alcohol use |
| 14 | Drug use | DU | Mortality rate from drug use |
| 15 | Diet low in fruits | DLF | Mortality rate from diet low in fruits |
| 16 | Diet low in vegetables | DLV | Mortality rate from diet low in vegetable |
| 17 | Unsafe sex | USX | Mortality rate from unsafe sex of a country |
| 18 | Low physical activity | LPA | Mortality rate from low physical activity |
| 19 | High fasting plasma glucose | HFP | Mortality rate from high fasting plasma glucose |
| 20 | High body-mass index | HBM | Mortality rate from high body-mass index |
| 21 | High systolic blood pressure | HBP | Mortality rate from high systolic blood pressure |
| 22 | Iron deficiency | IDY | Mortality rate from iron deficiency |
| 23 | Smoking | Mortality rate from smoking | |
| 24 | Vitamin A deficiency | VAD | Mortality rate from Vitamin A deficiency |
| 25 | Low bone mineral density | LBD | Mortality rate from low bone mineral density |
| 26 | Air pollution | AP | Mortality rate from air pollution |
| 27 | Outdoor air pollution | OAP | Mortality rate from outdoor air pollution |
| 28 | Diet high in sodium | DHS | Mortality rate from diet high in sodium |
| 29 | Diet low in whole grains | DLG | Mortality rate from diet low in whole grains |
| 30 | Diet low in nuts and seeds | DLN | Mortality rate from diet low in nuts and seeds |
| Observed Values | ||||||
| variable | very low risk | low risk | medium risk | high risk | very high risk | total rate |
| DB | 7.199 | 31.0088 | 63.8118 | 109.3561 | 169.6175 | 380.9932 |
| non-DB | 49.1659 | 109.6643 | 156.3428 | 188.1021 | 212.7317 | 716.0068 |
| total | 56.3649 | 140.6731 | 220.1546 | 297.4582 | 382.3492 | 1097 |
| Expected Values | ||||||
| variable | very low risk | low risk | medium risk | high risk | very high risk | total |
| DB | 19.5758 | 48.8564 | 76.4607 | 103.3086 | 132.7917 | 380.9932 |
| non-DB | 36.7891 | 91.8167 | 143.6939 | 194.1496 | 249.5575 | 716.0068 |
| total | 56.3649 | 140.6731 | 220.1546 | 297.4582 | 382.3492 | 1097 |
| chi-square test | <0.001 | |||||
| χ2 Values | ||||||
| variable | very low risk | low risk | medium risk | high risk | very high risk | total |
| DB | 7.8252 | 6.5199 | 2.0925 | 0.3540 | 10.2125 | 27.0041 |
| non-DB | 4.1639 | 3.4693 | 1.1134 | 0.1884 | 5.4342 | 14.3691 |
| Total | 11.9891 | 9.9891 | 3.2059 | 0.5424 | 15.6467 | 41.3733 |
| Variable | χ2 Value | χ2 Weight |
|---|---|---|
| Disease burden | 41.37 | 0.0030 |
| Tuberculosis | 516.68 | 0.0372 |
| Unsafe water source | 523.82 | 0.0377 |
| Unsafe sanitation | 533.08 | 0.0384 |
| No access to handwashing facility | 532.60 | 0.0383 |
| Household air pollution from solid fuels | 497.60 | 0.0358 |
| Non-exclusive breastfeeding | 553.70 | 0.0399 |
| Discontinued breastfeeding | 581.37 | 0.0418 |
| Child wasting | 646.50 | 0.0465 |
| Child stunting | 545.02 | 0.0392 |
| Low birth weight due to short gestation | 581.04 | 0.0418 |
| Secondhand smoke | 522.60 | 0.0376 |
| Alcohol use | 451.03 | 0.0325 |
| Drug use | 531.80 | 0.0383 |
| Diet low in fruits | 491.40 | 0.0354 |
| Diet low in vegetables | 506.60 | 0.0365 |
| Unsafe sex | 449.78 | 0.0324 |
| Low physical activity | 514.90 | 0.0371 |
| High fasting plasma glucose | 246.80 | 0.0178 |
| High body-mass index | 331.50 | 0.0239 |
| High systolic blood pressure | 160.50 | 0.0116 |
| Iron deficiency | 281.30 | 0.0202 |
| Smoking | 586.03 | 0.0422 |
| Vitamin A deficiency | 595.18 | 0.0428 |
| Low bone mineral density | 470.50 | 0.0339 |
| Air pollution | 370.06 | 0.0266 |
| Outdoor air pollution | 453.13 | 0.0326 |
| Diet high in sodium | 473.13 | 0.0341 |
| Diet low in whole grains | 429.40 | 0.0309 |
| Diet low in nuts and seeds | 475.24 | 0.0342 |
| Total | 13,893.66 | 1.0000 |
| Level | (1) Frequency | (2) Average | (3) Cumulative | (4) Sum | RIDIT Value |
|---|---|---|---|---|---|
| (2) + (3) | (4)/Total Ratio | ||||
| Very low risk | 219 | 109.5 | 0 | 109.5 | 0.0998 |
| Low risk | 221 | 110.5 | 219 | 329.5 | 0.3004 |
| Medium risk | 217 | 108.5 | 440 | 548.5 | 0.5000 |
| High risk | 221 | 110.5 | 657 | 767.5 | 0.6996 |
| very high risk | 219 | 109.5 | 878 | 987.5 | 0.9002 |
| Total ratio | 1097 |
| Variable | RIDIT Value | RIDIT Weight |
|---|---|---|
| Disease burden | 0.247 | 0.244 |
| Tuberculosis | 0.018 | 0.018 |
| Unsafe water source | 0.020 | 0.020 |
| Unsafe sanitation | 0.015 | 0.015 |
| No access to handwashing facility | 0.014 | 0.014 |
| Household air pollution from solid fuels | 0.024 | 0.024 |
| Non-exclusive breastfeeding | 0.004 | 0.004 |
| Discontinued breastfeeding | 0.001 | 0.000 |
| Child wasting | 0.028 | 0.028 |
| Child stunting | 0.006 | 0.006 |
| Low birth weight due to short gestation | 0.021 | 0.021 |
| Secondhand smoke | 0.011 | 0.011 |
| Alcohol use | 0.034 | 0.034 |
| Drug use | 0.006 | 0.006 |
| Diet low in fruits | 0.022 | 0.022 |
| Diet low in vegetables | 0.015 | 0.015 |
| Unsafe sex | 0.041 | 0.041 |
| Low physical activity | 0.014 | 0.014 |
| High fasting plasma glucose | 0.076 | 0.076 |
| High body-mass index | 0.057 | 0.057 |
| High systolic blood pressure | 0.107 | 0.106 |
| Iron deficiency | 0.072 | 0.071 |
| Smoking | 0.001 | 0.001 |
| Vitamin A deficiency | 0.007 | 0.007 |
| Low bone mineral density | 0.003 | 0.003 |
| Air pollution | 0.043 | 0.043 |
| Outdoor air pollution | 0.027 | 0.026 |
| Diet high in sodium | 0.024 | 0.024 |
| Diet low in whole grains | 0.032 | 0.032 |
| Diet low in nuts and seeds | 0.022 | 0.022 |
| Total | 1.012 | 1.000 |
| Variable | DB | TB | UWS | USN | NHF | HAP | NEB | DBF | CW | CS | LBW | SHS | AU | DU | DLF | DLV | USX | LPA | HFP | HBM | HBP | Smoking | IDY | VAD | LBD | AP | OAP | DHS | DLG | DLN |
|---|---|---|---|---|---|---|---|---|---|---|---|---|---|---|---|---|---|---|---|---|---|---|---|---|---|---|---|---|---|---|
| DB | 1.00 | 0.20 | 0.14 | 0.09 | 0.50 | 0.13 | 0.25 | 0.33 | 0.50 | 1.00 | 3.33 | 0.11 | 1.00 | 3.33 | 0.33 | 0.17 | 0.17 | 3.33 | 3.33 | 3.33 | 3.33 | 0.14 | 3.33 | 3.33 | 0.25 | 0.20 | 0.14 | 0.33 | 1.00 | 0.33 |
| TB | 5.00 | 1.00 | 0.11 | 0.10 | 0.50 | 0.25 | 1.00 | 1.00 | 2.00 | 2.00 | 3.33 | 0.13 | 1.00 | 1.00 | 2.00 | 2.00 | 2.00 | 2.00 | 2.00 | 2.00 | 2.00 | 0.20 | 2.00 | 2.00 | 0.25 | 0.20 | 0.14 | 0.33 | 0.33 | 0.33 |
| UWS | 7.00 | 9.00 | 1.00 | 8.00 | 8.00 | 8.00 | 1.00 | 1.00 | 1.00 | 1.00 | 1.00 | 0.17 | 0.50 | 0.50 | 1.00 | 1.00 | 1.00 | 1.00 | 1.00 | 1.00 | 1.00 | 0.11 | 1.00 | 1.00 | 0.25 | 0.14 | 0.10 | 0.33 | 1.00 | 0.33 |
| USN | 11.00 | 10.00 | 1.00 | 1.00 | 2.00 | 0.50 | 1.43 | 1.43 | 1.43 | 1.43 | 1.43 | 0.20 | 0.33 | 0.33 | 0.50 | 0.50 | 0.50 | 0.50 | 0.50 | 0.50 | 0.50 | 0.13 | 0.33 | 0.33 | 0.25 | 0.13 | 0.10 | 0.33 | 0.14 | 0.33 |
| NHF | 2.00 | 2.00 | 1.50 | 0.50 | 1.00 | 0.50 | 1.00 | 1.00 | 1.00 | 1.00 | 1.00 | 0.11 | 0.50 | 1.00 | 0.20 | 0.20 | 0.20 | 0.20 | 1.00 | 1.00 | 1.00 | 0.11 | 0.33 | 1.00 | 0.25 | 0.14 | 0.10 | 0.33 | 2.00 | 2.00 |
| HAP | 8.00 | 4.00 | 3.00 | 2.00 | 2.00 | 1.00 | 0.33 | 0.33 | 0.50 | 1.00 | 2.00 | 0.14 | 1.00 | 2.00 | 0.50 | 1.00 | 0.33 | 0.50 | 1.00 | 0.33 | 0.20 | 0.11 | 2.00 | 2.00 | 0.25 | 0.20 | 0.11 | 0.33 | 0.33 | 2.00 |
| NEB | 4.00 | 1.00 | 1.00 | 0.70 | 1.00 | 3.00 | 1.00 | 1.00 | 1.00 | 1.00 | 1.00 | 0.20 | 0.50 | 1.00 | 0.50 | 0.50 | 1.00 | 1.00 | 1.00 | 1.00 | 1.00 | 0.11 | 1.00 | 1.00 | 0.25 | 0.14 | 0.11 | 0.33 | 0.33 | 2.00 |
| DBF | 3.00 | 1.00 | 1.00 | 0.70 | 1.00 | 3.00 | 1.00 | 1.00 | 1.00 | 1.00 | 1.00 | 0.14 | 0.50 | 1.00 | 0.50 | 0.50 | 2.00 | 2.00 | 2.00 | 2.00 | 1.00 | 0.11 | 1.00 | 1.00 | 0.25 | 0.14 | 0.11 | 0.33 | 0.50 | 1.43 |
| CW | 2.00 | 0.50 | 1.00 | 0.70 | 1.00 | 2.00 | 1.00 | 1.00 | 1.00 | 1.00 | 1.00 | 0.14 | 0.50 | 1.00 | 0.50 | 0.50 | 0.11 | 0.20 | 0.20 | 0.33 | 1.00 | 0.11 | 1.00 | 1.00 | 0.25 | 0.14 | 0.11 | 0.33 | 0.50 | 1.43 |
| CS | 1.00 | 0.50 | 1.00 | 0.70 | 1.00 | 1.00 | 1.00 | 1.00 | 1.00 | 1.00 | 1.00 | 0.14 | 0.50 | 1.00 | 0.50 | 0.50 | 0.14 | 0.14 | 0.14 | 0.14 | 0.14 | 0.11 | 1.00 | 1.00 | 0.25 | 0.14 | 0.11 | 0.33 | 0.50 | 1.43 |
| LBW | 0.30 | 0.30 | 1.00 | 0.70 | 1.00 | 0.50 | 1.00 | 1.00 | 1.00 | 1.00 | 1.00 | 0.11 | 0.25 | 0.33 | 0.25 | 0.25 | 0.11 | 0.11 | 0.11 | 0.11 | 0.11 | 0.09 | 0.33 | 0.33 | 0.25 | 0.11 | 0.09 | 0.33 | 0.33 | 0.33 |
| SHS | 9.00 | 8.00 | 6.00 | 5.00 | 9.00 | 7.00 | 5.00 | 7.00 | 7.00 | 7.00 | 9.00 | 1.00 | 2.00 | 10.00 | 3.33 | 3.33 | 10.00 | 10.00 | 10.00 | 10.00 | 10.00 | 0.50 | 10.00 | 10.00 | 0.25 | 1.00 | 0.50 | 0.33 | 0.33 | 10.00 |
| AU | 1.00 | 1.00 | 2.00 | 3.00 | 2.00 | 1.00 | 2.00 | 2.00 | 2.00 | 2.00 | 4.00 | 0.50 | 1.00 | 1.00 | 0.50 | 0.50 | 0.14 | 0.14 | 0.14 | 0.14 | 0.14 | 0.11 | 1.00 | 1.00 | 0.25 | 0.14 | 0.11 | 0.33 | 0.50 | 1.43 |
| DU | 0.30 | 1.00 | 2.00 | 3.00 | 1.00 | 0.50 | 1.00 | 1.00 | 1.00 | 1.00 | 3.00 | 0.10 | 1.00 | 1.00 | 0.50 | 0.50 | 0.14 | 0.14 | 0.14 | 0.14 | 0.14 | 0.11 | 1.00 | 1.00 | 0.25 | 0.14 | 0.11 | 0.33 | 0.50 | 1.43 |
| DLF | 3.00 | 0.50 | 1.00 | 2.00 | 5.00 | 2.00 | 2.00 | 2.00 | 2.00 | 2.00 | 4.00 | 0.30 | 2.00 | 2.00 | 1.00 | 1.00 | 2.00 | 2.00 | 2.00 | 2.00 | 2.00 | 0.11 | 1.00 | 1.00 | 1.00 | 0.11 | 0.09 | 0.33 | 1.00 | 1.00 |
| DLV | 6.00 | 0.50 | 1.00 | 2.00 | 5.00 | 1.00 | 2.00 | 2.00 | 2.00 | 2.00 | 4.00 | 0.30 | 2.00 | 2.00 | 1.00 | 1.00 | 1.00 | 2.00 | 2.00 | 2.00 | 2.00 | 0.11 | 1.00 | 1.00 | 1.00 | 0.11 | 0.09 | 0.33 | 1.00 | 1.00 |
| USX | 6.00 | 0.50 | 1.00 | 2.00 | 5.00 | 3.00 | 1.00 | 0.50 | 9.00 | 7.00 | 9.00 | 0.10 | 7.00 | 7.00 | 0.50 | 1.00 | 1.00 | 1.00 | 1.00 | 1.00 | 1.00 | 0.09 | 0.50 | 0.50 | 0.50 | 0.09 | 0.08 | 0.33 | 1.00 | 1.00 |
| LPA | 0.30 | 0.50 | 1.00 | 2.00 | 5.00 | 2.00 | 1.00 | 0.50 | 5.00 | 7.00 | 9.00 | 0.10 | 7.00 | 7.00 | 0.50 | 0.50 | 1.00 | 1.00 | 1.00 | 1.00 | 1.00 | 0.09 | 0.50 | 0.50 | 0.50 | 0.09 | 0.08 | 0.33 | 1.00 | 1.00 |
| HFP | 0.30 | 0.50 | 1.00 | 2.00 | 1.00 | 1.00 | 1.00 | 0.50 | 5.00 | 7.00 | 9.00 | 0.10 | 7.00 | 7.00 | 0.50 | 0.50 | 1.00 | 1.00 | 1.00 | 1.00 | 1.00 | 0.09 | 0.50 | 0.50 | 0.50 | 0.09 | 0.08 | 0.33 | 1.00 | 1.00 |
| HBM | 0.30 | 0.50 | 1.00 | 2.00 | 1.00 | 3.00 | 1.00 | 0.50 | 3.00 | 7.00 | 9.00 | 0.10 | 7.00 | 7.00 | 0.50 | 0.50 | 1.00 | 1.00 | 1.00 | 1.00 | 1.00 | 0.09 | 0.50 | 0.50 | 0.50 | 0.09 | 0.08 | 0.33 | 1.00 | 1.00 |
| HBP | 0.30 | 0.50 | 1.00 | 2.00 | 1.00 | 5.00 | 1.00 | 1.00 | 1.00 | 7.00 | 9.00 | 0.10 | 7.00 | 7.00 | 0.50 | 0.50 | 1.00 | 1.00 | 1.00 | 1.00 | 1.00 | 0.09 | 0.50 | 0.50 | 0.50 | 0.09 | 0.08 | 0.33 | 1.00 | 1.00 |
| Smoking | 7.00 | 5.00 | 9.00 | 8.00 | 9.00 | 9.00 | 9.00 | 9.00 | 9.00 | 9.00 | 11.00 | 2.00 | 9.00 | 9.00 | 9.00 | 9.00 | 11.00 | 11.00 | 11.00 | 11.00 | 11.00 | 1.00 | 20.00 | 20.00 | 20.00 | 1.30 | 1.00 | 2.50 | 2.00 | 2.00 |
| IDY | 0.30 | 0.50 | 1.00 | 3.00 | 3.00 | 0.50 | 1.00 | 1.00 | 1.00 | 1.00 | 3.00 | 0.10 | 1.00 | 1.00 | 1.00 | 1.00 | 2.00 | 2.00 | 2.00 | 2.00 | 2.00 | 0.05 | 1.00 | 0.50 | 0.50 | 0.09 | 0.08 | 0.33 | 1.00 | 1.00 |
| VAD | 0.30 | 0.50 | 1.00 | 3.00 | 1.00 | 0.50 | 1.00 | 1.00 | 1.00 | 1.00 | 3.00 | 0.10 | 1.00 | 1.00 | 1.00 | 1.00 | 2.00 | 2.00 | 2.00 | 2.00 | 2.00 | 0.05 | 2.00 | 1.00 | 0.50 | 0.09 | 0.08 | 0.33 | 1.00 | 1.00 |
| LBD | 4.00 | 4.00 | 4.00 | 4.00 | 4.00 | 4.00 | 4.00 | 4.00 | 4.00 | 4.00 | 4.00 | 4.00 | 4.00 | 4.00 | 1.00 | 1.00 | 2.00 | 2.00 | 2.00 | 2.00 | 2.00 | 0.05 | 2.00 | 2.00 | 1.00 | 0.09 | 0.08 | 0.33 | 1.00 | 1.00 |
| AP | 5.00 | 5.00 | 7.00 | 8.00 | 7.00 | 5.00 | 7.00 | 7.00 | 7.00 | 7.00 | 9.00 | 1.00 | 7.00 | 7.00 | 9.00 | 9.00 | 11.00 | 11.00 | 11.00 | 11.00 | 11.00 | 0.77 | 11.00 | 11.00 | 11.00 | 1.00 | 1.00 | 20.00 | 100.00 | 100.00 |
| OAP | 7.00 | 7.00 | 10.00 | 10.00 | 10.00 | 9.00 | 9.00 | 9.00 | 9.00 | 9.00 | 11.00 | 2.00 | 9.00 | 9.00 | 11.00 | 11.00 | 13.00 | 13.00 | 13.00 | 13.00 | 13.00 | 1.00 | 13.00 | 13.00 | 13.00 | 1.00 | 1.00 | 20.00 | 100.00 | 100.00 |
| DHS | 3.00 | 3.00 | 3.00 | 3.00 | 3.00 | 3.00 | 3.00 | 3.00 | 3.00 | 3.00 | 3.00 | 3.00 | 3.00 | 3.00 | 3.00 | 3.00 | 3.00 | 3.00 | 3.00 | 3.00 | 3.00 | 0.40 | 3.00 | 3.00 | 3.00 | 0.05 | 0.05 | 1.00 | 1.11 | 1.11 |
| DLG | 1.00 | 3.00 | 1.00 | 7.00 | 0.50 | 3.00 | 3.00 | 2.00 | 2.00 | 2.00 | 3.00 | 3.00 | 2.00 | 2.00 | 1.00 | 1.00 | 1.00 | 1.00 | 1.00 | 1.00 | 1.00 | 0.50 | 1.00 | 1.00 | 1.00 | 0.01 | 0.01 | 0.90 | 1.00 | 1.00 |
| DLN | 3.00 | 3.00 | 3.00 | 3.00 | 0.50 | 0.50 | 0.50 | 0.70 | 0.70 | 0.70 | 3.00 | 0.10 | 0.70 | 0.70 | 1.00 | 1.00 | 1.00 | 1.00 | 1.00 | 1.00 | 1.00 | 0.50 | 1.00 | 1.00 | 1.00 | 0.01 | 0.01 | 0.90 | 1.00 | 1.00 |
| Sum | 101.40 | 74.00 | 67.75 | 89.19 | 92.00 | 79.88 | 64.51 | 63.80 | 85.13 | 98.13 | 136.10 | 19.60 | 86.28 | 100.20 | 52.62 | 53.45 | 71.85 | 76.27 | 77.57 | 77.04 | 76.57 | 7.06 | 83.83 | 83.00 | 59.00 | 7.30 | 5.82 | 53.30 | 223.42 | 239.92 |
| Variables | Priority Vector | Weights |
|---|---|---|
| Disease burden | 0.0159 | 0.0159 |
| Tuberculosis | 0.0184 | 0.0184 |
| Unsafe water source | 0.0253 | 0.0253 |
| Unsafe sanitation | 0.0175 | 0.0175 |
| No access to handwashing facility | 0.0107 | 0.0107 |
| Household air pollution from solid fuels | 0.0168 | 0.0168 |
| Non-exclusive breastfeeding | 0.0131 | 0.0131 |
| Discontinued breastfeeding | 0.0144 | 0.0144 |
| Child wasting | 0.0103 | 0.0103 |
| Child stunting | 0.0090 | 0.0090 |
| Low birth weight due to short gestation | 0.0067 | 0.0067 |
| Secondhand smoke | 0.0827 | 0.0827 |
| Alcohol use | 0.0143 | 0.0143 |
| Drug use | 0.0108 | 0.0108 |
| Diet low in fruits | 0.0206 | 0.0206 |
| Diet low in vegetables | 0.0207 | 0.0207 |
| Unsafe sex | 0.0262 | 0.0262 |
| Low physical activity | 0.0220 | 0.0220 |
| High fasting plasma glucose | 0.0202 | 0.0202 |
| High body-mass index | 0.0202 | 0.0202 |
| High systolic blood pressure | 0.0205 | 0.0205 |
| Iron deficiency | 0.1288 | 0.1288 |
| Smoking | 0.0148 | 0.0148 |
| Vitamin A deficiency | 0.0146 | 0.0146 |
| Low bone mineral density | 0.0368 | 0.0368 |
| Air pollution | 0.1420 | 0.1420 |
| Outdoor air pollution | 0.1665 | 0.1665 |
| Diet high in sodium | 0.0384 | 0.0384 |
| Diet low in whole grains | 0.0257 | 0.0257 |
| Diet low in nuts and seeds | 0.0160 | 0.0160 |
| Method | Original Weights C | C11 | C12 | C13 | C14 | C15 | Fuzzy Inference | Lattice Degree of Nearness |
|---|---|---|---|---|---|---|---|---|
| 2.92% | 7.18% | 15.41% | 30.66% | 43.83% | σ | |||
| Chi-square | B1⊗C | 2.92% | 7.18% | 14.48% | 23.44% | 43.83% | 43.83% | |
| B1⊙C | 5.11% | 9.52% | 15.41% | 30.66% | 47.44% | 5.11% | ||
| C∙B1 | 69.36% | |||||||
| RIDIT Analysis | B2⊗C | 2.92% | 7.18% | 15.41% | 26.65% | 42.35% | 42.35% | |
| B2⊙C | 3.98% | 9.97% | 17.05% | 30.66% | 43.83% | 3.98% | ||
| C∙B2 | 69.18% | |||||||
| AHP | B3⊗C | 2.92% | 7.18% | 15.41% | 24.12% | 40.16% | 40.16% | |
| B3⊙C | 6.74% | 11.95% | 17.02% | 30.66% | 43.83% | 6.74% | ||
| C∙B3 | 66.71% |
| Main Factors | RFM Ranking | AHP Weight | AHP Ranking | Chi-Square Weight | Chi-Square Ranking | RIDIT Weight | RIDIT Ranking |
|---|---|---|---|---|---|---|---|
| Smoking | 1 | 0.015 | 3 | 0.042 | 3 | 0.002 | 24 |
| Low physical activity | 2 | 0.022 | 10 | 0.037 | 9 | 0.013 | 18 |
| Child Wasting | 3 | 0.010 | 22 | 0.047 | 1 | 0.032 | 8 |
| Low birth weight due to short gestation | 4 | 0.007 | 24 | 0.042 | 4 | 0.023 | 13 |
| Iron deficiency | 5 | 0.129 | 18 | 0.020 | 22 | 0.067 | 3 |
| Diet low in nuts and seeds | 6 | 0.016 | 16 | 0.034 | 13 | 0.021 | 16 |
| Vitamin A deficiency | 7 | 0.015 | 19 | 0.043 | 2 | 0.008 | 20 |
| Low bone mineral density | 8 | 0.037 | 6 | 0.034 | 15 | 0.003 | 23 |
| Air pollution | 9 | 0.142 | 2 | 0.027 | 20 | 0.040 | 6 |
| Diet high in sodium | 10 | 0.038 | 5 | 0.034 | 14 | 0.024 | 12 |
| Household air pollution from solid fuels | 11 | 0.017 | 15 | 0.036 | 11 | 0.025 | 11 |
| Diet low in fruits | 12 | 0.021 | 12 | 0.035 | 12 | 0.021 | 15 |
| Disease burden | 13 | 0.016 | 17 | 0.003 | 24 | 0.245 | 1 |
| Diet low in vegetables | 14 | 0.021 | 11 | 0.037 | 10 | 0.014 | 17 |
| Alcohol use | 15 | 0.014 | 20 | 0.033 | 17 | 0.033 | 7 |
| Drug use | 16 | 0.011 | 21 | 0.038 | 6 | 0.006 | 22 |
| High body-mass index | 17 | 0.020 | 13 | 0.024 | 21 | 0.054 | 4 |
| Child stunting | 18 | 0.009 | 23 | 0.039 | 5 | 0.007 | 21 |
| Unsafe water source | 19 | 0.025 | 9 | 0.038 | 7 | 0.023 | 14 |
| High fasting plasma glucose | 20 | 0.020 | 14 | 0.018 | 23 | 0.070 | 2 |
| Diet low in whole grains | 21 | 0.026 | 8 | 0.031 | 19 | 0.031 | 9 |
| Outdoor air pollution | 22 | 0.167 | 1 | 0.033 | 16 | 0.025 | 10 |
| Unsafe sex | 23 | 0.026 | 7 | 0.032 | 18 | 0.048 | 5 |
| Secondhand smoke | 24 | 0.083 | 4 | 0.038 | 8 | 0.010 | 19 |
Publisher’s Note: MDPI stays neutral with regard to jurisdictional claims in published maps and institutional affiliations. |
© 2022 by the authors. Licensee MDPI, Basel, Switzerland. This article is an open access article distributed under the terms and conditions of the Creative Commons Attribution (CC BY) license (https://creativecommons.org/licenses/by/4.0/).
Share and Cite
Wu, X.; Denise, B.-B.; Zhan, F.B.; Zhang, J. Determining Association between Lung Cancer Mortality Worldwide and Risk Factors Using Fuzzy Inference Modeling and Random Forest Modeling. Int. J. Environ. Res. Public Health 2022, 19, 14161. https://doi.org/10.3390/ijerph192114161
Wu X, Denise B-B, Zhan FB, Zhang J. Determining Association between Lung Cancer Mortality Worldwide and Risk Factors Using Fuzzy Inference Modeling and Random Forest Modeling. International Journal of Environmental Research and Public Health. 2022; 19(21):14161. https://doi.org/10.3390/ijerph192114161
Chicago/Turabian StyleWu, Xiu, Blanchard-Boehm Denise, F.Benjamin Zhan, and Jinting Zhang. 2022. "Determining Association between Lung Cancer Mortality Worldwide and Risk Factors Using Fuzzy Inference Modeling and Random Forest Modeling" International Journal of Environmental Research and Public Health 19, no. 21: 14161. https://doi.org/10.3390/ijerph192114161