
Spatio-Temporal Variability of Malaria Incidence in the Health District of Kati, Mali, 2015–2019

 ,
,  , ,
, ,
Abstract
:1. Introduction
2. Methods
2.1. Study Site
2.2. Data Collection
2.3. Statistical Analysis
2.3.1. Temporal Analysis of Malaria Incidence and Associated Meteorological and Environmental Factors
2.3.2. Spatial Analysis of Malaria Incidence
2.3.3. Classification and Regression Tree Analysis
2.3.4. Software
3. Results
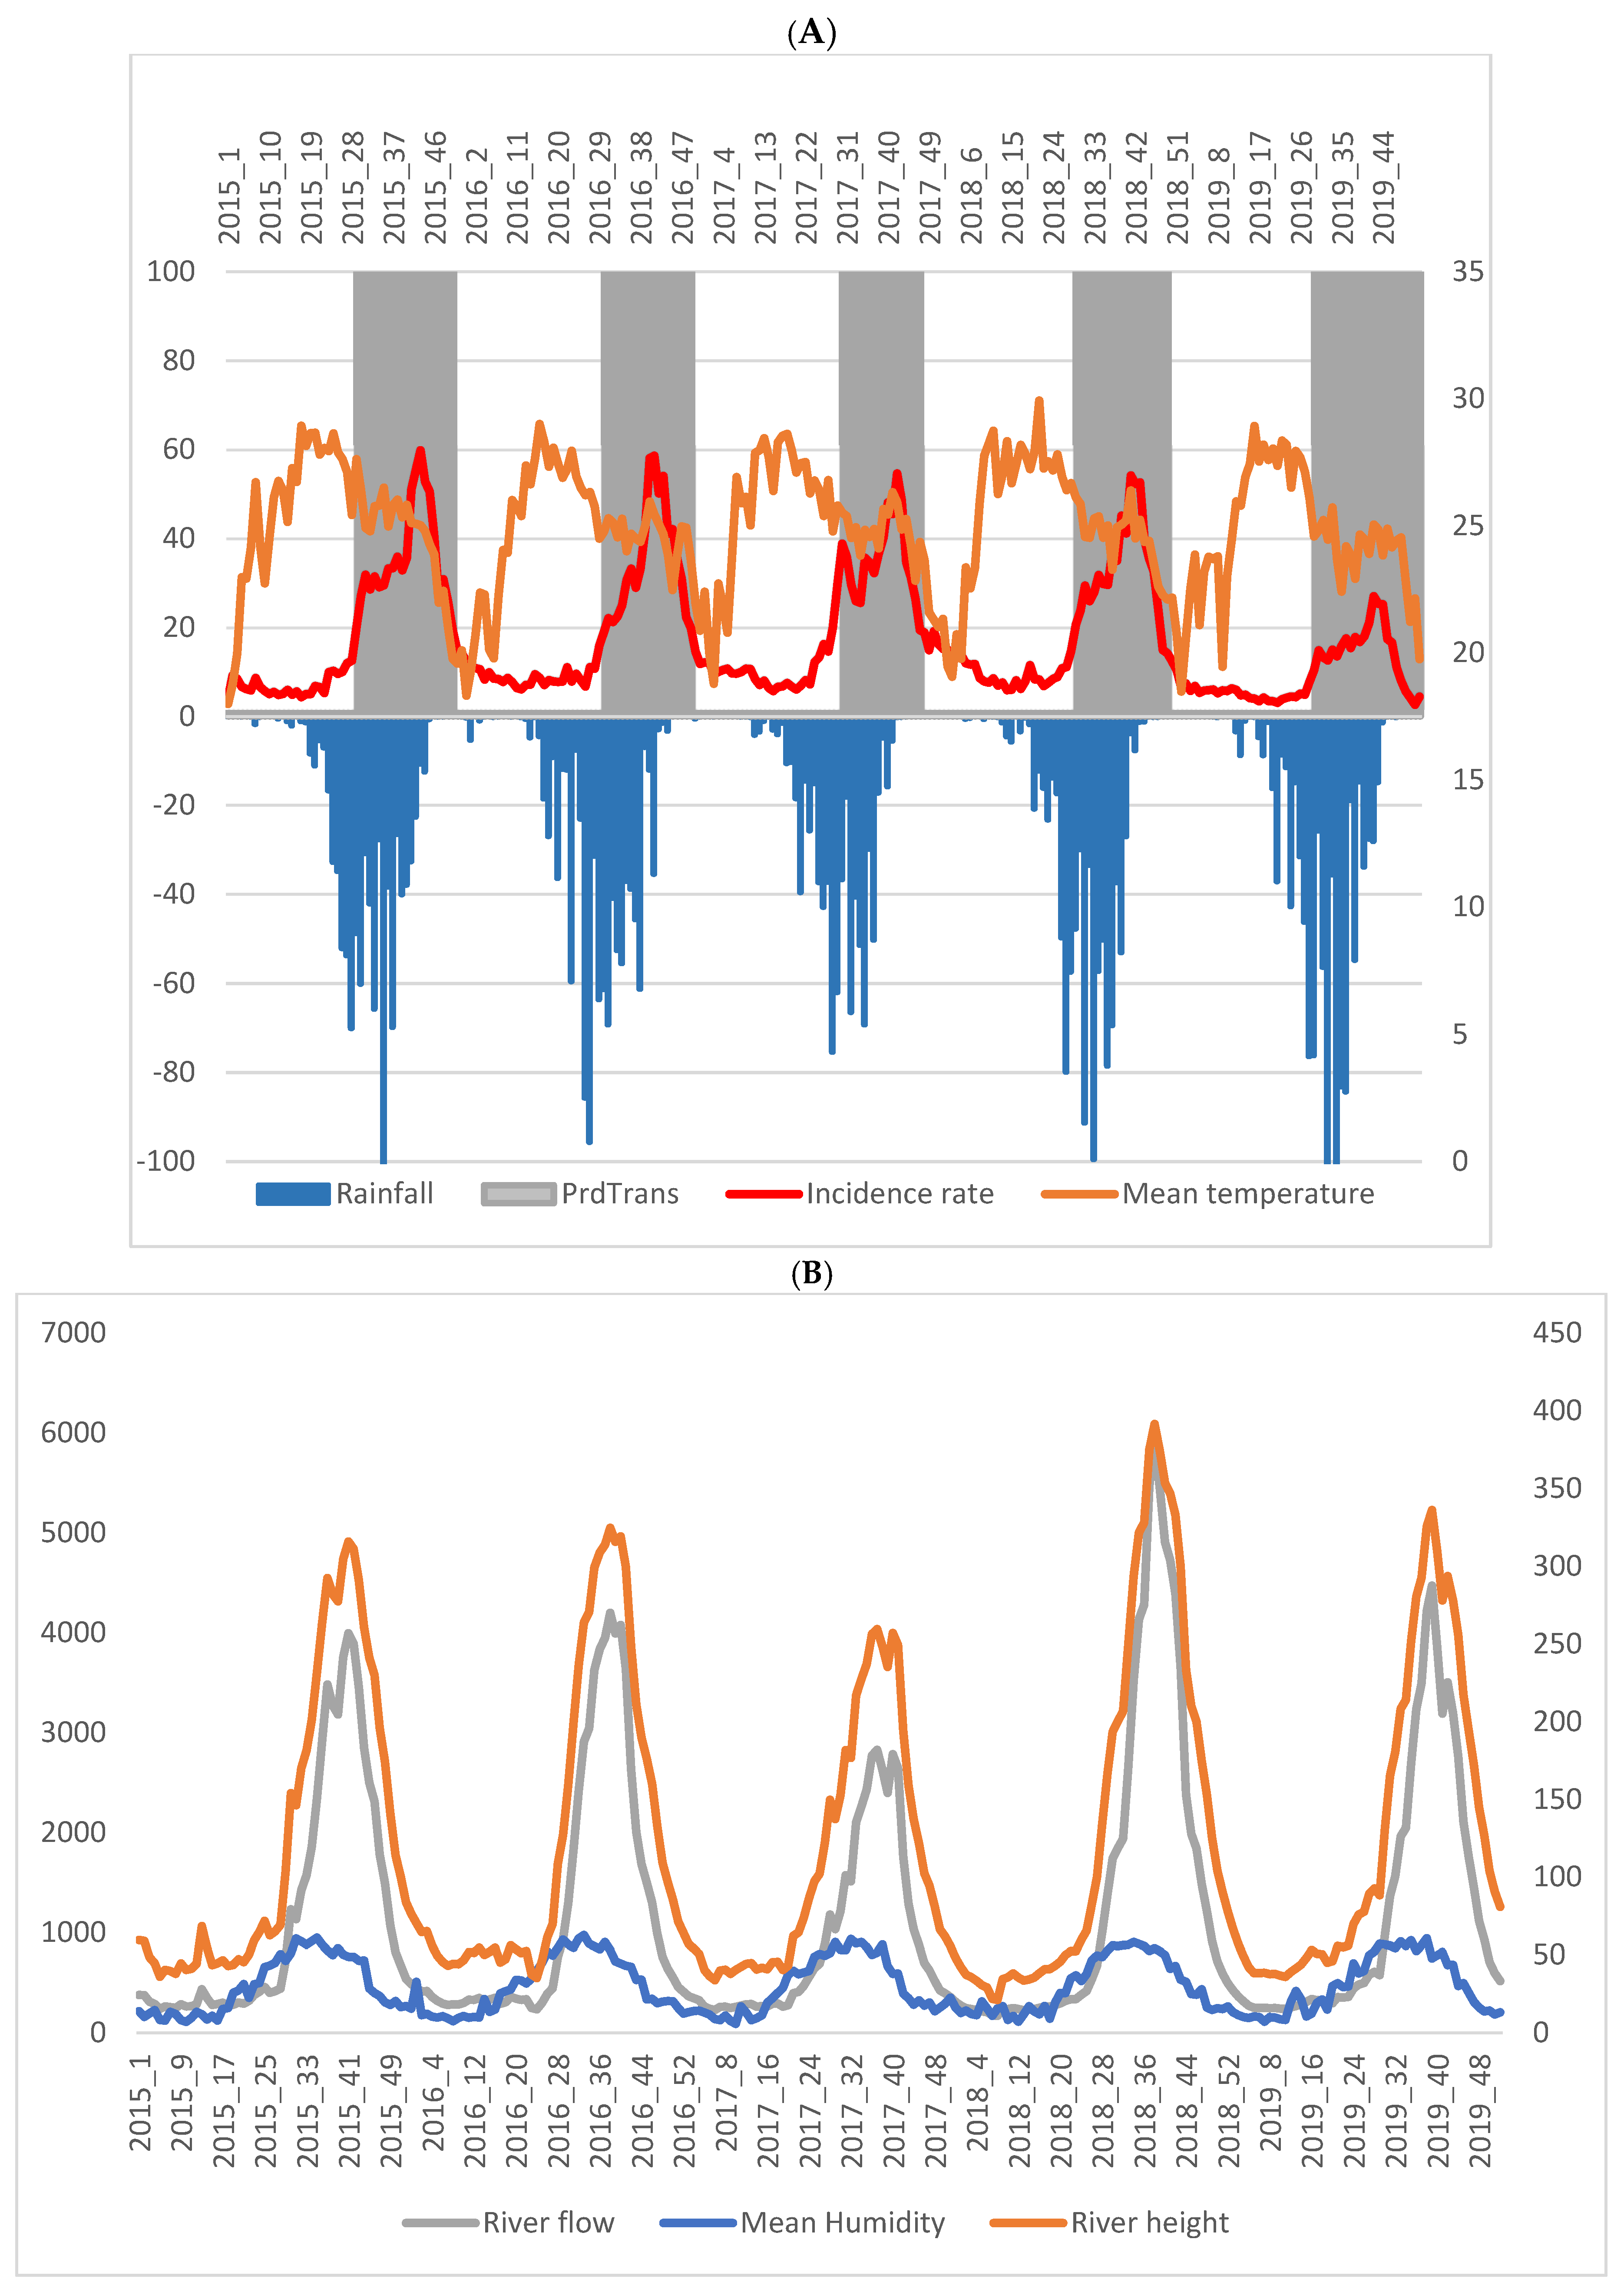
3.1. General Description of the Malaria Incidence Time Series
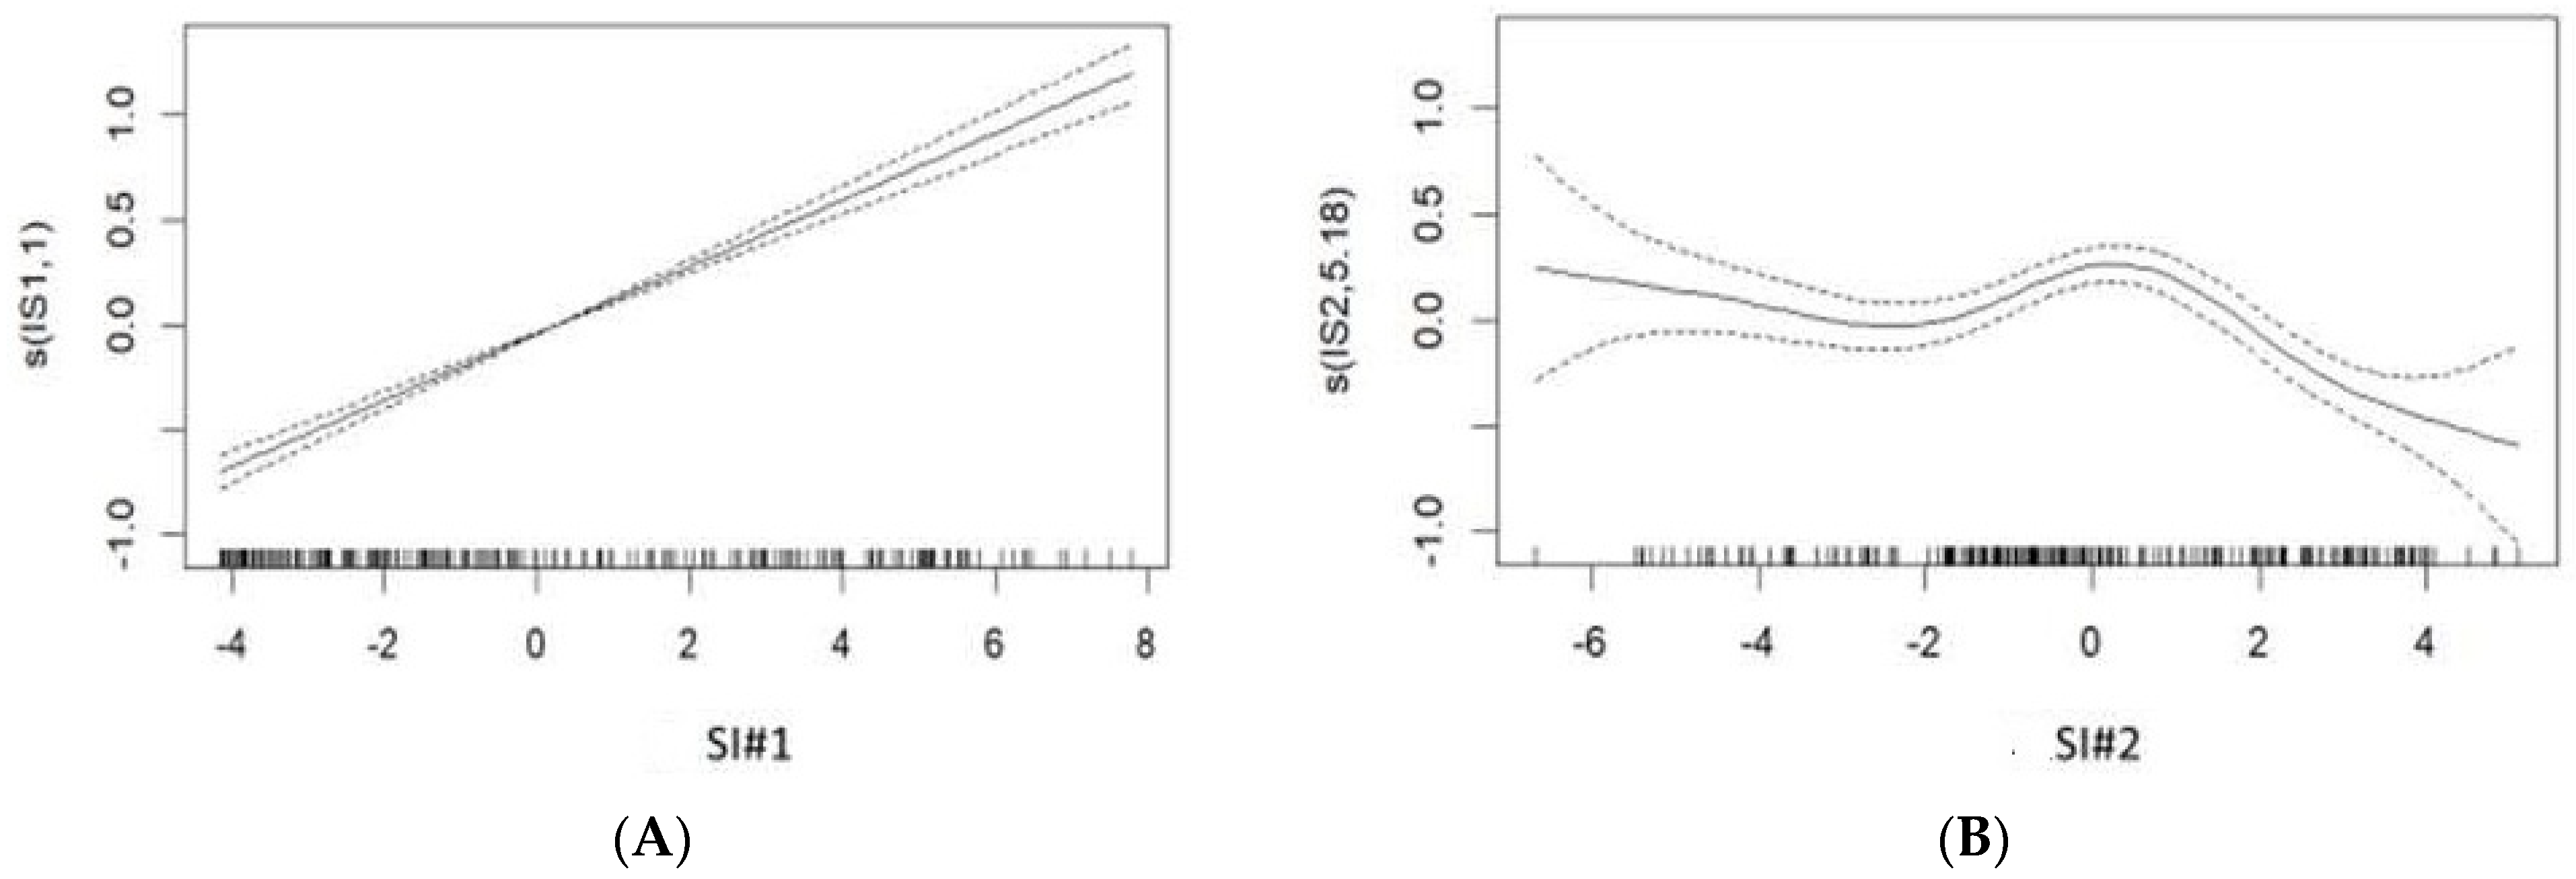
3.2. Temporal Analysis of Malaria Incidence and Associated Meteorological and Environmental Factors
3.3. Spatial Analysis of Malaria Incidence
3.4. Classification and Regression Tree Analysis
4. Discussion
5. Conclusions
Author Contributions
Funding
Institutional Review Board Statement
Informed Consent Statement
Data Availability Statement
Acknowledgments
Conflicts of Interest
Abbreviations
| WHO | Word Health Organization |
| NMCP | National Malaria Control Program |
| LLIN | Long-lasting insecticide net |
| IRS | Indoor residual spraying |
| RDT | Rapid diagnostic test |
| ACT | Artemisinin-based combination therapy |
| IPT | Intermittent preventive treatment |
| SP | Sulfadoxine-pyrimethamine |
| SMC | Seasonal malaria chemoprevention |
| AQ | Amodiaquine |
| PCA | Principal component analysis |
| SI | Synthetic indicator |
| GAM | Generalized additive model |
| RR | Relative risk |
| CART | Classification and regression tree analysis |
| LTP | Low transmission period |
| HTP | High transmission period |
References
- World Malaria Report 2020: 20 Years of Global Progress and Challenges; World Health Organization: Geneva, Switzerland, 2020.
- CPS/SS-DS-PF. Annuaire Statistique du Système National D’information Sanitaire du Mali. 2019. Available online: https://www.instat-mali.org/fr/publications/annuaire-statistique-du-mali (accessed on 2 June 2022).
- Programme National de Lutte Contre le Paludisme, le Centre de Recherche et de Formation sur le Paludisme, KEMRI-Wellcome Research Trust et la London School of Hygiene & Tropical Medicine. Mali: Un Profil de la Lutte Contre le Paludisme et de L’épidémiologie. Ministère de la Santé du Mali. 2018. Available online: https://web-archive.lshtm.ac.uk/www.linkmalaria.org/sites/link/files/content/country/profiles/Mali-profile-Fr.pdf (accessed on 19 April 2022).
- PNLP, MRTC and INFORM An Epidemiological Profile of Malaria in Mali. A Report Prepared for the Ministry of Health, Mali, the Roll Back Malaria Partnership and the Department for International Development, UK. October 2014. Available online: https://web-archive.lshtm.ac.uk/www.linkmalaria.org/sites/link/files/content/attachments/2018-10-17/Mali-Malaria-Epi-Profile-Report-2014.pdf (accessed on 14 May 2022).
- Dieng, S.; Ba, E.H.; Cissé, B.; Sallah, K.; Guindo, A.; Ouedraogo, B.; Piarroux, M.; Rebaudet, S.; Piarroux, R.; Landier, J.; et al. Spatio-temporal variation of malaria hotspots in Central Senegal, 2008–2012. BMC Infect. Dis. 2020, 20, 424. [Google Scholar] [CrossRef] [PubMed]
- Programme National de Lutte contre le Paludisme (PNLP); Institut National de la Statistique (INSTAT); INFO-STAT; Institut National de la Recherche en Santé Publique (INRSP) et ICF International. Enquête sur les Indicateurs du Paludisme au Mali (EIPM) 2015; INSTAT, INFO-STAT et ICF International: Rockville, ML, USA, 2016; Available online: https://dhsprogram.com/pubs/pdf/MIS24/MIS24.pdf (accessed on 5 February 2019).
- Institut National de la Statistique (INSTAT); Programme National de Lutte contre le Paludisme (PNLP) et ICF. Enquête sur les Indicateurs du Paludisme au Mali 2021. Indicateurs Clés; INSTAT, PNLP et ICF: Bamako, Mali; Rockville, ML, USA, 2021; Available online: https://dhsprogram.com/pubs/pdf/PR135/PR135.pdf (accessed on 19 April 2022).
- Evaluation de l’Impact des Interventions de Lutte Contre le Paludisme sur la Mortalité Toutes Causes Confondues chez les Enfants de moins de Cinq Ans au Mali de 2000 à 2012. 2015. Available online: https://www.pmi.gov/evaluation-of-the-impact-of-the-scale-up-of-malaria-control-interventions-mortality-in-children-under-five-years-in-mali-2000-2012-full-report-french-2 (accessed on 22 April 2022).
- Organisation mondiale de la Santé. Chimioprévention du Paludisme Saisonnier par Administration de Sulfadoxine-Pyrimethamine et D’amodiaquine aux Enfants: Guide de Terrain. Organisation Mondiale de la Santé. 2013. Available online: https://apps.who.int/iris/handle/10665/85727 (accessed on 10 March 2019).
- World Health Organization. World Malaria Report 2018. World Health Organization. 2018. Available online: http://www.who.int/iris/handle/10665/275867 (accessed on 5 March 2021).
- Plan de Développement Socio-Sanitaire 2019–2023 du District Sanitaire de Kati; Rapport; Centre de Sante de Référence de Kati, CSRef/DRS: Bamako, Mali, 2018.
- Cissoko, M.; Magassa, M.; Sanogo, V.; Ouologuem, A.; Sangaré, L.; Diarra, M.; Bationo, C.S.; Dolo, M.; Bah, M.D.; Doumbia, S.; et al. Stratification at the health district level for targeting malaria control interventions in Mali. Sci. Rep. 2022, 12, 8271. [Google Scholar] [CrossRef] [PubMed]
- Dicko, A.; Sagara, I.; Diemert, D.; Sogoba, M.; Niambele, M.B.; Dao, A.; Dolo, G.; Yalcouye, D.; Diallo, D.A.; Saul, A.; et al. Year-to-year variation in the age-specific incidence of clinical malaria in two potential vaccine testing sites in Mali with different levels of malaria transmission intensity. Am. J. Trop. Med. Hyg. 2007, 77, 1028–1033. [Google Scholar] [CrossRef] [PubMed] [Green Version]
- Giovanni: An Easier Way to Visualize Earth Science Data. Available online: https://www.nasa.gov/audience/foreducators/9-12/features/giovanni-an-easier-way.html (accessed on 21 December 2019).
- Bationo, C.S.; Gaudart, J.; Dieng, S.; Cissoko, M.; Taconet, P.; Ouedraogo, B.; Somé, A.; Zongo, I.; Soma, D.D.; Tougri, G.; et al. Spatio-temporal analysis and prediction of malaria cases using remote sensing meteorological data in Diébougou health district, Burkina Faso, 2016–2017. Sci. Rep. 2021, 11, 1–12. [Google Scholar] [CrossRef] [PubMed]
- Buchhorn, M.; Smets, B.; Bertels, L.; Lesiv, M.; Tsendbazar, N.-E.; Masiliunas, D.; Linlin, L.; Herold, M.; Fritz, S. Copernicus Global Land Service: Land Cover 100m: Collection 3: Epoch 2015: Globe, Version V3.0.1; [Data set]; Zenodo CERN: Geneva, Switzerland, 2020. [Google Scholar] [CrossRef]
- Buchhorn, M.; Smets, B.; Bertels, L.; Lesiv, M.; Tsendbazar, N.-E.; Masiliunas, D.; Linlin, L.; Herold, M.; Fritz, S. Copernicus Global Land Service: Land Cover 100m: Collection 3: Epoch 2016: Globe, Version V3.0.1; [Data set]; Zenodo CERN: Geneva, Switzerland, 2020. [Google Scholar] [CrossRef]
- Buchhorn, M.; Smets, B.; Bertels, L.; Lesiv, M.; Tsendbazar, N.-E.; Masiliunas, D.; Linlin, L.; Herold, M.; Fritz, S. Copernicus Global Land Service: Land Cover 100m: Collection 3: Epoch 2017: Globe, Version V3.0.1; [Data set]; Zenodo CERN: Geneva, Switzerland, 2020. [Google Scholar] [CrossRef]
- Buchhorn, M.; Smets, B.; Bertels, L.; Lesiv, M.; Tsendbazar, N.-E.; Masiliunas, D.; Linlin, L.; Herold, M.; Fritz, S. Copernicus Global Land Service: Land Cover 100m: Collection 3: Epoch 2018: Globe, Version V3.0.1; [Data set]; Zenodo CERN: Geneva, Switzerland, 2020. [Google Scholar] [CrossRef]
- Buchhorn, M.; Smets, B.; Bertels, L.; Lesiv, M.; Tsendbazar, N.-E.; Masiliunas, D.; Linlin, L.; Herold, M.; Fritz, S. Copernicus Global Land Service: Land Cover 100m: Collection 3: Epoch 2019: Globe, Version V3.0.1; [Data set]; Zenodo CERN: Geneva, Switzerland, 2020. [Google Scholar] [CrossRef]
- Cissoko, M.; Sagara, I.; Sankaré, M.H.; Dieng, S.; Guindo, A.; Doumbia, Z.; Allasseini, B.; Traore, D.; Fomba, S.; Bendiane, M.K.; et al. Geo-Epidemiology of Malaria at the Health Area Level, Dire Health District, Mali, 2013–2017. Int. J. Environ. Res. Public Health 2020, 17, 3982. [Google Scholar] [CrossRef] [PubMed]
- Ver Hoef, J.M.; Boveng, P.L. Quasi-poisson vs. negative binomial regression: How should we model overdispersed count data? Ecology 2007, 88, 2766–2772. [Google Scholar] [CrossRef] [PubMed] [Green Version]
- Wood, S.N. Generalized Additive Models: An Introduction with R, 2nd ed.; CRC Press: Boca Raton, FL, USA, 2006; p. 392. ISBN 9781498728331. [Google Scholar]
- Wambui, G.D.; Waititu, G.A.; Wanjoya, A. The Power of the Pruned Exact Linear Time(PELT) Test in Multiple Changepoint Detection. Am. J. Theor. Appl. Stat. 2015, 4, 581–586. [Google Scholar] [CrossRef] [Green Version]
- Sissoko, M.S.; Sissoko, K.; Kamate, B.; Samake, Y.; Goita, S.; Dabo, A.; Yena, M.; Dessay, N.; Piarroux, R.; Doumbo, O.K.; et al. Temporal dynamic of malaria in a suburban area along the Niger River. Malar J. 2017, 16, 420. [Google Scholar] [CrossRef] [Green Version]
- Ouedraogo, B.; Inoue, Y.; Kambiré, A.; Sallah, K.; Dieng, S.; Tine, R.; Rouamba, T.; Herbreteau, V.; Sawadogo, Y.; Ouedraogo, L.S.L.W.; et al. Spatio-temporal dynamic of Malaria in Ouagadougou, Burkina Faso, 2011–2015. Malar J. 2018, 17, 138. [Google Scholar] [CrossRef] [Green Version]
- Kulldorf, M.; Heffernan, R.; Hartman, J.; Assunção, R.M.; Mostashari, F. A space-time permutation scan statistic for disease outbreaks detection. PLoS Méd. 2005, 2, 216–224. [Google Scholar] [CrossRef] [Green Version]
- Guttmann, A.; Li, X.; Feschet, F.; Gaudart, J.; Demongeot, J.; Boire, J.Y.; Ouchchane, L. Cluster detection tests in spatial epidemiology: A global indicator for performance assessment. PLoS ONE 2015, 10, 17. [Google Scholar] [CrossRef]
- Guttmann, A.; Li, X.; Gaudart, J.; Gérard, Y.; Demongeot, J.; Boire, J.Y.; Ouchchane, L. Spatial heterogeneity of type I error for local cluster detection tests. Int. J. Health Geogr. 2014, 13, 15. [Google Scholar] [CrossRef] [Green Version]
- Piarroux, M.; Gaudart, J.; Bresson-Hadni, S.; Bardonnet, K.; Faucher, B.; Grenouillet, F.; Knapp, J.; Dumortier, J.; Watelet, J.; Gerard, A.; et al. Landscape and Climatic Characteristics Associated with Human Alveolar Echinococcosis in France, 1982 to 2007. Euro Surveill. 2015, 20, 21118. Available online: http://www.eurosurveillance.org/ViewArticle.aspx?ArticleId=21118 (accessed on 16 September 2021). [CrossRef] [PubMed] [Green Version]
- Timofeev, R. Classification and Regression Trees (CART) Theory and Applications. Available online: https://dokumen.tips/documents/classification-and-regression-trees-cart-theory-and-applications.html (accessed on 16 September 2021).
- Baba, E.; Hamade, P.; Kivumbi, H.; Marasciulo, M.; Maxwell, K.; Moroso, D.; Roca-Feltrer, A.; Sanogo, A.; Johansson, J.S.; Tibenderana, J.; et al. Effectiveness of seasonal malaria chemoprevention at scale in west and central Africa: An observational study. Lancet 2020, 396, 1829–1840. [Google Scholar] [CrossRef]
- Rouamba, T.; Diallo, S.N.; Derra, K.; Rouamba1, E.; Kazienga, A.; Inoue, Y.; Ouédraogo, E.K.; Waongo, M.; Dieng, S.; Guindo, A.; et al. Socioeconomic and environmental factors associated with malaria hotspots in the Nanoro demographic surveillance area, Burkina Faso. BMC Public Health 2019, 19, 249. [Google Scholar] [CrossRef] [PubMed]
- Stefani, A.; Hanf, M.; Nacher, M.; Girod, R.; Carme, B. Environmental, entomological, socioeconomic and behavioural risk factors for malaria attacks in Amerindian children of Camopi, French Guiana. Malar J. 2011, 10, 246. [Google Scholar] [CrossRef] [Green Version]
- Coulibaly, D.; Travassos, M.K.; Tolo, Y.; Laurens, M.B.; Kone, A.K.; Traore, K.; Sissoko, M.; Niangaly, A.; Diarra, I.; Daou, M.; et al. Spatio-Temporal Dynamics of Asymptomatic Malaria: Bridging the Gap Between Annual Malaria Resurgences in a Sahelian Environment. Am. J. Trop. Med. Hyg. 2017, 97, 1761–1769. [Google Scholar] [CrossRef] [Green Version]
- Ferrão, J.L.; Mendes, J.M.; Painho, M. Modelling the influence of climate on malaria occurrence in Chimoio Municipality, Mozambique. Parasit. Vectors 2017, 10, 260. [Google Scholar] [CrossRef] [Green Version]
- Diouf, I.; Deme, A.; Rodriguez, F.B.; Cisse, M.; Ndione, J.A.; Gaye, A.T. Détermination des Paramètres du Paludisme au Sénégal à Partir de Données Météorologiques de Stations et de Réanalyses. Available online: http://www.climato.be/aic/colloques/actes/ACTES_AIC2015/2%20Climatologie%20appliquee/021-DIOUF_I-133-139.pdf (accessed on 5 June 2022).
- Teklehaimanot, H.D.; Lipsitch, M.; Teklehaimanot, A.; Schwartz, J. Weather-based prediction of Plasmodium falciparum malaria in epidemic-prone regions of Ethiopia I. Patterns of lagged weather effects reflect biological mechanism. Malar. J. 2004, 3, 41. [Google Scholar] [CrossRef] [Green Version]
- Segun, O.E.; Shohaimi, S.; Nallapan, M.; Lamidi-Sarumoh, A.A.; Salari, N. Statistical Modelling of the Effects of Weather Factors on Malaria Occurrence in Abuja, Nigeria. Int. J. Environ. Res. Public Health 2020, 17, 3474. [Google Scholar] [CrossRef] [PubMed]
- Christiansen-Jucht, C.; Parham, P.E.; Saddler, A.; Koella, J.C.; Basáñez, M.G. Temperature during larval development and adult maintenance influences the survival of Anopheles gambiae s.s. Parasites Vectors 2014, 7, 489. [Google Scholar] [CrossRef] [PubMed]
- Coulibaly, D.; Rebaudet, S.; Travassos, M.; Tolo, Y.; Laurens, M.; Kone, A.K.; Traore, K.; Guindo, A.; Diarra, I.; Niangaly, A.; et al. Spatio-temporal analysis of malaria within a transmission season in Bandiagara, Mali. Malar. J. 2013, 12, 82. [Google Scholar] [CrossRef] [PubMed] [Green Version]
- Baragatti, M.; Fournet, F.; Henry, M.C.; Assi, S.; Ouedraogo, H.; Rogier, C.; Salem, G. Social and environmental malaria risk factors in urban areas of Ouagadougou, Burkina Faso. Malar. J. 2009, 8, 13. [Google Scholar] [CrossRef] [PubMed] [Green Version]
- Bhattarai, S.; Kolivras, K.N.; Ghimire, K.; Shao, Y. Understanding the relationship between land use and land cover and malaria in Nepal. Geospat. Health 2020, 15, 855. [Google Scholar] [CrossRef]
- Mitchell, C.L.; Ngasala, B.; Janko, M.M.; Chacky, F.; Edwards, J.K.; Pence, B.W.; Ally Mohamed, A.; Mhamilawa, L.E.; Makene, T.; Kyaw, T.; et al. Evaluating malaria prevalence and land cover across varying transmission intensity in Tanzania using a cross-sectional survey of school-aged children. Malar. J. 2022, 21, 80. [Google Scholar] [CrossRef]
- Paul, P.; Kangalawe, R.Y.M.; Mboera, L.E.G. Land-use patterns and their implication on malaria transmission in Kilosa District, Tanzania. Trop. Dis. Travel Med. Vaccines 2018, 4, 6. [Google Scholar] [CrossRef] [Green Version]
- Nicholas, K.; Bernard, G.; Bryson, N.; Mukabane, K.; Kilongosi, M.; Ayuya, S.; Mulama, D.H. Abundance and Distribution of Malaria Vectors in Various Aquatic Habitats and Land Use Types in Kakamega County, Highlands of Western Kenya. Ethiop. J. Health Sci. 2021, 31, 247–256. [Google Scholar] [CrossRef]


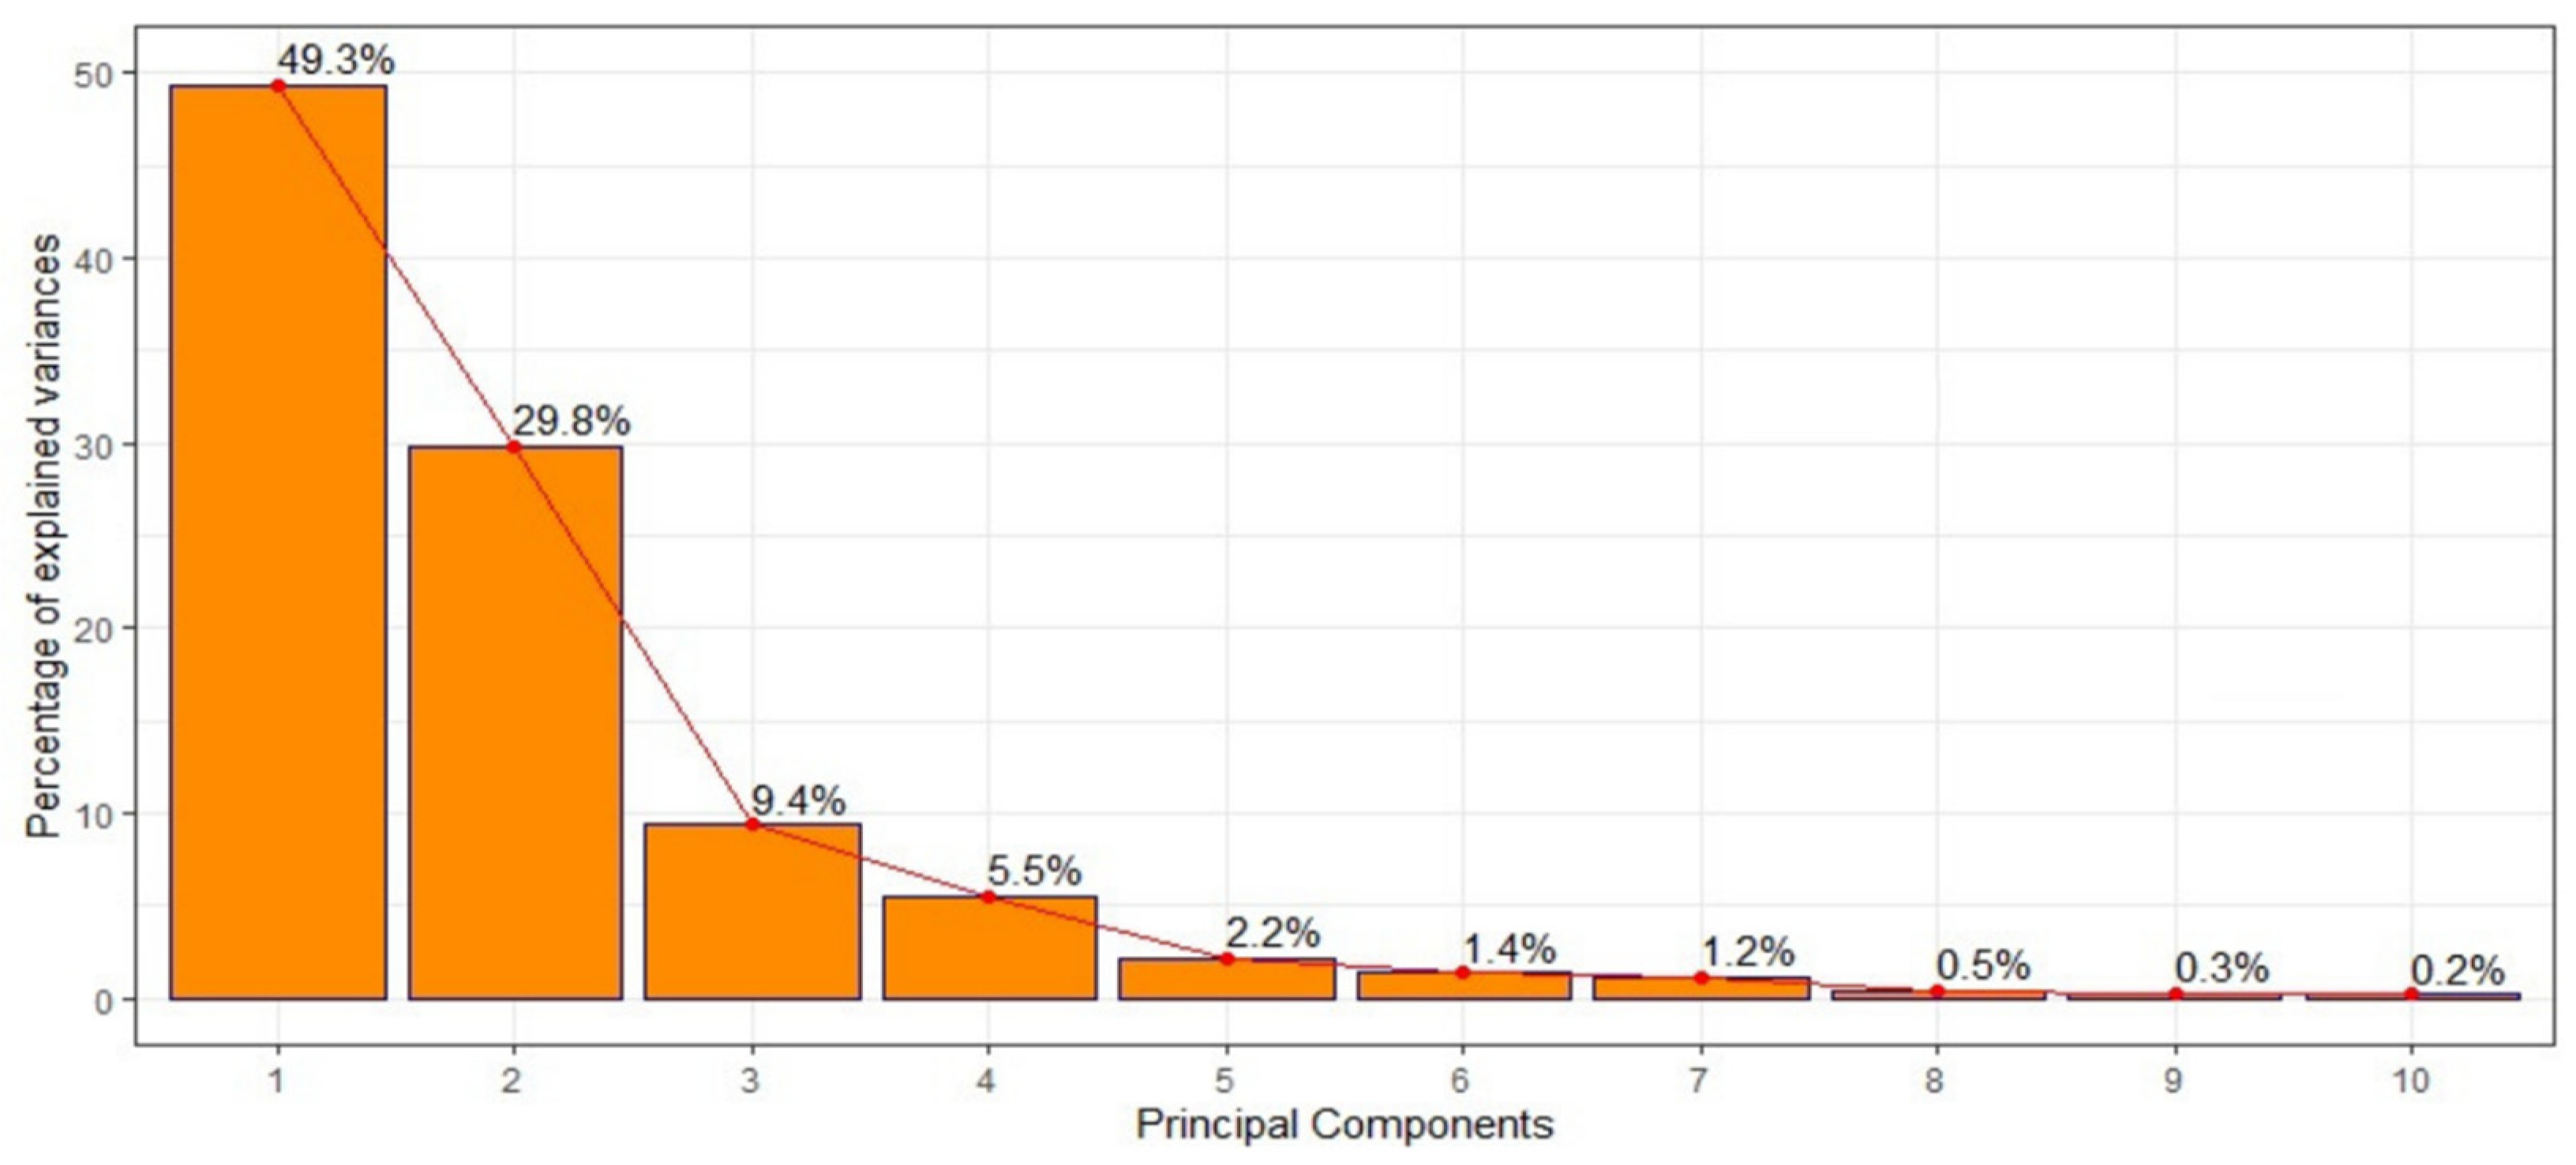
| Synthetic Indicators | Variables | Percentage of Inertia | Correlation Coefficient r | Percentage of Total Inertia |
|---|---|---|---|---|
| Synthetic Indicator #1 | Mean river flow | 7.05 | 0.87 | 49.3% |
| Maximum river flow | 7.12 | 0.88 | ||
| Mean river height | 7.49 | 0.90 | ||
| Maximum river height | 7.50 | 0.90 | ||
| Minimum river height | 7.44 | 0.90 | ||
| Mean night relative humidity | 7.92 | 0.93 | ||
| Minimum night relative humidity | 7.55 | 0.90 | ||
| Mean day relative humidity | 7.89 | 0.93 | ||
| Maximum day relative humidity | 7.71 | 0.91 | ||
| Minimum day relative humidity | 7.69 | 0.91 | ||
| Cumulative Rainfall | 4.47 | 0.70 | ||
| Wind speed | 3.87 | −0.65 | ||
| Synthetic Indicator #2 | Mean air pressure | 7.61 | 0.71 | 29.8% |
| Mean night temperature | 14.52 | 0.98 | ||
| Minimum night temperature | 13.21 | 0.93 | ||
| Maximum night temperature | 14.24 | 0.97 | ||
| Mean day temperature | 14.52 | 0.98 | ||
| Minimum day temperature | 13.21 | 0.93 | ||
| Maximum day temperature | 14.24 | 0.97 |
| Never a Hotspot | Hotspot in the First Year of the Study | Hotspot in Two Consecutive Years | Hotspot Every Year of the Study | Hotspot without Temporal Regularity | |
|---|---|---|---|---|---|
| Number of health areas | 10 | 3 | 2 | 10 | 10 |
| Malaria Transmission Periods | Duration (Weeks) | Number of Health Areas That Were a Hotspot | Number of Hotspots | Incidence Rate (Cases per 1000 Person–Weeks) | Rainfall (mm) | Mean Temperature (°C) | Mean Wind (km/h) | Mean NDVI | ||||||||||
|---|---|---|---|---|---|---|---|---|---|---|---|---|---|---|---|---|---|---|
| Min. | Median | Max. | Min. | Median | Max. | Min. | Median | Max. | Min. | Median | Max. | Min. | Median | Max. | ||||
| Low transmission period, 2015 (W1–W28) | 28 | 10 | 5 | 0.003 | 0.737 | 7.210 | 203 | 260 | 305 | 29 | 29 | 31 | 2.06 | 2.24 | 2.34 | 0.218 | 0.274 | 0.344 |
| High transmission period, 2015 (W29–W50) | 22 | 15 | 5 | 0.041 | 2.883 | 27.2 | 578 | 725 | 853 | 25 | 26 | 27 | 1.43 | 1.57 | 1.70 | 0.240 | 0.536 | 0.646 |
| Low transmission period, 2015 (W51)–2016 (W29) | 31 | 9 | 7 | 0.001 | 0.994 | 8.742 | 321 | 408 | 455 | 28 | 29 | 30 | 2.21 | 2.31 | 2.39 | 0.240 | 0.348 | 0.440 |
| High transmission period, 2016 (W30–W49) | 20 | 16 | 5 | 0.022 | 2.803 | 15.75 | 433 | 520 | 603 | 26 | 27 | 28 | 1.06 | 1.22 | 1.34 | 0.240 | 0.377 | 0.430 |
| Low transmission period, 2016 (W50)–2017 (W26) | 29 | 14 | 6 | 0.004 | 1.140 | 12.02 | 200 | 257 | 307 | 28 | 29 | 30 | 1.96 | 2.14 | 2.25 | 0.240 | 0.337 | 0.451 |
| High transmission period, 2017 (W27–W47) | 21 | 10 | 6 | 0.176 | 3.198 | 25.04 | 543 | 611 | 679 | 26 | 27 | 28 | 1.12 | 1.35 | 1.50 | 0.240 | 0.447 | 0.599 |
| Low transmission period, 2017 (W48)–2018 (W27) | 32 | 8 | 5 | 0.019 | 1.206 | 21.34 | 211 | 278 | 326 | 28 | 29 | 30 | 1.91 | 2.03 | 2.15 | 0.240 | 0.340 | 0.400 |
| High transmission period, 2018 (W28–W49) | 22 | 13 | 7 | 0.003 | 2.034 | 36.44 | 641 | 741 | 842 | 26 | 27 | 27 | 1.11 | 1.27 | 1.40 | 0.240 | 0.506 | 0.616 |
| Low transmission period, 2018 (W50)–2019 (W27) | 30 | 13 | 7 | 0.023 | 0.381 | 11.72 | 166 | 213 | 242 | 28 | 29 | 30 | 1.99 | 2.12 | 2.19 | 0.204 | 0.266 | 0.301 |
| High transmission period, 2019 (W28–W46) | 19 | 14 | 4 | 0.005 | 0.399 | 14.29 | 689 | 789 | 906 | 26 | 27 | 27 | 1.11 | 1.40 | 1.56 | 0.220 | 0.247 | 0.269 |
| Health Areas | Number of Times Health Area Was a Hotspot | Bare Soil | Cropland | Grass Vegetation | Shrubland | Forest | Seasonal Inland Water | Permanent Inland Water | ||||||||||||||
|---|---|---|---|---|---|---|---|---|---|---|---|---|---|---|---|---|---|---|---|---|---|---|
| Min. | Median | Max. | Min. | Median | Max. | Min. | Median | Max. | Min. | Median | Max. | Min. | Median | Max. | Min. | Median | Max. | Min. | Median | Max. | ||
| BANCOUMANA | 2 | 0 | 0.33 | 100 | 0 | 37.8 | 90 | 0 | 33.6 | 100 | 0 | 15.8 | 43 | 0 | 7.4 | 42 | 0 | 0 | 100 | 0 | 0 | 100 |
| DABAN | 4 | 0 | 0 | 23 | 0 | 29 | 87 | 0 | 40.6 | 81 | 0 | 20.8 | 47 | 0 | 7.6 | 54 | 0 | 0 | 81 | 0 | 0 | 0 |
| DIAGO | 4 | 0 | 0.67 | 30 | 0 | 31.6 | 87 | 0 | 39.4 | 76 | 0 | 17.8 | 44 | 0 | 7.4 | 39 | 0 | 0 | 6 | 0 | 0 | 0 |
| DIALAKORODJI | 0 | 0 | 0 | 34 | 0 | 15 | 78 | 0 | 39.4 | 74 | 0 | 16.4 | 43 | 0 | 6.4 | 38 | 0 | 0 | 0 | 0 | 0 | 0 |
| DIO BA | 4 | 0 | 0 | 20 | 0 | 15.4 | 85 | 0 | 42.2 | 79 | 0 | 24.8 | 47 | 0 | 9.8 | 42 | 0 | 0 | 5 | 0 | 0 | 0 |
| DIO GARE | 3 | 0 | 0.33 | 26 | 0 | 24.2 | 86 | 0 | 39.4 | 77 | 0 | 21.6 | 44 | 0 | 8.8 | 40 | 0 | 0 | 25 | 0 | 0 | 0 |
| DJIGUIDALA | 3 | 0 | 0 | 9 | 0 | 20.8 | 88 | 0 | 42 | 100 | 0 | 23.8 | 46 | 0 | 10.6 | 46 | 0 | 0 | 100 | 0 | 0 | 100 |
| DJOLIBA | 0 | 0 | 0 | 100 | 0 | 33.4 | 93 | 0 | 35 | 99 | 0 | 17.8 | 66 | 0 | 7.4 | 40 | 0 | 0 | 100 | 0 | 0 | 100 |
| DOGODOUMA | 2 | 0 | 0 | 24 | 0 | 6.8 | 39 | 0 | 43.8 | 73 | 0 | 24 | 40 | 0 | 15.6 | 48 | 0 | 0 | 0 | 0 | 0 | 0 |
| DOMBILA | 0 | 0 | 0 | 29 | 0 | 4.2 | 87 | 0 | 45.8 | 80 | 0 | 25.8 | 43 | 0 | 14 | 55 | 0 | 0 | 11 | 0 | 0 | 0 |
| DOUBABOUGOU | 0 | 0 | 0 | 16 | 0 | 10 | 82 | 0 | 44.2 | 78 | 0 | 25.4 | 43 | 0 | 11.8 | 46 | 0 | 0 | 2 | 0 | 0 | 0 |
| FALADJE | 4 | 0 | 0 | 26 | 0 | 21.6 | 86 | 0 | 42.8 | 84 | 0 | 23.8 | 45 | 0 | 8.8 | 53 | 0 | 0 | 70 | 0 | 0 | 0 |
| FARABANA | 5 | 0 | 0 | 69 | 0 | 6.4 | 82 | 0 | 41.2 | 99 | 0 | 24.4 | 46 | 0 | 13 | 62 | 0 | 0 | 100 | 0 | 0 | 100 |
| FARADA | 0 | 0 | 0.67 | 36 | 0 | 27.8 | 80 | 0 | 37.4 | 72 | 0 | 17.6 | 40 | 0 | 7.6 | 38 | 0 | 0 | 3 | 0 | 0 | 0 |
| KABALABOUGOU | 0 | 0 | 0 | 89 | 0 | 0 | 84 | 0 | 17.4 | 100 | 0 | 2.7 | 39 | 0 | 0 | 32 | 0 | 0 | 100 | 0 | 0 | 100 |
| KALIFABOUGOU | 5 | 0 | 0 | 22 | 0 | 23 | 86 | 0 | 42.2 | 79 | 0 | 23.2 | 46 | 0 | 8.8 | 45 | 0 | 0 | 7 | 0 | 0 | 0 |
| KANADJIGUILA | 0 | 0 | 0 | 28 | 0 | 3.8 | 79 | 0 | 45 | 75 | 0 | 25.4 | 41 | 0 | 13.2 | 43 | 0 | 0 | 0 | 0 | 0 | 0 |
| KATICORO | 3 | 0 | 0.33 | 16 | 0 | 18 | 79 | 0 | 40.4 | 74 | 0 | 15.2 | 36 | 0 | 5.8 | 33 | 0 | 0 | 0 | 0 | 0 | 0 |
| KOKO | 0 | 0 | 0 | 25 | 0 | 17.4 | 80 | 0 | 41.6 | 78 | 0 | 21.4 | 46 | 0 | 9.8 | 39 | 0 | 0 | 0 | 0 | 0 | 0 |
| MALIBOUGOU | 0 | 0 | 0.33 | 22 | 0 | 21.6 | 79 | 0 | 36.2 | 67 | 0 | 19 | 41 | 0 | 10 | 46 | 0 | 0 | 53 | 0 | 0 | 0 |
| MORIBABOUGOU | 4 | 0 | 0 | 94 | 0 | 4.4 | 72 | 0 | 42 | 100 | 0 | 22.2 | 45 | 0 | 8.6 | 41 | 0 | 0 | 100 | 0 | 0 | 63 |
| NANA-KENIEBA | 0 | 0 | 0 | 17 | 0 | 0 | 80 | 0 | 47.8 | 81 | 0 | 27.2 | 46 | 0 | 22.4 | 56 | 0 | 0 | 0 | 0 | 0 | 0 |
| NEGUELA | 0 | 0 | 30 | 0 | 5.4 | 87 | 0 | 42.2 | 80 | 0 | 27.2 | 50 | 0 | 11.8 | 64 | 0 | 0 | 17 | 0 | 0 | 0 | |
| NGABAKORO | 3 | 0 | 0.33 | 59 | 0 | 23.2 | 85 | 0 | 39.8 | 100 | 0 | 18.4 | 66 | 0 | 7.6 | 43 | 0 | 0 | 100 | 0 | 0 | 100 |
| NIAME | 3 | 0 | 0 | 13 | 0 | 15.6 | 80 | 0 | 45.4 | 75 | 0 | 25.6 | 47 | 0 | 10.6 | 42 | 0 | 0 | 0 | 0 | 0 | 0 |
| NIOUMA MAKANA | 1 | 0 | 0 | 22 | 0 | 0.8 | 80 | 0 | 49.8 | 81 | 0 | 26.4 | 45 | 0 | 19 | 61 | 0 | 0 | 0 | 0 | 0 | 0 |
| OUEZZINDOUGOU | 4 | 0 | 0 | 63 | 0 | 19.8 | 83 | 0 | 31.8 | 87 | 0 | 19.8 | 42 | 0 | 9.2 | 55 | 0 | 0 | 100 | 0 | 0 | 100 |
| SAFO | 1 | 0 | 0 | 19 | 0 | 25.6 | 81 | 0 | 44.2 | 78 | 0 | 20.6 | 49 | 0 | 7 | 38 | 0 | 0 | 5 | 0 | 0 | 0 |
| SANANFARA | 0 | 0 | 0 | 37 | 0 | 10.2 | 43 | 0 | 43 | 77 | 0 | 22 | 42 | 0 | 8.4 | 49 | 0 | 0 | 0 | 0 | 0 | 0 |
| SANDAMA | 0 | 0 | 0 | 24 | 0 | 0 | 80 | 0 | 48.4 | 81 | 0 | 27.2 | 45 | 0 | 20.8 | 60 | 0 | 0 | 0 | 0 | 0 | 0 |
| SANGAREBOUGOU | 0 | 0 | 0 | 98 | 0 | 3.4 | 69 | 0 | 31 | 97 | 0 | 8.2 | 46 | 0 | 4 | 36 | 0 | 0 | 100 | 0 | 0 | 15.6 |
| SIBY | 0 | 0 | 0 | 28 | 0 | 4.4 | 85 | 0 | 43.6 | 79 | 0 | 23.8 | 46 | 0 | 13.2 | 53 | 0 | 0 | 75 | 0 | 0 | 0 |
| SONIKEGNY | 5 | 0 | 0 | 19 | 0 | 29.8 | 66 | 0 | 40.6 | 78 | 0 | 19 | 39 | 0 | 7.6 | 34 | 0 | 0 | 47 | 0 | 0 | 0 |
| TORODO | 4 | 0 | 0 | 32 | 0 | 27 | 86 | 0 | 41 | 75 | 0 | 22.2 | 47 | 0 | 8.2 | 43 | 0 | 0 | 26 | 0 | 0 | 0 |
| YELEKEBOUGOU | 5 | 0 | 0 | 28 | 0 | 25.6 | 85 | 0 | 43 | 79 | 0 | 22.4 | 46 | 0 | 8.2 | 43 | 0 | 0 | 55 | 0 | 0 | 0 |
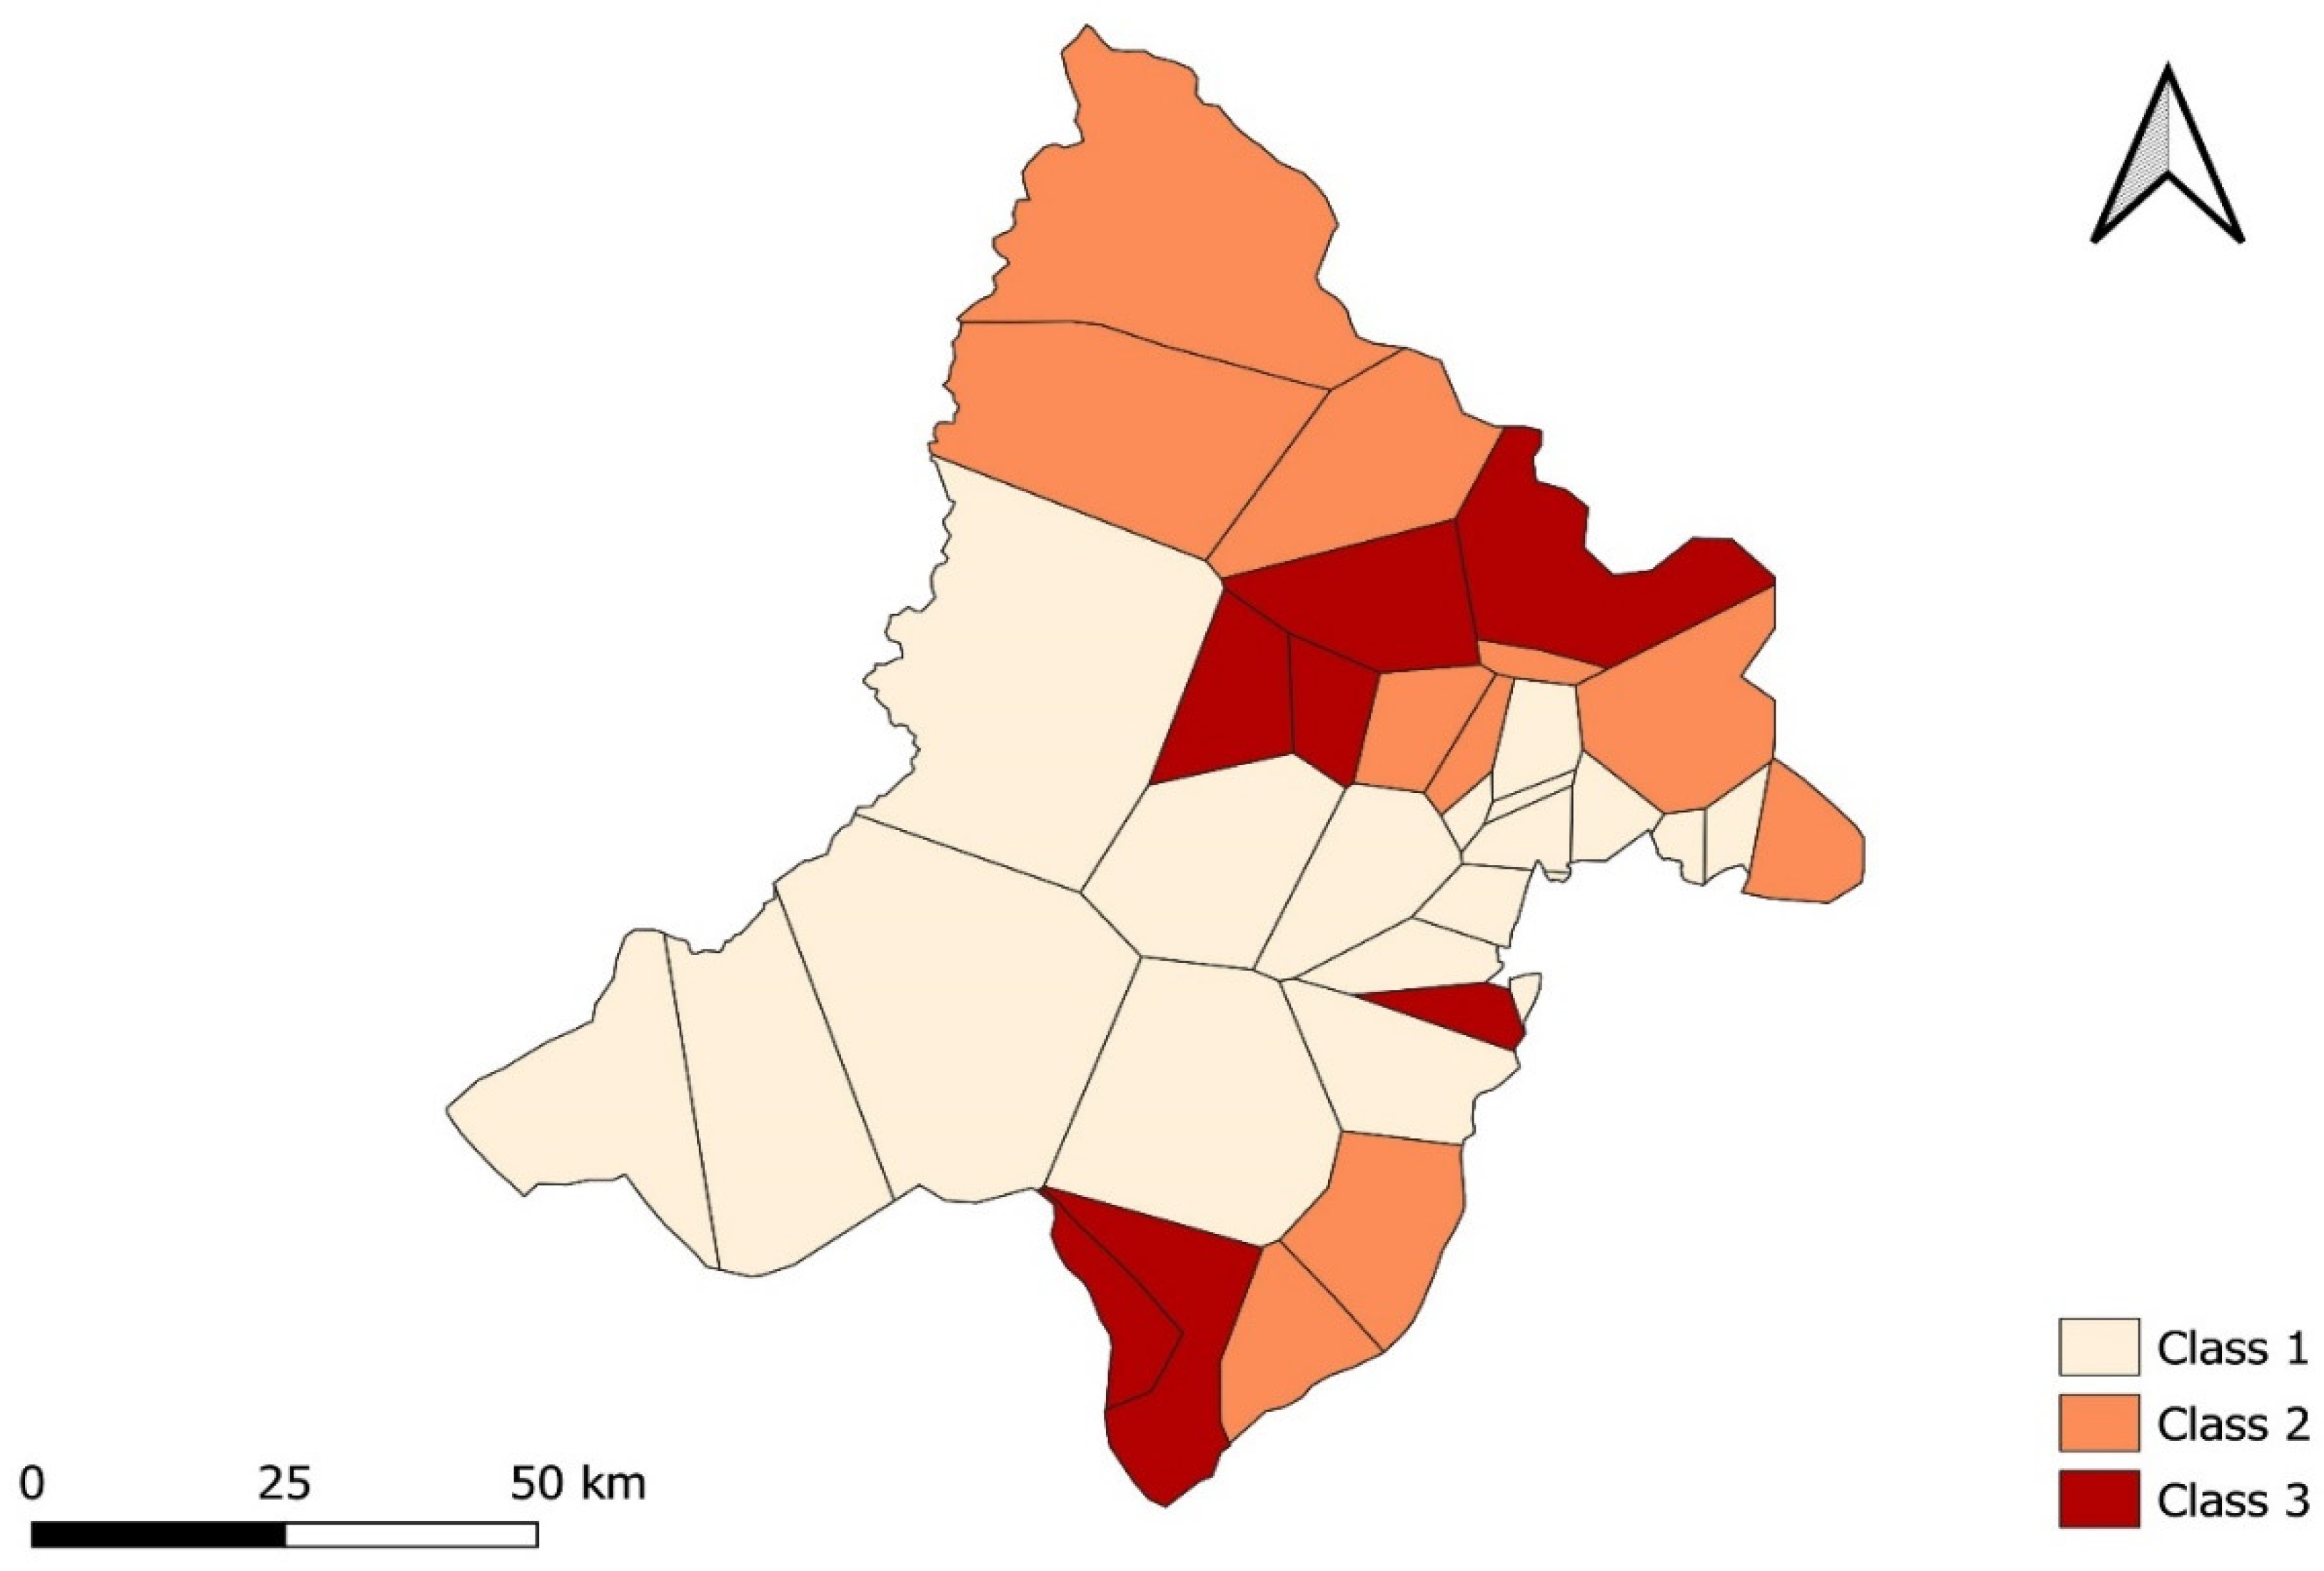
| Class | 1 | 2 | 3 |
|---|---|---|---|
| Incidence (cases per 1000 persons–weeks) | 288.62 | 425.89 | 262.80 |
| Number of health areas | 18 | 9 | 8 |
| Total Population | 112,979 | 56,851 | 83,618 |
| Cumulative Rainfall (mm) | 992 | 902 | 950 |
| Mean Temperature (°C) | 27.78 | 28.24 | 27.95 |
| Mean NDVI | 0.37 | 0.35 | 0.33 |
| Mean Cropland (SD) | 17.68 (2.67) | 29.83 (2.36) | 29.88 (3.72) |
| Mean Shrubland (SD) | 19.93 (2.13) | 21.55 (0.81) | 18.09 (1.40) |
| Mean Forest (SD) | 12.82 (1.75) | 10.07 (1.56) | 9.22 (2.31) |
| Mean Permanent Inland Water (SD) | 1.50 (9.67) | 0.04 (1.77) | 1.84 (9.56) |
| Mean Seasonal Inland Water (SD) | 1.32 (8.82) | 0.04 (1.14) | 1.46 (7.84) |
| Mean Bare Soil (SD) | 1.50 (2.45) | 0.60 (0.43) | 1.62 (1.35) |
| Mean Grass Vegetation (SD) | 35.83 (3.57) | 36.87 (0.89) | 34.27 (2.31) |
Publisher’s Note: MDPI stays neutral with regard to jurisdictional claims in published maps and institutional affiliations. |
© 2022 by the authors. Licensee MDPI, Basel, Switzerland. This article is an open access article distributed under the terms and conditions of the Creative Commons Attribution (CC BY) license (https://creativecommons.org/licenses/by/4.0/).
Share and Cite
Katile, A.; Sagara, I.; Cissoko, M.; Bationo, C.S.; Dolo, M.; Thera, I.; Traore, S.; Kone, M.; Dembele, P.; Bocoum, D.; et al. Spatio-Temporal Variability of Malaria Incidence in the Health District of Kati, Mali, 2015–2019. Int. J. Environ. Res. Public Health 2022, 19, 14361. https://doi.org/10.3390/ijerph192114361
Katile A, Sagara I, Cissoko M, Bationo CS, Dolo M, Thera I, Traore S, Kone M, Dembele P, Bocoum D, et al. Spatio-Temporal Variability of Malaria Incidence in the Health District of Kati, Mali, 2015–2019. International Journal of Environmental Research and Public Health. 2022; 19(21):14361. https://doi.org/10.3390/ijerph192114361
Chicago/Turabian StyleKatile, Abdoulaye, Issaka Sagara, Mady Cissoko, Cedric Stephane Bationo, Mathias Dolo, Ismaila Thera, Siriman Traore, Mamady Kone, Pascal Dembele, Djoouro Bocoum, and et al. 2022. "Spatio-Temporal Variability of Malaria Incidence in the Health District of Kati, Mali, 2015–2019" International Journal of Environmental Research and Public Health 19, no. 21: 14361. https://doi.org/10.3390/ijerph192114361