Abstract
Permafrost peatlands are a huge carbon pool that is uniquely sensitive to global warming. However, despite the importance of peatlands in global carbon sequestration and biogeochemical cycles, few studies have characterized the distribution characteristics and drivers of soil microbial community structure in forest–peatland ecotones. Here, we investigated the vertical distribution patterns of soil microbial communities in three typical peatlands along an environmental gradient using Illumina high-throughput sequencing. Our findings indicated that bacterial richness and diversity decreased with increasing soil depth in coniferous swamp (LT) and thicket swamp (HT), whereas the opposite trend was observed in a tussock swamp (NT). Additionally, these parameters decreased at 0–20 and 20–40 cm and increased at 40–60 cm along the environmental gradient (LT to NT). Principal coordinate analysis (PCoA) indicated that the soil microbial community structure was more significantly affected by peatland type than soil depth. Actinomycetota, Proteobacteria, Firmicutes, Chloroflexota, Acidobacteriota, and Bacteroidota were the predominant bacterial phyla across all soil samples. Moreover, there were no significant differences in the functional pathways between the three peatlands at each depth, except for amino acid metabolism, membrane transport, cell motility, and signal transduction. Redundancy analysis (RDA) revealed that pH and soil water content were the primary environmental factors influencing the bacterial community structure. Therefore, this study is crucial to accurately forecast potential changes in peatland ecosystems and improve our understanding of the role of peat microbes as carbon pumps in the process of permafrost degradation.
1. Introduction
Permafrost, an indispensable component of the cryosphere, is a collective term used to designate rocks and soils that have been frozen for two years or more [1]. The permafrost layer acts as a natural water barrier, contributing to surface ponding and soil water saturation and making it difficult for numerous plant residues to decompose under anaerobic conditions, ultimately resulting in the accumulation of organic matter into the peat [2]. In turn, deeper frozen soils are protected from solar radiation by the unique thermal properties of peat, thus maintaining permafrost in a stable state [3]. Therefore, peatland environments often co-exist with permafrost in high-latitude regions, exhibiting mutual promotion and synchronous growth and decline. Although peatlands merely occupy approximately 3% of the Earth’s land surface, they contain one-third of the global soil carbon pools and are the ecosystems with the largest carbon storage and the fastest carbon accumulation per unit area on land [4]. The high-latitude regions in the northern hemisphere are warming at a rate 2–3 times higher than the global average, leading to rapid and widespread permafrost degradation, which is manifested primarily by the deepening of the active layer thickness and a northward shift of the southern permafrost boundary [5]. In turn, this exposes large amounts of organic carbon that was previously sequestered in peatlands to enhanced microbial decomposition, which creates positive feedback on climate warming through the release of greenhouse gases (CO2 and CH4) [6].
Soil microbes play a pivotal role as major participants and coordinators of litter decomposition and nutrient transformation, in addition to being the critical biological indicators to characterize the health status of peatland ecosystems [7]. Peatlands are often regarded as nutrient-poor ecosystems, where cold, waterlogged, and acidic conditions, combined with antimicrobial compounds released by Sphagnum palustre and the production of recalcitrant litter, not only limit microbial activity but also likely exert cascading effects on the structure and diversity of microbial communities [8]. The vegetation species composition and soil hydrothermal conditions can be altered by global warming and the melting of massive quantities of ice stored in the permafrost, which influences the ecological stability of peatlands as well as biogeochemical cycling processes regulated by microbes [9]. An ecotone is a transitional zone across different ecosystems that includes characteristic organisms that are unique to the ecotone and elements of both bordering communities, and these zones may be extremely sensitive to global warming [10]. Abiotic soil factors in forest–peatland ecotones have high spatial heterogeneity even at small scales, which likely results in spatially heterogeneous microbial communities [11]. Current studies in boreal forests and peatlands have focused on climate change, carbon storage and mineralization, wetland degradation and restoration, and specific microbial communities [12,13,14]. However, little is known regarding soil microbial communities in forest–peatland ecotones located in high-latitude permafrost regions, which hinders our ability to accurately forecast and evaluate the response mechanisms of permafrost peatland ecosystems to climate change.
The Greater Khingan Mountains are not only the sole distribution area of zonal permafrost in China but also a critical region for the formation and development of peatlands [15]. The permafrost in this region has severely degraded over the past decades in the context of climate warming and anthropogenic disturbance, with its total area decreasing from 3.9 × 10⁵ km2 in the 1970s to its current area of 2.6 × 10⁵ km2 [16]. Peatlands are likely to convert from a sink to a source of atmospheric carbon with ongoing permafrost thaw and increased active layer thickness [17]. Therefore, unraveling the complex interactions among hydrological, microbial, and biogeochemical processes along environmental gradients is crucial to understand the carbon dynamics in permafrost peatlands. In the present study, the microbial communities of three typical peatlands (coniferous swamp, thicket swamp, and tussock swamp) were systematically analyzed across the forest–peatland ecotone in the permafrost region of the Greater Khingan Mountains using Illumina high-throughput sequencing. Specifically, our study aimed to: (1) determine whether microbial diversity and community structure varied along an environmental gradient; and (2) reveal the key environmental factors driving the variations in microbial community structure in peatlands. Therefore, our findings provide crucial insights into the feedback dynamics of peatland ecosystems in high-latitude cold regions in response to future climate change.
2. Materials and Methods
2.1. Study Area
The present study was conducted in the Mohe Forest Ecosystem Research Station (53°17′–53°30′ N, 122°07′–122°27′ E) in the Greater Khingan Mountains, Heilongjiang Province, China (Figure 1). The area exhibits a typical cold temperate continental monsoon climate, with short mild summers followed by long and cold winters. The annual mean temperature is –4.9 °C, with extreme minimum temperatures of –49.7 °C. The frost-free period is 85–110 days, and the annual mean precipitation is 350–500 mm, most of which falls between July and August [18]. This region constitutes the southern extension of the Eurasian cold temperate coniferous forests, and, therefore, its canopy vegetation is dominated by Larix gmelinii, in addition to understory shrubs such as Betula fruticosa, Vaccinium uliginosum, and Rhododendron tomentosum, as well as herbs such as Carex appendiculata and Eriophorum vaginatum [19]. Moreover, the ground cover vegetation is mainly dominated by Sphagnum palustre. The region is characterized by dark brown forest soil with distributions of meadow soil, peat soil, and swamp soil. There is a large amount of continuous permafrost, with the thicknesses of active layer and peat layer of 70–150 cm and 10–90 cm, respectively. The cold environment of the permafrost provides a good foundation for the development of peat swamps.

Figure 1.
Location of the study sites. Red asterisk represents the sampling site.
2.2. Soil Collection and Experimental Design
On the basis of extensive field investigations, three typical peatland types were successively delimited along the transition from forest to peat swamp in a representative natural forest–peatland ecotone. These peatland types included a Larix gmelinii-Vaccinium uliginosum-Sphagnum palustre swamp (LT), a Betula fruticosa-Rhododendron tomentosum-Sphagnum palustre swamp (HT), and a Carex appendiculata-Sphagnum palustre swamp (NT). Three 10 m × 10 m quadrats were randomly established within each sampling type and spaced no less than 10 m apart from each other to ensure the independence of the acquired experimental data. Additionally, five soil cores (diameter 5 cm) were collected from each depth (upper 0–20 cm, middle 20–40 cm, and bottom 40–60 cm) in all quadrats using a soil sampler according to the “S” route, and were thoroughly mixed into a single composite sample. The composite samples were placed in an ice box with labeled air-tight plastic bags, then transported immediately to the laboratory. After removing stones, plant roots, and other detritus, the samples were first passed through a 2 mm sieve and then divided into two parts. The first part was naturally air-dried to determine the physicochemical properties of the soil, whereas the second part was stored in a refrigerator at –80 °C until the microbial DNA extraction.
2.3. Physicochemical Parameter Measurements
Soil pH was detected in a 1:2.5 soil/water mixture using a calibrated PHS-3E pH meter (Shanghai, China). Soil total organic carbon (TOC) was assessed with a Multi N/C 3100 analyzer (Jena, Germany). Soil total nitrogen (TN) was determined using a FIAstar 5000 analyzer (Sweden) based on the Kjeldahl method. Soil total phosphorus (TP) was calculated via the molybdenum blue method after digesting the soil samples with an H2SO4/HClO4 solution. Soil ammonium nitrogen (NH4+-N) and nitrate nitrogen (NO3–-N) were quantified with a San++ continuous flow analyzer (Skalar, The Netherlands). Soil water content (SWC) was measured gravimetrically by drying the soil samples to a constant weight at 105 °C for 24 h.
2.4. DNA Extraction, PCR Amplification, and Illumina Sequencing
Total genomic DNA was isolated from soil samples using the PowerSoil® DNA Isolation Kit (MoBio Inc., Carlsbad, CA, USA) according to the manufacturer′s instructions. All extractions were made in triplicate. Universal primers 338F (5′-ACTCCTACGGGAGGCAGCAG-3′) and 806R (5′-GGACTACHVGGGTWTCTAAT-3′) were used to amplify the V3-V4 variable regions of the bacterial 16S rRNA gene using a thermocycler PCR system (GeneAmp 9700, ABI, Vernon, CA, USA). The primers were tagged with a pad, a linker, and an adaptor, and each sample was assigned a unique barcode sequence. The thermal program consisted of an initial denaturation step at 95 °C for 3 min, followed by 27 cycles of denaturation at 95 °C for 30 s, annealing at 55 °C for 30 s, and extension at 72 °C for 45 s, and a final extension step at 72 °C for 10 min [20]. The triplicate PCR products per sample were pooled, then were purified using the AxyPrep DNA Gel Extraction Kit (Axygen Biosciences, Union City, CA, USA) and quantified using the QuantiFluor™-ST (Promega, Madison, WI, USA). The normalized PCR products were submitted for Illumina MiSeq high-throughput sequencing at Majorbio Bio-pharm Technology Co., Ltd. (Shanghai, China).
2.5. Data Processing
The raw reads obtained from the Illumina MiSeq platform were preprocessed using QIIME (version 1.9.1) [21]. Paired-end reads with at least 50 bp overlap and <5% mismatches were merged using FLASH (version 1.2.11), and low-quality sequences (average quality score < 30) were discarded [22]. Any joined sequences with ambiguous bases or reads that could not be assembled were excluded from further analysis. The filtered sequences with lengths between 240 bp and 260 bp were subsequently subjected to chimera removal using USEARCH (version 11) [23]. The obtained high-quality sequences were then clustered into operational taxonomic units (OTU) with a 97% similarity cutoff using UPARSE (version 11) [24]. Each OTU representative was taxonomically annotated using the RDP classifier (version 2.13) against the SILVA_138 database [25]. One-way ANOVA was conducted in SPSS 22.0 to test the significance (p < 0.05) of differences in soil physicochemical characteristics among different samples [26]. The alpha diversity indices (Shannon, Simpson, ACE, and Chao1 indices) of the microbial community were calculated using Mothur (version 1.30.2) [27]. Differences in community composition between samples were detected by principal coordinate analysis (PCoA) via QIIME (version 1.9.1) [28]. Redundancy analysis (RDA) was conducted to identify the relationships between bacterial community structure and environmental parameters using CANOCO 5.0 [29]. The potential function pathways from the 16S rRNA gene sequencing data were profiled using Tax4Fun (version 0.3.1) [30].
3. Results
3.1. Soil Physicochemical Characteristics
Soil pH ranged from 4.73 to 5.16, with the lowest and highest values occurring in the 20–40 cm soil layer of the LT and NT peatlands, respectively (Table 1). Moreover, the pH value was markedly lower in LT than in NT at all depths (p < 0.05). The total organic carbon (TOC), nitrate nitrogen (NO3--N), and soil water content (SWC) decreased with increased depth in all three peatland types, and were markedly higher in NT than in LT at each depth (p < 0.05). Soil total nitrogen (TN), total phosphorus (TP), and ammonium nitrogen (NH4+-N) were markedly higher at 0–20 cm and 20–40 cm than at 40–60 cm across the three peatlands (p < 0.05). The TP content differed significantly between different soil depths and peaked in NT at a 0–20 cm soil depth (3.67 g/kg). At 0–20 cm, the NH4+-N content was markedly lower in HT and NT than in LT, whereas no significant differences between the three peatlands were observed at 20–40 and 40–60 cm (p > 0.05).

Table 1.
Soil physicochemical properties of different peatland types at three depths.
3.2. Richness and Diversity of the Soil Bacterial Community
A total of 1,098,262 high-quality sequences targeting the 16S rRNA gene with an average length of 416 bp were obtained. A Venn diagram was then generated to compare the differences and similarities between samples. A total of 156 OTUs were shared by all samples, with each site having its own unique OTUs (Figure 2). Interestingly, the number of unique OTUs in LT and HT decreased with soil depth, whereas the opposite trend was observed in NT. The highest and lowest specific OTU numbers were detected at 0–20 cm in LT (423) and NT (30), respectively.

Figure 2.
Venn diagram of the number of shared and unique OTUs across all soil samples.
The bacterial Shannon, ACE, and Chao1 indices in LT and HT decreased significantly with increasing soil depth, and were markedly higher at 0–20 cm and 20–40 cm and markedly lower at 40–60 cm than in NT (p < 0.05) (Table 2). The Simpson index reached a maximum and a minimum in NT (0.023) and LT (0.007) at 0–20 cm, respectively, and was markedly lower in LT than in NT at 20–40 cm, whereas the opposite trend was observed at the 40–60 cm depth. Furthermore, the Simpson index at 0–20 cm was markedly lower in LT and markedly higher in NT than at 40–60 cm (p < 0.05).
Table 2.
Soil bacterial alpha diversity indices.
The PCoA results demonstrated that the cumulative contribution rate of PC1 and PC2 was 77.02%, with PC1 accounting for 47.66% (Figure 3). The soil samples were divided into three clusters according to the spatial distribution distance, indicating a more similar soil bacterial community structure in the same peatland, whereas no significant difference was detected at different depths. Therefore, the soil bacterial community composition appeared to be remarkably dependent on peatland type rather than soil depth.

Figure 3.
Principal coordinate analysis (PCoA) of soil bacterial community.
3.3. Composition and Structure of the Soil Bacterial Community
A total of 15 bacterial phyla with a relative abundance greater than 1% were observed, among which the dominant phyla were Actinomycetota (18.10–31.22%), Proteobacteria (4.57–23.83%), Firmicutes (1.22–23.16%), Chloroflexota (10.09%#x2013;20.36%), Acidobacteriota (5.51–20.11%), and Bacteroidota (3.08–10.57%) (Figure 4a). Along the soil depth gradients, the relative abundance of Actinomycetota tended to decrease first and then increase in LT, whereas the opposite trend was observed in NT. The relative abundances of Proteobacteria and Acidobacteriota were markedly higher in LT and HT than those in NT at each depth, whereas the relative abundance of Firmicutes showed the opposite trend. The relative abundance of Chloroflexota was higher in NT than in LT and HT at all depths, but the difference was not significant (p > 0.05). The relative abundance of Bacteroidota was highest in HT compared to both LT and NT at each depth.


Figure 4.
Characteristics of bacterial community composition at the phylum (a) level and genus (b) level.
At the genus level, the soil samples were dominated by Gaiella (2.99–13.88%), Alicyclobacillus (0–12.30%), KD4-96 (5.40–10.57%), Oryzihumus (0.39–10.18%), Caldisericum (0–9.99%), Pseudolabrys (0.28–6.62%), Candidatus_Solibacter (0.53–5.97%), norank_o__Subgroup_7 (1.07–5.21%), and norank_f__Bacteroidetes_vadinHA17 (1.06–5.09%) (Figure 4b). Among them, the relative abundance of Gaiella was higher in NT than in LT and HT at each depth, whereas the relative abundances of Pseudolabrys and norank_o__Subgroup_7 exhibited the opposite trend. Alicyclobacillus and Caldisericum occurred only in HT and NT, and their relative abundances varied greatly between samples, peaking at 40–60 cm and 0–20 cm in NT, respectively. There was no significant difference in the relative abundance of KD4-96 among the different samples (p > 0.05). The relative abundance of Oryzihumus in LT was markedly lower at 0–20 cm and 20–40 cm and markedly higher at 40–60 cm than that in HT and NT (p < 0.05). Moreover, HT exhibited the highest relative abundances of Candidatus_Solibacter and norank_f__Bacteroidetes_vadinHA17 compared to both LT and NT at each depth.
Significant differences between the three peatlands at the phylum level were further detected at different depths. The relative abundances of Proteobacteria, Acidobacteriota, Firmicutes, Gemmatimonadota, Caldisericota, and MBNT15 among different peatlands varied significantly at each depth, whereas the relative abundance of Methylomirabilota only differed markedly at 0–20 cm and 20–40 cm (Figure 5). Additionally, extremely significant differences in the relative abundances of Proteobacteria and Firmicutes were observed between the three peatlands at all depths, whereas extremely significant differences in Caldisericota abundance were only observed at 0–20 cm.

Figure 5.
Analyses of significant differences in bacterial relative abundance at the phylum level between three peatlands at 0–20 (a), 20–40 (b), and 40–60 (c) cm depths. * means significant at p < 0.05, ** means significant at p < 0.01.
3.4. Functional Metabolic Pathways
A total of 18 metabolic pathways in level 2 had a relative abundance greater than 1%, of which amino acid metabolism (11.47–13.52%), carbohydrate metabolism (11.92–13.03%), and membrane transport (10.67–12.86%) accounted for the highest proportions compared with other pathways (Figure 6). The relative abundance of amino acid metabolism was markedly lower in LT and HT than that in NT at 0–20 cm, whereas the relative abundances of membrane transport and cell motility exhibited the opposite trend. The relative abundance of signal transduction at 20–40 cm was markedly lower in NT than in LT and HT (p < 0.05). Other functional metabolic pathways did not differ significantly among the three peatlands at each depth.
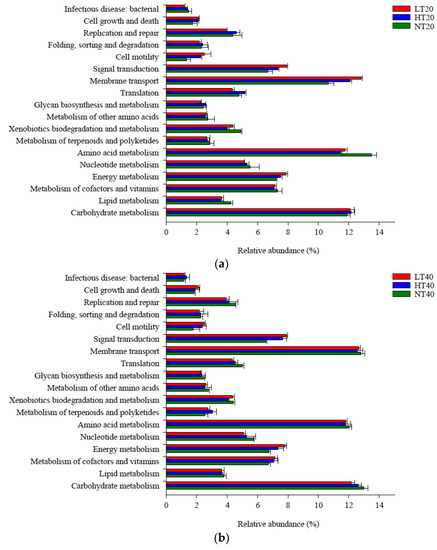

Figure 6.
Level 2 functional metabolic pathways with a relative abundance greater than 1% in soil bacterial community at 0–20 (a), 20–40 (b), and 40–60 (c) cm depths.
3.5. Relationship between Environmental Properties and Soil Bacterial Communities
Two coordinates explained 44.79% and 21.71% of the total variance in RDA, respectively (Figure 7). Moreover, our findings indicated that the impacts of environmental factors on the bacterial community structure presented the following descending order: pH (F = 3.6, p = 0.008) > SWC (F = 3.1, p = 0.030) > NO3−-N (F = 2.4, p = 0.106) > TP (F = 1.7, p = 0.151) > TOC (F = 1.6, p = 0.248) > NH4+-N (F = 0.8, p = 0.564) > TN (F = 0.5, p = 0.846). Among them, pH and SWC significantly affected the whole bacterial community structure.
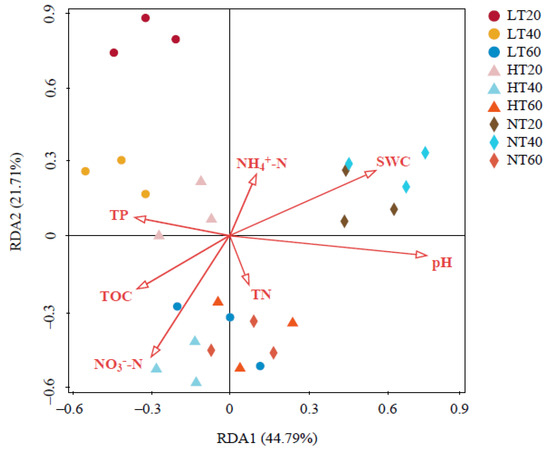
Figure 7.
Redundancy analysis (RDA) of the relationship between soil physicochemical properties and bacterial community structure. TOC: total organic carbon; TN: total nitrogen; TP: total phosphorus; NH4+-N: ammonium nitrogen; NO3−-N: nitrate nitrogen; SWC: soil water content.
4. Discussion
The ecotone between forests and peatlands is a dynamic zone characterized by higher biological diversity, nutrient supply, and productivity [31]. Due to these properties, this area is expected to have highly abundant microbial communities. Additionally, the micro-topographical gradients within peatlands create vegetation and chemical gradients that can regulate available niches at small scales, and this vertical stratification further stratifies the microbial communities due to alterations in energy constraints and redox conditions with increasing depth [8]. Our results may also reflect the sensitivity of microbial community richness and diversity to spatial changes and related soil physicochemical properties. There is a gradual transition in vegetation from mainly arbors to mainly herbs along the forest–peatland environmental gradient (LT to NT). Soil nutrient availability is closely related to vegetation species, as the living plant biomass, leachates, root exudates, and litter vary by plant species, thus strongly affecting the diversity and composition of microbial communities in peatlands [32]. The richness and diversity of microbial communities decreased with the succession of surface vegetation at 0–20 and 20–40 cm soil depths, which could be partially attributed to a reduction in chemically diverse plant material inputs. Larix gmelinii and Betula fruticosa produce more litter and root exudates than Carex appendiculata, thereby supporting enriched microbial communities [33]. This may not only explain why the diversity of LT and HT is markedly higher than that of NT at 0–20 and 20–40 cm but also suggests that more favorable soil and environmental conditions tend to exist in woody-dominated peatlands rather than herb-dominated peatlands. However, unlike LT and HT, NT exhibited the highest diversity and number of unique OTUs at 40–60 cm. Moreover, we found that the average depth of the soil active layer in the NT site was only 63 cm, which was markedly shallower than that in LT (149 cm) and HT (116 cm). The transition layer (40–60 cm) in the permafrost interface has several restraining factors, such as limited substrate quality contents, low temperature, and increasingly anaerobic conditions. Additionally, the soil active layer experiences seasonal freeze-thaw cycles, in which downward propagation of the freezing front results in mobilization of essential macro- and micro-nutrients at the active layer boundary as well as larger environmental fluctuations, which favors the growth of microbes [34]. Moreover, permafrost peatlands provide stratified and heterogeneous habitats for microbial communities because of seasonal freeze-thaw cycles restricted in the active layer, stratified soil conditions caused by different organic/mineral materials, as well as vertical gradients of pH, C and N contents, and other conditions, which may lead to niche separation and subsequent variations in microbial diversity between different soil layers [35]. Studies by Li et al. [36] and Song et al. [37] also demonstrated that the genetic diversity of soil microbial populations was greatest at the active layer boundary in high-latitude permafrost ecosystems. Hence, shifts in microbial diversity suggest the biogeochemical “hotspot” extends downward as the active layer thickness deepens, highlighting the necessity of considering depth stratification in exploring the responses of peatland microbial communities to global warming.
Actinomycetota, Proteobacteria, Firmicutes, Chloroflexota, and Acidobacteriota were the predominant soil bacterial taxa in our study, which was consistent with a number of other comprehensive studies on peatlands [38,39]. We would like to emphasize that Actinomycetota detected in this region were not strongly influenced by environmental variables, as the differences observed between soil samples were not significant. Therefore, Actinomycetota, which specialize in degrading high-molecular-weight organic matter including carbohydrates and proteins, appear to be highly resilient to changing environmental conditions in permafrost peatlands [40]. Root exudates, which were mainly enriched in the 0–60 cm soil layer of LT and HT, enhanced the growth of Proteobacteria (copiotrophic bacteria) but suppressed the growth of Firmicutes and Chloroflexota (oligotrophic bacteria), which was consistent with previous research on microbial catabolic activities in peatlands [41]. This might be the reason why Proteobacteria were more abundant in LT and HT, whereas Firmicutes and Chloroflexota were more dominant in NT. Soil pH is known to be a strong determinant of the distribution and abundance of Acidobacteriota. In our study, the abundance of Acidobacteriota clearly decreased as pH increased from LT to NT. Similarly, Hartman et al. [42] reported that the abundance of Acidobacteriota was negatively correlated with pH. Furthermore, some members of the Acidobacteriota, which possess a wide range of transporters for the absorption of multiple substrates, can readily adapt to oligotrophic conditions and complex environments [43]. Therefore, their relative abundance was higher in LT and HT, which contained less organic matter compared with NT. These differences suggested that these phyla were likely sensitive to changes in habitat conditions such as vegetation and peat soil characteristics. Although bacterial community composition varied considerably across peatlands and depths, the peatland type had the greatest influence, as demonstrated by the clustering of the community composition based on PCoA. We hypothesized that the quality and quantity of litter inputs among vegetation species differed greatly in permafrost peatland ecosystems, thus affecting the microbial community composition. The roles played by vegetation changes on microbial communities should be enhanced at longer time scales, and the integrated responses of microbial communities along the environmental gradient (LT to NT) probably impact the release of CO2 and CH4 from peatlands in the context of different climate changes.
In line with previous observations, our findings demonstrated that diverse functional metabolic pathways involved in microbial communities did not differ significantly between three peatlands at each depth [44]. This suggests that the alterations in the microbial community composition were not necessarily related to the shifts in microbial functions, which might be explained as a functional redundancy of microbes inhabiting in soils. The distinct patterns of functional metabolic pathways and microbial taxonomy were likely attributable to the more prominent roles played by certain less abundant microbial taxa in soil ecological processes. Given that most soil microbes may have similar functional genes, the fluctuations in taxonomic structure along the environmental gradient (LT to NT) do not necessarily change the microbial function structure. Similarly weak connections between functional metabolic pathways and microbial taxonomy were previously detected in swamp peatlands, subtropical hardwood forests, Antarctic soils, and microbial stream biofilms, which further confirmed our findings [45,46,47,48].
The RDA results revealed that pH and SWC were the key environmental factors controlling soil bacterial community distribution in the permafrost peatlands of the Greater Khingan Mountains. Bacteria generally survive, grow, and reproduce at pH values between 4 and 8 [49]. Soil pH is not likely to directly alter the bacterial community structure but serve as a composite variable providing integrated indices of soil conditions [39]. Meanwhile, it is also a complex parameter associated with climate, parent material, mineral weathering, and vegetation [50]. Numerous soil properties including cationic metal solubility, nutrient availability, salinity, and soil moisture status are often indirectly or directly linked to the soil pH and may drive the detected variations in community structure [44]. Zhang et al. [51] concluded that the fluctuation range of pH was the most vital factor affecting microbial communities. To some extent, this could explain why the bacterial community structure varied more between peatland types than among profile depths in our study, as the fluctuation of pH across the three peatlands was greater than that along profiles (4.73–4.89 in the LT profile; 4.85–5.04 in the HT profile; 5.09–5.13 in the NT profile). Our finding that soil pH played a pivotal role in determining soil microbial community structure was consistent with a number of previous studies [52,53]. The direct control of SWC over the oxidation–deoxidation environment is an important mechanism for SWC to affect soil microbial communities, which is crucial for the survival of microbes. Long-term differences in soil redox conditions and water content in micro-topography are able to impact the related biogeochemical functions [54]. The relatively anaerobic environment induced by higher soil water content inhibited the growth of aerobic bacteria but was conducive to the growth of anaerobic bacteria [55]. Additionally, the changes in vegetation composition caused by changes in hydrological conditions can result in variations in the quality of roots and litter. In turn, this further influences the soil bacterial communities by shifting the TOC levels and providing different types of carbon sources [56]. Our research also further speculated that substantial changes in peatland biogeochemistry and biota would occur if climate change contributed to variations in vegetation community composition in the permafrost peatlands of the Greater Khingan Mountains. The critical variables that controlled the function and structure of peatland ecosystems varied considerably even within the short spatial distances studied herein.
5. Conclusions
The results of our Illumina high-throughput sequencing analyses revealed considerable variations in microbial community richness, diversity, and structure between three typical peatlands at different depths across a forest–peatland ecotone. The relative abundances of Proteobacteria and Bacteroidota decreased greatly, whereas the relative abundances of Acidobacteriota and Chloroflexota increased along the forest–peatland environmental gradient (LT to NT). The alterations in bacterial community structure were better explained by the peatland type than the soil depth. Moreover, soil pH and SWC are key factors shaping soil bacterial community structure in permafrost peatlands. Climate change will likely alter vegetation communities and their relationships with soil microbial communities in the peatlands of the high-latitude cold regions. It is necessary to comprehend the linkage responses of soil microbial and vegetation communities in the peatlands of high-latitude cold regions to permafrost degradation for preferably predicting the future function of permafrost peatlands.
Author Contributions
Conceptualization, L.L. and D.M.; Data curation, Z.W., L.L. and D.M.; Software, M.Z.; Methodology, L.F.; Investigation, M.Z. and L.F.; Writing—original draft, L.L., Z.W. and D.M.; Writing—review and editing, L.L. and D.M. All authors have read and agreed to the published version of the manuscript.
Funding
This study was jointly funded by the National Natural Science Foundation of China (42171127), the Postdoctoral Scientific Research Starting Foundation of Heilongjiang Province (LBH-Q21022), and Harbin Normal University Graduate Innovative Research Project (HSDSSCX2022-06).
Institutional Review Board Statement
Not applicable.
Informed Consent Statement
Not applicable.
Data Availability Statement
Data are not publicly available, though the data may be made available on request from the corresponding author.
Conflicts of Interest
The authors declare no conflict of interest.
References
- Jansson, J.K.; Taş, N. The microbial ecology of permafrost. Nat. Rev. Microbiol. 2014, 12, 414–425. [Google Scholar] [CrossRef]
- Pastukhov, A.V.; Kaverin, D.A. Ecological state of peat plateaus in northeastern European Russia. Russ. J. Ecol. 2016, 47, 125–132. [Google Scholar] [CrossRef]
- Du, R.; Peng, X.Q.; Frauenfeld, O.W.; Sun, W.; Liang, B.B.; Chen, C.; Jin, H.D.; Zhao, Y.H. The role of peat on permafrost thaw based on field observations. Catena 2022, 208, 105772. [Google Scholar] [CrossRef]
- Kluber, L.A.; Johnston, E.R.; Allen, S.A.; Hendershot, J.N.; Hanson, P.J.; Schadt, C.W. Constraints on microbial communities, decomposition and methane production in deep peat deposits. PLoS ONE 2020, 15, e0223744. [Google Scholar] [CrossRef]
- Sim, T.G.; Swindles, G.T.; Morris, P.J.; Baird, A.J.; Cooper, C.L.; Gallego-Sala, A.V.; Charman, D.J.; Roland, T.P.; Borken, W.; Mullan, D.J.; et al. Divergent responses of permafrost peatlands to recent climate change. Environ. Res. Lett. 2021, 16, 034001. [Google Scholar] [CrossRef]
- Turetsky, M.R.; Wieder, R.K.; Vitt, D.H.; Evans, R.J.; Scott, K.D. The disappearance of relict permafrost in boreal north America: Effects on peatland carbon storage and fluxes. Glob. Chang. Biol. 2007, 13, 1922–1934. [Google Scholar] [CrossRef]
- Naylor, D.; McClure, R.; Jansson, J. Trends in Microbial Community Composition and Function by Soil Depth. Microorganisms 2022, 10, 540. [Google Scholar] [CrossRef]
- Andersen, R.; Chapman, S.J.; Artz, R.R.E. Microbial communities in natural and disturbed peatlands: A review. Soil Biol. Biochem. 2013, 57, 979–994. [Google Scholar] [CrossRef]
- Swindles, G.T.; Morris, P.J.; Mullan, D.; Watson, E.J.; Turner, T.E.; Roland, T.P.; Amesbury, M.J.; Kokfelt, U.; Schoning, K.; Pratte, S.; et al. The long-term fate of permafrost peatlands under rapid climate warming. Sci. Rep. 2015, 5, 17951. [Google Scholar] [CrossRef]
- Dimitrov, D.D.; Bhatti, J.S.; Grant, R.F. The transition zones (ecotone) between boreal forests and peatlands: Ecological controls on ecosystem productivity along a transition zone between upland black spruce forest and a poor forested fen in central Saskatchewan. Ecol. Model. 2014, 291, 96–108. [Google Scholar] [CrossRef]
- Briones, M.J.I.; Juan-Ovejero, R.; McNamara, N.P.; Ostle, N.J. Microbial “hotspots” of organic matter decomposition in temperate peatlands are driven by local spatial heterogeneity in abiotic conditions and not by vegetation structure. Soil Biol. Biochem. 2022, 165, 108501. [Google Scholar] [CrossRef]
- Wu, X.W.; Zang, S.Y.; Ma, D.L.; Ren, J.H.; Chen, Q.; Dong, X.F. Emissions of CO2, CH4, and N2O Fluxes from Forest Soil in Permafrost Region of Daxing’an Mountains, Northeast China. Int. J. Env. Res. Public Health 2019, 16, 2999. [Google Scholar] [CrossRef]
- Laine, A.M.; Mehtätalo, L.; Tolvanen, A.; Frolking, S.; Tuittila, E.-S. Impacts of drainage, restoration and warming on boreal wetland greenhouse gas fluxes. Sci. Total Environ. 2019, 647, 169–181. [Google Scholar] [CrossRef]
- Jaatinen, K.; Laiho, R.; Vuorenmaa, A.; Del Castillo, U.; Minkkinen, K.; Pennanen, T.; Penttilä, T.; Fritze, H. Responses of aerobic microbial communities and soil respiration to water-level drawdown in a northern boreal fen. Environ. Microbiol. 2008, 10, 339–353. [Google Scholar] [CrossRef]
- Jiang, L.; Song, Y.Y.; Sun, L.; Ma, X.Y.; Wang, X.W.; Song, C.C.; Hou, A.X.; Wang, L.L. Distribution of carbon and nitrogen cycle microbes along permafrost peatland profile in Northeast China. Environ. Prog. Sustain. 2021, 40, e13707. [Google Scholar] [CrossRef]
- Jin, H.J.; Yu, Q.H.; Lü, L.Z.; Guo, D.X.; He, R.X.; Yu, S.P.; Sun, G.Y.; Li, Y.W. Degradation of permafrost in the Xing’anling Mountains, northeastern China. Permafr. Periglac. Process. 2007, 18, 245–258. [Google Scholar] [CrossRef]
- Wang, S.R.; Zhuang, Q.L.; Lähteenoja, O.; Draper, F.C.; Cadillo-Quiroz, H. Potential shift from a carbon sink to a source in Amazonian peatlands under a changing climate. Proc. Natl. Acad. Sci. USA 2018, 115, 12407–12412. [Google Scholar] [CrossRef]
- Xu, Z.P.; Man, X.L.; Duan, L.L.; Cai, T.J. Improved subsurface soil moisture prediction from surface soil moisture through the integration of the (de)coupling effect. J. Hydrol. 2022, 608, 127634. [Google Scholar] [CrossRef]
- Xiao, R.H.; Man, X.L.; Duan, B.X.; Cai, T.J.; Ge, Z.X.; Li, X.F.; Vesala, T. Changes in soil bacterial communities and nitrogen mineralization with understory vegetation in boreal larch forests. Soil Biol. Biochem. 2022, 166, 108572. [Google Scholar] [CrossRef]
- Wu, Y.; Wu, J.P.; Saleem, M.; Wang, B.; Hu, S.J.; Bai, Y.F.; Pan, Q.M.; Chen, D.M. Ecological clusters based on responses of soil microbial phylotypes to precipitation explain ecosystem functions. Soil Biol. Biochem. 2020, 142, 107717. [Google Scholar] [CrossRef]
- Caporaso, J.G.; Kuczynski, J.; Stombaugh, J.; Bittinger, K.; Bushman, F.D.; Costello, E.K.; Fierer, N.; Peña, A.G.; Goodrich, J.K.; Gordon, J.I.; et al. QIIME allows analysis of high-throughput community sequencing data. Nat. Methods 2010, 7, 335–336. [Google Scholar] [CrossRef]
- Magoč, T.; Salzberg, S.L. FLASH: Fast length adjustment of short reads to improve genome assemblies. Bioinformatics 2011, 27, 2957–2963. [Google Scholar] [CrossRef]
- Edgar, R.C. Search and clustering orders of magnitude faster than BLAST. Bioinformatics 2010, 26, 2460–2461. [Google Scholar] [CrossRef]
- Edgar, R.C. UPARSE: Highly accurate OTU sequences from microbial amplicon reads. Nat. Methods 2013, 10, 996–998. [Google Scholar] [CrossRef]
- Wang, Q.; Garrity, G.M.; Tiedje, J.M.; Cole, J.R. Naïve Bayesian Classifier for Rapid Assignment of rRNA Sequences into the New Bacterial Taxonomy. Appl. Environ. Microb. 2007, 73, 5261–5267. [Google Scholar] [CrossRef]
- Pan, X.M.; Zhang, S.R.; Zhong, Q.M.; Gong, G.S.; Wang, G.Y.; Guo, X.; Xu, X.X. Effects of soil chemical properties and fractions of Pb, Cd, and Zn on bacterial and fungal communities. Sci. Total Environ. 2020, 715, 136904. [Google Scholar] [CrossRef]
- Schloss, P.D.; Westcott, S.L.; Ryabin, T.; Hall, J.R.; Hartmann, M.; Hollister, E.B.; Lesniewski, R.A.; Oakley, B.B.; Parks, D.H.; Robinson, C.J.; et al. Introducing mothur: Open-Source, Platform-Independent, Community-Supported Software for Describing and Comparing Microbial Communities. Appl. Environ. Microb. 2009, 75, 7537–7541. [Google Scholar] [CrossRef]
- Hall, M.; Beiko, R.G. 16S rRNA Gene Analysis with QIIME2. Methods Mol. Biol. 2018, 1849, 113–129. [Google Scholar] [CrossRef]
- Šmilauer, P.; Lepš, J. Multivariate Analysis of Ecological Data using Canoco 5; Cambridge University Press: Cambridge, UK, 2014. [Google Scholar]
- Aßhauer, K.P.; Wemheuer, B.; Daniel, R.; Meinicke, P. Tax4Fun: Predicting functional profiles from metagenomic 16S rRNA data. Bioinformatics 2015, 31, 2882–2884. [Google Scholar] [CrossRef]
- Wang, J.Y.; Song, C.C.; Zhang, J.; Wang, L.L.; Zhu, X.Y.; Shi, F.X. Temperature sensitivity of soil carbon mineralization and nitrous oxide emission in different ecosystems along a mountain wetland-forest ecotone in the continuous permafrost of Northeast China. Catena 2014, 121, 110–118. [Google Scholar] [CrossRef]
- Chu, H.Y.; Grogan, P. Soil microbial biomass, nutrient availability and nitrogen mineralization potential among vegetation-types in a low arctic tundra landscape. Plant Soil 2010, 329, 411–420. [Google Scholar] [CrossRef]
- Zhang, X.H.; Jiang, W.; Jiang, S.S.; Tan, W.W.; Mao, R. Differential responses of litter decomposition in the air and on the soil surface to shrub encroachment in a graminoid-dominated temperate wetland. Plant Soil 2021, 462, 477–488. [Google Scholar] [CrossRef]
- Ren, B.H.; Hu, Y.M.; Bu, R.C. Vertical distribution patterns and drivers of soil bacterial communities across the continuous permafrost region of northeastern China. Ecol. Process. 2022, 11, 6. [Google Scholar] [CrossRef]
- Deng, J.; Gu, Y.F.; Zhang, J.; Xue, K.; Qin, Y.J.; Yuan, M.T.; Yin, H.Q.; He, Z.L.; Wu, L.Y.; Schuur, E.A.G.; et al. Shifts of tundra bacterial and archaeal communities along a permafrost thaw gradient in Alaska. Mol. Ecol. 2015, 24, 222–234. [Google Scholar] [CrossRef] [PubMed]
- Li, X.; Cui, Y.Q.; Ma, D.L.; Song, D.D.; Liu, L. Vertical distribution of bacterial community diversity in the Greater Khingan Mountain permafrost region. Ecol. Evol. 2022, 12, e9106. [Google Scholar] [CrossRef]
- Song, D.D.; Cui, Y.Q.; Ma, D.L.; Li, X.; Liu, L. Spatial Variation of Microbial Community Structure and Its Driving Environmental Factors in Two Forest Types in Permafrost Region of Greater Xing’an Mountains. Sustainability 2022, 14, 9284. [Google Scholar] [CrossRef]
- Aksenov, A.S.; Shirokova, L.S.; Kisil, O.Y.; Kolesova, S.N.; Lim, A.G.; Kuzmina, D.; Pouillé, S.; Alexis, M.A.; Castrec-Rouelle, M.; Loiko, S.V.; et al. Bacterial Number and Genetic Diversity in a Permafrost Peatland (Western Siberia): Testing a Link with Organic Matter Quality and Elementary Composition of a Peat Soil Profile. Diversity 2021, 13, 328. [Google Scholar] [CrossRef]
- St James, A.R.; Lin, J.; Richardson, R.E. Relationship Between Peat Type and Microbial Ecology in Sphagnum-Containing Peatlands of the Adirondack Mountains, NY, USA. Microb. Ecol. 2021, 82, 429–441. [Google Scholar] [CrossRef]
- Peltoniemi, K.; Fritze, H.; Laiho, R. Response of fungal and actinobacterial communities to water-level drawdown in boreal peatland sites. Soil Biol. Biochem. 2009, 41, 1902–1914. [Google Scholar] [CrossRef]
- Morgalev, Y.N.; Lushchaeva, I.V.; Morgaleva, T.G.; Kolesnichenko, L.G.; Loiko, S.V.; Krickov, I.V.; Lim, A.; Raudina, T.V.; Volkova, I.I.; Shirokova, L.S.; et al. Bacteria primarily metabolize at the active layer/permafrost border in the peat core from a permafrost region in western Siberia. Polar Biol. 2017, 40, 1645–1659. [Google Scholar] [CrossRef]
- Hartman, W.H.; Richardson, C.J.; Vilgalys, R.; Bruland, G.L. Environmental and anthropogenic controls over bacterial communities in wetland soils. Proc. Natl. Acad. Sci. USA 2008, 105, 17842–17847. [Google Scholar] [CrossRef] [PubMed]
- Espenberg, M.; Truu, M.; Mander, Ü.; Kasak, K.; Nõlvak, H.; Ligi, T.; Oopkaup, K.; Maddison, M.; Truu, J. Differences in microbial community structure and nitrogen cycling in natural and drained tropical peatland soils. Sci. Rep. 2018, 8, 4742. [Google Scholar] [CrossRef] [PubMed]
- Bai, R.; Wang, J.T.; Deng, Y.; He, J.Z.; Feng, K.; Zhang, L.M. Microbial Community and Functional Structure Significantly Varied among Distinct Types of Paddy Soils but Responded Differently along Gradients of Soil Depth Layers. Front. Microbiol. 2017, 8, 945. [Google Scholar] [CrossRef] [PubMed]
- Haynes, K.M.; Preston, M.D.; McLaughlin, J.W.; Webster, K.; Basiliko, N. Dissimilar bacterial and fungal decomposer communities across rich to poor fen peatlands exhibit functional redundancy. Can. J. Soil Sci. 2015, 95, 219–230. [Google Scholar] [CrossRef]
- Ding, J.J.; Zhang, Y.G.; Wang, M.M.; Sun, X.; Cong, J.; Deng, Y.; Lu, H.; Yuan, T.; Van Nostrand, J.D.; Li, D.Q.; et al. Soil organic matter quantity and quality shape microbial community compositions of subtropical broadleaved forests. Mol. Ecol. 2015, 24, 5175–5185. [Google Scholar] [CrossRef]
- Yergeau, E.; Kang, S.; He, Z.; Zhou, J.; Kowalchuk, G.A. Functional microarray analysis of nitrogen and carbon cycling genes across an Antarctic latitudinal transect. ISME J. 2007, 1, 163–179. [Google Scholar] [CrossRef]
- Dopheide, A.; Lear, G.; He, Z.L.; Zhou, J.Z.; Lewis, G.D. Functional Gene Composition, Diversity and Redundancy in Microbial Stream Biofilm Communities. PLoS ONE 2015, 10, e0123179. [Google Scholar] [CrossRef] [PubMed]
- Lauber, C.L.; Hamady, M.; Knight, R.; Fierer, N. Pyrosequencing-Based Assessment of Soil pH as a Predictor of Soil Bacterial Community Structure at the Continental Scale. Appl. Environ. Microb. 2009, 75, 5111–5120. [Google Scholar] [CrossRef] [PubMed]
- Xu, M.; Li, X.L.; Cai, X.B.; Gai, J.P.; Li, X.L.; Christie, P.; Zhang, J.L. Soil microbial community structure and activity along a montane elevational gradient on the Tibetan Plateau. Eur. J. Soil Biol. 2014, 64, 6–14. [Google Scholar] [CrossRef]
- Zhang, X.K.; Wang, H.L.; Li, Z.F.; Xie, J.; Ni, J.J. Hydrological and soil physiochemical variables determine the rhizospheric microbiota in subtropical lakeshore areas. PeerJ 2020, 8, e10078. [Google Scholar] [CrossRef]
- Griffiths, R.I.; Thomson, B.C.; James, P.; Bell, T.; Bailey, M.; Whiteley, A.S. The bacterial biogeography of British soils. Environ. Microbiol. 2011, 13, 1642–1654. [Google Scholar] [CrossRef] [PubMed]
- Tripathi, B.M.; Kim, M.; Tateno, R.; Kim, W.; Wang, J.J.; Lai-Hoe, A.; Shukor, N.A.; Rahim, R.A.; Go, R.; Adams, J.M. Soil pH and biome are both key determinants of soil archaeal community structure. Soil Biol. Biochem. 2015, 88, 1–8. [Google Scholar] [CrossRef]
- Wang, M.; Han, Y.Y.; Xu, Z.W.; Wang, S.Z.; Jiang, M.; Wang, G.D. Hummock-hollow microtopography affects soil enzyme activity by creating environmental heterogeneity in the sedge-dominated peatlands of the Changbai Mountains, China. Ecol. Indic. 2021, 121, 107187. [Google Scholar] [CrossRef]
- Zhong, Q.P.; Xue, D.; Chen, H.; Liu, L.F.; He, Y.X.; Zhu, D.; He, Z.L. Structure and distribution of nitrite-dependent anaerobic methane oxidation bacteria vary with water tables in Zoige peatlands. FEMS Microbiol. Ecol. 2020, 96, fiaa039. [Google Scholar] [CrossRef]
- Bani, A.; Borruso, L.; Nicholass, K.J.M.; Bardelli, T.; Polo, A.; Pioli, S.; Gómez-Brandón, M.; Insam, H.; Dumbrell, A.J.; Brusetti, L. Site-Specific Microbial Decomposer Communities Do Not Imply Faster Decomposition: Results from a Litter Transplantation Experiment. Microorganisms 2019, 7, 349. [Google Scholar] [CrossRef] [PubMed]


Publisher’s Note: MDPI stays neutral with regard to jurisdictional claims in published maps and institutional affiliations. |
© 2022 by the authors. Licensee MDPI, Basel, Switzerland. This article is an open access article distributed under the terms and conditions of the Creative Commons Attribution (CC BY) license (https://creativecommons.org/licenses/by/4.0/).