
In Search of Differences in the Perception of Safety Climate by Employees of an International Manufacturing Company

Abstract
:1. Introduction
2. Safety Climate as Part of Safety Culture in the Workplace
2.1. Theoretical Background
2.2. Aims and Hypotheses
2.3. Ethics Statements
3. Materials and Methods
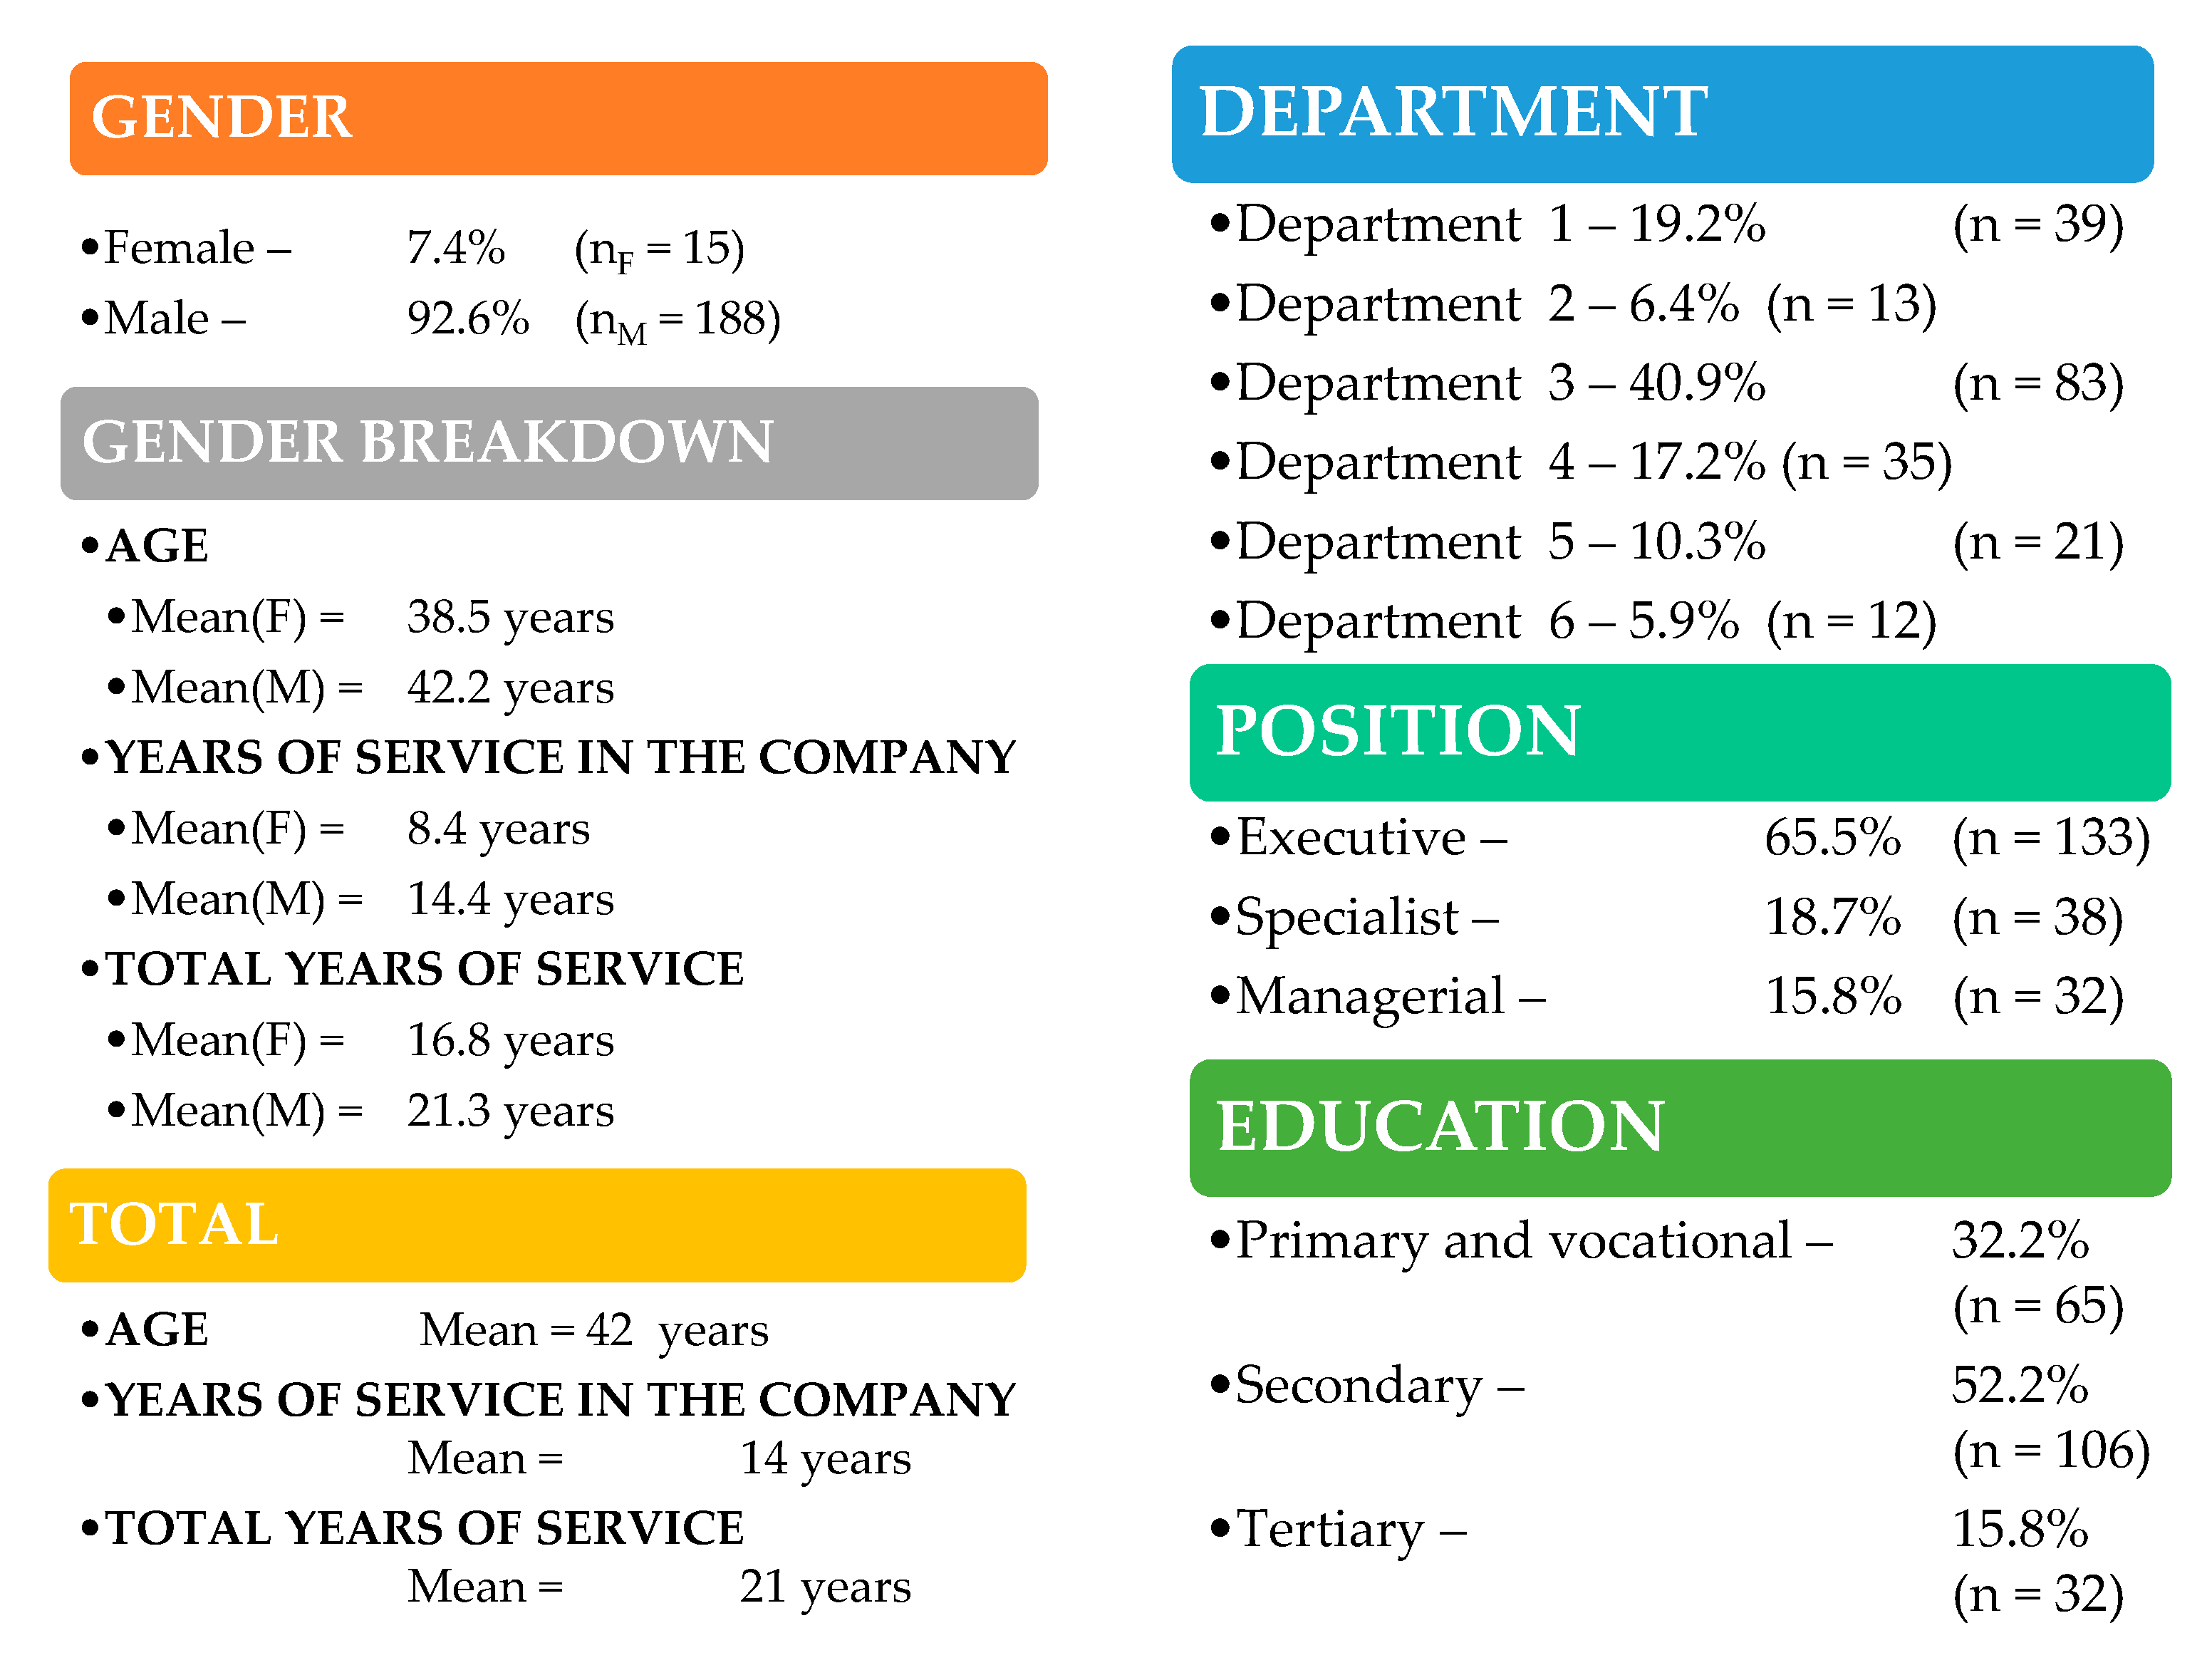
3.1. Data Description
3.2. Research Tools
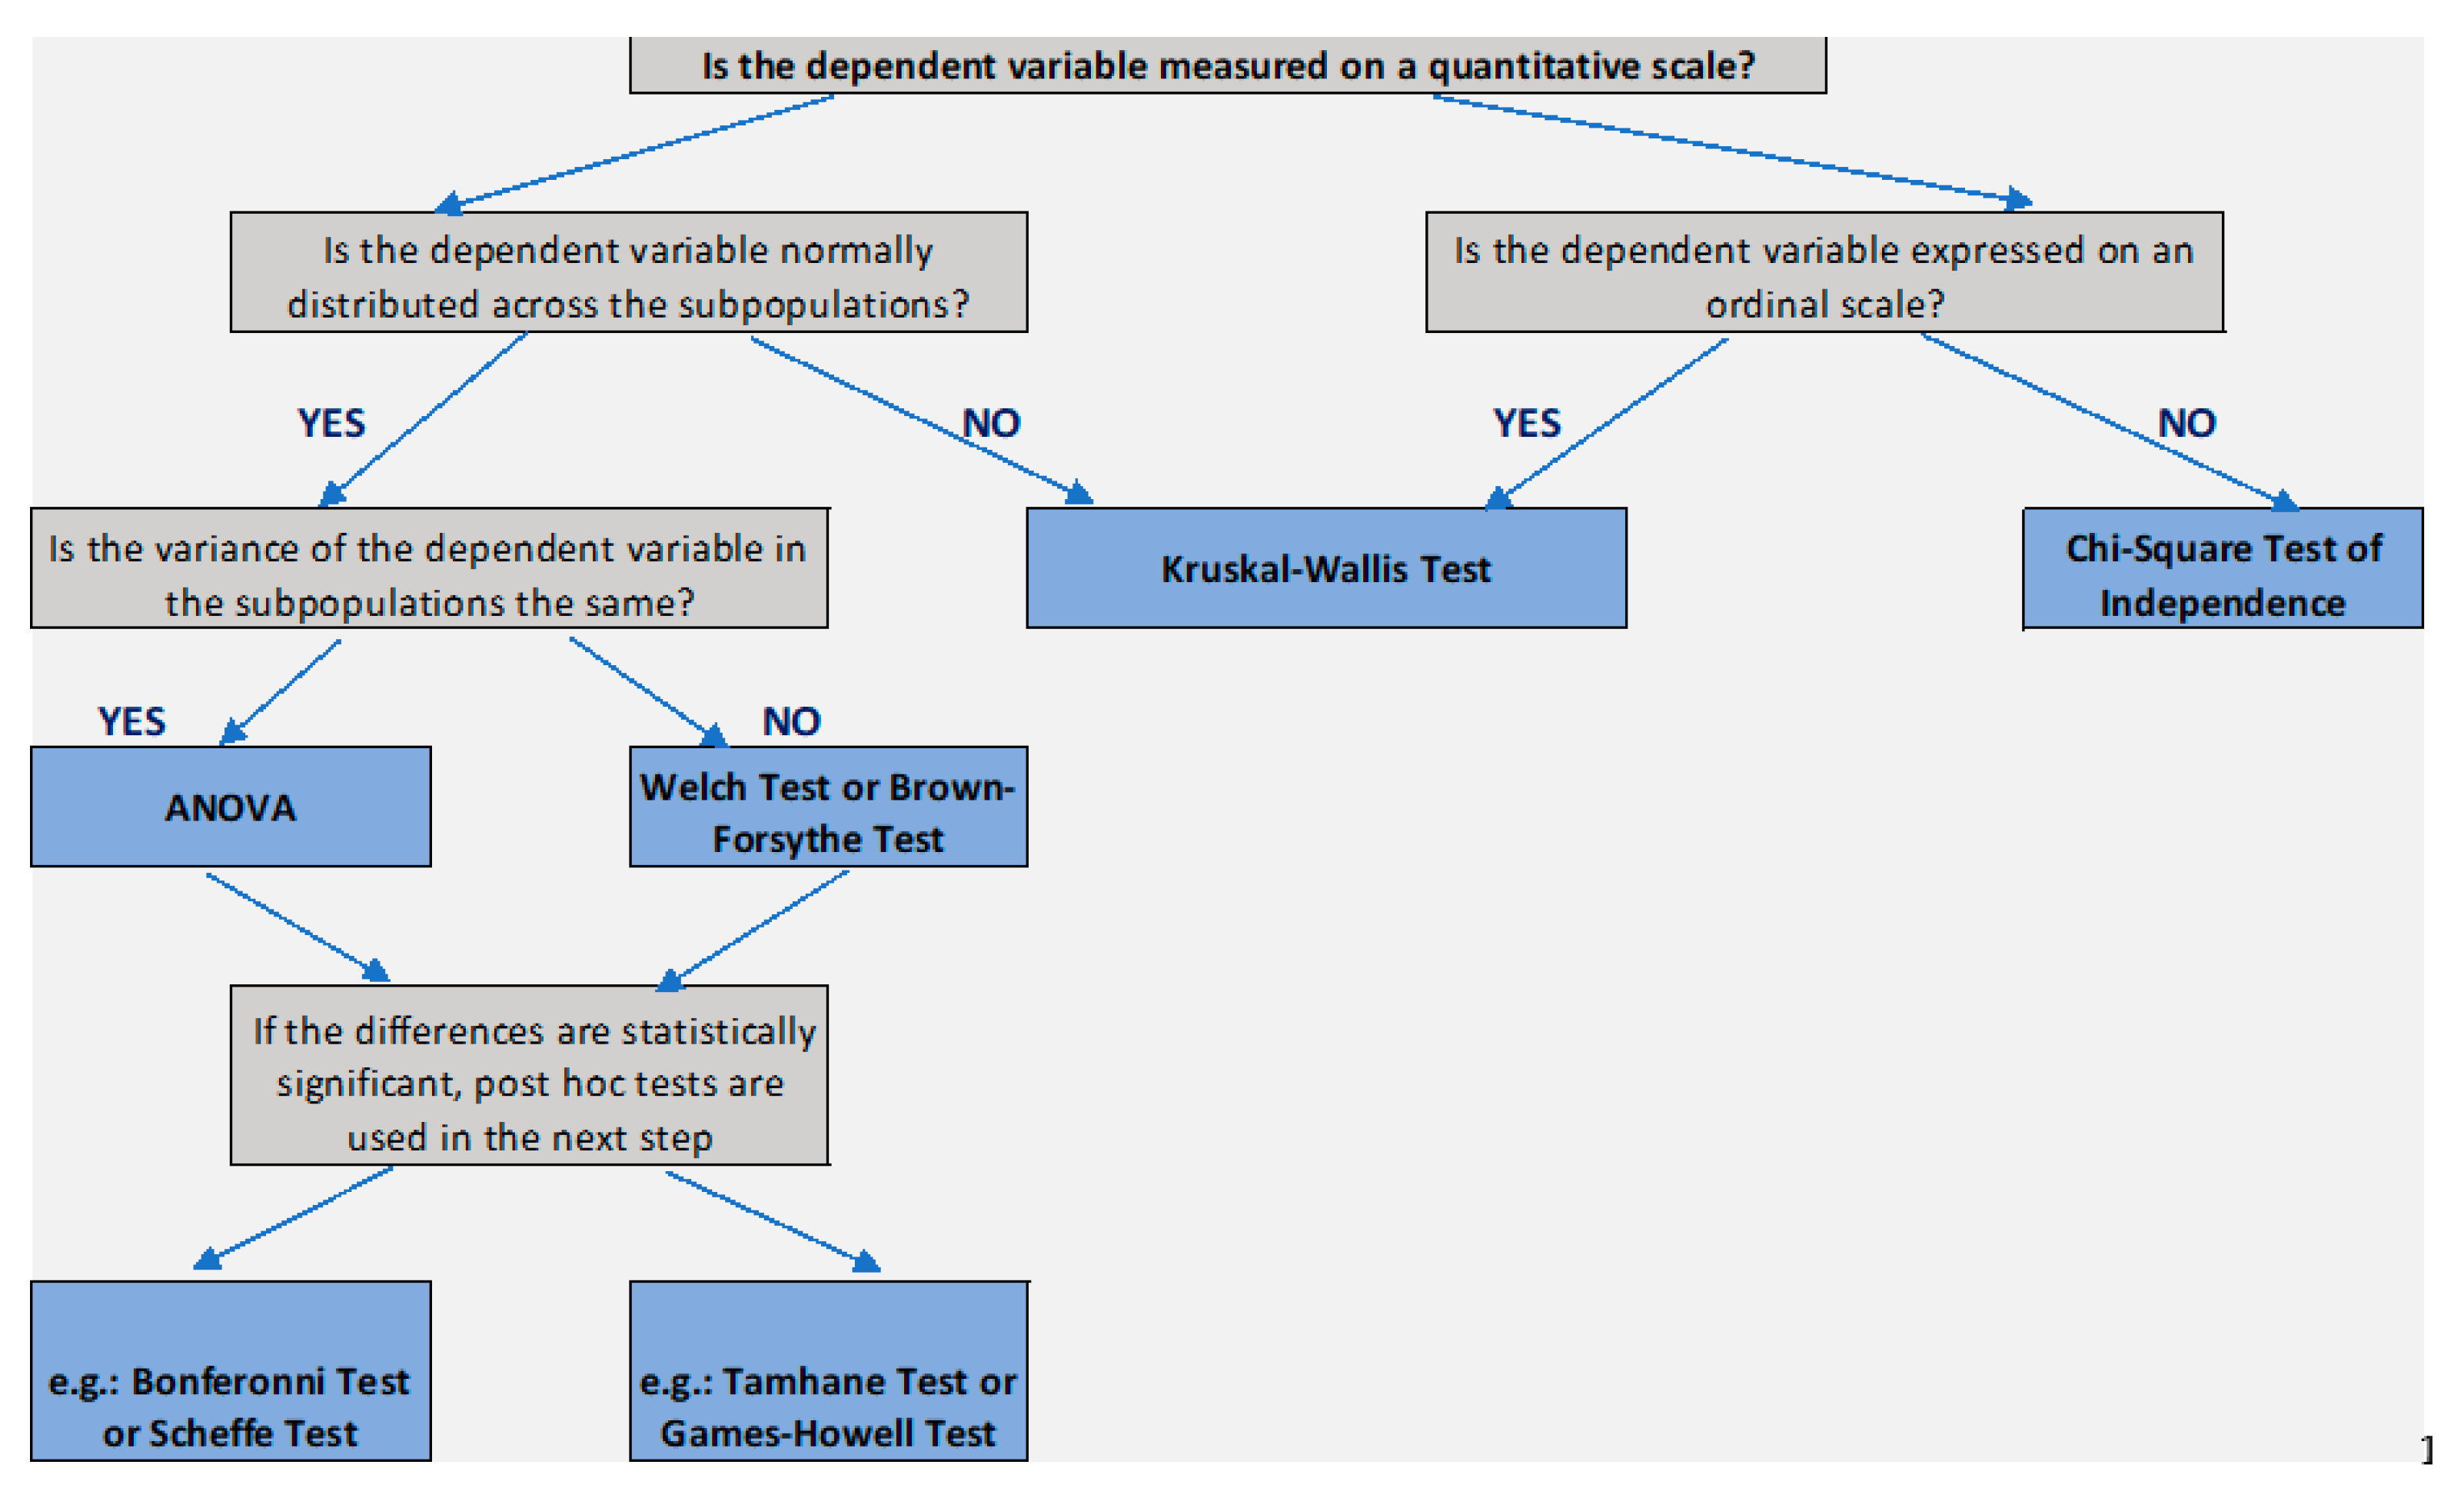
3.3. Methods
- Department—Production: large items for the construction sector (Department 1), Production: small ceiling tiles for the construction sector (Department 2), Production: panels for the construction sector (Department 3), Maintenance (Department 4), Warehouse (Department 5), Laboratory (Department 6);
- Position held—executive, specialist (engineering and technology, health and safety services), managerial (department manager, section manager);
- Education—primary or vocational, secondary, and tertiary.
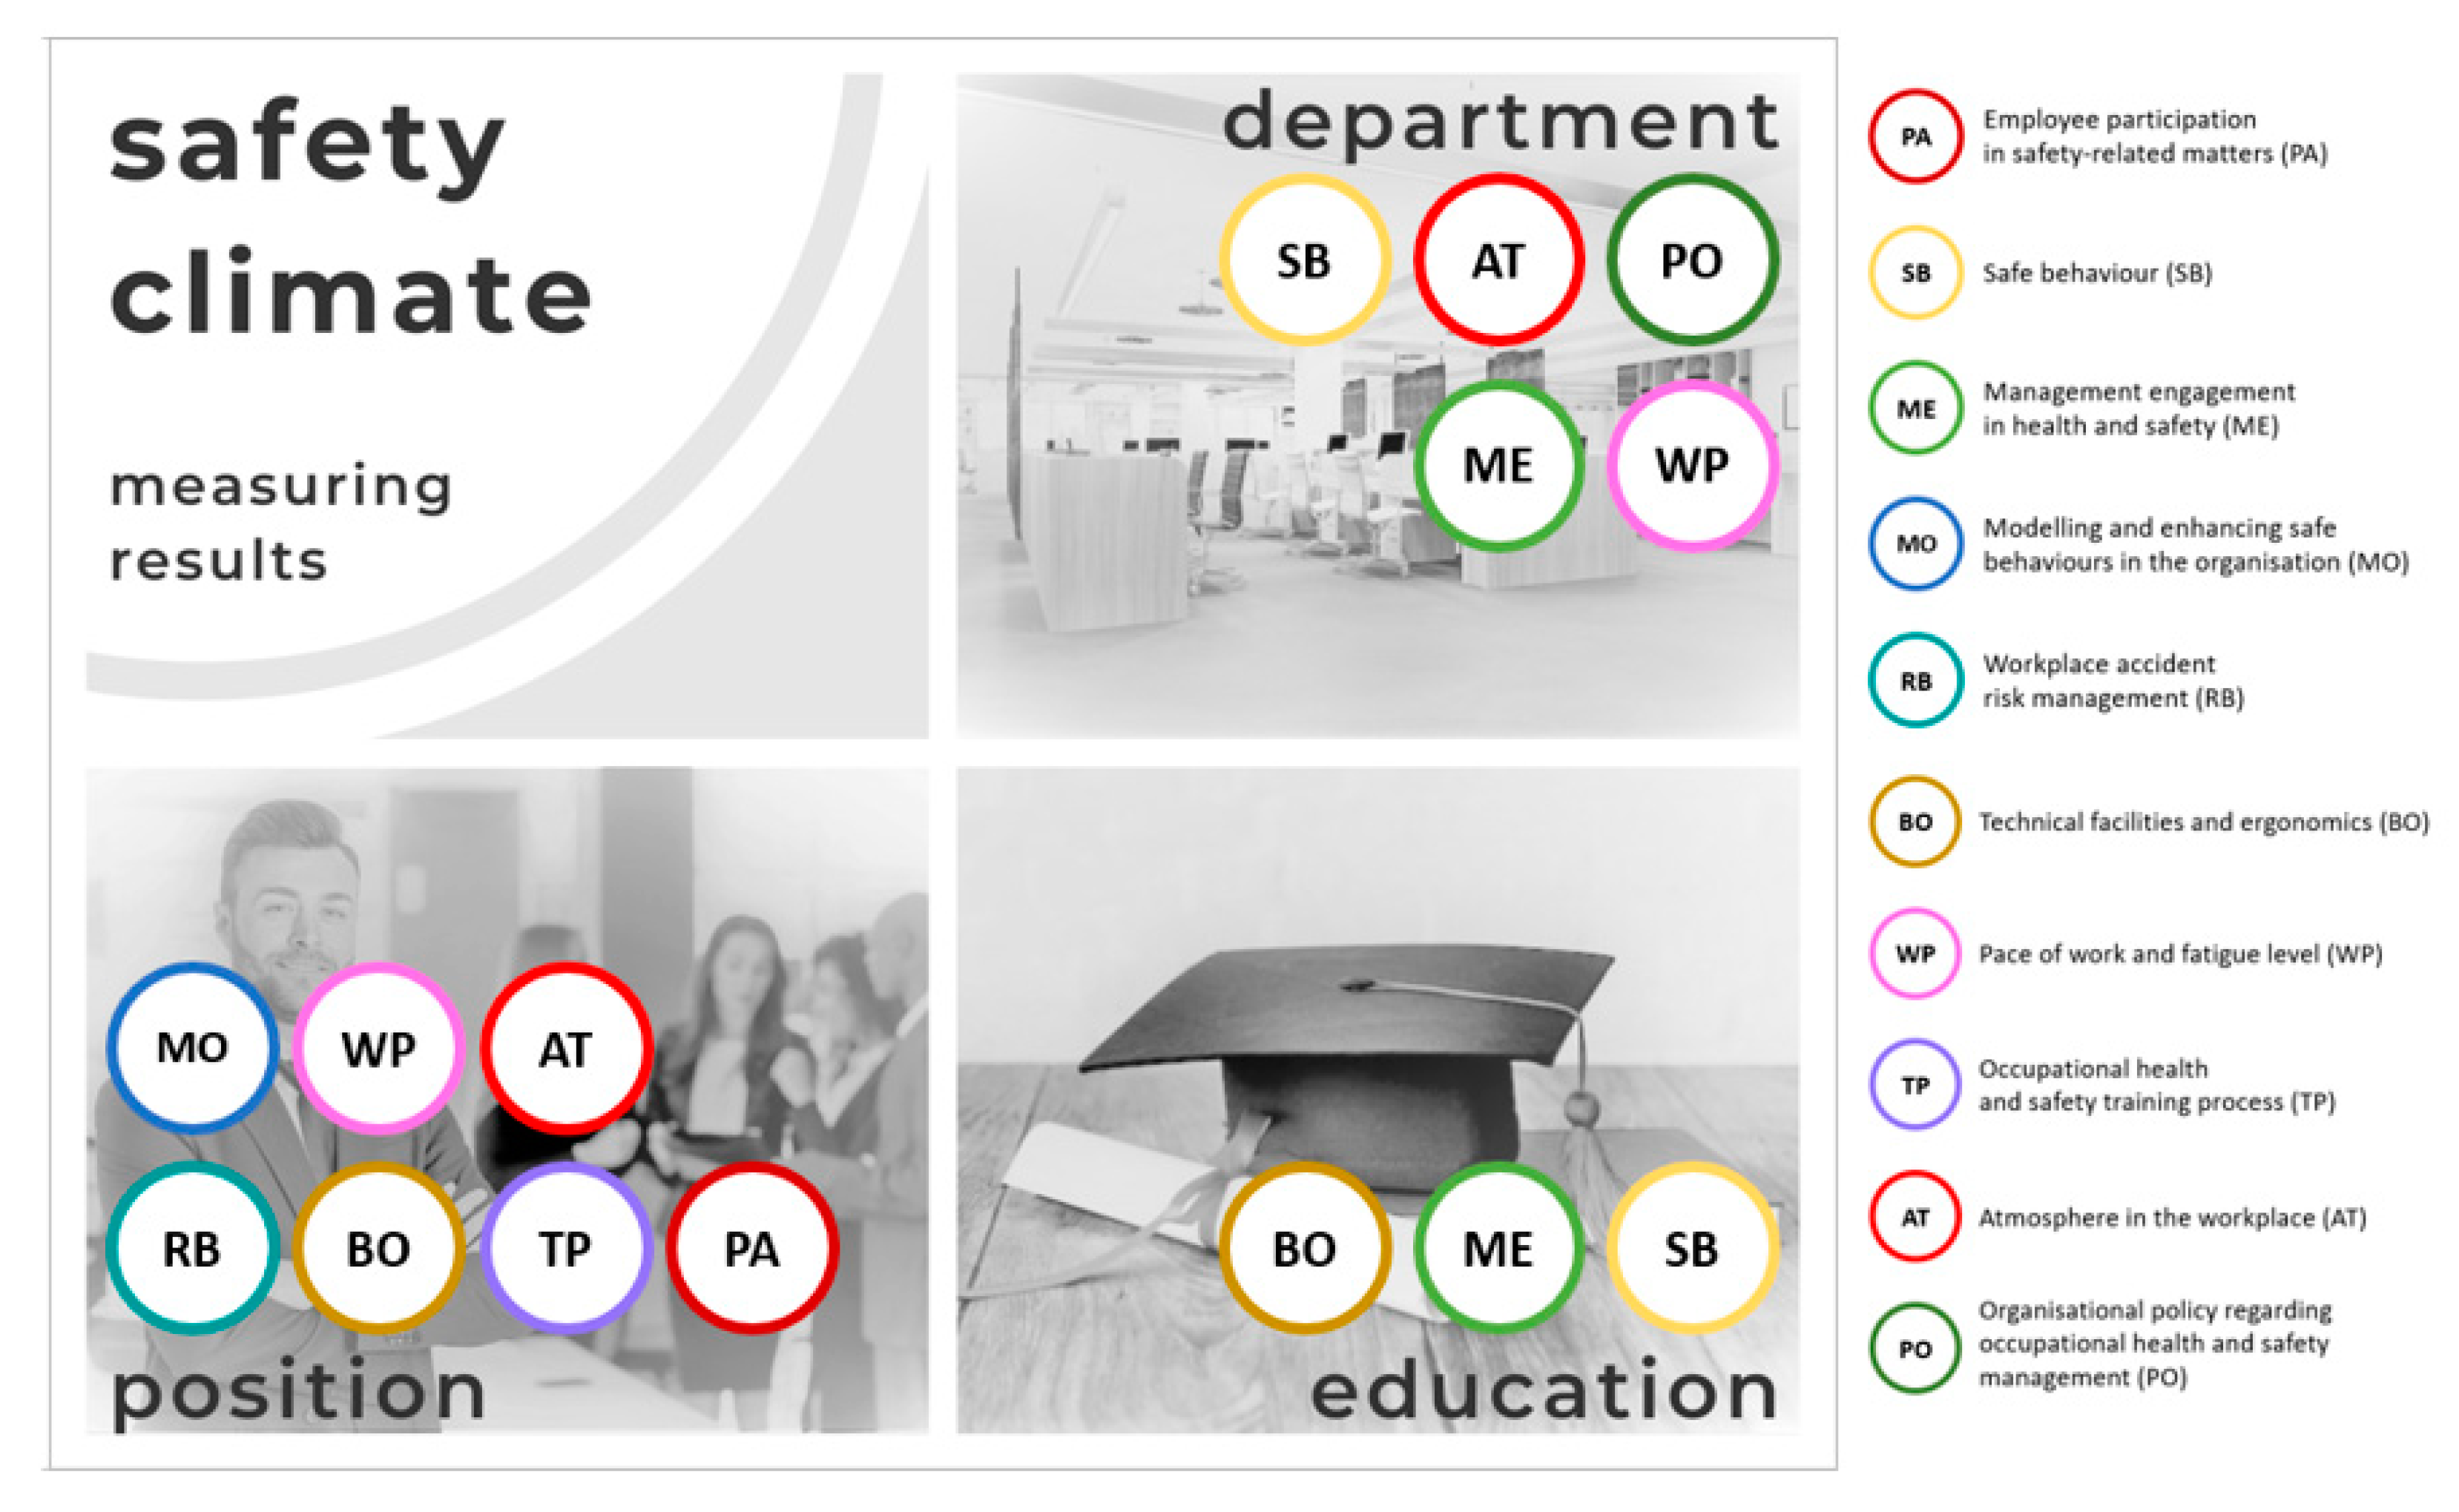
4. Results
4.1. Results Obtained from the Use of One-Way Analysis of Variance
4.2. Correlation Relationship Assessment
5. Discussion
6. Conclusions
Author Contributions
Funding
Institutional Review Board Statement
Informed Consent Statement
Data Availability Statement
Conflicts of Interest
Appendix A

| Dimensions | PA | SB | ME | MO | RB | BO | WP | TP | AT | PO | SSCI | ||||||||||||
|---|---|---|---|---|---|---|---|---|---|---|---|---|---|---|---|---|---|---|---|---|---|---|---|
| Factors | |||||||||||||||||||||||
| Department | |||||||||||||||||||||||
| Department 1 | M | 18.67 | F = 1.353 | 20.15 | F = 94.768 | 20.28 | F = 94.037 | 19.41 | F = 0.781 | 19.51 | B-F = 0.680 | 20.21 | F = 2.614 | 16.72 | B-F = 3.276 | 20.00 | F = 1.421 | 20.paź | B-F = 21.770 | 19.97 | B-F = 5.265 | 195.03 | B-F = 22.128 |
| Me | 19.00 | p = 0.244 | 20.00 | p< 0.001 | 20.00 | p< 0.001 | 20.00 | p = 0.565 | 19.00 | p = 0.640 | 20.00 | p= 0.026 | 17.00 | p= 0.010 | 20.00 | p = 0.218 | 20.00 | p< 0.001 | 20.00 | p< 0.001 | 195.00 | p< 0.001 | |
| Sd | 2.309 | 2.641 | 3.043 | 2.099 | 1.745 | 2.203 | 2.350 | 1.806 | 1.429 | 1.693 | 13.529 | ||||||||||||
| Department 2 | M | 17.38 | dfA = 5 | 10.69 | dfA = 5 | 11.00 | dfA = 5 | 19.31 | dfA = 5 | 19.92 | df1= 5 | 20.69 | dfA = 5 | 17.31 | df1= 5 | 19.23 | dfA = 5 | 18.46 | df1= 5 | 18.23 | df1= 5 | 172.23 | df1= 5 |
| Me | 17.00 | dfR = 197 | 10.00 | dfR = 197 | 11.00 | dfR = 197 | 20.00 | dfR = 197 | 20.00 | df2= 75.852 | 20.00 | dfR = 197 | 17.00 | df2= 71.806 | 20.00 | dfR = 197 | 19.00 | df2= 84.895 | 18.00 | df2= 107.017 | 172.00 | df2= 84.317 | |
| Sd | 3.150 | 2.594 | 1.633 | 1.974 | 3.040 | 2.213 | 4.906 | 2.619 | 1.761 | 1.166 | 7.201 | ||||||||||||
| Department 3 | M | 18.63 | 11.95 | 11.49 | 19.92 | 19.41 | 20.84 | 14.87 | 20.43 | 18.34 | 18.59 | 174.47 | |||||||||||
| Me | 19.00 | 12.00 | 11.00 | 20.00 | 20.00 | 21.00 | 15.00 | 20.00 | 18.00 | 18.00 | 173.00 | ||||||||||||
| Sd | 3.345 | 2.971 | 3.270 | 2.746 | 2.664 | 2.472 | 3.530 | 2.176 | 1.727 | 1.881 | 11.919 | ||||||||||||
| Department 4 | M | 18.54 | 20.34 | 21.20 | 19.66 | 19.74 | 21.51 | 14.69 | 20.77 | 22.09 | 20.00 | 198.54 | |||||||||||
| Me | 18.00 | 21.00 | 21.00 | 20.00 | 20.00 | 21.00 | 15.00 | 20.00 | 22.00 | 20.00 | 197.00 | ||||||||||||
| Sd | 3.221 | 3.077 | 2.898 | 2.485 | 2.214 | 2.228 | 3.513 | 1.987 | 2.049 | 2.236 | 16.750 | ||||||||||||
| Department 5 | M | 17.29 | 20.76 | 20.14 | 19.paź | 18.62 | 19.62 | 17.19 | 20.14 | 21.00 | 18.81 | 192.67 | |||||||||||
| Me | 18.00 | 20.00 | 20.00 | 20.00 | 20.00 | 20.00 | 16.00 | 20.00 | 21.00 | 20.00 | 196.00 | ||||||||||||
| Sd | 2.901 | 2.737 | 3.705 | 2.256 | 3.500 | 2.247 | 3.932 | 2.372 | 2.915 | 2.482 | 22.397 | ||||||||||||
| Department 6 | M | 19.58 | 11.00 | 10.00 | 20.50 | 20.17 | 21.75 | 14.58 | 20.92 | 18.92 | 18.50 | 175.92 | |||||||||||
| Me | 19.50 | 11.00 | 10.00 | 20.00 | 19.00 | 21.00 | 15.00 | 20.50 | 19.00 | 18.00 | 174.00 | ||||||||||||
| Sd | 2.778 | 2.089 | 1.859 | 2.908 | 3.070 | 2.454 | 3.343 | 2.353 | 1.443 | 1.732 | 11.000 | ||||||||||||
| Education | |||||||||||||||||||||||
| Primary or vocational | M | 18.23 | F = 0.311 | 17.lis | F = 3.499 | 17.17 | B-F = 3.803 | 19.71 | F = 0.042 | 19.15 | F = 1.185 | 20.32 | F = 4.588 | 16.03 | F = 1.210 | 20.20 | F = 0.655 | 19.75 | F = 0.963 | 19.08 | F = 0.164 | 186.75 | F = 1.477 |
| Me | 18.00 | p = 0.733 | 18.00 | p= 0.032 | 18.00 | p= 0.026 | 20.00 | p = 0.959 | 19.00 | p = 0.308 | 20.00 | p= 0.011 | 16.00 | p = 0.300 | 20.00 | p = 0.521 | 20.00 | p = 0.384 | 19.00 | p = 0.849 | 185.00 | p = 0.231 | |
| Sd | 3.166 | 5.084 | 4.955 | 2.596 | 2.195 | 2.568 | 3.377 | 2.230 | 2.616 | 2.273 | 20.165 | ||||||||||||
| Secondary | M | 18.52 | dfA = 2 | 14.99 | dfA = 2 | 14.69 | df1= 2 | 19.64 | dfA = 2 | 19.53 | dfA = 2 | 20.69 | dfA = 2 | 15.51 | dfA = 2 | 20.29 | dfA = 2 | 19.44 | dfA = 2 | 19.05 | dfA = 2 | 182.35 | dfA = 2 |
| Me | 19.00 | dfR = 202 | 14.00 | dfR = 202 | 12.00 | df2= 98.274 | 20.00 | dfR = 202 | 20.00 | dfR = 202 | 20.00 | dfR = 202 | 16.00 | dfR = 202 | 20.00 | dfR = 202 | 19.00 | dfR = 202 | 19.00 | dfR = 202 | 180.00 | dfR = 202 | |
| Sd | 2.859 | 5.070 | 5.549 | 2.435 | 2.822 | 2.257 | 3.576 | 2.056 | 2.103 | 1.884 | 16.488 | ||||||||||||
| Tertiary | M | 18.72 | 15.50 | 15.63 | 19.78 | 20.00 | 21.84 | 14.84 | 20.72 | 20.06 | 19.28 | 186.38 | |||||||||||
| Me | 20.00 | 15.50 | 12.00 | 20.00 | 20.00 | 22.00 | 15.00 | 20.00 | 20.00 | 19.50 | 184.00 | ||||||||||||
| Sd | 3.603 | 5.316 | 6.333 | 2.587 | 2.476 | 2.157 | 3.993 | 2.317 | 2.564 | 2.067 | 16.502 | ||||||||||||
| Position held | |||||||||||||||||||||||
| Executive | M | 18.08 | F = 3.811 | 15.69 | F = 2.805 | 15.43 | B-F = 2.409 | 19.33 | F = 5.710 | 19.05 | F = 12.722 | 20.32 | F = 8.208 | 16.08 | F = 4.671 | 19.95 | F = 8.286 | 19.32 | F = 5.584 | 18.87 | F-2.357 | 182.12 | F = 3.317 |
| Me | 18.00 | p= 0.024 | 15.00 | p = 0.063 | 14.00 | p = 0.096 | 20.00 | p= 0.004 | 19.00 | p< 0.001 | 20.00 | p< 0.001 | 16.00 | p= 0.010 | 20.00 | p< 0.001 | 19.00 | p= 0.004 | 19.00 | p = 0.097 | 178.00 | p= 0.038 | |
| Sd | 3.060 | 4.945 | 5.178 | 2.470 | 2.504 | 2.375 | 3.599 | 2.119 | 2.176 | 2.009 | 17.682 | ||||||||||||
| Specialist | M | 18.74 | dfA = 2 | 17.18 | dfA = 2 | 17.39 | df1= 2 | 19.87 | dfA = 2 | 19.34 | dfA = 2 | 21.18 | dfA = 2 | 15.03 | dfA = 2 | 20.63 | dfA = 2 | 20.74 | dfA = 2 | 19.45 | dfA = 2 | 189.55 | dfA = 2 |
| Me | 19.00 | dfR = 202 | 18.50 | dfR = 202 | 20.00 | df2= 86.862 | 20.00 | dfR = 202 | 19.50 | dfR = 202 | 21.00 | dfR = 202 | 15.00 | dfR = 202 | 20.00 | dfR = 202 | 21.00 | dfR = 202 | 20.00 | dfR = 202 | 188.00 | dfR = 202 | |
| Sd | 2.806 | 5.260 | 6.083 | 2.792 | 2.386 | 2.154 | 2.973 | 1.731 | 2.457 | 2.089 | 17.597 | ||||||||||||
| Managerial | M | 19.69 | 14.28 | 14.38 | 20.94 | 21.47 | 22.06 | 14.09 | 21.56 | 19.66 | 19.59 | 187.72 | |||||||||||
| Me | 19.50 | 12.00 | 11.50 | 21.00 | 22.00 | 22.00 | 14.00 | 22.00 | 19.50 | 20.00 | 185.00 | ||||||||||||
| Sd | 3.167 | 5.715 | 6.257 | 1.795 | 2.272 | 2.184 | 3.788 | 2.271 | 2.598 | 1.998 | 17.190 | ||||||||||||
| Department | |||||||
|---|---|---|---|---|---|---|---|
| Dimensions | SB | ME | WP | AT | PO | SSCI | |
| Department 1 | Statistically significant differences between Department 1 and Department 2 (p < 0.001), Department 3 (p < 0.001) and Department 6 (p < 0.001) | Statistically significant differences between Department 1 and Department 2 (p < 0.001), Department 3 (p < 0.001) and Department 6 (p < 0.001) | Statistically significant differences between Department 1 and Department 3 (p = 0.013) | Statistically significant differences between Department 1 and Department 3 (p < 0.001) and Department 4 (p < 0.001) | Statistically significant differences between Department 1 and Department 2 (p = 0.004) and Department 3 (p = 0.002) | Statistically significant differences between Department 1 and Department 2 (p < 0.001), Department 3 (p < 0.001) and Department 6 (p < 0.001) | |
| Department 2 | Statistically significant differences between Department 2 and Department 1 (p < 0.001), Department 4 (p < 0.001) and Department 5 (p < 0.001) | Statistically significant differences between Department 2 and Department 1 (p < 0.001), Department 4 (p < 0.001) and Department 5 (p < 0.001) | Statistically significant differences between Department 2 and Department 4 (p < 0.001) and Department 5 (p = 0.050) | Statistically significant differences between Department 2 and Department 1 (p = 0.004) and Department 4 (p = 0.014) | Statistically significant differences between Department 2 and Department 1 (p < 0.001), Department 4 (p < 0.001) and Department 5 (p = 0.010) | ||
| Department 3 | Statistically significant differences between Department 3 and Department 1 (p < 0.001), Department 4 (p < 0.001) and Department 5 (p < 0.001) | Statistically significant differences between Department 3 and Department 1 (p < 0.001), Department 4 (p < 0.001) and Department 5 (p < 0.001) | Statistically significant differences between Department 3 and Department 1 (p = 0.013) | Statistically significant differences between Department 3 and Department 1 (p < 0.001), Department 4 (p < 0.001) and Department 5 (p = 0.008) | Statistically significant differences between Department 3 and Department 1 (p = 0.002) and Department 4 (p = 0.027) | Statistically significant differences between Department 3 and Department 1 (p < 0.001), Department 4 (p < 0.001) and Department 5 (p = 0.023) | |
| Department 2 | Statistically significant differences between Department 4 and Department 2 (p < 0.001), Department 3 (p < 0.001) and Department 6 (p < 0.001) | Statistically significant differences between Department 4 and Department 2 (p < 0.001), Department 3 (p < 0.001) and Department 6 (p < 0.001) | Statistically significant differences between Department 4 and Department 1 (p < 0.001), Department 2 (p < 0.001), Department 3 (p < 0.001) and Department 6 (p < 0.001) | Statistically significant differences between Department 4 and Department 2 (p = 0.014) and Department 3 (p = 0.027) | Statistically significant differences between Department 4 and Department 2 (p < 0.001), Department 3 (p < 0.001) and Department 6 (p < 0.001) | ||
| Department 5 | Statistically significant differences between Department 5 and Department 2 (p < 0.001), Department 3 (p < 0.001) and Department 6 (p < 0.001) | Statistically significant differences between Department 5 and Department 2 (p < 0.001), Department 3 (p < 0.001) and Department 6 (p < 0.001) | Statistically significant differences between Department 5 and Department 2 (p = 0.050) and Department 3 (p = 0.008) | Statistically significant differences between Department 5 and Department 2 (p = 0.010) and Department 3 (p = 0.023) | |||
| Department 6 | Statistically significant differences between Department 6 and Department 1 (p < 0.001), Department 4 (p < 0.001) and Department 5 (p < 0.001) | Statistically significant differences between Department 6 and Department 1 (p < 0.001), Department 4 (p < 0.001) and Department 5 (p < 0.001) | Statistically significant differences between Department 6 and Department 4 (p < 0.001) | Statistically significant differences between Department 6 and Department 1 (p < 0.001) and Department 4 (p < 0.001) | |||
| Education | |||||||
| Dimensions | SB | ME | BO | ||||
| Primary or vocational | Statistically significant differences between primary or vocational and secondary education (p = 0.028) | Statistically significant differences between primary or vocational and secondary education (p = 0.009) | Statistically significant differences between primary or vocational and tertiary education (p = 0.009) | ||||
| Secondary | Statistically significant differences between primary or vocational and secondary education (p = 0.028) | Statistically significant differences between primary or vocational and secondary education (p = 0.009) | |||||
| Tertiary | Statistically significant differences between tertiary and primary or vocational (p = 0.009) | ||||||
| Position held | |||||||
| Dimensions | PA | MO | RB | BO | WP | TP | AT |
| Executive | Statistically significant differences between Executive and Managerial (p = 0.023) | Statistically significant differences between Executive and Managerial (p = 0.003) | Statistically significant differences between Executive and Managerial (p < 0.001) | Statistically significant differences between Executive and Managerial (p < 0.001) | Statistically significant differences between Executive and Managerial (p = 0.014) | Statistically significant differences between Executive and Managerial (p < 0.001) | Statistically significant differences between Executive and Specialist (p = 0.003) |
| Specialist | Statistically significant differences between Specialist and Managerial (p = 0.001) | Statistically significant differences between Specialist and Executive (p = 0.003) | |||||
| Managerial | Statistically significant differences between Managerial and Executive (p = 0.023) | Statistically significant differences between Managerial and Executive (p = 0.003) | Statistically significant differences between Managerial and Executive (p < 0.001) and Specialist (p = 0.001) | Statistically significant differences between Managerial and Executive (p < 0.001) | Statistically significant differences between Managerial and Executive (p = 0.014) | Statistically significant differences between Managerial and Executive (p < 0.001) | |
 Source: own elaboration based on the results of empirical research carried out in an international manufacturing company, n = 203.
Appendix B. Safety Climate Questionnaire (SCQ)—Short Version
| No. | question | replies: |
| SA – strongly agree | ||
| A – agree | ||
| NANDA – neither agree nor disagree | ||
| DA – disagree | ||
| SDA – strongly disagree | ||
| 1. | The machines and devices I operate undergo interim check-ups. | SA A NANDA DA SDA |
| 2. | I have been involved in the occupational risk assessment process at my workstation. | SA A NANDA DA SDA |
| 3. | The employer’s actions linked to occupational safety are consulted with employees. | SA A NANDA DA SDA |
| 4. | From time to time, I happen to perform my duties not in compliance with the rules of occupational safety and health. | SA A NANDA DA SDA |
| 5. | Employees can test personal protection equipment (e.g., footwear, goggles and glasses) prior to the decision to purchase them. | SA A NANDA DA SDA |
| 6. | In our firm employees are members of the teams working to improve safety within the organisation (e.g., they participate in formulating safety procedures, OHS instructions, in the works of post-accident teams, risk assessment, OSH committee). | SA A NANDA DA SDA |
| 7. | My workstation is orderly and tidy (tools are kept in the same place and waste is removed on a current basis) and it is important for me to keep the workstation tidy. | SA A NANDA DA SDA |
| 8. | Employees are advised of any implementation of long-term safety projects (e.g., ISO, OHSAS, prophylactic programmes, behaviours at the workstation monitoring programme). | SA A NANDA DA SDA |
| 9. | My employer takes measures to improve safety within the organisation. | SA A NANDA DA SDA |
| 10. | My superiors are not interested in OSH issues. | SA A NANDA DA SDA |
| 11. | From time to time my superior happens to assign a task to be fulfilled contrary to the rules of occupational safety (e.g., to remove the protective shield from the machine so that it works faster). | SA A NANDA DA SDA |
| 12. | My superior intervenes whenever the work safety rules are being breached. | SA A NANDA DA SDA |
| 13. | I disregard my superior’s remarks and instructions on safety (e.g., I do not wear protective gloves, footwear, hearing protectors, even though my superior has admonished me to wear them). | SA A NANDA DA SDA |
| 14. | From time to time, I happen to behave riskily (e.g., I remove protective shields from machines, carry out minor repairs while the machine is in operation, exceed the allowable speed, take shortcuts to hit the target more quickly). | SA A NANDA DA SDA |
| 15. | The plant has an ‘accidents at work’ information system (e.g., a mannequin with locations of injuries, information board, newsletter). | SA A NANDA DA SDA |
| 16. | In my firm, safe work performance by employees is promoted (e.g., by being taken into account in the employee assessment process). | SA A NANDA DA SDA |
| 17. | From time to time, my superior happens not to follow the safety rules. | SA A NANDA DA SDA |
| 18. | The number of tasks I have to perform on a daily basis causes me to have to work at a very fast pace. | SA A NANDA DA SDA |
| 19. | My superior gives me feedback on my work performance, bringing attention to the fact that I must work safely. | SA A NANDA DA SDA |
| 20. | My superior’s conduct sets an example for me in terms of safety. | SA A NANDA DA SDA |
| 21. | My superiors actively participate in safety promotion actions organised by the firm. | SA A NANDA DA SDA |
| 22. | Each and every accident that has happened in our plant is discussed by the superior during information meetings. | SA A NANDA DA SDA |
| 23. | The plant maintains a logbook of potentially dangerous incidents (near-accidents). | SA A NANDA DA SDA |
| 24. | The logbook of potentially dangerous incidents (near-accidents) is used, for example, to advise employees of the risks and prophylactic measures taken. | SA A NANDA DA SDA |
| 25. | My superiors ‘turn a blind eye’ on how work is performed—no matter whether or not it is done safely. What matters is timeliness and the required output. | SA A NANDA DA SDA |
| 26. | Particularly dangerous places are adequately marked. | SA A NANDA DA SDA |
| 27. | I usually work under time pressure. | SA A NANDA DA SDA |
| 28. | Our organisation has an action plan to improve occupational safety. | SA A NANDA DA SDA |
| 29. | The work I do is very strenuous for me. | SA A NANDA DA SDA |
| 30. | My daily work schedule changes very often. | SA A NANDA DA SDA |
| 31. | I feel that my superior motivates me to work safely. | SA A NANDA DA SDA |
| 32. | After the entire day of work, I suffer from various muscular/backbone ailments (e.g., corns, backbone pains). | SA A NANDA DA SDA |
| 33. | The rules of moving around the plant are clearly specified. | SA A NANDA DA SDA |
| 34. | Machines and devices are repaired by qualified teams. | SA A NANDA DA SDA |
| 35. | Control elements of machines are well visible and marked. | SA A NANDA DA SDA |
| 36. | I have been advised of the occupational risk assessment at my workstation. | SA A NANDA DA SDA |
| 37. | I have a good relationship with my superior and I know I can rely on him/her in case of an emergency. | SA A NANDA DA SDA |
| 38. | When doing a dangerous job, I know I can trust my colleagues with whom I am fulfilling a dangerous task. | SA A NANDA DA SDA |
| 39. | I feel well-informed about protection against my occupational risks. | SA A NANDA DA SDA |
| 40. | I believe I am well-trained in providing first aid and if an accident were to happen, I would know what to do. | SA A NANDA DA SDA |
| 41. | I know the employee and the employer’s duties in respect of safety. | SA A NANDA DA SDA |
| 42. | Upon change of my workstation—prior to starting work at a new workstation I am given the workstation instruction. | SA A NANDA DA SDA |
| 43. | I have a good relationship with my colleagues in the workplace. | SA A NANDA DA SDA |
| 44. | In our organisation safety is a priority, the process of improving safety is continuous. | SA A NANDA DA SDA |
| 45. | Communication within the team is difficult, there is no knowing who you can trust. | SA A NANDA DA SDA |
| 46. | Our organisation continuously takes various measures to improve work safety. | SA A NANDA DA SDA |
| 47. | In our organisation, safety issues are only discussed when an accident or inspection takes place. | SA A NANDA DA SDA |
| 48. | Our firm conducts practical exercises (e.g., evacuation exercise, accident simulation). | SA A NANDA DA SDA |
| 49. | When working in a team, I know I can trust the other team members. | SA A NANDA DA SDA |
| 50. | When doing work I know very well, I happen to flout the OSH rules from time to time. | SA A NANDA DA SDA |
References
- Bisbey, T.M.; Kilcullen, M.P.; Thomas, E.J.; Ottosen, M.J.; Tsao, K.; Salas, E. Safety Culture: An Integration of Existing Models and a Framework for Understanding Its Development. Hum. Factors J. Hum. Factors Ergon. Soc. 2021, 63, 88–110. [Google Scholar] [CrossRef]
- Roszko-Wójtowicz, E. Europejski rynek pracy-zastosowanie metod statystyki wielowymiarowej. Przegląd Nauk.-Metodyczny. Eduk. Dla Bezpieczeństwa 2016, 1, 193–204. Available online: http://www.przeglad.wsb.net.pl/uploads/1/0/3/7/10371016/ca%C5%82o%C5%9B%C4%87ks.pdf (accessed on 17 July 2022).
- Stasiła-Sieradzka, M.; Chudzicka-Czupała, A.; Znajmiecka-Sikora, M. Klimat bezpieczeństwa pracy. Porównanie wybranych grup zawodowych. PLoS ONE 2020, 15, e0243056. [Google Scholar] [CrossRef]
- Frankfort-Nachmias, C. Metody Badawcze W Naukach Społecznych; Wydawnictwo Zyski S-ka: Warszawa, Polska, 2001. [Google Scholar]
- Casey, T.W.; Hu, X.; Reid, C.; Tran, P.A.; Guldenmund, F.W. Rolling up our sleeves and pulling up our socks: A critical review of safety culture definitions and measures, and innovative ways to move the field forward. In Handbook of Research Methods for Organisational Culture; School of Management and Ruth Knight, Postdoctoral Research Fellow, Australian Centre for Philanthropy and Nonprofit Studies, Queensland University of Technology: Brisbane, Australia, 2022; ISBN 978 1 78897 625 1. Available online: https://www.e-elgar.com/shop/gbp/handbook-of-research-methods-for-organisational-culture-9781788976251.html (accessed on 29 October 2022).
- Tyszkiewicz, R. Istota kultury bezpieczeństwa pracy w systemie zarządzania. Dosk. Jakości Prod. 2019, 2, 94–101. Available online: https://www.qpi-journal.pl/EN/files/QPI_11_2019_08.pdf (accessed on 17 July 2022).
- Dobrowolska, M.; Stasiła-Sieradzka, M.; Znajmiecka-Sikora, M. Analiza różnic w postawach wobec bezpieczeństwa pracy w kontekście postrzeganego dystansu do zagrożenia. Zarządzanie Zasobami Ludzkimi 2019, 128, 87–97. [Google Scholar]
- Wu, T.; Chang, S.; Shu, C.; Chen, C.; Wang, C. Przywództwo w zakresie bezpieczeństwa a wyniki w zakresie bezpieczeństwa w przemyśle petrochemicznym: The mediating role of safety climate. J. Loss Prev. Process Ind. 2011, 24, 716–721. [Google Scholar] [CrossRef]
- Boczkowska, K.; Znajmiecka-Sikora, M. Koszty Zarządzania Bezpieczeństwem Pracy-Badanie Poziomu Świadomości Pracodawców. Studia Prawno-Ekon. 2017, 1, 177–191. [Google Scholar]
- Znajmiecka-Sikora, M.; Boczkowska, K. Behaviour-Based Safety (BBS): Program modyfikacji zachowań niebezpiecznych w przedsiębiorstwie. Bezpieczeństwo Pract.Nauka I Prakt. 2017, 3, 10–14. Available online: http://yadda.icm.edu.pl/baztech/element/bwmeta1.element.baztech-c22ea7ca-cf8d-49f9-8d68-01db2c0f9423/c/znajmiecka.pdf (accessed on 17 July 2022).
- Studenski, R. Kultura bezpieczeństwa pracy w przedsiębiorstwie. Bezpieczeństwo Pract. 2000, 9, 1–4. Available online: http://yadda.icm.edu.pl/baztech/element/bwmeta1.element.baztech-daa5b0b9-f4f4-49e4-85ff-00b98bfb4621/c/Studenski.pdf (accessed on 17 July 2022).
- Kozioł, L.; Buzowska, B. Praktyki nadzorcze i zarządcze a dobrostan pracowników. Zesz. Nauk. Małopolskiej Wyższej Szkoły Ekon. W Tarn. 2016, 29, 39–48. Available online: https://zn.mwse.edu.pl/index.php/zn/article/view/127/112 (accessed on 17 July 2022).
- Zohar, D. Safety climate in industrial organizations: Theoretical and aplications. J. Appl. Psychol. 1980, 6, 96–102. [Google Scholar] [CrossRef]
- Cooper, D. Improving Safety Culture. A Practical Guide; John Wiley & Sons Ltd.: Chichester, UK, 1998. [Google Scholar]
- Milczarek, M. Ocena poziomu kultury bezpieczeństwa w przedsiębiorstwie. Bezpieczeństwo Pract. 2001, 5, 17–19. [Google Scholar]
- Lis, K. Kultura i klimat bezpieczeństwa pracy. Stodia Oeconomica Posnaniesia 2013, 7, 7–16. [Google Scholar]
- Glendon, A.I.; Stanton, N.A. Perspectives on safety culture. Saf. Sci. 2000, 34, 193–214. [Google Scholar] [CrossRef] [Green Version]
- Szubielska, J. Kultura organizacyjna i kultura bezpieczeństwa. In Kultura Bezpieczeństwa w Przedsiębiorstwie. Modele, Diagnoza, Kształtowanie; Rakowska, A., Ed.; CeDeWu Sp.z o.o.: Warszawa, Poland, 2013; p. 7. [Google Scholar]
- Håvold, J.I. Kultura bezpieczeństwa i zarządzanie bezpieczeństwem na pokładzie tankowców. Reliab. Eng. Syst. Saf. 2010, 95, 511–519. [Google Scholar] [CrossRef]
- Karlof, B.; Ostblom, S. Benchmarking–Równaj do Najlepszych; Biblioteka Menadżera i Bankowca: Warszawa, Poland, 1995; p. 35. [Google Scholar]
- Znajmiecka-Sikora, M.; Boczkowska, K. Analiza kultury bezpieczeństwa na przykładzie wybranych polskich przedsiębiorstw produkcyjnych. In Occupational Safety and Hygiene IV; Arezes, P.M., Baptista, J.S., Barroso, M.P., Carneiro, P., Cordeiro, P., Costa, N., Melo, R.B., Miguel, A.S., Perestrelo, G., Eds.; Taylor & Francis Group: London, UK, 2016; pp. 349–352. [Google Scholar]
- Nowacki, K.; Łakomy, K.; Lis, T. Staż pracy a kultura bezpieczeństwa. In Innowacje w Zarządzaniu i Inżynierii Produkcji; Knosala, R., Ed.; Oficyna Wydawnicza Polskiego Zarządzania Produkcją: Opole, Polska, 2016; pp. 448–460. [Google Scholar]
- Gabryelewicz, I.; Krupa, P. Poziom Klimatu Bezpieczeństwa Iako Element Zarządzania Bezpieczeństwem w Przedsiębiorstwie. Zesz Nauk. Politech. Częstochowskiej. Zarządzanie 2016, 19, 183–192. Available online: https://www.sbc.org.pl/Content/358714/gabrylewicz.pdf (accessed on 17 July 2022).
- Znajmiecka-Sikora, M. Boczkowska K, (2016) Analysis of safety culture on the example of selected Polish production enterprises. [w:] (red) Pedro M. Arezes, Joao Santos Baptista, Monica P. Barroso, Paula Carneiro, Patricio Cordeiro, Nelson Costa, Rui B. Melo, Sergio Miguel, Goncalo Perestrelo Occupational Safety and Hygiene IV Londyn: Taylor & Francis group.
- Znajmiecka-Sikora, M.; Sałagacka, M. Analiza związku płci psychologicznej ze stylem postrzegania ryzyka i postawami wobec bezpieczeństwa w grupie kobiet i mężczyzn. Int. J. Occup. Saf. Ergon. 2022, 28, 364–375. [Google Scholar] [CrossRef] [PubMed]
- Znajmiecka-Sikora, M. Właściwości psychometryczne skróconej wersji Kwestionariusza Klimatu Bezpieczeństwa-50 (KKB-50). Zesz. Nauk. Politech. Łódzkiej. Organ. I Zarządzanie 2019, 72, 73–94. [Google Scholar]
- Znajmiecka-Sikora, M. Kwestionariusz Postaw wobec Bezpieczeństwa (KPwB)–konstrukcja i charakterystyka psychometryczna. Zesz. Nauk. Politech. Łódzkiej Organ. I Zarządzanie 2019, 72, 163–182. [Google Scholar]
- Milczarek, M. Kultura bezpieczeństwa w przedsiębiorstwie-nowe spojrzenie na zagadnienie bezpieczeństwa pracy. Bezpieczeństwo Pract. 2000, 10, 17–20. Available online: http://archiwum.ciop.pl/31063 (accessed on 17 July 2022).
- Znajmiecka-Sikora, M. Ocena kultury bezpieczeństwa w sektorze MIŚP na podstawie badań przedsiębiorstw z regionu łódzkiego. In Nowe Spojrzenie na Kulturę Organizacyjną; Juźwicka, A., Szymańska, K., Walecka, A., Eds.; Wydawnictwo Politechniki Łódzkiej: Łódź, Poland, 2014; pp. 53–62. [Google Scholar]
- Schwatka, N.V.; Hecker, S.; Linda, M.; Goldenhar, L.M. Definiowanie i pomiar klimatu bezpieczeństwa: Przegląd literatury z branży budowlanej. Ann. Occup. Hyg. 2016, 60, 537–550. [Google Scholar] [CrossRef] [PubMed] [Green Version]
- Znajmiecka-Sikora, M. Analiza klimatu bezpieczeństwa na przykładzie przedsiębiorstwa produkcyjnego z branży oświetleniowej. Zesz. Nauk. Politech. Łódzkiej. Organ. I Zarządzanie 2013, 56, 103–127. [Google Scholar]
- Kołodziej, A. Miejsce kultury bezpieczeństwa w organizacji pracy na morzu: Perspektywa marynarza. Zarządzanie Zasobami Ludzkimi 2019, 128, 11–27. [Google Scholar]
- Skorupa, A. Bezpieczeństwo osób pracujących w rejonach polarnych. Zarządzanie Zasobami Ludzkimi 2019, 128, 29–41. [Google Scholar]
- Yari, S.; Naseri, M.H.; Akbari, H.; Shahsavari, S.; Akbari, H. Interakcja klimatu bezpieczeństwa i kultury bezpieczeństwa: Model dla ośrodków leczenia raka. Asian Pac. J. Cancer Prev. 2019, 20, 961–969. [Google Scholar] [CrossRef]
- Chen, Y.; McCabe, B.; Hyatt, D. Impact of individual resilience and safety climate on safety performance and psychological stress of construction workers: A case study of the Ontario construction industry. J. Saf. Res. 2017, 61, 167–176. [Google Scholar] [CrossRef]
- Stasiła-Sieradzka, M.; Dobrowolska, M. Badania klimatu bezpieczeństwa pracy jako elementu porównawczego w zarządzaniu bezpieczeństwem w organizacji. Społeczeństwo I Eduk. 2016, 21, 471–478. [Google Scholar]
- Stasiła-Sieradzka, M.; Dobrowolska, M. Postawy i normy społecznego postepowania jako element kultury bezpieczeństwa pracy-próba diagnozy problemu. Przegląd Górniczy 2016, 12, 54–58. [Google Scholar]
- Boczkowska, K. Popularyzacja bezpieczeństwa i higieny pracy w kontekście wielkości przedsiębiorstwa-wyniki badań. Przegląd Organ. 2019, 7, 38–45. [Google Scholar] [CrossRef]
- Ocieczek, W.; Łakomy, K.; Nowacki, K. Rola edukacji w kształtowaniu kultury bezpieczeństwa pracy. Zesz. Nauk. Politech. Poznańskiej. Organ. I Zarządzanie 2016, 70, 165–175. [Google Scholar]
- Stasiła-Sieradzka, M.; Znajmiecka-Sikora, M. Staff Assessment of the Work Safety Climate in Its Importance to Human Resource Management in Creating a Safe Work Environment: Kooperacyjny zakres działań w zarządzaniu zasobami ludzkimi i bezpieczeństwem i higieną pracy. Zarządzanie Zasobami Ludzkimi 2017, 5, 39–53. [Google Scholar]
- Vierendeels, G.; Reniers, G.; van Nunen, K.; Ponnet, K. An integrative conceptual framework for safety culture: The Egg Aggregated Model (TEAM) of safety culture. Saf. Sci. 2018, 103, 323–339. [Google Scholar] [CrossRef]
- Petitta, L.; Probst, T.M.; Barbaranelli, C.; Ghezzi, V. Rozróżnienie roli klimatu bezpieczeństwa i kultury bezpieczeństwa: Wielopoziomowe efekty na związek między egzekwowaniem przez przełożonego a przestrzeganiem zasad bezpieczeństwa. Accid. Anal. Prev. 2017, 99, 77–89. [Google Scholar] [CrossRef]
- Dollard, M.F.; Dormann, C.; Idris, M.A. Psychosocoal Safety Climate. A New Work Stress Theory and Implicatios for Method. In Psychosocial Safety Climate. A New Work Stress Theory, 1st ed.; Dollard, M.F., Dormann, C., Idris, M.A., Eds.; Springer: Cham, Switzerland, 2019; pp. 3–31. [Google Scholar]
- Stasiła-Sieradzka, M.; Znajmiecka-Sikora, M. Pracownicza ocena klimatu bezpieczeństwa pracy w jego znaczeniu dla zarządzania zasobami ludzkimi w tworzeniu bezpiecznego środowiska pracy: Kooperacyjny zakres działań w zarządzaniu zasobami ludzkimi zakończony bezpieczeństwem i higieną pracy. Zarządzanie Zasobami Ludzkimi 2017, 5, 39–53. [Google Scholar]
| Dimensions/Type of Comparisons | PA | SB | ME | MO | RB | BO | WP | TP | AT | PO | SSCI | |
|---|---|---|---|---|---|---|---|---|---|---|---|---|
| Age | r | 0.050 | 0.066 | 0.119 | 0.036 | 0.087 | 0.080 | −0.037 | 0.098 | 0.121 | 0.114 | 0.127 |
| p | 0.481 | 0.348 | 0.091 | 0.612 | 0.216 | 0.256 | 0.599 | 0.163 | 0.087 | 0.104 | 0.071 | |
| Total years of service | r | 0.020 | 0.164 * | 0.196 ** | −0.003 | 0.064 | 0.001 | 0.055 | 0.024 | 0.126 | 0.142 * | 0.169 * |
| p | 0.777 | 0.019 | 0.005 | 0.967 | 0.361 | 0.984 | 0.435 | 0.729 | 0.073 | 0.044 | 0.016 | |
| Years of service in the company | r | 0.020 | 0.164 | 0.196 | −0.003 | 0.064 | 0.001 | 0.055 | 0.024 | 0.126 | 0.142 | 0.169 * |
| p | 0.777 | 0.019 | 0.005 | 0.967 | 0.361 | 0.984 | 0.435 | 0.729 | 0.073 | 0.044 | 0.016 |
Publisher’s Note: MDPI stays neutral with regard to jurisdictional claims in published maps and institutional affiliations. |
© 2022 by the authors. Licensee MDPI, Basel, Switzerland. This article is an open access article distributed under the terms and conditions of the Creative Commons Attribution (CC BY) license (https://creativecommons.org/licenses/by/4.0/).
Share and Cite
Znajmiecka, M.; Roszko-Wójtowicz, E.; Stasiła-Sieradzka, M. In Search of Differences in the Perception of Safety Climate by Employees of an International Manufacturing Company. Int. J. Environ. Res. Public Health 2022, 19, 14980. https://doi.org/10.3390/ijerph192214980
Znajmiecka M, Roszko-Wójtowicz E, Stasiła-Sieradzka M. In Search of Differences in the Perception of Safety Climate by Employees of an International Manufacturing Company. International Journal of Environmental Research and Public Health. 2022; 19(22):14980. https://doi.org/10.3390/ijerph192214980
Chicago/Turabian StyleZnajmiecka, Marta, Elżbieta Roszko-Wójtowicz, and Marta Stasiła-Sieradzka. 2022. "In Search of Differences in the Perception of Safety Climate by Employees of an International Manufacturing Company" International Journal of Environmental Research and Public Health 19, no. 22: 14980. https://doi.org/10.3390/ijerph192214980