


Physico-Chemical Properties and Deposition Potential of PM2.5 during Severe Smog Event in Delhi, India
Abstract
:1. Introduction
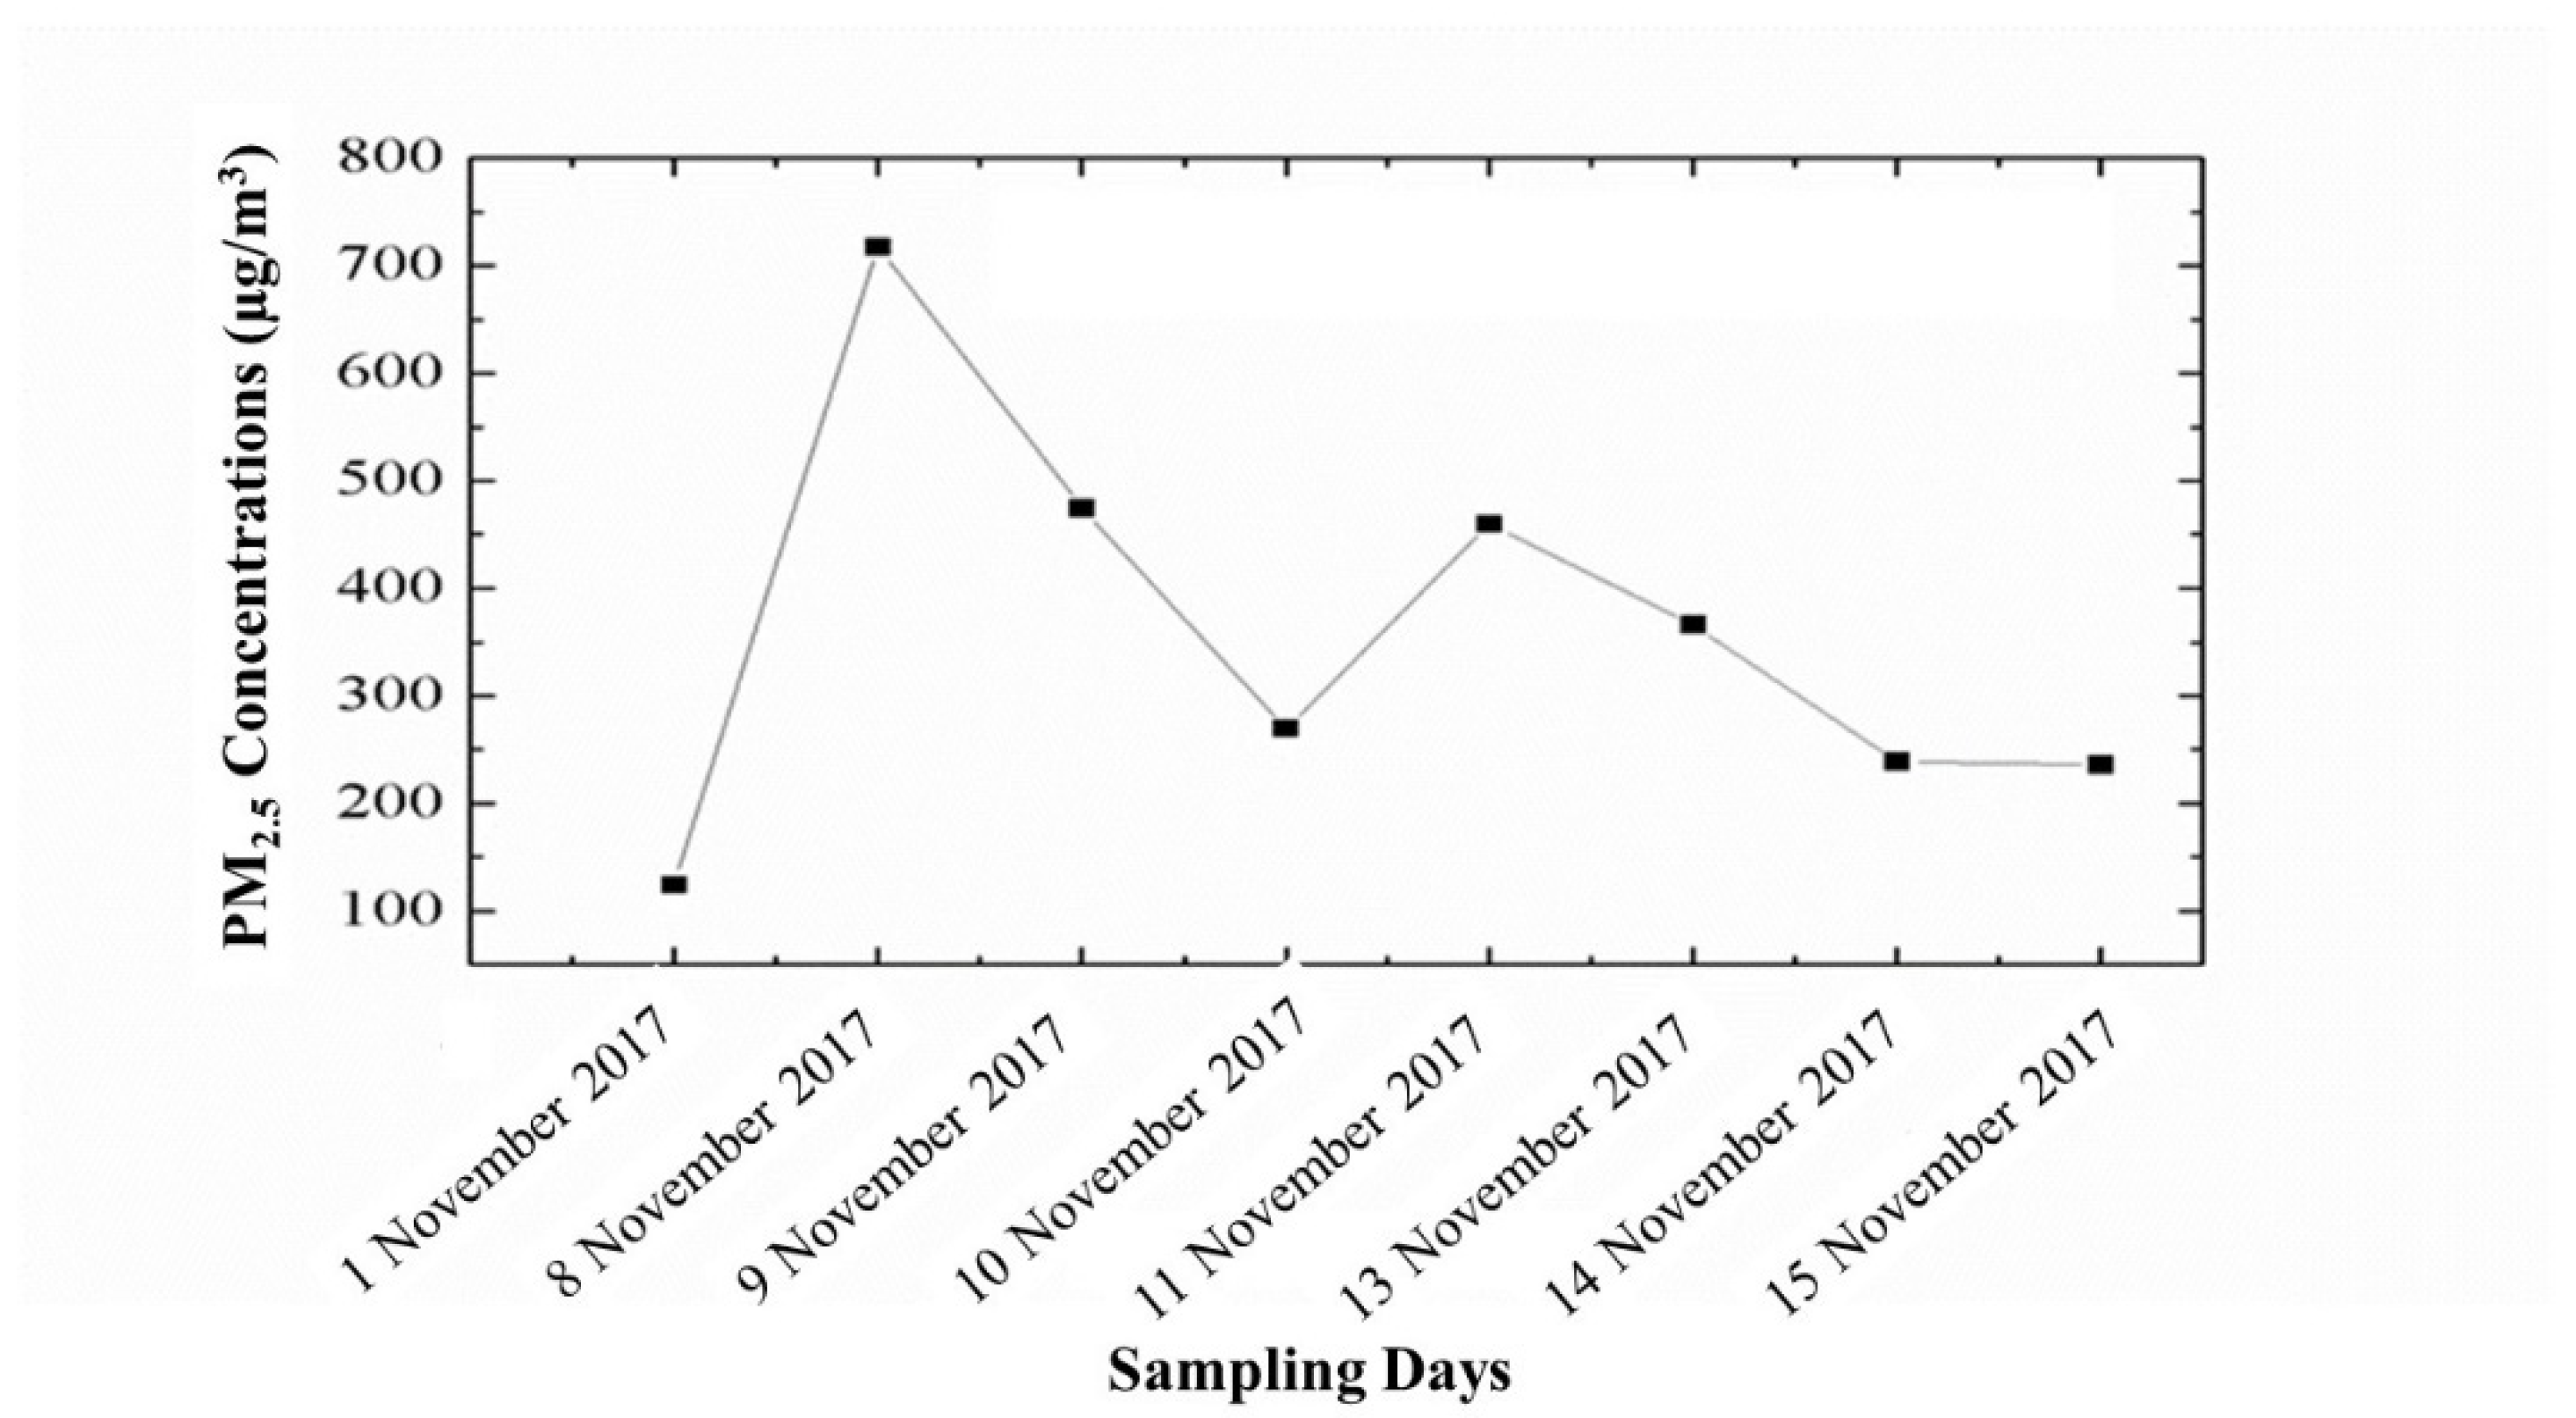
- Variations in PM2.5 concentration and meteorological parameters pre-, during, and post-Smog Event-2017.
- PM2.5 analysis for elemental composition, organic functional groups, and morphology during Smog Event-2017.
- Variations in PM2.5 deposition potential and elemental deposition doses for different age groups pre-, during, and post- Smog Event-2017.
2. Study Area and Methodology
2.1. Sample Collection
2.2. Individual Particles Collection and Measurement
2.3. Quantitative and Qualitative Measurement of Bulk PM2.5 Samples
2.4. Secondary Data Collection
2.5. Deposition Potential Calculation
- (i)
- Airway morphometry: Out of eight different airway morphometry models, we selected “Yeh-Schum age-specific model”, which considers the different structure of lungs in relation to respective age groups. As asymmetric branching structure of human lungs greatly causes bias in both airflow and particle deposition in HRT, we selected this model, as it provides multiple path (all airways) particle deposition. Age groups (children and adults) that were selected for the study included 3-month, 21-month, 28-month, 3-year, 8-year, 14-year, 18-year, 21-year, and 30-year. Values for other input parameters in the airway morphometry category were set as default specific to the respective age category (e.g., functional residual capacity (FRC) and upper respiratory tract (URT) volume).
- (ii)
- (iii)
- Exposure conditions: Two types of exposure conditions can be chosen in the model as constant and variable. For our study we selected ‘constant exposure’ for estimating 24-h PM depositions of a given concentration (mg/m3) at a constant rate. Other input parameters included acceleration of gravity (981.0 cm/s2); body orientation (upright); breathing frequency (per min); tidal volume (in mL); inspiratory fraction (0.5); pause fraction (0); and breathing scenario (nasal) for each age group.
2.6. Exposure Assessment Calculation for PM2.5 Associated Elements
- C = Metal concentrations in PM2.5 (µg/m3);
- InhR = Inhalation rate (m3/day) (7.63 for adults and 20 for children);
- EF = Exposure frequency (365 days/year);
- ED = Exposure duration (24 year for adults and 6 year for children);
- BW = Body weight (70 kg for adults and 15 kg for children);
- PEF = Particle emission factor (1.36 × 10⁹ m3/kg);
- AT = Averaging time for non-carcinogens (365 days/year).
3. Results & Discussion
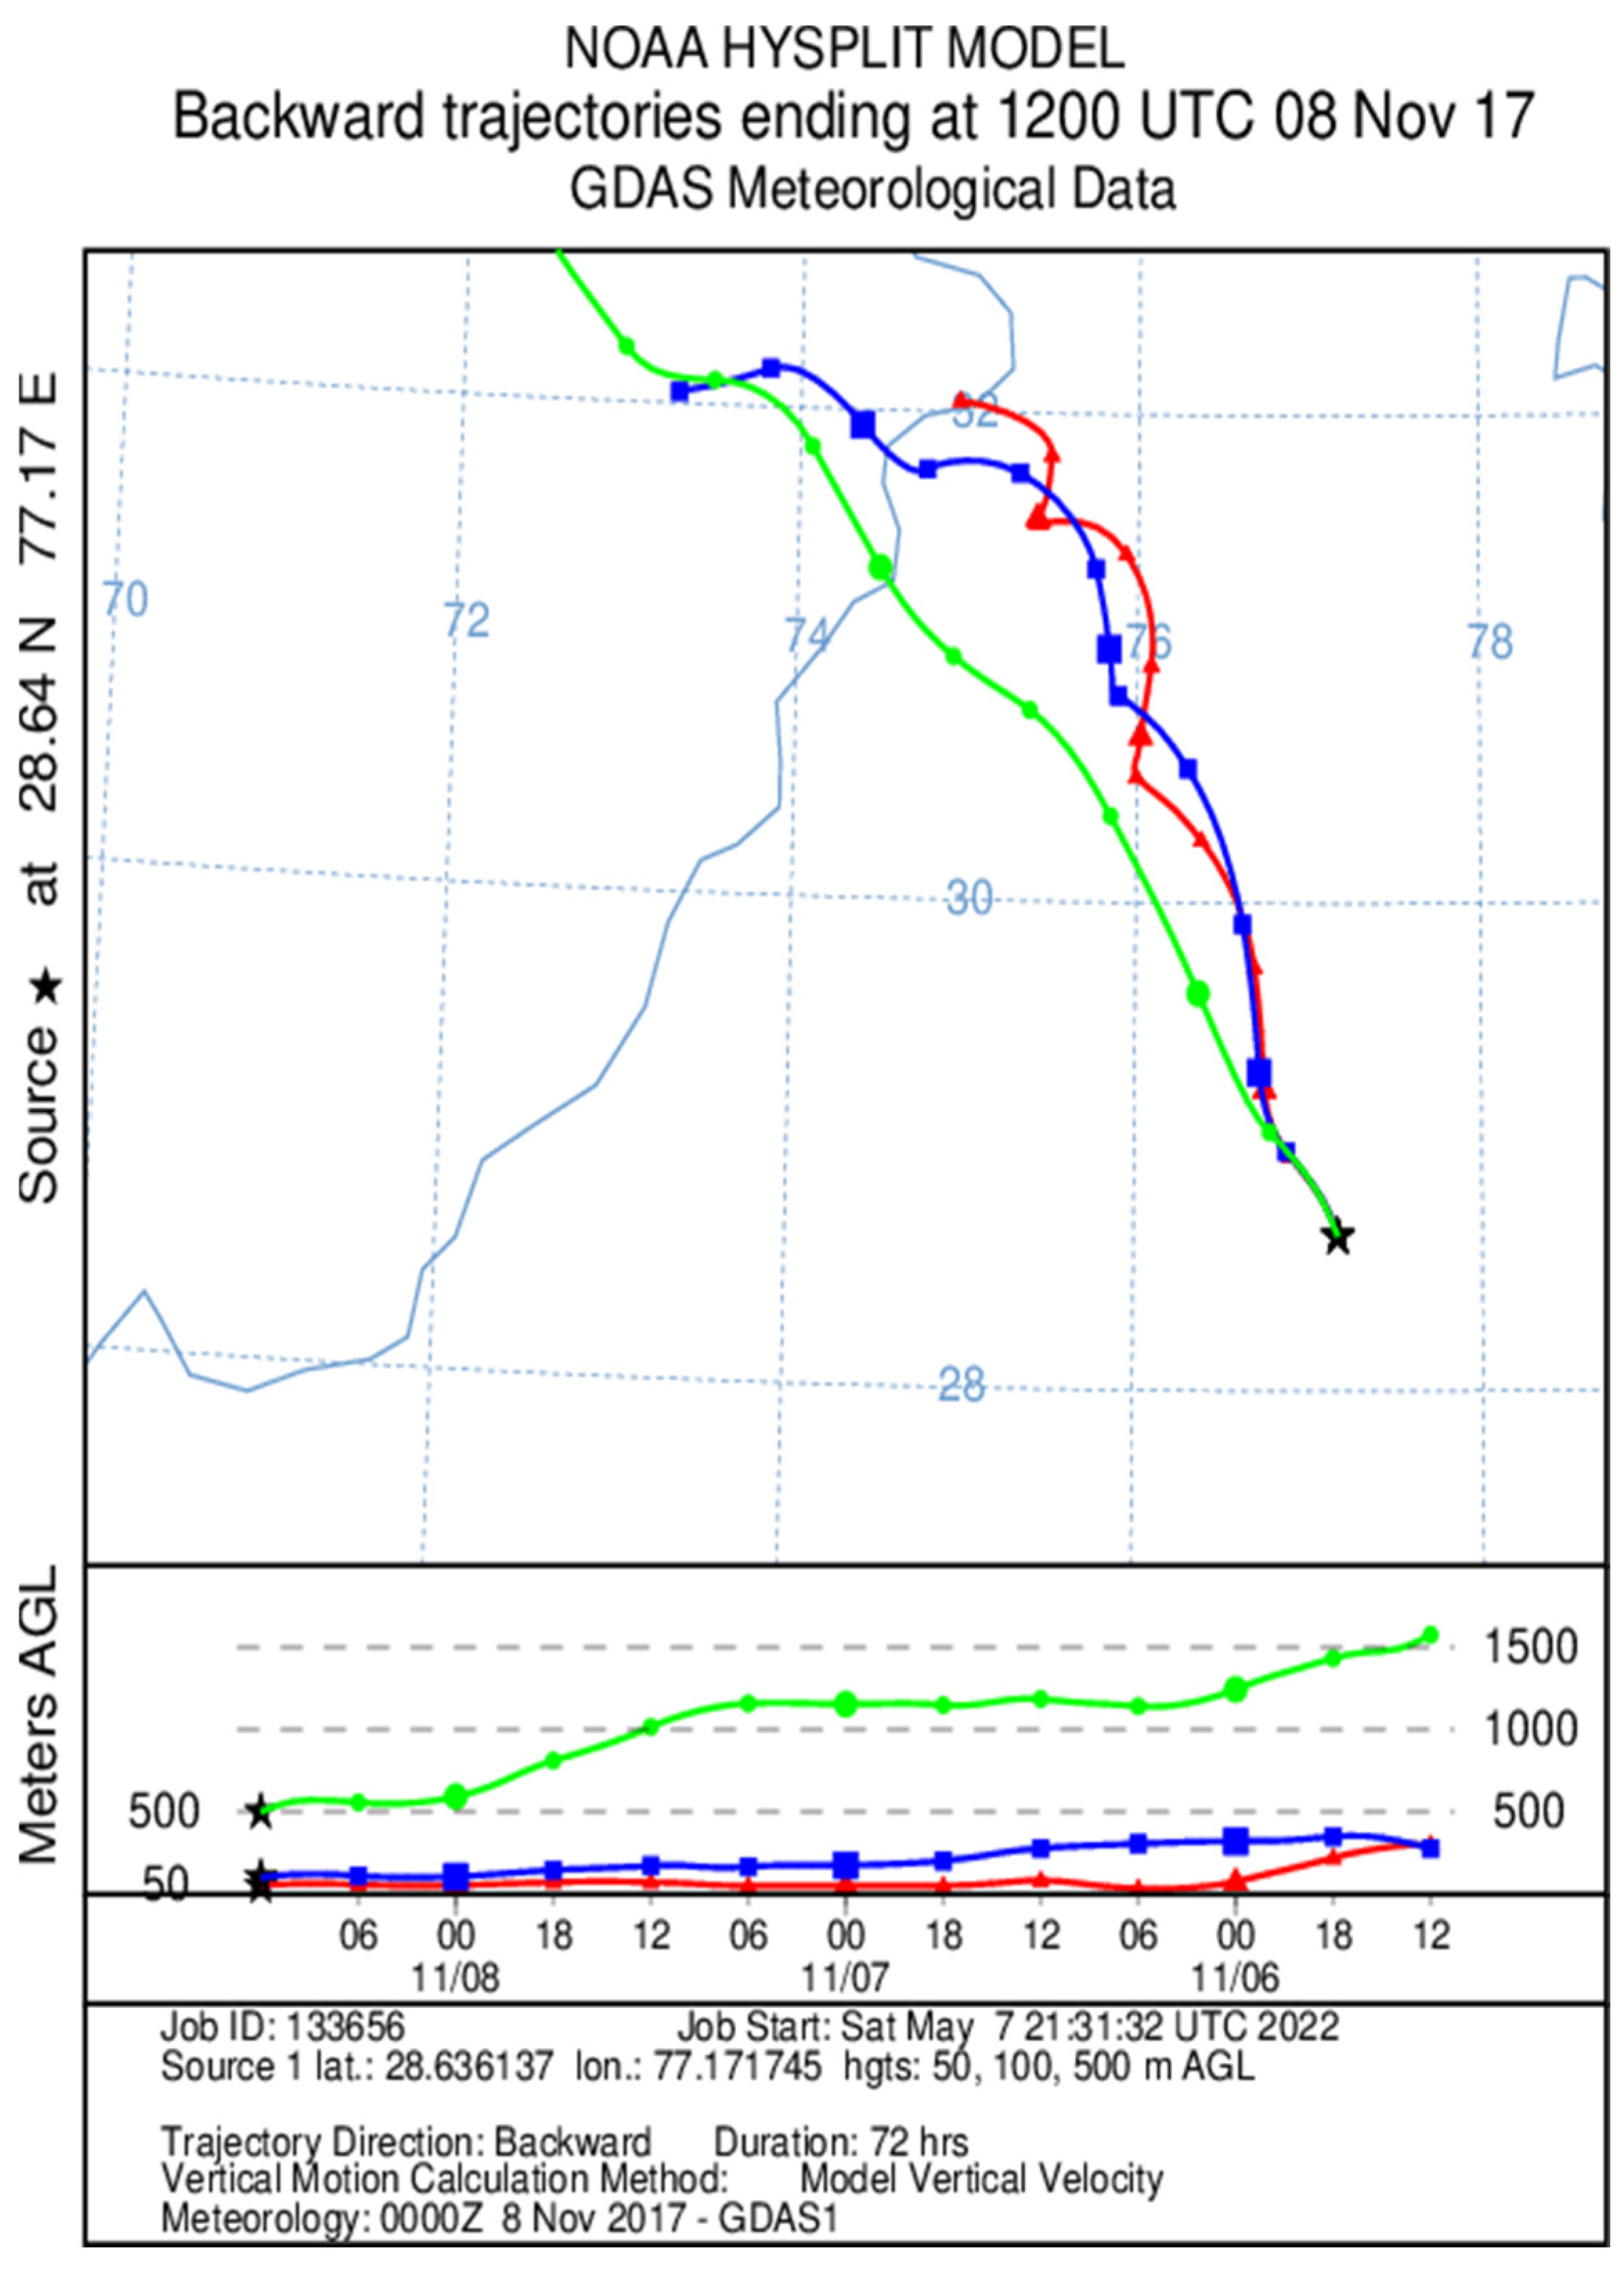
3.1. Variations in PM2.5 Concentrations and Meteorological Parameters during Smog Event-2017
3.2. Variations in PM2.5 Associated Elements, Organic Functional Groups, and Morphology during Smog Event-2017
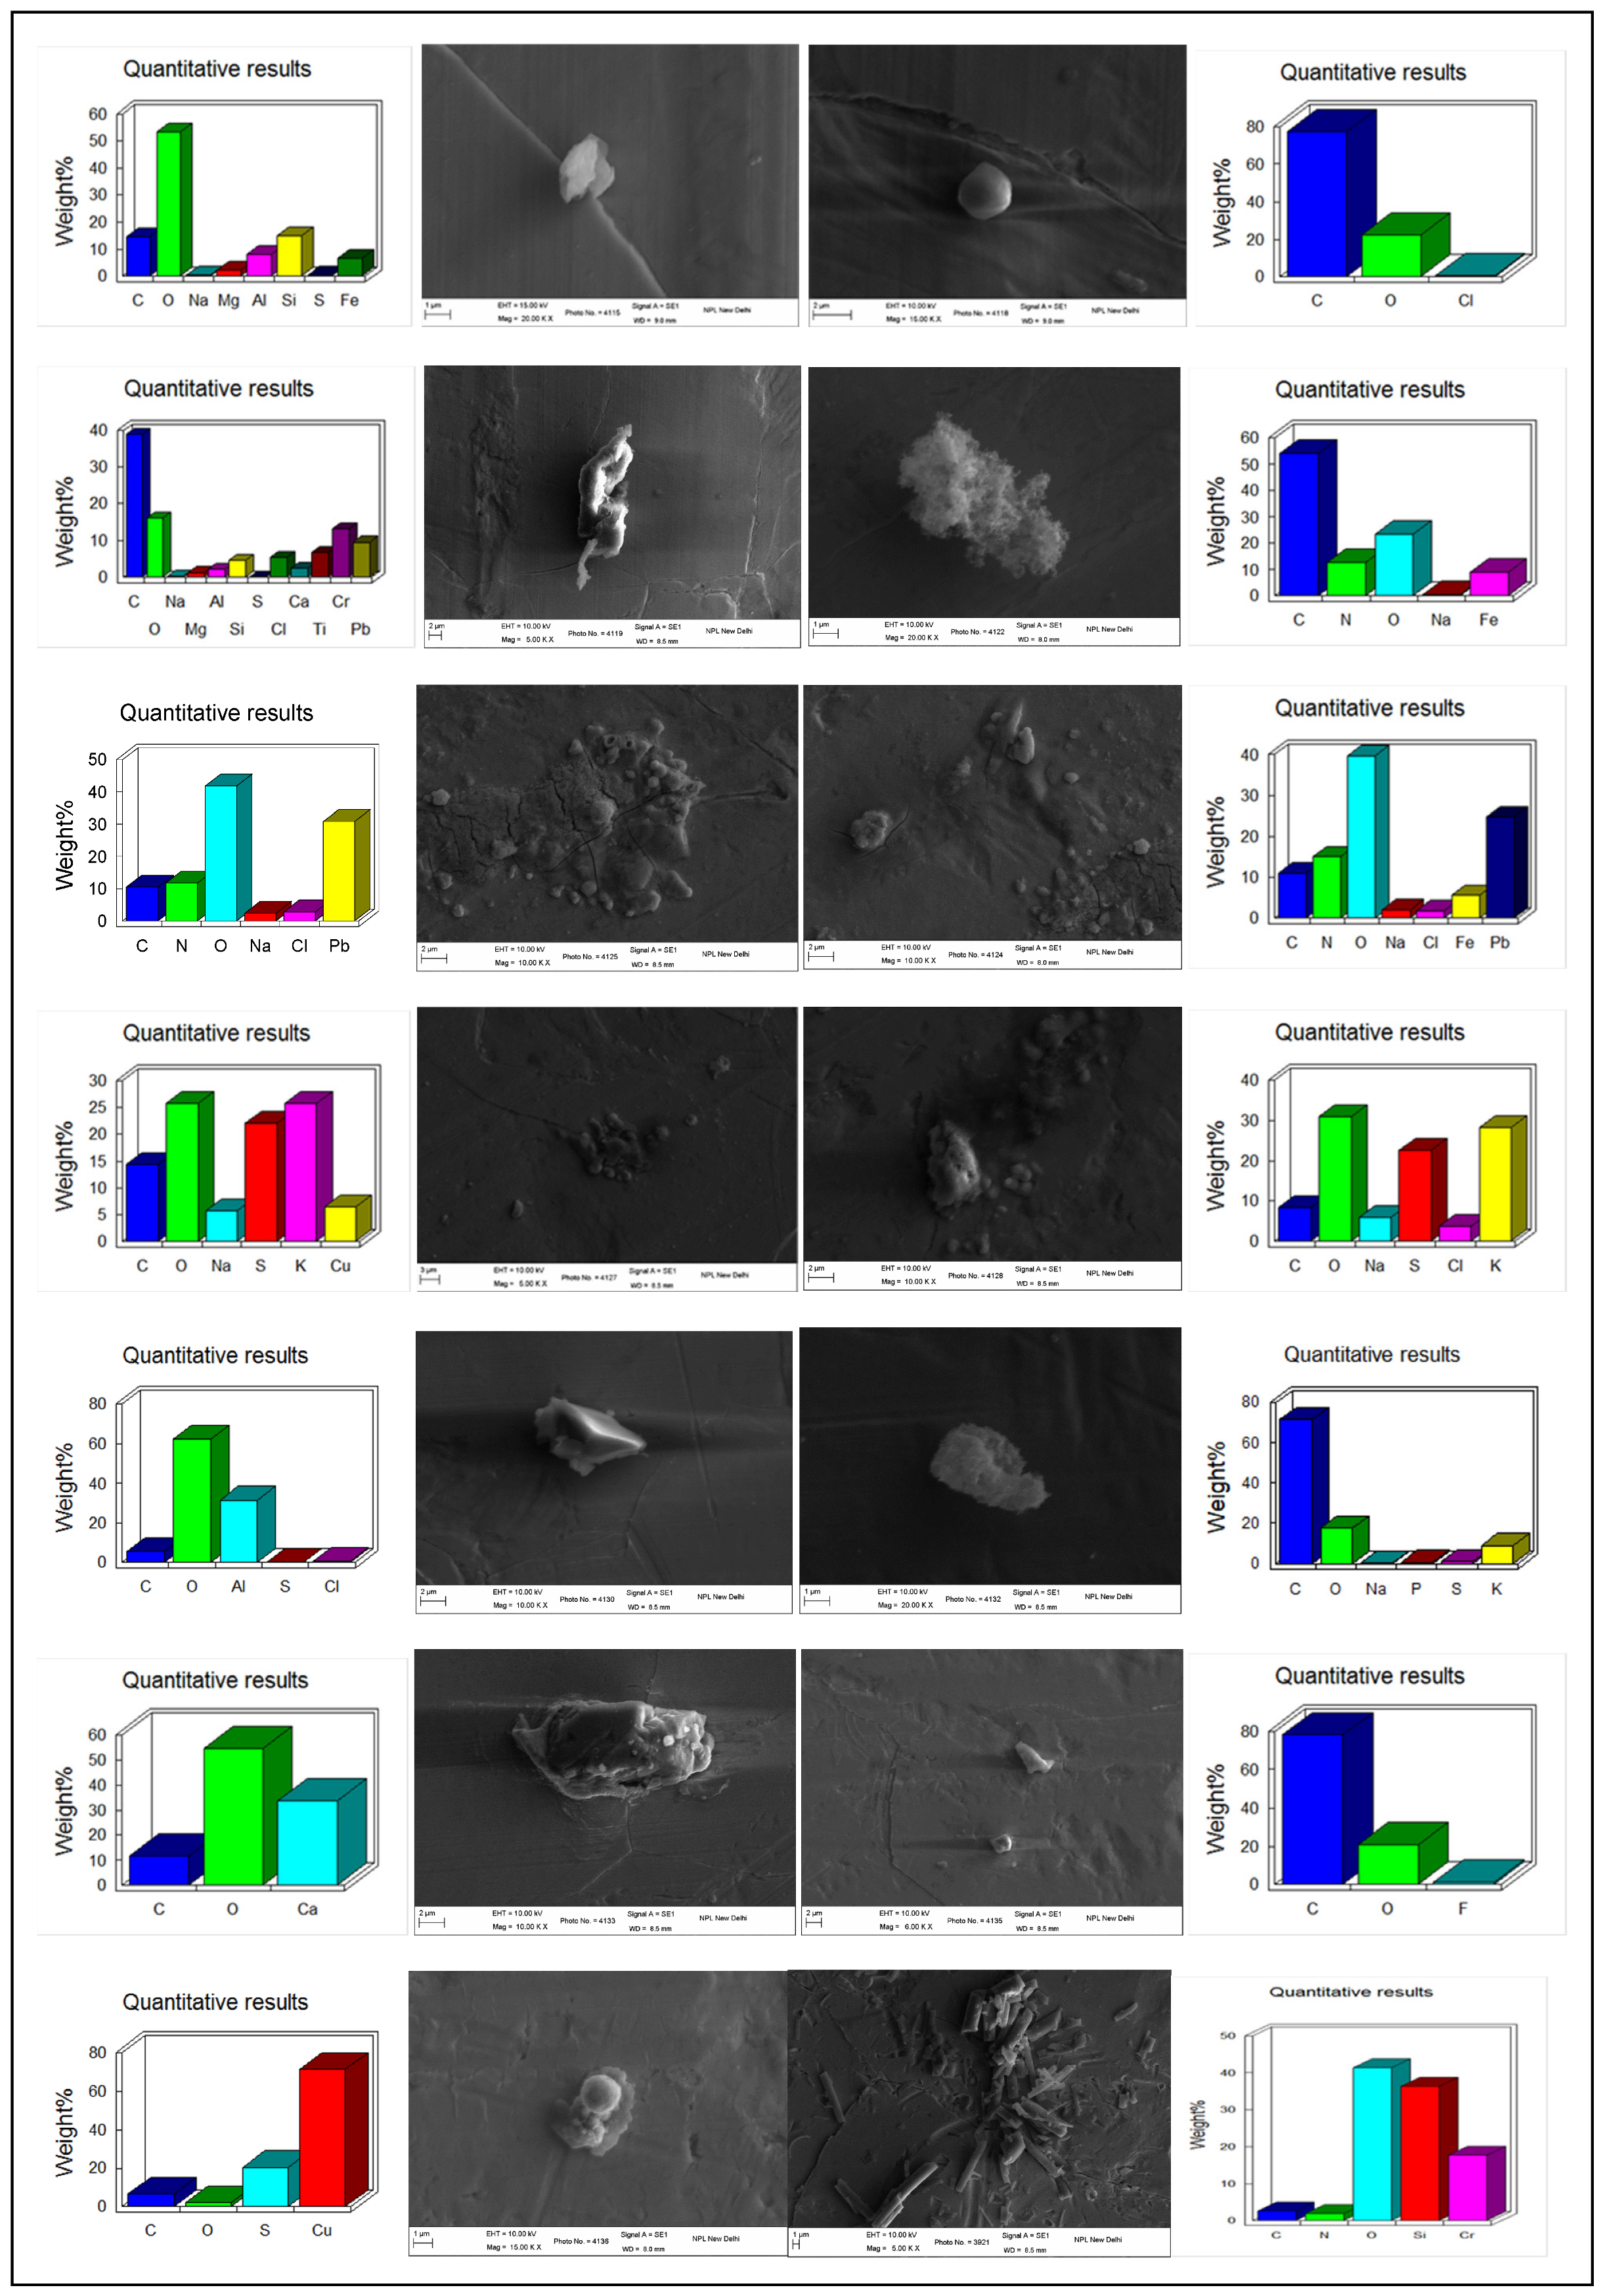
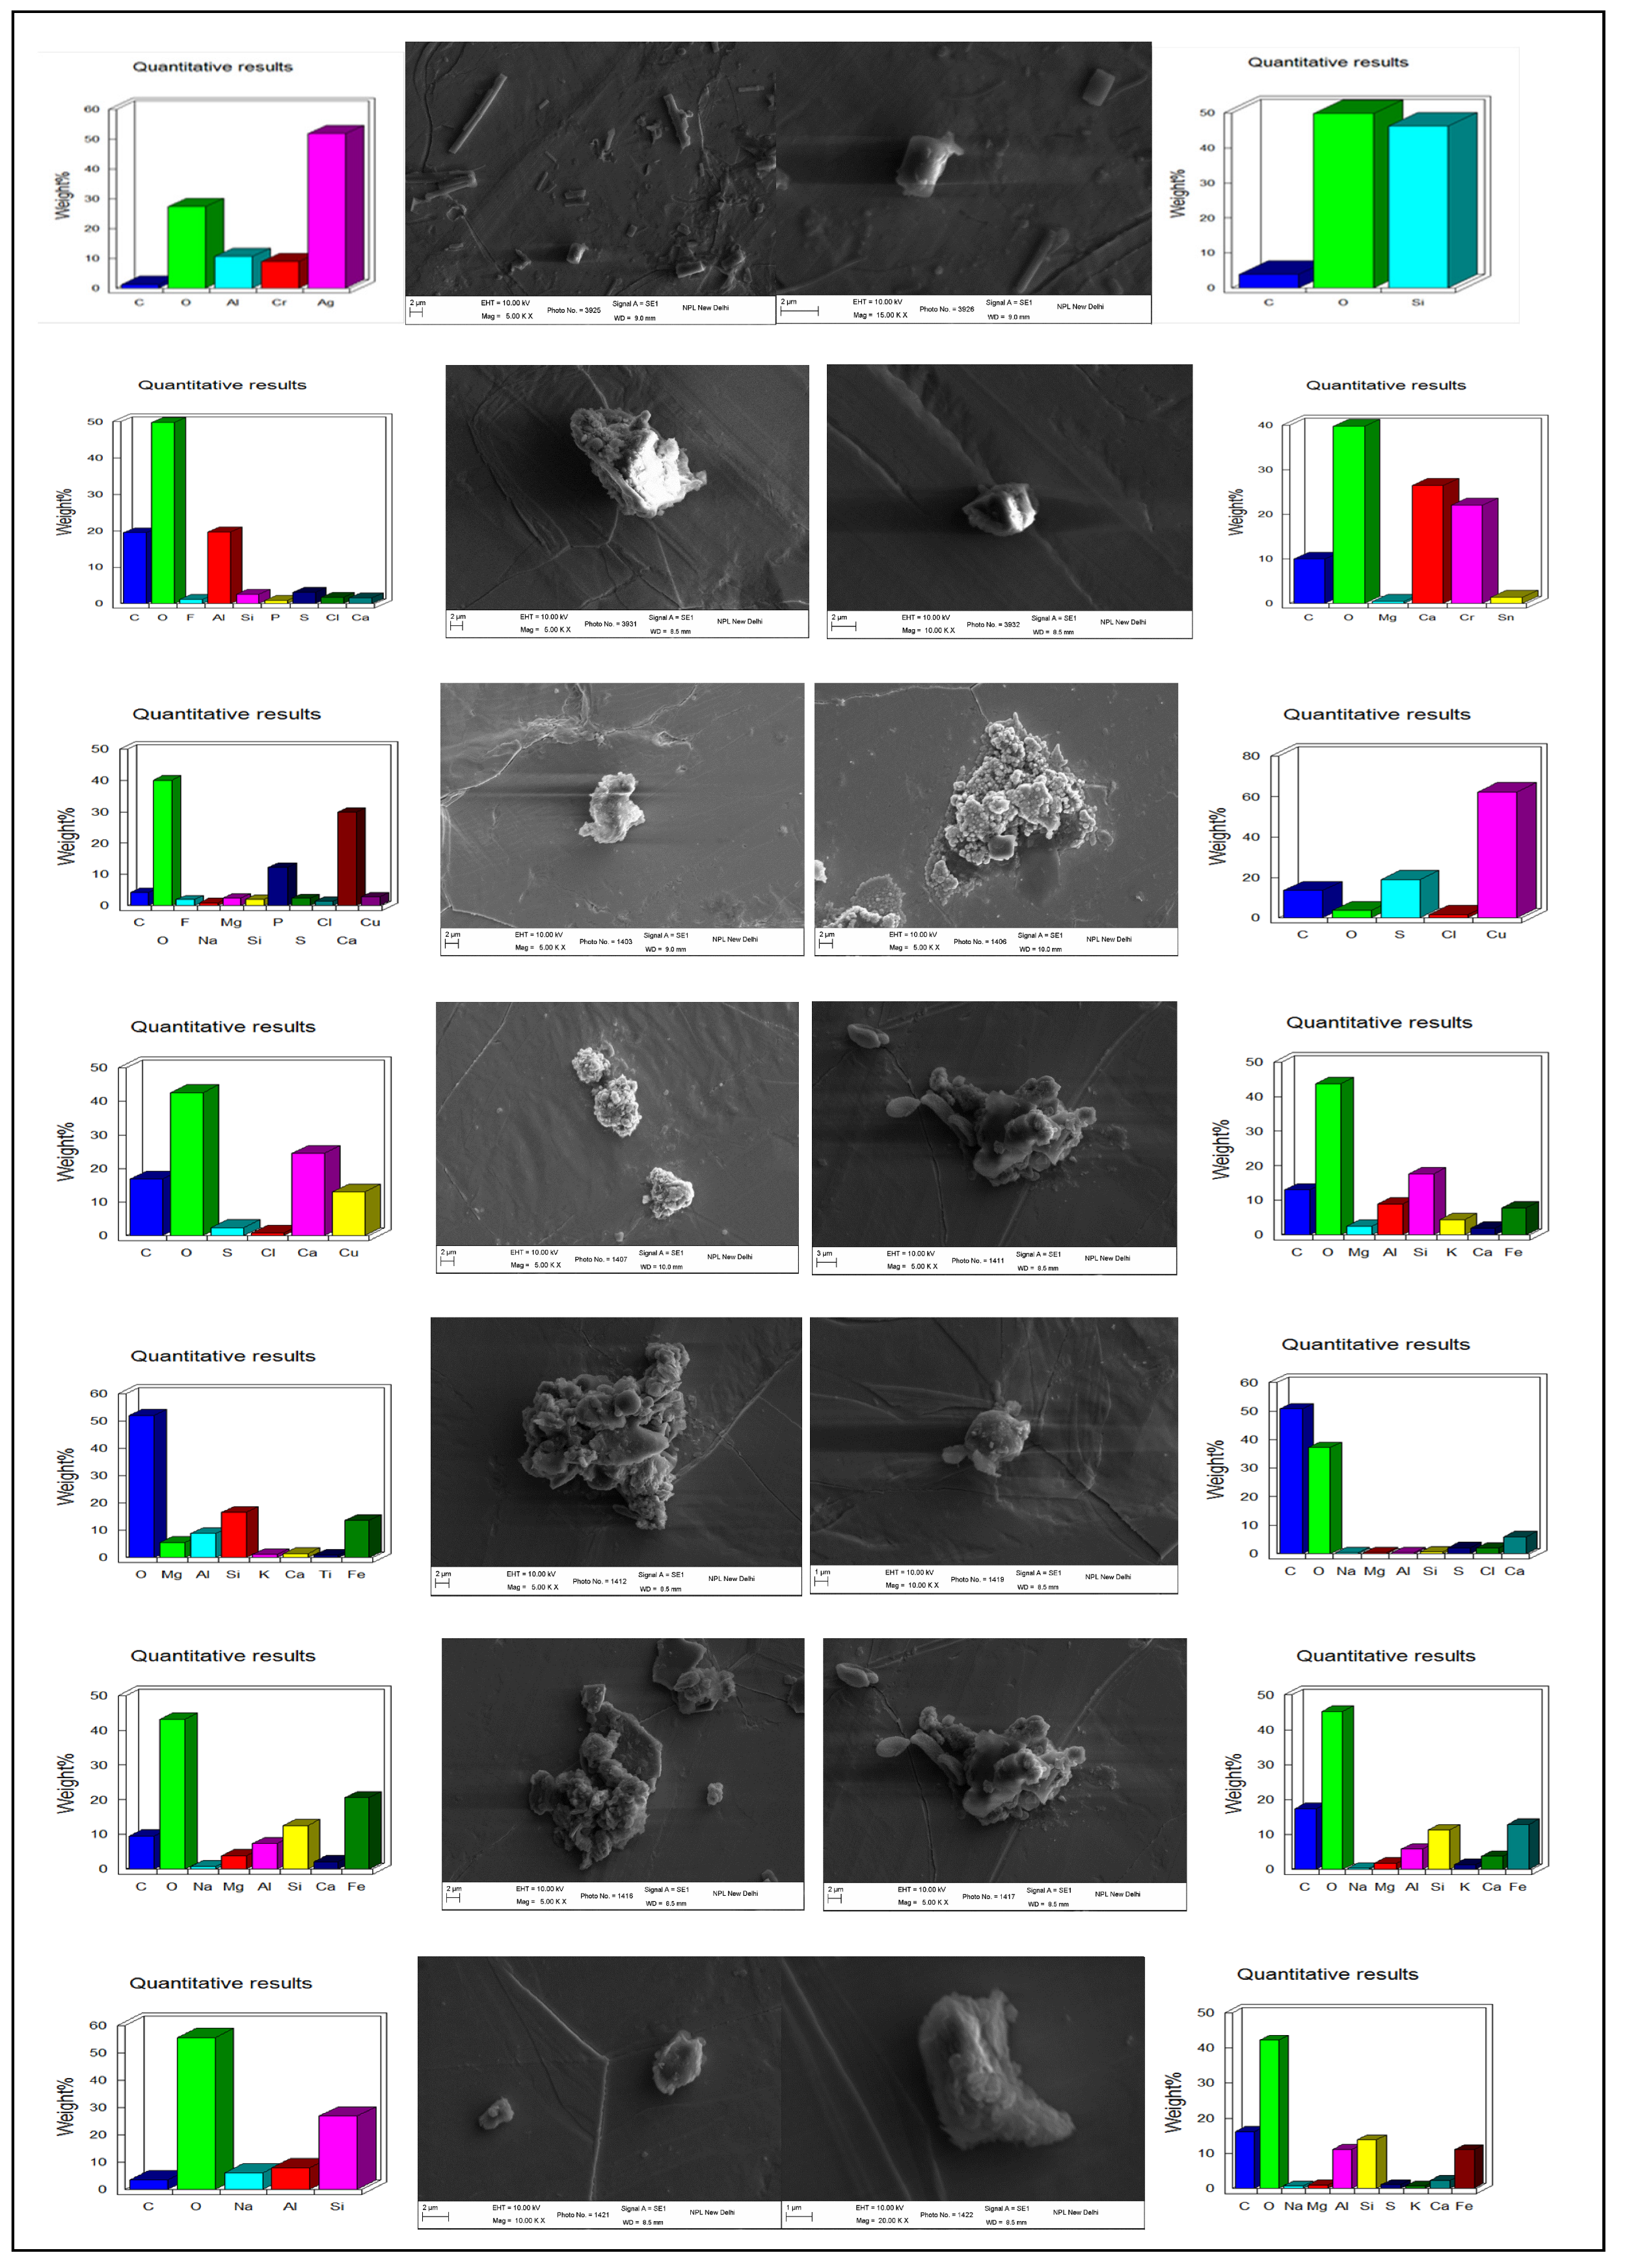
3.2.1. Elemental Composition
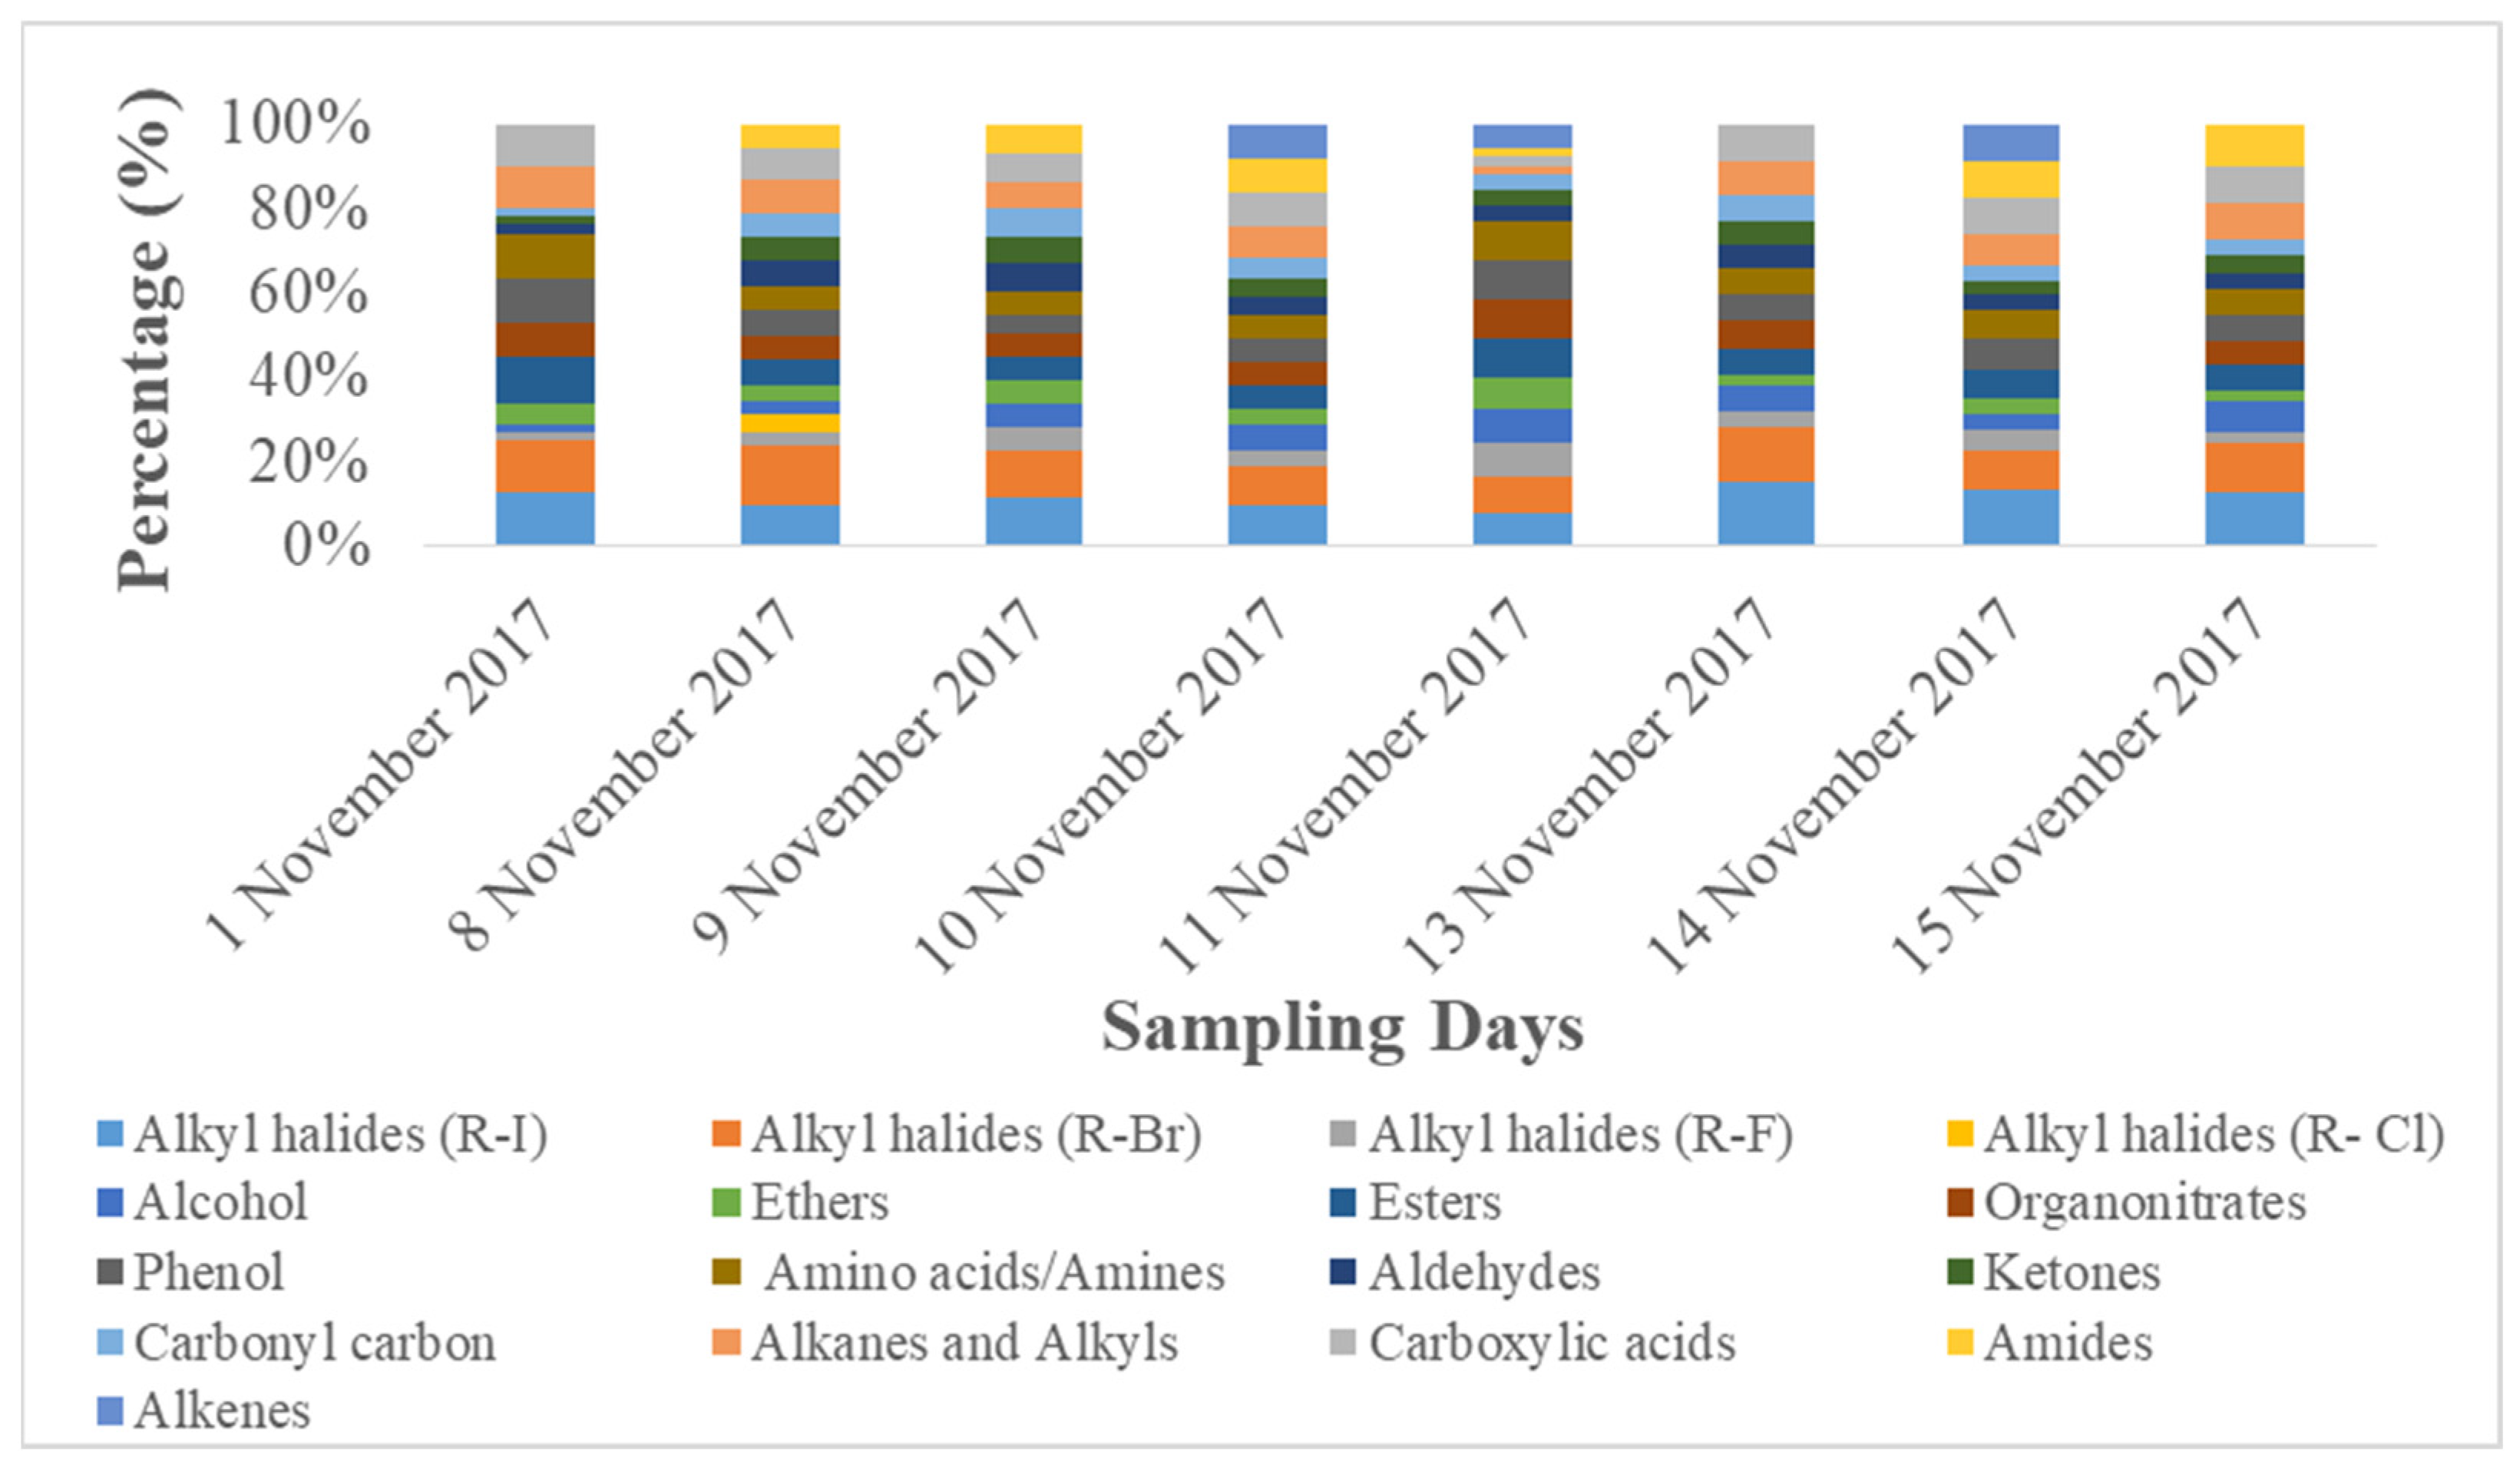
3.2.2. Organic Functional Groups
- Biogenic functional groups (ether, carbohydrates, hydroxyl groups, amino acids, and amines functional groups);
- Oxygenated functional groups (carboxylic acid, aldehydes, ketones, esters, lactone, and acid anhydride);
- Aliphatic hydrocarbon functional groups (aliphatic CH, alkenes, methyl, and methylene functional groups), and,
- Aromatic hydrocarbon functional groups, etc.
3.2.3. Morphology
3.3. Variations in PM2.5 Deposition Potential during Smog Event-2017
3.4. Variations in Average Daily Dose of PM2.5 Associated Elements during Smog Event-2017
4. Conclusions
Author Contributions
Funding
Institutional Review Board Statement
Informed Consent Statement
Acknowledgments
Conflicts of Interest
Abbreviations
| MPPD | Multiple path particle dosimetry |
| PM | Particulate matter |
| PM2.5 | Particulate matter with aerodynamic diameter less than 2.5 |
| IGP | Indo-Gangetic Plains |
| COPD | Chronic Obstructive Pulmonary Disease |
| NCT | National Capital Territory |
| CSIR-NPL | CSIR-National Physical Laboratory |
| PTFE | Polytetrafluoroethylene |
| SEM | Scanning Electron Microscopy |
| EDS | Energy Dispersive X-ray spectroscopy |
| WD-XRF | Wavelength Dispersive-X-ray Fluorescence |
| OP-FTIR | Open Path-Fourier Transform Infrared Spectroscopy |
| MIR | Mid-infrared |
| MCT | Mercury Cadmium Telluride |
| IMD | India Meteorological Department |
| HRT | Human respiratory tract |
| TB | Trachea-bronchial |
| P | Pulmonary |
| FRC | Functional residual capacity |
| URT | Upper respiratory tract |
| USEPA | United States Environment Protection Agency |
| ADD | Average daily dose |
| WHO | World Health Organization |
| NAAQS | National Ambient air Quality Standards |
| RH | Relative humidity |
| % | Percentage |
| NIST | National Institute of Standards and Technology |
References
- de Leeuw, F.A.A.M.; Moussiopoulos, N.; Sahm, P.; Bartonova, A. Urban air quality in larger conurbations in the European Union. Environ. Model. Softw. 2001, 16, 399–414. [Google Scholar] [CrossRef]
- Angyal1, A.; Ferenczi, Z.; Manousakas, M.; Furu1, E.; Szoboszlai1, Z.; Török, Z.; Papp, E.; Szikszai1, Z.; Kertész, Z. Source identification of fine and coarse aerosol during smog episodes in Debrecen, Hungary. Air Qual. Atmos. Health 2021, 14, 1017–1032. [Google Scholar] [CrossRef]
- Mikušaka, P.; Křůmal, K.; Večeřa, Z. Characterization of organic compounds in the PM2.5 aerosols in winter in an industrial urban area. Atmos. Environ. 2015, 105, 97–108. [Google Scholar] [CrossRef]
- Kanawade, V.P.; Srivastava, A.K.; Ram, K.; Asmi, E.; Vakkari, V.; Soni, V.K.; Varaprasad, V.; Sarangi, C. What caused severe air pollution episode of November 2016 in New Delhi? Atmos. Environ. 2020, 222, 117125. [Google Scholar] [CrossRef]
- Sawlani, R.; Agnihotri, R.; Sharma, C.; Patra, P.K.; Dimri, A.P.; Ram, K.; Verma, R.L. The severe Delhi SMOG of 2016: A case of delayed crop residue burning, coincident firecracker emissions, and atypical meteorology. Atmos. Pollut. Res. 2019, 10, 868–879. [Google Scholar] [CrossRef]
- Badarinath, K.V.S.; Kharol, S.K.; Sharma, A.R.; Krishna Prasad, V. Analysis of aerosol and carbon monoxide characteristics over Arabian Sea during crop residue burning period in the Indo-Gangetic Plains using multi-satellite remote sensing datasets. J. Atmos. Sol. Terr. Phy. 2009, 71, 1267–1276. [Google Scholar] [CrossRef]
- Chowdhury, S.; Dey, S.; Guttikunda, S.; Pillarisetti, A.; Smith, K.R.; Di Girolamo, L. Indian annual ambient air quality standard is achievable by completely mitigating emissions from household sources. Proc. Natl. Acad. Sci. USA 2019, 116, 10711–10716. [Google Scholar] [CrossRef] [Green Version]
- Reinmuth-Selzle, K.; Kampf, C.J.; Lucas, K.; Lang-Yona, N.; Fröhlich-Nowoisky, J.; Shiraiwa, M.; Lakey, P.S.J.; Lai, S.; Liu, F.; Kunert, A.T.; et al. Air Pollution and Climate Change Effects on Allergies in the Anthropocene: Abundance, Interaction, and Modification of Allergens and Adjuvants. Environ. Sci. Technol. 2017, 51, 4119–4141. [Google Scholar] [CrossRef]
- Subramanian, M. Can Delhi save itself from its toxic air? Nature 2016, 534, 166–169. [Google Scholar] [CrossRef] [Green Version]
- National Academy of Agricultural Sciences (NAAS). 2017. Available online: naas.org.in (accessed on 8 September 2022).
- Li, W.; Shao, L.; Zhang, D.; Ro, C.-U.; Hu, M.; Bi, X.; Geng, H.; Matsuki, A.; Niu, H.; Chen, J. A review of single aerosol particle studies in the atmosphere of East Asia: Morphology, mixing state, source, and heterogeneous reactions. J. Clean. Prod. 2016, 112, 1330–1349. [Google Scholar] [CrossRef]
- Jacobson, M.C.; Hansson, H.C.; Noone, K.J.; Charlson, R.J. Organic atmospheric aerosols: Review and state of the science. Rev. Geophys. 2000, 38, 267–294. [Google Scholar] [CrossRef] [Green Version]
- Pöschl, U. Atmospheric Aerosols: Composition, Transformation, Climate and Health Effects. Angew. Chem. Int. Ed. 2005, 44, 7520–7540. [Google Scholar] [CrossRef] [PubMed]
- Baklanov, A.; Grimmond, C.S.B.; Carlson, D.; Terblanche, D.; Tang, X.; Bouchet, V.; Lee, B.; Langendijk, G.; Kolli, R.K.; Hovsepyan, A. From urban meteorology, climate and environment research to integrated city services. Urban Clim. 2018, 23, 330–341. [Google Scholar] [CrossRef]
- Zhang, J.; Liu, L.; Wang, Y.; Ren, Y.; Wang, X.; Shi, Z.; Zhang, D.; Che, H.; Zhao, H.; Liu, Y.; et al. Chemical composition, source, and process of urban aerosols during winter haze formation in Northeast China. Environ. Pollut. 2017, 231, 357–366. [Google Scholar] [CrossRef] [PubMed]
- González-Flecha, B. Oxidant mechanisms in response to ambient air particles. Mol. Aspects Med. 2004, 25, 169–182. [Google Scholar] [CrossRef]
- Aust, A.E.; Ball, J.C.; Hu, A.A.; Lighty, J.S.; Smith, K.R.; Straccia, A.M.; Veranth, J.M.; Young, W.C. Particle characteristics responsible for effects on human lung epithelial cells. Res. Rep. Health Eff. Inst. 2002, 11, 67–76. [Google Scholar]
- Gilli, G.; Traversi, D.; Rovere, R.; Pignata, C.; Schilirò, T. Chemical characteristics and mutagenic activity of PM10 in Torino, a Northern Italian City. Sci. Total Environ. 2007, 385, 97–107. [Google Scholar] [CrossRef]
- Ostro, B.; Hu, J.; Goldberg, D.; Reynolds, P.; Hertz, A.; Bernstein, L.; Kleeman, M.J. Associations of mortality with long-term exposures to fine and ultrafine particles, species and sources: Results from the California Teachers Study Cohort. Environ. Health Perspect. 2015, 123, 549–556. [Google Scholar] [CrossRef]
- Available online: unep.org (accessed on 8 September 2022).
- Campbell, A.; Oldham, M.; Becaria, A.; Bondy, S.C.; Meacher, D.; Sioutas, C.; Misra, C.; Mendez, L.B.; Kleinman, M. Particulate Matter in polluted air may increase biomarkers of inflammation in mouse brain. Neurotoxicology 2006, 26, 133–140. [Google Scholar] [CrossRef] [Green Version]
- Fayad, M.A.; Tsolakis, A.; Martos, F.J.; Bogarra, M.; Lefort, I.; Dearn, K.D. Investigation the effect of fuel injection strategies on combustion and morphology characteristics of PM in modern diesel engine operated with oxygenate fuel blending. Therm. Sci. Eng. Prog. 2022, 35, 101456. [Google Scholar] [CrossRef]
- Valavanidis, A.; Fiotakis, K.; Vlachogianni, T. Airborne particulate matter and human health: Toxicological assessment and importance of size and composition of particles for oxidative damage and carcinogenic mechanisms. J. Environ. Sci. Health C Environ. Carcinog. Ecotoxicol. Rev. 2008, 26, 339–362. [Google Scholar] [CrossRef] [PubMed]
- Löndahl, J.; Pagels, J.; Swietlicki, E.; Zhou, J.; Ketzel, M.; Massling, A.; Bohgard, M. A set-up for field studies of respiratory tract deposition of fine and ultrafine particles in humans. J. Aerosol Sci. 2006, 37, 1152–1163. [Google Scholar] [CrossRef]
- Muenchen, H.Z. Particulate Air Pollution: Exposure to Ultrafine Particles Influences Cardiac Function; Science Daily; German Research Centre for Environmental Health: Neuherberg, Germany, 2015. [Google Scholar]
- Pražnikar, Z.J.; Pražnikar, J. The Effects of Particulate Matter Air Pollution on Respiratory Health and on the Cardiovascular System. Slov. J. Public Health 2011, 51, 190–199. [Google Scholar] [CrossRef] [Green Version]
- Peters, A.; Veronesi, B.; Calderòn-Garciduenas, L.; Gehr, P.; Chen, L.C.; Geiser, M.; Reed, W.; Rothen-Rutishauser, B.; Schürch, S.; Schulz, H. Translocation and potential neurological effects of fine and ultrafine particles a critical update. Part. Fibre Toxicol. 2006, 3, 13. [Google Scholar] [CrossRef] [PubMed] [Green Version]
- Madhwal, S.; Prabhu, V.; Sundriyal, S.; Shridhar, V. Distribution, characterization and health risk assessment of size fractionated bioaerosols at an open landfill site in Dehradun, India. Atmos. Pollut. Res. 2020, 11, 156–169. [Google Scholar] [CrossRef]
- Manojkumar, N.; Srimuruganandam, B.; Nagendra, S.M.S. Application of multiple-path particle dosimetry model for quantifying age specified deposition of particulate matter in human airway. Ecotoxicol. Environ. Saf. 2019, 168, 241–248. [Google Scholar] [CrossRef]
- Lv, H.; Li, H.; Qiu, Z.; Zhang, F.; Song, J. Assessment of pedestrian exposure and deposition of PM10, PM2.5 and ultrafine particles at an urban roadside: A case study of Xi’an, China. Atmos. Pollut. Res. 2021, 12, 112–121. [Google Scholar] [CrossRef]
- Izhar, S.; Goel, A.; Chakraborty, A.; Gupta, T. Annual trends in occurrence of submicron particles in ambient air and health risk posed by particle bound metals. Chemosphere 2016, 146, 582–590. [Google Scholar] [CrossRef]
- Jena, S.; Singh, G. Human health risk assessment of airborne trace elements in Dhanbad, India. Atmos. Pollut. Res. 2017, 8, 490–502. [Google Scholar] [CrossRef]
- Kushwaha, R.; Lal, H.; Srivastava, A.; Jain, V.K. Human exposure to particulate matter and their risk assessment over Delhi, India. Natl. Acad. Sci. Lett. 2012, 35, 497–504. [Google Scholar] [CrossRef]
- Pothirat, C.; Chaiwong, W.; Liwsrisakun, C.; Bumroongkit, C.; Deesomchok, A.; Theerakittikul, T.; Limsukon, A.; Tajaroenmuang, P.; Phetsuk, N. Influence of Particulate Matter during Seasonal Smog on Quality of Life and Lung Function in Patients with Chronic Obstructive Pulmonary Disease. Int. J. Environ. Res. Public Health 2019, 16, 106. [Google Scholar] [CrossRef] [PubMed]
- Carabali, G.; Villanueva-Macias, J.; Ladino, L.A.; Álvarez-Ospina, H.; Raga, G.B.; Andraca-Ayala, G.; Miranda, J.; Grutter, M.; Silva, M.M.; Riveros-Rosas, D. Characterization of aerosol particles during a high pollution episode over Mexico City. Sci. Rep. 2021, 11, 22533. [Google Scholar] [CrossRef]
- Yazdani, A.; Dudani, N.; Takahama, S.; Bertrand, A.; Prévôt, A.S.H.; El Haddad, I.; Dillner, A.M. Characterization of primary and aged wood burning and coal combustion organic aerosols in an environmental chamber and its implications for atmospheric aerosols. Atmos. Chem. Phys. 2021, 21, 10273–10293. [Google Scholar] [CrossRef]
- Gautam, R.; Patel, P.N.; Singh, M.K.; Liu, T.; Mickley, L.J.; Jethva, H.; DeFries, R.S. Extreme smog challenge of India intensified by increasing lower tropospheric stability. EarthArXiv 2021. [Google Scholar] [CrossRef]
- Sati, A.P.; Mohan, M. Analysis of air pollution during a severe smog episode of November 2012 and the Diwali Festival over Delhi, India. Int. J. Remote Sens. 2014, 35, 6940–6954. [Google Scholar] [CrossRef]
- Available online: citypopulation.de/en/india/cities/delhi/ (accessed on 9 September 2022).
- Goel, V.; Mishra, S.K.; Pal, P.; Ahlawat, A.; Vijayan, N.; Jain, S.; Sharma, C. Influence of chemical aging on physico-chemical properties of mineral dust particles: A case study of 2016 dust storms over Delhi. Environ. Pollut. 2020, 267, 115338. [Google Scholar] [CrossRef] [PubMed]
- Available online: earth.google.com (accessed on 9 September 2022).
- Fatima, S.; Sehgal, A.; Mishra, S.K.; Mina, U.; Goel, V.; Vijayan, N.; Tawale, J.S.; Kothari, R.; Ahlawat, A.; Sharma, C. Particle composition and morphology over urban environment (New Delhi): Plausible effects on wheat leaves. Environ. Res. 2021, 202, 111552. [Google Scholar]
- Available online: ready.noaa.gov/hypub-bin/trajtype.pl (accessed on 9 September 2022).
- Available online: firms.modaps.eosdis.nasa.gov (accessed on 10 September 2022).
- Available online: hindustantimes.com (accessed on 10 September 2022).
- Available online: ara.com/mppd/ (accessed on 10 September 2022).
- Goel, V.; Mishra, S.K.; Lodhi, N.; Singh, S.; Ahlawat, A.; Gupta, B.; Das, R.M.; Kotnala, R.K. Physico-chemical characterization of individual Antarctic particles: Implications to aerosol optics. Atmos. Environ. 2018, 192, 173–181. [Google Scholar]
- Sarangi, B.; Aggarwal, S.G.; Sinha, D.; Gupta, P.K. Aerosol effective density measurement using scanning mobility particle sizer and quartz crystal microbalance with the estimation of involved uncertainty. Atmos. Meas. Technol. 2016, 9, 859–875. [Google Scholar] [CrossRef] [Green Version]
- USEPA. Guidance for evaluating the oral bioavailability of metals in soils for use in human health risk assessment. OSWER 2007, 9285, 7–80. [Google Scholar]
- Jimenez, J.L.; Canagaratna, M.R.; Donahue, N.M.; Prevot, A.S.H.; Zhang, Q.; Kroll, J.H.; DeCarlo, P.F.; Allan, J.D.; Coe, H.; Ng, N.L.; et al. Evolution of organic aerosols in the atmosphere. Science 2009, 326, 1525–1529. [Google Scholar] [CrossRef] [PubMed]
- Zhang, X.; Wu, Y.; Gu, B. Characterization of haze episodes and factors contributing to their formation using a panel model. Chemosphere 2016, 149, 320–327. [Google Scholar] [CrossRef]
- Janhäll, S. Review on urban vegetation and particle air pollution–Deposition and dispersion. Atmos. Environ. 2015, 105, 130–137. [Google Scholar] [CrossRef]
- Available online: ppcb.punjab.gov.in/en (accessed on 10 September 2022).
- Minguillón, M.C.; Querol, X.; Baltensperger, U.; Prévôt, A.S.H. Fine and coarse PM composition and sources in rural and urban Switzerland: Local or regional pollution? Sci. Total Environ. 2012, 427–428, 191–202. [Google Scholar] [CrossRef] [PubMed]
- Moffet, R.C.; Desyaterik, Y.; Hopkins, R.J.; Tivanki, A.V.; Gilles, M.K.; Wang, Y.; Shutthanandan, V.; Molina, L.T.; Abraham, R.G.; Johnsin, K.S.; et al. Characterization of aerosols containing Zn, Pb, and Cl from an industrial region of Mexico City. Environ. Sci. Technol. 2008, 42, 7091–7097. [Google Scholar] [CrossRef] [Green Version]
- Li, W.; Sun, J.; Xu, L.; Shi, Z.; Riemer, N.; Sun, Y.; Fu, P.; Zhang, J.; Lin, Y.; Wang, X.; et al. A conceptual framework for mixing structures in individual aerosol particles. J. Geophys. Res. Atmos. 2016, 121, 13784–13798. [Google Scholar] [CrossRef]
- Huang, K.; Zhuang, G.; Lin, Y.; Fu, J.S.; Wang, Q.; Liu, T.; Zhang, R.; Jiang, Y.; Deng, C.; Fu, Q.; et al. Typical types and formation mechanisms of haze in an Eastern Asia Megacity, Shanghai. Atmos. Chem. Phys. 2012, 12, 105–124. [Google Scholar] [CrossRef] [Green Version]
- Cao, G.; Yan, Y.; Zou, X.; Zhu, R.; Ouyang, F. Applications of infrared spectroscopy in analysis of organic aerosols. Spectr. Anal. Rev. 2018, 6, 12–32. [Google Scholar] [CrossRef] [Green Version]
- Liu, S.; Ahlm, L.; Day, D.A.; Russell, L.M.; Zhao, Y.; Gentner, D.R.; Weber, R.J.; Goldstein, A.H.; Jaoui, M.; Offenberg, J.H.; et al. Secondary organic aerosol formation from fossil fuel sources contribute majority of summertime organic mass at Bakersfield. J. Geophys. Res. Atmos. 2012, 117. [Google Scholar] [CrossRef] [Green Version]
- Schade, G.W.; Crutzen, P.J. Emission of aliphatic amines from animal husbandry and their reactions: Potential source of N2O and HCN. J. Atmos. Chem. 1995, 22, 319–346. [Google Scholar] [CrossRef]
- Gilman, J.B.; Lerner, B.M.; Kuster, W.C.; Goldan, P.D.; Warneke, C.; Veres, P.R.; Roberts, J.M.; De Gouw, J.A.; Burling, I.R.; Yokelson, R.J. Biomass burning emissions and potential air quality impacts of volatile organic compounds and other trace gases from fuels common in the US. Atmos. Chem. Phys. 2015, 15, 13915–13938. [Google Scholar] [CrossRef] [Green Version]
- Liu, A.; Wang, H.; Cui, Y.; Shen, L.; Yin, Y.; Wu, Z.; Guo, S.; Shi, S.; Chen, K.; Zhu, B.; et al. Characteristics of Aerosol during a Severe Haze-Fog Episode in the Yangtze River Delta: Particle Size Distribution, Chemical Composition, and Optical Properties. Atmosphere 2020, 11, 56. [Google Scholar] [CrossRef] [Green Version]
- Zhai, Y.; Liu, X.; Chen, H.; Xu, B.; Zhu, L.; Li, C.; Zeng, G. Source identification and potential ecological risk assessment of heavy metals in PM2.5 from Changsha. Sci. Total Environ. 2014, 493, 109–115. [Google Scholar] [CrossRef] [PubMed]
- Bhardwaj, P.; Singh, B.P.; Pandey, A.K.; Jain, V.K.; Kumar, K. Characterization and Morphological Analysis of Summer and Wintertime PM2.5 Aerosols over Urban-Rural Locations in Delhi-NCR. Int. J. Appl. Environ. Sci. 2017, 12, 1009–1030. [Google Scholar]
- Mishra, S.K.; Agnihotri, R.; Yadav, P.K.; Singh, S.; Prasad, M.V.S.N.; Praveen, P.S.; Tawale, J.S.; Mishra, N.D.; Arya, B.C.; Sharma, C. Morphology of atmospheric particles over Semi-Arid region (Jaipur, Rajasthan) of India: Implications for optical properties. Aerosol Air Qual. Res. 2015, 15, 974–984. [Google Scholar] [CrossRef]
- Mishra, S.K.; Saha, N.; Singh, S.; Sharma, C.; Prasad, M.V.S.N.; Gautam, S.; Misra, A.; Gaur, A.; Bhattu, D.; Ghosh, S.; et al. Morphology, mineralogy and mixing of individual atmospheric particles over Kanpur (IGP): Relevance of homogeneous equivalent sphere approximation in radiative models. MAPAN 2017, 32, 229–241. [Google Scholar] [CrossRef]
- Xiong, C.; Friedlander, S.K. Morphological properties of atmospheric aerosol aggregates. Proc. Natl. Acad. Sci. USA 2001, 98, 11851–11856. [Google Scholar] [CrossRef] [Green Version]
- China, S.; Mazzoleni, C.; Gorkowski, K.; Aiken, A.C.; Dubey, M.K. Morphology and mixing state of individual freshly emitted wildfire carbonaceous particles. Nat. Commun. 2013, 4, 2122. [Google Scholar] [CrossRef] [Green Version]
- Møller, P.; Folkmann, J.K.; Forchhammer, L.; Bräuner, E.V.; Danielsen, P.H.; Risom, L.; Loft, S. Air pollution, oxidative damage to DNA, and carcinogenesis. Cancer Lett. 2008, 266, 84–97. [Google Scholar] [CrossRef]
- Xu, X.; Lu, X.; Han, X.; Zhao, N. Ecological and health risk assessment of metal in re-suspended particles of urban street dust from an industrial city in China. Curr. Sci. 2015, 108, 72–79. [Google Scholar]


| Sr. No. | Sampling Dates | Details |
|---|---|---|
| 1 | 1 November 2017 | Pre-smog |
| 2 | 8 November 2017 | Smog |
| 3 | 9 November 2017 | Post-smog |
| 4 | 10 November 2017 | Post-smog |
| 5 | 11 November 2017 | Post-smog |
| 6 | 13 November 2017 | Post-smog |
| 7 | 14 November 2017 | Post-smog |
| 8 | 15 November 2017 | Post-smog |
| Sampling Date | WS (m/s) | Visibility (m) | T (°C) | RH (%) |
|---|---|---|---|---|
| 1 November 2017 | 2.36 | 1942 | 23.3 | 75.9 |
| 8 November 2017 | 0.71 | 385 | 19.8 | 81.9 |
| 9 November 2017 | 0.86 | 709 | 20.0 | 76.3 |
| 10 November 2017 | 0.60 | 940 | 19.8 | 76.1 |
| 11 November 2017 | 0.79 | 795 | 19.7 | 77.3 |
| 13 November 2017 | 2.07 | 942 | 19.1 | 79.9 |
| 14 November 2017 | 3.00 | 1123 | 20.0 | 75.5 |
| 15 November 2017 | 2.48 | 1806 | 19.4 | 75.0 |
| Sr. No. | Elements | 01 November 2017 | 08 November 2017 | 09 November 2017 | 10 November 2017 | 11 November 2017 | 13 November 2017 | 14 November 2017 | 15 November 2017 |
|---|---|---|---|---|---|---|---|---|---|
| 1 | N | 10.0 | 58.0 | 38.4 | 21.8 | 37.2 | 29.6 | 19.3 | 19.1 |
| 3 | Na | 0.2 | 1.0 | 0.7 | 0.4 | 0.7 | 0.5 | 0.3 | 0.3 |
| 4 | Mg | 0.2 | 1.1 | 0.7 | 0.4 | 0.7 | 0.6 | 0.4 | 0.4 |
| 5 | Al | 0.8 | 4.8 | 3.2 | 1.8 | 3.1 | 2.4 | 1.6 | 1.6 |
| 6 | Si | 2.1 | 12.3 | 8.1 | 4.6 | 7.9 | 6.3 | 4.1 | 4.0 |
| 7 | P | 0.2 | 1.1 | 0.7 | 0.4 | 0.7 | 0.6 | 0.4 | 0.4 |
| 8 | S | 16.3 | 94.2 | 62.3 | 35.4 | 60.4 | 48.1 | 31.4 | 31.0 |
| 9 | Cl | 0.7 | 3.9 | 2.6 | 1.5 | 2.5 | 2.0 | 1.3 | 1.3 |
| 10 | K | - | 10.5 | 6.9 | 3.9 | 6.7 | 5.3 | 3.5 | 1.8 |
| 11 | Ca | 1.1 | 6.1 | 4.0 | 2.3 | 3.9 | 3.1 | 2.0 | 2.0 |
| 12 | Cr | 2.9 | 17.0 | 11.3 | 6.4 | 10.9 | 8.7 | 5.7 | 5.6 |
| 13 | Mn | 0.2 | 0.9 | 0.6 | 0.3 | 0.6 | 0.5 | 0.3 | 0.3 |
| 14 | Fe | 2.4 | 13.8 | 9.1 | 5.2 | 8.8 | 7.0 | 4.6 | 4.5 |
| 15 | Ni | 0.1 | 0.7 | 0.5 | 0.3 | 0.4 | 0.4 | 0.2 | 0.2 |
| 16 | Zn | 1.6 | 9.3 | 6.2 | 3.5 | 6.0 | 4.8 | 3.1 | 3.1 |
| 17 | Pb | 0.5 | 2.9 | 1.9 | 1.1 | 1.9 | 1.5 | 1.0 | 1.0 |
| 18 | Cu | 0.2 | 1.2 | 0.8 | 0.4 | 0.7 | 0.6 | 0.4 | 0.4 |
| 19 | Br | - | 0.8 | 0.6 | 0.3 | 0.5 | 0.4 | 0.3 | 0.3 |
| 20 | Ti | 0.2 | 1.1 | 0.7 | 0.4 | 0.7 | 0.5 | 0.4 | 0.4 |
| Sr. No. | Functional Groups | 01 November 2017 | 08 November 2017 | 09 November 2017 | 10 November 2017 | 11 November 2017 | 13 November 2017 | 14 November 2017 | 15 November 2017 |
|---|---|---|---|---|---|---|---|---|---|
| 1 | Alkyl halides (R-I) | 0.49 | 0.66 | 0.87 | 0.79 | 0.44 | 0.98 | 0.98 | 0.78 |
| 2 | Alkyl halides (R-Br) | 0.48 | 1.01 | 0.87 | 0.72 | 0.525 | 0.85 | 0.67 | 0.73 |
| 3 | Alkyl halides (R-F) | 0.06 | 0.24 | 0.41 | 0.28 | 0.46 | 0.22 | 0.39 | 0.14 |
| 4 | Alkyl halides (R-Cl) | - | 0.3 | - | - | - | - | - | - |
| 5 | Alcohol | 0.06 | 0.24 | 0.41 | 0.52 | 0.46 | 0.41 | 0.26 | 0.49 |
| 6 | Ethers | 0.21 | 0.24 | 0.41 | 0.28 | 0.46 | 0.16 | 0.26 | 0.14 |
| 7 | Esters | 0.41 | 0.42 | 0.44 | 0.45 | 0.54 | 0.41 | 0.52 | 0.37 |
| 8 | Organonitrates | 0.31 | 0.42 | 0.44 | 0.45 | 0.54 | 0.41 | - | 0.37 |
| 9 | Phenol | 0.41 | 0.42 | 0.302 | 0.45 | 0.54 | 0.41 | 0.52 | 0.37 |
| 10 | Amino acids/Amines | 0.41 | 0.42 | 0.44 | 0.45 | 0.54 | 0.41 | 0.52 | 0.37 |
| 11 | Aldehydes | 0.079 | 0.41 | 0.501 | 0.36 | 0.22 | 0.365 | 0.26 | 0.25 |
| 12 | Ketones | 0.079 | 0.41 | 0.501 | 0.36 | 0.22 | 0.365 | 0.26 | 0.25 |
| 13 | Carbonyl carbon | 0.079 | 0.41 | 0.501 | 0.36 | 0.22 | 0.365 | 0.26 | 0.25 |
| 14 | Alkanes and Alkyls | 0.36 | 0.54 | 0.47 | 0.62 | 0.1 | 0.55 | 0.52 | 0.53 |
| 15 | Carboxylic acids | 0.39 | 0.54 | 0.52 | 0.62 | 0.14 | 0.55 | 0.64 | 0.53 |
| 16 | Amides | - | 0.39 | 0.53 | 0.67 | 0.11 | - | 0.67 | 0.62 |
| 17 | Alkenes | - | - | - | 0.64 | 0.34 | - | 0.62 | - |
| Present Study | Age Groups | |||||||||
|---|---|---|---|---|---|---|---|---|---|---|
| Sr. No. | Deposition Fraction | 3-Month | 21-Month | 28-Month | 3-Year | 8-Year | 14-Year | 18-Year | 21-Year | 30-Year |
| 1 | Head deposition fraction | 0.24 | 0.25 | 0.29 | 0.28 | 0.27 | 0.26 | 0.42 | 0.41 | 0.47 |
| 2 | TB deposition fraction | 0.12 | 0.14 | 0.06 | 0.05 | 0.06 | 0.06 | 0.05 | 0.05 | 0.06 |
| 3 | Pulmonary deposition fraction | 0.30 | 0.29 | 0.21 | 0.28 | 0.40 | 0.33 | 0.28 | 0.31 | 0.20 |
| 4 | Total deposition fraction | 0.66 | 0.69 | 0.57 | 0.62 | 0.73 | 0.66 | 0.75 | 0.77 | 0.73 |
| Manojkumar et al., 2019 [29] | ||||||||||
| 5 | Head deposition fraction | 0.23 | - | 0.29 | 0.28 | 0.27 | 0.26 | 0.42 | 0.41 | - |
| 6 | TB deposition fraction | 0.12 | - | 0.06 | 0.05 | 0.06 | 0.06 | 0.05 | 0.05 | - |
| 7 | Pulmonary deposition fraction | 0.30 | - | 0.21 | 0.28 | 0.40 | 0.33 | 0.28 | 0.31 | - |
| 8 | Total deposition fraction | 0.65 | - | 0.56 | 0.61 | 0.73 | 0.65 | 0.74 | 0.77 | - |
| Pre-smog | Age Groups | |||||||||
|---|---|---|---|---|---|---|---|---|---|---|
| Sr. No. | Deposition Potential | 3-Month | 21-Month | 28-Month | 3-Year | 8-Year | 14-Year | 18-Year | 21-Year | 30-Year |
| 1 | Head deposited mass rate (µg/min) | 0.04 | 0.07 | 0.09 | 0.10 | 0.16 | 0.20 | 0.35 | 0.34 | 0.44 |
| 2 | TB deposited mass rate (µg/min) | 0.02 | 0.04 | 0.02 | 0.02 | 0.03 | 0.05 | 0.04 | 0.04 | 0.06 |
| 3 | Pulmonary deposited mass rate (µg/min) | 0.04 | 0.08 | 0.07 | 0.10 | 0.24 | 0.26 | 0.23 | 0.26 | 0.18 |
| 4 | Total deposited mass rate (µg/min) | 0.10 | 0.19 | 0.18 | 0.22 | 0.43 | 0.51 | 0.62 | 0.64 | 0.67 |
| Smog | ||||||||||
| 5 | Head deposited mass rate (µg/min) | 0.20 | 0.41 | 0.55 | 0.59 | 0.92 | 1.18 | 2.02 | 1.97 | 2.51 |
| 6 | TB deposited mass rate (µg/min) | 0.11 | 0.23 | 0.11 | 0.11 | 0.19 | 0.27 | 0.24 | 0.22 | 0.34 |
| 7 | Pulmonary deposited mass rate (µg/min) | 0.26 | 0.48 | 0.40 | 0.59 | 1.36 | 1.49 | 1.34 | 1.47 | 1.05 |
| 8 | Total deposited mass rate (µg/min) | 0.56 | 1.12 | 1.05 | 1.29 | 2.47 | 2.93 | 3.60 | 3.67 | 3.90 |
| Post-smog | ||||||||||
| 9 | Head deposited mass rate (µg/min) | 0.07 | 0.14 | 0.18 | 0.19 | 0.30 | 0.39 | 0.66 | 0.65 | 0.82 |
| 10 | TB deposited mass rate (µg/min) | 0.03 | 0.08 | 0.04 | 0.04 | 0.06 | 0.09 | 0.08 | 0.07 | 0.11 |
| 11 | Pulmonary deposited mass rate (µg/min) | 0.08 | 0.16 | 0.13 | 0.19 | 0.45 | 0.49 | 0.44 | 0.48 | 0.34 |
| 12 | Total deposited mass rate (µg/min) | 0.18 | 0.37 | 0.35 | 0.42 | 0.81 | 0.96 | 1.18 | 1.20 | 1.28 |
| Age Groups | Normal Lung Geometry | Pre-smog | Smog | Post-smog |
|---|---|---|---|---|
| 3-month |  | |||
| 21-month | 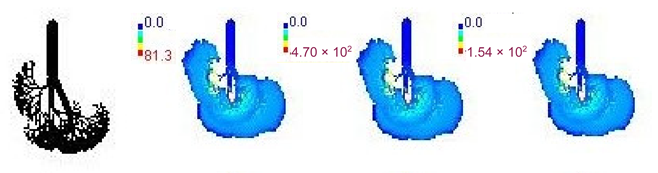 | |||
| 28-month | 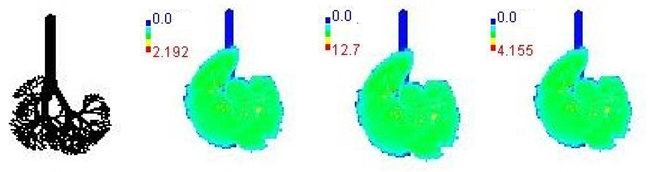 | |||
| 3-year | 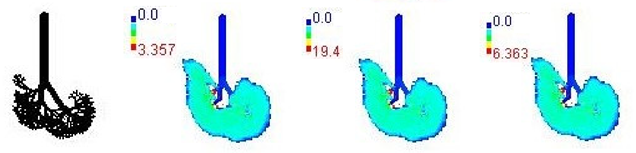 | |||
| 8-year | 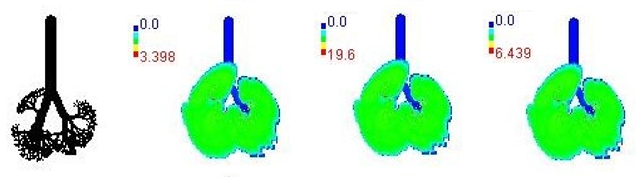 | |||
| 14-year | 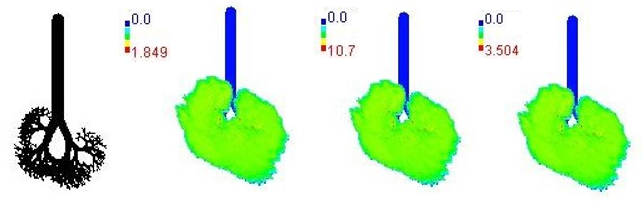 | |||
| 18-year | 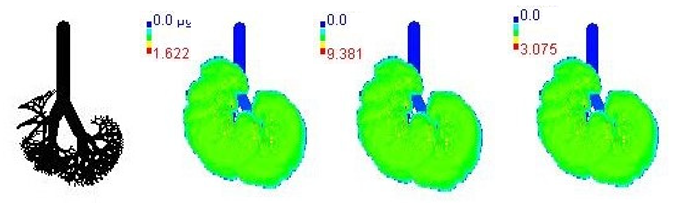 | |||
| 21-year |  | |||
| 30-year | 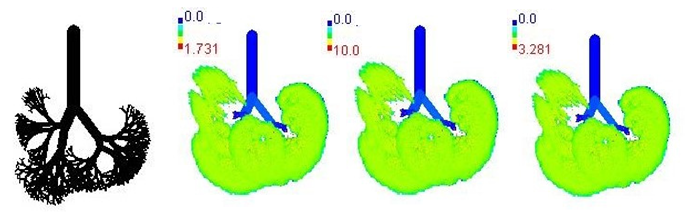 | |||
| Adult | 01 November 2017 | 08 November 2017 | 09 November 2017 | 10 November 2017 | 11 November 2017 | 13 November 2017 | 14 November 2017 | 15 November 2017 |
|---|---|---|---|---|---|---|---|---|
| Na (µg/kg/day) | 3.46 × 10⁻¹⁰ | 1.96 × 10⁻⁹ | 1.31 × 10⁻⁹ | 7.31 × 10⁻¹⁰ | 1.27 × 10⁻⁹ | 1.00 × 10⁻⁹ | 6.54 × 10⁻¹⁰ | 6.54 × 10⁻¹⁰ |
| Mg (µg/kg/day) | 3.46 × 10⁻¹⁰ | 2.06 × 10⁻⁹ | 1.37 × 10⁻⁹ | 7.69 × 10⁻¹⁰ | 1.31 × 10⁻⁹ | 1.06 × 10⁻⁹ | 6.93 × 10⁻¹⁰ | 6.73 × 10⁻¹⁰ |
| Al (µg/kg/day) | 1.6 × 10⁻⁹ | 9.19 × 10⁻⁹ | 6.08 × 10⁻⁹ | 3.46 × 10⁻⁹ | 5.89 × 10⁻⁹ | 4.69 × 10⁻⁹ | 3.06 × 10⁻⁹ | 3.02 × 10⁻⁹ |
| P (µg/kg/day) | 3.65 × 10⁻¹⁰ | 2.14 × 10⁻⁹ | 1.40 × 10⁻⁹ | 8.08 × 10⁻¹⁰ | 1.37 × 10⁻⁹ | 1.10 × 10⁻⁹ | 7.12 × 10⁻¹⁰ | 6.93 × 10⁻¹⁰ |
| S (µg/kg/day) | 3.13 × 10⁻⁸ | 1.81 × 10⁻⁷ | 1.20 × 10⁻⁷ | 6.81 × 10⁻⁸ | 1.16 × 10⁻⁷ | 9.25 × 10⁻⁸ | 6.03 × 10⁻⁸ | 5.96 × 10⁻⁸ |
| Cl (µg/kg/day) | 1.29 × 10⁻⁹ | 7.46 × 10⁻⁹ | 4.92 × 10⁻⁹ | 2.81 × 10⁻⁹ | 4.79 × 10⁻⁹ | 3.81 × 10⁻⁹ | 2.48 × 10⁻⁹ | 2.44 × 10⁻⁹ |
| K (µg/kg/day) | - | 2.01 × 10⁻⁸ | 1.33 × 10⁻⁸ | 7.56 × 10⁻⁹ | 1.29 × 10⁻⁸ | 1.03 × 10⁻⁸ | 6.69 × 10⁻⁹ | 3.48 × 10⁻⁹ |
| Ca (µg/kg/day) | 2.02 × 10⁻⁹ | 1.17 × 10⁻⁸ | 7.73 × 10⁻⁹ | 4.39 × 10⁻⁹ | 7.48 × 10⁻⁹ | 5.96 × 10⁻⁹ | 3.89 × 10⁻⁹ | 3.85 × 10⁻⁹ |
| Cr (µg/kg/day) | 5.66 × 10⁻⁹ | 3.27 × 10⁻⁸ | 2.16 × 10⁻⁸ | 1.23 × 10⁻⁸ | 2.10 × 10⁻⁸ | 1.67 × 10⁻⁸ | 1.09 × 10⁻⁸ | 1.08 × 10⁻⁸ |
| Fe (µg/kg/day) | 4.58 × 10⁻⁹ | 2.65 × 10⁻⁸ | 1.75 × 10⁻⁸ | 9.95 × 10⁻⁹ | 1.70 × 10⁻⁸ | 1.35 × 10⁻⁸ | 8.81 × 10⁻⁹ | 8.69 × 10⁻⁹ |
| Ni (µg/kg/day) | 2.31 × 10⁻¹⁰ | 1.33 × 10⁻⁹ | 8.85 × 10⁻¹⁰ | 5.00 × 10⁻¹⁰ | 8.46 × 10⁻¹⁰ | 6.73 × 10⁻¹⁰ | 4.42 × 10⁻¹⁰ | 4.42 × 10⁻¹⁰ |
| Zn (µg/kg/day) | 3.1 × 10⁻⁹ | 1.79 × 10⁻⁸ | 1.18 × 10⁻⁸ | 6.73 × 10⁻⁹ | 1.15 × 10⁻⁸ | 9.14 × 10⁻⁹ | 5.96 × 10⁻⁹ | 5.89 × 10⁻⁹ |
| Mn (µg/kg/day) | 3.08 × 10⁻¹⁰ | 1.75 × 10⁻⁹ | 1.15 × 10⁻⁹ | 6.54 × 10⁻¹⁰ | 1.12 × 10⁻⁹ | 8.85 × 10⁻¹⁰ | 5.77 × 10⁻¹⁰ | 5.77 × 10⁻¹⁰ |
| Pb (µg/kg/day) | 9.62 × 10⁻¹⁰ | 5.58 × 10⁻⁹ | 3.69 × 10⁻⁹ | 2.10 × 10⁻⁹ | 3.58 × 10⁻⁹ | 2.85 × 10⁻⁹ | 1.87 × 10⁻⁹ | 1.83 × 10⁻⁹ |
| Cu (µg/kg/day) | 3.85 × 10⁻¹⁰ | 2.21 × 10⁻⁹ | 1.46 × 10⁻⁹ | 8.27 × 10⁻¹⁰ | 1.42 × 10⁻⁹ | 1.14 × 10⁻⁹ | 7.31 × 10⁻¹⁰ | 7.31 × 10⁻¹⁰ |
| Br (µg/kg/day) | - | 1.62 × 10⁻⁹ | 1.08 × 10⁻⁹ | 6.16 × 10⁻¹⁰ | 1.04 × 10⁻⁹ | 8.27× 10⁻¹⁰ | 5.39 × 10⁻¹⁰ | 5.39 × 10⁻¹⁰ |
| Si (µg/kg/day) | 4.1 × 10⁻⁹ | 2.37 × 10⁻⁸ | 1.56 × 10⁻⁸ | 8.89 × 10⁻⁹ | 1.52 × 10⁻⁸ | 1.21 × 10⁻⁸ | 7.89 × 10⁻⁹ | 7.77 × 10⁻⁹ |
| Ti (µg/kg/day) | 3.46 × 10⁻¹⁰ | 2.02 × 10⁻⁹ | 1.33 × 10⁻⁹ | 7.50 × 10⁻¹⁰ | 1.29 × 10⁻⁹ | 1.04 × 10⁻⁹ | 6.73 × 10⁻¹⁰ | 6.73 × 10⁻¹⁰ |
| Children | 01 November 2017 | 08 November 2017 | 09 November 2017 | 10 November 2017 | 11 November 2017 | 13 November 2017 | 14 November 2017 | 15 November 2017 |
|---|---|---|---|---|---|---|---|---|
| Na (µg/kg/day) | 1.06 × 10⁻⁹ | 6.00 × 10⁻⁹ | 4.00 × 10⁻⁹ | 2.24 × 10⁻⁹ | 3.88 × 10⁻⁹ | 3.06 × 10⁻⁹ | 2.00 × 10⁻⁹ | 2.00 × 10⁻⁹ |
| Mg (µg/kg/day) | 1.06 × 10⁻⁹ | 6.29 × 10⁻⁹ | 4.18 × 10⁻⁹ | 2.35 × 10⁻⁹ | 4.00 × 10⁻⁹ | 3.24 × 10⁻⁹ | 2.12 × 10⁻⁹ | 2.06 × 10⁻⁹ |
| Al (µg/kg/day) | 4.88 × 10⁻⁹ | 2.81 × 10⁻⁸ | 1.86 × 10⁻⁸ | 1.06 × 10⁻⁸ | 1.80 × 10⁻⁸ | 1.44 × 10⁻⁸ | 9.35 × 10⁻⁹ | 9.24 × 10⁻⁹ |
| P (µg/kg/day) | 1.12 × 10⁻⁹ | 6.53 × 10⁻⁹ | 4.29 × 10⁻⁹ | 2.47 × 10⁻⁹ | 4.18 × 10⁻⁹ | 3.35 × 10⁻⁹ | 2.18 × 10⁻⁹ | 2.12 × 10⁻⁹ |
| S (µg/kg/day) | 9.58 × 10⁻⁸ | 5.54 × 10⁻⁷ | 3.66 × 10⁻⁷ | 2.08 × 10⁻⁷ | 3.55 × 10⁻⁷ | 2.83 × 10⁻⁷ | 1.85 × 10⁻⁷ | 1.82 × 10⁻⁷ |
| Cl (µg/kg/day) | 3.94 × 10⁻⁹ | 2.28 × 10⁻⁸ | 1.51 × 10⁻⁸ | 8.59 × 10⁻⁹ | 1.47 × 10⁻⁸ | 1.17 × 10⁻⁸ | 7.59 × 10⁻⁹ | 7.47 × 10⁻⁹ |
| K (µg/kg/day) | - | 6.15 × 10⁻⁸ | 4.07 × 10⁻⁸ | 2.31 × 10⁻⁸ | 3.94 × 10⁻⁸ | 3.14 × 10⁻⁸ | 2.05 × 10⁻⁸ | 1.07 × 10⁻⁸ |
| Ca (µg/kg/day) | 6.18 × 10⁻⁹ | 3.57 × 10⁻⁸ | 2.37 × 10⁻⁸ | 1.34 × 10⁻⁸ | 2.29 × 10⁻⁸ | 1.82 × 10⁻⁸ | 1.19 × 10⁻⁸ | 1.18 × 10⁻⁸ |
| Cr (µg/kg/day) | 1.73 × 10⁻⁸ | 1.00 × 10⁻⁷ | 6.62 × 10⁻⁸ | 3.76 × 10⁻⁸ | 6.42 × 10⁻⁸ | 5.11 × 10⁻⁸ | 3.34 × 10⁻⁸ | 3.29 × 10⁻⁸ |
| Fe (µg/kg/day) | 1.4 × 10⁻⁸ | 8.09 × 10⁻⁸ | 5.35 × 10⁻⁸ | 3.04 × 10⁻⁸ | 5.19 × 10⁻⁸ | 4.14 × 10⁻⁸ | 2.69 × 10⁻⁸ | 2.66 × 10⁻⁸ |
| Ni (µg/kg/day) | 7.06 × 10⁻¹⁰ | 4.06 × 10⁻⁹ | 2.71 × 10⁻⁹ | 1.53 × 10⁻⁹ | 2.59 × 10⁻⁹ | 2.06 × 10⁻⁹ | 1.35 × 10⁻⁹ | 1.35 × 10⁻⁹ |
| Zn (µg/kg/day) | 9.47 × 10⁻⁹ | 5.48 × 10⁻⁸ | 3.62 × 10⁻⁸ | 2.06 × 10⁻⁸ | 3.51 × 10⁻⁸ | 2.79 × 10⁻⁸ | 1.82 × 10⁻⁸ | 1.80 × 10⁻⁸ |
| Mn (µg/kg/day) | 9.41 × 10⁻¹⁰ | 5.35 × 10⁻⁹ | 3.53 × 10⁻⁹ | 2.00 × 10⁻⁹ | 3.41 × 10⁻⁹ | 2.71 × 10⁻⁹ | 1.77 × 10⁻⁹ | 1.77 × 10⁻⁹ |
| Pb (µg/kg/day) | 2.94 × 10⁻⁹ | 1.71 × 10⁻⁸ | 1.13 × 10⁻⁸ | 6.41 × 10⁻⁹ | 1.09 × 10⁻⁸ | 8.71 × 10⁻⁹ | 5.71 × 10⁻⁹ | 5.59 × 10⁻⁹ |
| Cu (µg/kg/day) | 1.18 × 10⁻⁹ | 6.76 × 10⁻⁹ | 4.47 × 10⁻⁹ | 2.53 × 10⁻⁹ | 4.35 × 10⁻⁹ | 3.47 × 10⁻⁹ | 2.24 × 10⁻⁹ | 2.24 × 10⁻⁹ |
| Br (µg/kg/day) | - | 4.94 × 10⁻⁹ | 3.29 × 10⁻⁹ | 1.88 × 10⁻⁹ | 3.18 × 10⁻⁹ | 2.53 × 10⁻⁹ | 1.65 × 10⁻⁹ | 1.65 × 10⁻⁹ |
| Si (µg/kg/day) | 1.25 × 10⁻⁸ | 7.24 × 10⁻⁸ | 4.78 × 10⁻⁸ | 2.72 × 10⁻⁸ | 4.64 × 10⁻⁸ | 3.69 × 10⁻⁸ | 2.41 × 10⁻⁸ | 2.38 × 10⁻⁸ |
| Ti (µg/kg/day) | 1.06 × 10⁻⁹ | 6.18 × 10⁻⁹ | 4.06 × 10⁻⁹ | 2.29 × 10⁻⁹ | 3.94 × 10⁻⁹ | 3.18 × 10⁻⁹ | 2.06 × 10⁻⁹ | 2.06 × 10⁻⁹ |
Publisher’s Note: MDPI stays neutral with regard to jurisdictional claims in published maps and institutional affiliations. |
© 2022 by the authors. Licensee MDPI, Basel, Switzerland. This article is an open access article distributed under the terms and conditions of the Creative Commons Attribution (CC BY) license (https://creativecommons.org/licenses/by/4.0/).
Share and Cite
Fatima, S.; Mishra, S.K.; Ahlawat, A.; Dimri, A.P. Physico-Chemical Properties and Deposition Potential of PM2.5 during Severe Smog Event in Delhi, India. Int. J. Environ. Res. Public Health 2022, 19, 15387. https://doi.org/10.3390/ijerph192215387
Fatima S, Mishra SK, Ahlawat A, Dimri AP. Physico-Chemical Properties and Deposition Potential of PM2.5 during Severe Smog Event in Delhi, India. International Journal of Environmental Research and Public Health. 2022; 19(22):15387. https://doi.org/10.3390/ijerph192215387
Chicago/Turabian StyleFatima, Sadaf, Sumit Kumar Mishra, Ajit Ahlawat, and Ashok Priyadarshan Dimri. 2022. "Physico-Chemical Properties and Deposition Potential of PM2.5 during Severe Smog Event in Delhi, India" International Journal of Environmental Research and Public Health 19, no. 22: 15387. https://doi.org/10.3390/ijerph192215387