Abstract
The purpose of this study was to examine demographic-specific relationships between direct abdominal fat measures and anthropometric indices. A cross-sectional study was conducted utilizing abdominal fat measures (visceral fat area, VFA; visceral to subcutaneous adipose area ratio, VSR) and anthropometrics (body mass index, BMI; waist circumference, WC) data from the 2011–2018 National Health and Nutrition Examination Survey. Linear or polynomial linear regression models were used to examine the relationships of abdominal fat measures to anthropometrics with adjustment for demographics. The results revealed that while VFA was linearly related to BMI and WC across all demographics (p < 0.001), the relationships between VSR and both BMI and WC were concave in men and convex in women. The relationships between VFA, VSR, and BMI, WC varied by sex and race/ethnicity. In conclusion, increasing BMI and WC were linearly associated with increased VFA, but their relationships with VSR were nonlinear and differed by sex.
1. Introduction
The rising obesity epidemic in the US is a national health concern due to the increased health risks related to excess body fat [1]. Body mass index (BMI) and waist circumference (WC) are common anthropometric indices for obesity-related health risks due to their positive relationships with body fat and regional body fat distribution [2,3,4,5,6]. These parameters are more practical, efficient, and economically sound when compared to direct measurements of body fat, such as dual-energy X-ray absorptiometry (DXA) [7], which is a two-dimensional imaging technique to assess total and regional adipose tissue mass and distribution. However, BMI is not a measure of the total percentage of body fat or abdominal adiposity because it cannot distinguish between lean, fat mass and does not consider adipose tissue distribution [8]. Similarly, measurements of WC do not account for the overall body size or shape [9] and thus may misrepresent body adipose tissue concentration and distribution [10,11,12]. Therefore, it is important to better understand the relationships between BMI and WC with direct measures of overall and abdominal body fat [13].
Although many studies have examined the relationships between BMI and WC with body fat percentage [2,3,4], the relationships between BMI and WC with abdominal fat measures have received less attention, and studies present varied results [5,14,15,16,17,18]. Of these, studies that have focused on a single population have reported positive relationships between BMI and/or WC with the visceral fat percentage in young Thailanders [14], with the visceral fat mass in White adults [6,15], and with the visceral fat area (VFA) in Indian adults [16]. Additionally, several studies have considered racial/ethnic differences in the relationships between BMI and WC with VFA [5,17,18] with inconsistent results. Specifically, one study reported no significant race/ethnicity effects between BMI and VFA in adults aged 40–64 years [5], while the other two reported that White men and women have higher VFA than Black and/or Hispanic men and women of the same BMI and WC [17,18]. However, the previous studies on specific race/ethnicity relationships between BMI or WC with visceral adipose were often studied primarily among White and Black populations [5,17], with only one study including Hispanics [18] and none including Asian and other population groups [5,17,18]. In addition, research about the relationships between BMI, WC, and visceral-to-subcutaneous adipose area ratio (VSR) is limited, even though VSR is an independent predictor of cardiometabolic risks [19,20,21]. We identified only one study that focused on the relationship between BMI, WC and VSR using a sample from the New England area of the US [19]. Thus, it is necessary to expand on previous studies and further examine the relationships between BMI and WC with abdominal indices such as VFA and VSR using a nationally representative sample of US adults measured using standardized anthropometric procedures and DXA. Accordingly, the present study aims to address the above research gaps using a nationally representative adult sample. The objective of the present study is to assess the sex and racial/ethnicity-specific relationships between conventional anthropometric measures [BMI and WC] with VFA and VSR.
2. Method
The present study is a secondary data analysis of the National Health and Nutrition Examination Survey (NHANES) 2011–2018 data [22]. Respondents aged 20 years or older who had demographic, VFA and subcutaneous fat area data were included in this study. Accordingly, of a total of 14,934 respondents aged 20 years or older, 707 were excluded due to missing WC and/or height or weight data, and 2284 were further excluded due to missing visceral fat-related or subcutaneous fat area data. The final analysis included 11,943 respondents aged 20–59 years who fulfilled all inclusion criteria. This study has been approved by the University of Rhode Island Institutional Review Board (IRB) (IRB# 1945004-1).
2.1. Demographics
Standard NHANES demographic variables were utilized to report sample characteristics, including age, sex (male vs. female), race/ethnicity, education, and the ratio of family income to poverty [22,23]. For the current study, the age was categorized as 20–39 years or 40–59 years; race/ethnicity was categorized as Black, White, Hispanic (Mexican American and other Hispanic), Asian and others; education was classified into two categories (high school or less and some college or more); and the ratio of family income to poverty was classified into two categories (<1, below the poverty line; and ≥1 at or above poverty line) from numerical data (0–4.99 or 5 or more) as previous studies did [24].
2.2. Anthropometrics
Height (cm), weight (kg), and WC (cm) were measured at NHANES Mobile Examination Center by trained health technicians and followed standardized protocols described previously in detail [22,23]. BMI was calculated using measured height and weight and was further classified into underweight (BMI < 18.5 kg/m2), normal (18.5 kg/m2 ≤ BMI ≤ 24.9 kg/m2), overweight (25.0 kg/m2 ≤ BMI ≤ 29.9 kg/m2) and obese (30.0 kg/m2 ≤ BMI) according to Centers for Disease Control and Prevention recommendations for adults 20 years or older [25]. Abdominal obesity was classified according to sex-specific WC classifications (males, ≥102 cm; females, ≥88 cm) [26].
2.3. Abdominal Fat Distribution
Two measures related to abdominal fat distribution were considered: (1) VFA, the amount of fat (cm2) located inside the abdominal cavity, around the internal organs of the abdomen or the abdominal walls, was measured using DXA [23]; (2) VSR, calculated by dividing VFA by the subcutaneous fat area, which is the amount of fat (cm2) located directly beneath the skin, was also measured using DXA [23,27].
2.4. Data Analysis
Given the complexity of the survey design, the combination of 8-year Mobile Examination Center exam weight was constructed and then utilized for all data analyses according to NHANES’s data analysis guidelines [28]. All descriptive data were summarized by using weighted means and standard errors or counts, and weighted percentages for all study participants. Continuous variables were compared using the t-test (PROC SURVEYREG procedure), and the Chi-square test was used to compare categorical variables (PROC SURVEYFREQ procedure). A linear regression model and a polynomial linear regression model with a quadratic term if the trend indicated a non-linearity were used to estimate the association of BMI and WC with the level of VFA and VSR, separated by sex and race/ethnicity. Then, interaction terms (BMI × race or WC × race) were added to the model to further explore the race/ethnicity effect on the relationships. All of the models were adjusted for age, sex, race/ethnicity, education, and the ratio of family income to poverty. It is important to note that race/ethnicity was only adjusted in the total and the non-race/ethnicity-specific analyses. Statistical significance was defined as p < 0.05. Analyses were performed with SAS version 9.4 (SAS Institute Inc., Cary, NC, USA).
3. Results
Approximately half of the sample was female (48.4%); 38.3% were racial/ethnic minorities, with 11.8% Black, 17.0% Hispanic and 5.8% Asian; 34.7% had a high school education or less, and 15.8% had a family income below the federal poverty level. Nearly 70% of the sample were either overweight (32.0%) or obese (37.6%), as defined by established BMI cutoffs. Over 50% of the sample had abdominal obesity (52.6%), as defined by WC cutoffs. Males were more likely to be overweight or have higher WC, VAF and/or VSR than females, whereas more females were classified as having abdominal obesity (Table 1). The pattern for VAF and VSR between males and females appeared to be similar across sex-specific racial/ethnic groups (Figure 1). All individuals with obesity or abdominal obesity appeared to have higher VFA compared to those who were not obese, regardless of sex. However, our findings showed that males who were not obese and without abdominal obesity had a consistently higher VSR than those who were obese or who had abdominal obesity in all male-specific racial/ethnic groups (Table 1, Figure 2 and Figure 3).

Table 1.
Demographics characteristics stratified by sex, NHANES 2011–2018.
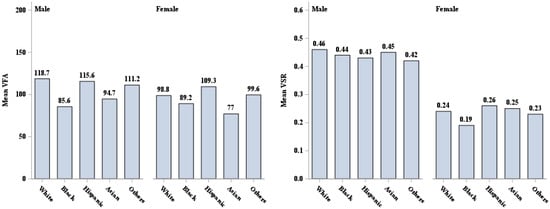
Figure 1.
VFA (cm2) and VSR description by sex and race/ethnicity. VFA = visceral fat area, VSR = visceral to subcutaneous adipose area ratio.
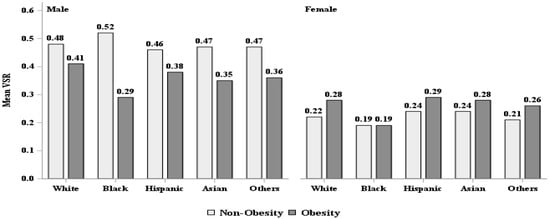
Figure 2.
VFA (cm2) and VSR description by body mass index classified obesity. VFA = visceral fat area, VSR = visceral to subcutaneous adipose area ratio.
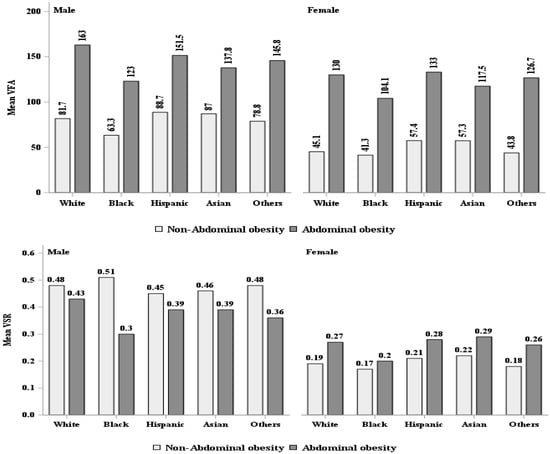
Figure 3.
VFA (cm2) and VSR description by waist circumference classified abdominal obesity. VFA = visceral fat area, VSR = visceral to subcutaneous adipose area ratio.
The analyses revealed linear relationships between BMI and VFA or WC and VFA (Figure 4). More specifically, after adjustment for demographic variables, BMI was positively associated with VFA (β = 5.86, 95% CI: 5.56, 6.15, r2 = 0.609, p < 0.001). A similar pattern was observed across different racial/ethnic groups, male and female groups, and sex-specific racial/ethnic groups (Table 2). Moreover, the adjusted analysis also revealed a positive relationship between WC with VFA (β = 2.64, 95% CI: 2.53, 2.75, r2 = 0.684, p < 0.001). This positive relationship was also observed in males and females and all racial/ethnic groups or sex-specific racial/ethnic groups (Table 2). There were race/ethnic group differences in BMI and WC relationships with VFA, with the White group significantly different from the Black and Hispanic and/or Asian groups (Table 2).
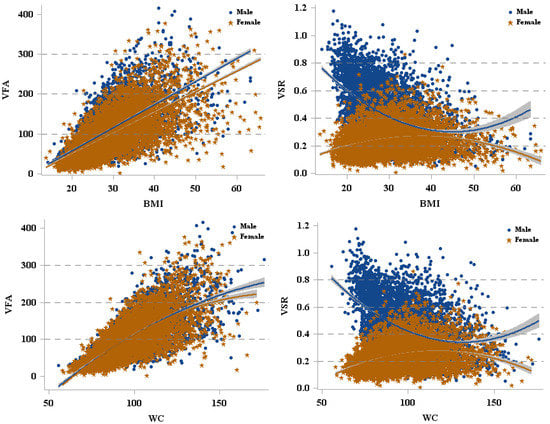
Figure 4.
The relationships between VFA and VSR with BMI, WC. VFA = visceral fat area, VSR = visceral to subcutaneous adipose area ratio, BMI = body mass index, WC = waist circumference.
Table 2.
The relationships between BMI, WC and VFA (cm2).
There was either a concave (male) or convex curvilinear (female) relationship between BMI and WC with VSR (Figure 4). In addition, due to the opposite relationships between BMI and VSR, WC and VSR, we reported the results for males and females separately (Figure 4). In males, when BMI < 39.08 kg/m2, BMI was negatively associated with VSR; however, when BMI ≥ 39.08 kg/m2, the relationship between these two variables was reversed, with a higher BMI associated with a higher VSR. In females, BMI was positively associated with VSR until it reached 38.75 kg/m2 but was inversely associated with VSR for BMIs ≥ 38.75 kg/m2. A similar pattern was observed between WC and VSR in males and females. Furthermore, the relationships between BMI or WC and VSR were different in racial/ethnic groups, with Black significantly different from White, Hispanic, and Asian (Table 3).
Table 3.
The relationships between BMI, WC and VSR.
4. Discussion
The present study extends previous work that describes the relationships between anthropometric measures and the distribution of abdominal fat. To the best of our knowledge, we are the first to examine such a relationship using a large, representative sample of the adult US population accounting for its diversity, expressed in terms of sex and race/ethnicity. Our findings better represent the influence of the difference in population characteristics compared with previous studies that focused on smaller samples, primarily of Black or White non-Hispanic individuals [5,14,15,16,17]. Our findings revealed consistent positive relationships between VFA and both BMI and WC in both sexes and all racial/ethnic groups. Interestingly, there were patterns of opposing relationships between VSR and both BMI and WC between the sexes, with a concave curvilinear relationship observed in men and a convex curvilinear relationship observed in women. Furthermore, we found racial/ethnic group differences in the relationships between VFA and VSR with both BMI and WC.
The current study’s findings on the relationships between VFA and both BMI and WC were consistent with previous studies [5,17,18]. We observed that independent of age, education or family income, the relationships between VFA and both BMI and WC varied by race/ethnicity. Of note, the estimation of the slope parameter for White people was higher than for people with Black, Hispanic and/or Asian race/ethnicity classification, whereas the slope parameter for Black people was lower than for White, Hispanic, and Asian people. These findings indicate that with similar BMI or WC, White people will likely have higher VFA, whereas Black people have lower VFA than other racial/ethnic groups. This phenomenon was also observed in our sex-specific racial/ethnic group analyses. The only exception was the relationship between WC and VFA in women, in which the slopes for WC and VFA were significantly higher in White women than in Hispanic women but lower in Black women than in Hispanic and Asian women. These findings are somewhat consistent with previous research on the results for Black men and women [17,18,29] and for White men and women [5,18,30]. However, our analysis extends the results of previous studies because we focused on a larger sample of the general US adult populations, including more racially diverse samples of Hispanic and Asian people. A possible explanation for the higher positive correlation between BMI and WC and VFA in White compared to Black samples could be a difference in race-related sex-hormone-binding globulin and testosterone concentrations [31], which might result in a difference in visceral adipose accumulation. However, the cross-section study design of the study limits our ability to explore the causality, and further studies are warranted to examine the possible reasons for relationship differences by race/ethnicity.
We also examined the sex-specific racial/ethnic relationships between VSR and both BMI and WC. VSR provided the relative abdominal fat composition, which is important since visceral fat has known stronger relationships with cardiometabolic risks rather than subcutaneous fat [32,33]. Our findings are interesting as there were opposing concave (male) or convex (female) shaped curvilinear relationships between VSR and both BMI and WC. In males, the finding implies a somewhat negative linear relationship “at first” with higher BMI or WC associated with lower VSR. While a BMI > 25 is associated with a greater risk of obesity-related illnesses and mortality [1], which are likely driven by an increase in total visceral fat mass, these changes are not consistent with the changes seen in fat distribution between the visceral cavity and the more innocuous subcutaneous regions. It could be that there is a change in the relative distribution of abdominal fat with increasing BMI or WC, but clearly, the slope flattens out around BMI = 30 kg/m2. When the BMI or WC reaches the inflection point (BMI = 39.08 kg/m2; WC = 144.5 cm), the continued increase in BMI or WC results in a greater VSR. For women, these relationships appear to follow the opposite pattern, but there was considerably less variation in women than in men. That is, for females with a BMI or WC lower than 38.75 kg/m2 and 43.5 cm, respectively, there is a positive relationship between these parameters and VSR. However, such a relationship is reversed when BMI or WC reaches 38.75 kg/m2 and 43.5 cm, respectively, or higher. Studies on the relationship between BMI, WC and VSR are limited. One study reported that the relationships between BMI or WC and VSR were positive in women, whereas they were negative in men [19], which is different from the concave and convex relationships observed between BMI or WC and VSR for male and female individuals, respectively, in the current study. The discrepancy between previous findings and ours could be explained by the different sample age ranges (current study: 20–59 years vs. other studies ≥ 35 years) and geographic and sample sizes (this study: national, n = 11,943 vs. other studies: regional, n = 3223). Given the representation of our sample, the current study offers important information regarding the relationships of anthropometric parameters with VSR. Our findings indicate that male individuals presenting a high BMI/WC, who might seem underweight or have BMI ≥ 40 kg/m2 [34], have a greater risk for obesity-related illness than BMI/WC represents. In contrast, females with a BMI ≥ 40 kg/m2 have a lower risk than previously reported. Our findings indicate that using BMI or WC alone might not be optimal for assessing health risks. Therefore, further research is warranted to explore more accurate prediction of VSR using anthropometric measures, which are practical and economical, to help health practitioners better address body-fat-distribution-related health risks in public health.
5. Strengths and Limitations
The present study has strengths and limitations. The major strengths of the study are that (1) it is the first to utilize abdominal-related measures derived from DXA, a two-dimensional imaging technique for adipose tissue assessment, for a large national representative adult sample including multiple racial and ethnic groups. Therefore, our findings are more generalizable for public health purposes than previous studies. (2) Height, weight, WC and DXA scans were obtained using standardized procedures by trained research staff, ensuring consistency throughout the cohort used for our analysis [22,23]. Among the limitations, the study cohort was limited to individuals aged between 20 and 59 years, which included the full set of parameters selected for our analysis. Secondly, menopausal status was not considered, which could influence the distribution of visceral and subcutaneous fat in postmenopausal women [35]. Lastly, we are also limited by the DXA scan exclusion criteria, such as possible or ongoing pregnancy, and the size of the DXA table, which is limited to respondents less than 450 pounds and less than 6′5″ [23].
6. Conclusions
In conclusion, we found positive relationships between anthropometric measures and VFA, but Whites had higher slopes than Blacks, Hispanics and/or Asians, and Black had lower slope parameters than Hispanics and Asians. The relationship between anthropometric measures and VSR was concave in males and convex in females. This finding reflects the sex difference in fat distribution in relation to BMI and WC. These relationships should be taken into consideration while working with different racial/ethnic groups addressing fat-distribution-related health concerns.
Author Contributions
F.X., J.E.E., A.A., I.E.L., M.J.D., G.W.G. and D.R. conceptualized the research and its methodology; F.X. analyzed data and F.X., J.E.E., D.R. drafted manuscripts and all authors edited the manuscript, provided constructive feedback, and approved the final version. All authors have read and agreed to the published version of the manuscript.
Funding
A.A. is supported by a National Institute of Health grant (R01 HL151452).
Institutional Review Board Statement
This study has been approved by the Institutional Review Board at the University of Rhode Island (IRB# 1945004-1) on 10 August 2022.
Informed Consent Statement
Not applicable.
Data Availability Statement
These publicly accessible data were available on Centers for Disease Control website: https://wwwn.cdc.gov/nchs/nhanes/sasviewer.aspx, accessed on 16 June 2022.
Conflicts of Interest
The authors declare no conflict of interest.
References
- Ansari, S.; Haboubi, H.; Haboubi, N. Adult obesity complications: Challenges and clinical impact. Ther. Adv. Endocrinol. Metab. 2020, 11, 2042018820934955. [Google Scholar] [CrossRef] [PubMed]
- Jackson, A.S.; Stanforth, P.R.; Gagnon, J.; Rankinen, T.; Leon, A.S.; Rao, D.C.; Skinner, J.S.; Bouchard, C.; Wilmore, J.H. The effect of sex, age and race on estimating percentage body fat from body mass index: The heritage family study. Int. J. Obes. 2002, 26, 789–796. [Google Scholar] [CrossRef] [PubMed]
- Gallagher, D.; Visser, M.; Sepulveda, D.; Pierson, R.N.; Harris, T.; Heymsfield, S.B. How useful is body mass index for comparison of body fatness across age, sex, and ethnic groups? Am. J. Epidemiol. 1996, 143, 228–239. [Google Scholar] [CrossRef] [PubMed]
- Flegal, K.M.; Shepherd, J.A.; Looker, A.C.; Graubard, B.I.; Borrud, L.G.; Ogden, C.L.; Harris, T.B.; Everhart, J.E.; Schenker, N. Comparisons of percentage body fat, body mass index, waist circumference, and waist-stature ratio in adults. Am. J. Clin. Nutr. 2009, 89, 500–508. [Google Scholar] [CrossRef]
- Camhi, S.M.; Bray, G.A.; Bouchard, C.; Greenway, F.L.; Johnson, W.D.; Newton, R.L.; Ravussin, E.; Ryan, D.H.; Smith, S.R.; Katzmarzyk, P.T. The relationship of waist circumference and BMI to visceral, subcutaneous, and total body fat: Sex and race differences. Obesity 2011, 19, 402–408. [Google Scholar] [CrossRef]
- Janssen, I.; Heymsfield, S.B.; Allison, D.B.; Kotler, D.P.; Ross, R. Body mass index and waist circumference independently contribute to the prediction of nonabdominal, abdominal subcutaneous, and visceral fat. Am. J. Clin. Nutr. 2002, 75, 683–688. [Google Scholar] [CrossRef] [PubMed]
- Fryar, C.D.; Gu, Q.; Ogden, C.L.; Flegal, K.M. Anthropometric Reference Data for Children and Adults: United States, 2011–2014. Vital Health Stat. 2016, 3, 1–46. [Google Scholar]
- Romero-Corral, A.; Somers, V.K.; Sierra-Johnson, J.; Thomas, R.J.; Collazo-Clavell, M.L.; Korinek, J.; Allison, T.G.; Batsis, J.A.; Sert-Kuniyoshi, F.H.; Lopez-Jimenez, F. Accuracy of body mass index in diagnosing obesity in the adult general population. Int. J. Obes. 2008, 32, 959–966. [Google Scholar] [CrossRef]
- Ostchega, Y.; Seu, R.; Sarafrazi, N.; Zhang, G.; Hughes, J.P.; Miller, I. Waist Circumference Measurement Methodology Study: National Health and Nutrition Examination Survey, 2016. Vital Health Stat. 2019, 2, 1–20. [Google Scholar]
- Karelis, A.D.; St-Pierre, D.H.; Conus, F.; Rabasa-Lhoret, R.; Poehlman, E.T. Metabolic and body composition factors in subgroups of obesity: What do we know? J. Clin. Endocrinol. Metab. 2004, 89, 2569–2575. [Google Scholar] [CrossRef]
- Phillips, C.M. Metabolically healthy obesity: Definitions, determinants and clinical implications. Rev. Endocr. Metab. Disord. 2013, 14, 219–227. [Google Scholar] [CrossRef] [PubMed]
- Grundy, S.M.; Neeland, I.J.; Turer, A.T.; Vega, G.L. Waist circumference as measure of abdominal fat compartments. J. Obes. 2013, 2013, 454285. [Google Scholar] [CrossRef] [PubMed]
- Vasudev, S.; Mohan, A.; Mohan, D.; Farooq, S.; Raj, D.; Mohan, V. Validation of body fat measurement by skinfolds and two bioelectric impedance methods with DEXA–the Chennai Urban Rural Epidemiology Study [CURES-3]. J. Assoc. Physicians India 2004, 52, 877–881. [Google Scholar] [PubMed]
- Pasanta, D.; Htun, K.T.; Pan, J.; Tungjai, M.; Kaewjaeng, S.; Chancharunee, S.; Tima, S.; Kim, H.J.; Kæwkhao, J.; Kothan, S. Waist Circumference and BMI Are Strongly Correlated with MRI-Derived Fat Compartments in Young Adults. Life 2021, 11, 643. [Google Scholar] [CrossRef] [PubMed]
- Kuk, J.L.; Lee, S.; Heymsfield, S.B.; Ross, R. Waist circumference and abdominal adipose tissue distribution: Influence of age and sex. Am. J. Clin. Nutr. 2005, 81, 1330–1334. [Google Scholar] [CrossRef]
- Gadekar, T.; Dudeja, P.; Basu, I.; Vashisht, S.; Mukherji, S. Correlation of visceral body fat with waist-hip ratio, waist circumference and body mass index in healthy adults: A cross sectional study. Med. J. Armed Forces India 2020, 76, 41–46. [Google Scholar] [CrossRef]
- Hill, J.O.; Sidney, S.; Lewis, C.E.; Tolan, K.; Scherzinger, A.L.; Stamm, E.R. Racial differences in amounts of visceral adipose tissue in young adults: The CARDIA (Coronary Artery Risk Development in Young Adults) study. Am. J. Clin. Nutr. 1999, 69, 381–387. [Google Scholar] [CrossRef]
- Carroll, J.F.; Chiapa, A.L.; Rodriquez, M.; Phelps, D.R.; Cardarelli, K.M.; Vishwanatha, J.K.; Bae, S.; Cardarelli, R. Visceral fat, waist circumference, and BMI: Impact of race/ethnicity. Obesity 2008, 16, 600–607. [Google Scholar] [CrossRef]
- Kaess, B.M.; Pedley, A.; Massaro, J.M.; Murabito, J.; Hoffmann, U.; Fox, C.S. The ratio of visceral to subcutaneous fat, a metric of body fat distribution, is a unique correlate of cardiometabolic risk. Diabetologia 2012, 55, 2622–2630. [Google Scholar] [CrossRef]
- Kwon, S.; Han, A.L. The Correlation between the Ratio of Visceral Fat Area to Subcutaneous Fat Area on Computed Tomography and Lipid Accumulation Product as Indexes of Cardiovascular Risk. J. Obes. Metab. Syndr. 2019, 28, 186–193. [Google Scholar] [CrossRef]
- Fox, C.S.; Massaro, J.M.; Hoffmann, U.; Pou, K.M.; Maurovich-Horvat, P.; Liu, C.Y.; Vasan, R.S.; Murabito, J.M.; Meigs, J.B.; Cupples, L.A.; et al. Abdominal visceral and subcutaneous adipose tissue compartments: Association with metabolic risk factors in the Framingham Heart Study. Circulation 2007, 116, 39–48. [Google Scholar] [CrossRef] [PubMed]
- Centers for Disease Control and Prevention. National Health and Nutrition Examination Survey. Available online: https://wwwn.cdc.gov/nchs/nhanes (accessed on 2 July 2022).
- National Center for Health Statistics. NHANES Questionnaires, Datasets, and Related Documentation. Available online: https://wwwn.cdc.gov/nchs/nhanes/default.aspx (accessed on 20 January 2022).
- Xu, F.; Earp, J.E.; LoBuono, D.L.; Greene, G.W. The Relationship of Physical Activity and Dietary Quality with Android Fat Composition and Distribution in US Adults. Nutrients 2022, 14, 2804. [Google Scholar] [CrossRef] [PubMed]
- Centers for Disease Control and Prevention. About Adult BMI. Available online: https://www.cdc.gov/healthyweight/assessing/bmi/adult_bmi/index.html (accessed on 18 June 2022).
- Ross, R.; Neeland, I.J.; Yamashita, S.; Shai, I.; Seidell, J.; Magni, P.; Santos, R.D.; Arsenault, B.; Cuevas, A.; Hu, F.B.; et al. Waist circumference as a vital sign in clinical practice: A Consensus Statement from the IAS and ICCR Working Group on Visceral Obesity. Nat. Rev. Endocrinol. 2020, 16, 177–189. [Google Scholar] [CrossRef] [PubMed]
- Lee, K.H.; Kang, B.K.; Ahn, B.K. Higher visceral fat area/subcutaneous fat area ratio measured by computed tomography is associated with recurrence and poor survival in patients with mid and low rectal cancers. Int. J. Colorectal Dis. 2018, 33, 1303–1307. [Google Scholar] [CrossRef] [PubMed]
- National Center for Health Statistics. NHANES Survey Methods and Analytic Guidelines. Available online: https://wwwn.cdc.gov/nchs/nhanes/analyticguidelines.aspx#estimation-and-weighting-procedures (accessed on 20 June 2022).
- Kanaley, J.A.; Giannopoulou, I.; Tillapaugh-Fay, G.; Nappi, J.S.; Ploutz-Snyder, L.L. Racial differences in subcutaneous and visceral fat distribution in postmenopausal black and white women. Metabolism 2003, 52, 186–191. [Google Scholar] [CrossRef]
- Hoffman, D.J.; Wang, Z.; Gallagher, D.; Heymsfield, S.B. Comparison of visceral adipose tissue mass in adult African Americans and whites. Obes. Res. 2005, 13, 66–74. [Google Scholar] [CrossRef]
- Weinsier, R.L.; Hunter, G.R.; Gower, B.A.; Schutz, Y.; Darnell, B.E.; Zuckerman, P.A. Body fat distribution in white and black women: Different patterns of intraabdominal and subcutaneous abdominal adipose tissue utilization with weight loss. Am. J. Clin. Nutr. 2001, 74, 631–636. [Google Scholar] [CrossRef] [PubMed]
- Despres, J.P.; Lemieux, I. Abdominal obesity and metabolic syndrome. Nature 2006, 444, 81–87. [Google Scholar] [CrossRef] [PubMed]
- Hamdy, O.; Porramatikul, S.; Al-Ozairi, E. Metabolic obesity: The paradox between visceral and subcutaneous fat. Curr. Diabetes Rev. 2006, 2, 367–373. [Google Scholar] [CrossRef]
- Poirier, P.; Giles, T.D.; Bray, G.A.; Hong, Y.; Stern, J.S.; Pi-Sunyer, F.X.; Eckel, R.H. Obesity and Cardiovascular Disease: Pathophysiology, Evaluation, and Effect of Weight Loss. Arterioscler. Thromb. Vasc. Biol. 2006, 26, 968–976. [Google Scholar] [CrossRef]
- Toth, M.J.; Tchernof, A.; Sites, C.K.; Poehlman, E.T. Menopause-related changes in body fat distribution. Ann. N. Y. Acad. Sci. 2000, 904, 502–506. [Google Scholar] [CrossRef] [PubMed]


Publisher’s Note: MDPI stays neutral with regard to jurisdictional claims in published maps and institutional affiliations. |
© 2022 by the authors. Licensee MDPI, Basel, Switzerland. This article is an open access article distributed under the terms and conditions of the Creative Commons Attribution (CC BY) license (https://creativecommons.org/licenses/by/4.0/).