
Urban–Rural Differences in Mental and Physical Health among Primary Care Patients with Multiple Chronic Conditions: A Secondary Analysis from a Randomized Clinical Trial

 ,
,
Abstract
1. Introduction
2. Materials and Methods
2.1. Data and Setting
2.2. Statistical Analysis
3. Results
4. Discussion
Author Contributions
Funding
Institutional Review Board Statement
Informed Consent Statement
Data Availability Statement
Conflicts of Interest
References
- Starfield, B.; Shi, L.; Macinko, J. Contribution of Primary Care to Health Systems and Health. Milbank Q. 2005, 83, 457–502. [Google Scholar] [CrossRef]
- Healthy People 2030. Washington D.C. Department of Health and Human Services, Office of Disease and Prevention and Health Promotion. Available online: health.gov/healthypeople (accessed on 12 February 2022).
- Fogelholm, M.; Valve, R.; Absetz, P.; Heinonen, H.; Uutela, A.; Patja, K.; Karisto, A.; Konttinen, R.; Mäkelä, T.; Nissinen, A.; et al. Rural-urban differences in health and health behaviour: A baseline description of a community health-promotion programme for the elderly. Scand. J. Public Health 2006, 34, 632–640. [Google Scholar] [CrossRef]
- U.S. Department of Agriculture, Economic Research Service. Rural Economy. 2019. Available online: https://www.ers.usda.gov/data-products/agand-food-statistics-charting-the-essentials/rural-economy/ (accessed on 12 February 2022).
- U.S. Department of Agriculture, Economic Research Service. Household Food Security in the United States in 2018. Available online: https://www.ers.usda.gov/publications/pub-details/?pubid=94848 (accessed on 13 February 2022).
- Roberts, M.E.; Doogan, N.J.; Kurti, A.N.; Redner, R.; Gaalema, D.E.; Stanton, C.A.; White, T.J.; Higgins, S.T. Rural tobacco use across the United States: How rural and urban areas differ, broken down by census regions and divisions. Health Place 2016, 39, 153–159. [Google Scholar] [CrossRef]
- Simmons, L.A.; Havens, J.R. Comorbid substance and mental disorders among rural Americans: Results from the national comorbidity survey. J. Affect. Disord. 2007, 99, 265–271. [Google Scholar] [CrossRef]
- Chan, G.; Leung, J.; Quinn, C.; Kelly, A.; Connor, J.; Weier, M.; Hall, W. Rural and Urban Differences in Adolescent Alcohol Use, Alcohol Supply, and Parental Drinking. J. Rural Health 2016, 32, 280–286. [Google Scholar] [CrossRef]
- Trost, S.G.; Owen, N.; Bauman, A.E.; Sallis, J.F.; Brown, W. Correlates of adults’ participation in physical activity: Review and update. Med. Sci. Sports Exerc. 2002, 34, 1996–2001. [Google Scholar] [CrossRef]
- Liu, J.; Bennett, K.J.; Harun, N.; Probst, J.C. Urban-Rural Differences in Overweight Status and Physical Inactivity among US Children Aged 10–17 Years. J. Rural Health 2008, 24, 407–415. [Google Scholar] [CrossRef]
- Probst, J.C.; Laditka, S.B.; Wang, J.-Y.; Johnson, A.O. Effects of residence and race on burden of travel for care: Cross sectional analysis of the 2001 US National Household Travel Survey. BMC Health Serv. Res. 2007, 7, 40. [Google Scholar] [CrossRef]
- Hartley, D.; Quam, L.; Lurie, N. Urban and Rural Differences in Health Insurance and Access to Care. J. Rural Health 1994, 10, 98–108. [Google Scholar] [CrossRef]
- Lu, N.; Samuels, M.E.; Kletke, P.R.; Whitler, E.T. Rural-Urban Differences in Health Insurance Coverage and Patterns among Working-Age Adults in Kentucky. J. Rural Health 2010, 26, 129–138. [Google Scholar] [CrossRef]
- Berkman, N.D.; Sheridan, S.L.; Donahue, K.E.; Halpern, D.J.; Crotty, K. Low Health Literacy and Health Outcomes: An Updated Systematic Review. Ann. Intern. Med. 2011, 155, 97–107. [Google Scholar] [CrossRef] [PubMed]
- Douthit, N.; Kiv, S.; Dwolatzky, T.; Biswas, S. Exposing some important barriers to health care access in the rural USA. Public Health 2015, 129, 611–620. [Google Scholar] [CrossRef] [PubMed]
- Wadsworth, M.; Montgomery, S.; Bartley, M. The persisting effect of unemployment on health and social well-being in men early in working life. Soc. Sci. Med. 1999, 48, 1491–1499. [Google Scholar] [CrossRef] [PubMed]
- Beck, R.W.; Jijon, C.R.; Edwards, J.B. The Relationships among Gender, Perceived Financial Barriers to Care, and Health Status in a Rural Population. J. Rural Health 1996, 12, 188–196. [Google Scholar] [CrossRef]
- Garcia, M.C.; Faul, M.; Massetti, G.; Thomas, C.C.; Hong, Y.; Bauer, U.E.; Iademarco, M.F. Reducing Potentially Excess Deaths from the Five Leading Causes of Death in the Rural United States. MMWR Surveill. Summ. 2017, 66, 1–7. [Google Scholar] [CrossRef]
- Peen, J.; Schoevers, R.A.; Beekman, A.; Dekker, J. The current status of urban-rural differences in psychiatric disorders. Acta Psychiatr. Scand. 2010, 121, 84–93. [Google Scholar] [CrossRef]
- Weeks, W.B.; Kazis, L.E.; Shen, Y.; Cong, Z.; Ren, X.S.; Miller, D.; Lee, A.; Perlin, J.B. Differences in Health-Related Quality of Life in Rural and Urban Veterans. Am. J. Public Health 2004, 94, 1762–1767. [Google Scholar] [CrossRef]
- Probst, J.C.; Laditka, S.; Moore, C.G.; Harun, N.; Powell, M.P.; Baxley, E.G. Rural-urban differences in depression prevalence: Implications for family medicine. Fam. Med. 2006, 38, 653–660. [Google Scholar] [PubMed]
- Weaver, A.; Himle, J.A.; Taylor, R.J.; Matusko, N.N.; Abelson, J.M. Urban vs. Rural Residence and the Prevalence of Depression and Mood Disorder among African American Women and Non-Hispanic White Women. JAMA Psychiatry 2015, 72, 576–583. [Google Scholar] [CrossRef]
- Rafferty, A.P.; Luo, H.; Egan, K.L.; Bell, R.A.; Little, N.R.G.; Imai, S. Rural, Suburban, and Urban Differences in Chronic Pain and Coping among Adults in North Carolina: 2018 Behavioral Risk Factor Surveillance System. Prev. Chronic Dis. 2021, 18, E13. [Google Scholar] [CrossRef]
- Crocker, A.M.; Kessler, R.; van Eeghen, C.; Bonnell, L.N.; Breshears, R.E.; Callas, P.; Clifton, J.; Elder, W.; Fox, C.; Frisbie, S.; et al. Integrating Behavioral Health and Primary Care (IBH-PC) to improve patient-centered outcomes in adults with multiple chronic medical and behavioral health conditions: Study protocol for a pragmatic cluster-randomized control trial. Trials 2021, 22, 200. [Google Scholar] [CrossRef]
- Cella, D.; Riley, W.; Stone, A.; Rothrock, N.; Reeve, B.; Yount, S.; Amtmann, D.; Bode, R.; Buysse, D.; Choi, S.; et al. The Patient-Reported Outcomes Measurement Information System (PROMIS) developed and tested its first wave of adult self-reported health outcome item banks: 2005–2008. J. Clin. Epidemiol. 2010, 63, 1179–1194. [Google Scholar] [CrossRef] [PubMed]
- Hays, R.D.; Spritzer, K.L.; Schalet, B.D.; Cella, D. PROMIS®-29 v2.0 profile physical and mental health summary scores. Qual. Life Res. 2018, 27, 1885–1891. [Google Scholar] [CrossRef]
- Spitzer, R.L.; Kroenke, K.; Williams, J.B.; Lowe, B. A brief measure for assessing generalized anxiety disorder: The GAD-7. Arch. Intern. Med. 2006, 166, 1092–1097. [Google Scholar] [CrossRef] [PubMed]
- Kroenke, K.; Spitzer, R.L.; Williams, J.B. The PHQ-9: Validity of a brief depression severity measure. J. Gen. Intern. Med. 2001, 16, 606–613. [Google Scholar] [CrossRef] [PubMed]
- Hlatky, M.A.; Boineau, R.E.; Higginbotham, M.B.; Lee, K.L.; Mark, D.B.; Califf, R.M.; Cobb, F.R.; Pryor, D.B. A brief self-administered questionnaire to determine functional capacity (The Duke Activity Status Index). Am. J. Cardiol. 1989, 64, 651–654. [Google Scholar] [CrossRef]
- Alonso, J.; Permanyer-Miralda, G.; Cascant, P.; Brotons, C.; Prieto, L.; Soler-Soler, J. Measuring functional status of chronic coronary patients: Reliability, validity and responsiveness to clinical change of the reduced version of the Duke Activity Status Index (DASI). Eur. Heart J. 1997, 18, 414–419. [Google Scholar] [CrossRef]
- Parissis, J.T.; Nikolaou, M.; Birmpa, D.; Farmakis, D.; Paraskevaidis, I.; Bistola, V.; Katsoulas, T.; Filippatos, G.; Kremastinos, D.T. Clinical and prognostic value of Duke’s Activity Status Index along with plasma B-type natriuretic peptide levels in chronic heart failure secondary to ischemic or idiopathic dilated cardiomyopathy. Am. J. Cardiol. 2009, 103, 73–75. [Google Scholar] [CrossRef]
- Rural Health Research Center (RHRC). Rural-Urban Commuting Area Codes (RUCAs). 2008. Available online: http://depts.washington.edu/uwruca/ (accessed on 21 February 2022).
- Ratcliffe, M.; Burd, C.; Holder, K.; Fields, A. Defining Rural at the U.S. Census Bureau, ACSGEO-1; U.S. Census Bureau: Washington, DC, USA, 2016.
- Butler, D.C.; Petterson, S.; Phillips, R.L.; Bazemore, A.W. Measures of Social Deprivation That Predict Health Care Access and Need within a Rational Area of Primary Care Service Delivery. Health Serv. Res. 2013, 48, 539–559. [Google Scholar] [CrossRef] [PubMed]
- Leopold, S.S.; Porcher, R. Editorial: The Minimum Clinically Important Difference—The Least We Can Do. Clin. Orthop. Relat. Res. 2017, 475, 929–932. [Google Scholar] [CrossRef]
- De Maeseneer, J.M.; De Prins, L.; Gosset, C.; Heyerick, J. Provider continuity in family medicine: Does it make a difference for total health care costs? Ann. Fam. Med. 2003, 1, 144–148. [Google Scholar] [CrossRef] [PubMed]


| Rural | Urban | |
|---|---|---|
| N = 518 | N = 2208 | |
| * Secondary RUCA Codes—Urban | ||
| 1.0 | 0 (0%) | 1965 (89%) |
| 1.1 | 0 (0%) | 53 (2%) |
| 2.0 | 0 (0%) | 135 (6%) |
| 2.1 | 0 (0%) | 5 (0%) |
| 4.1 | 0 (0%) | 1 (0%) |
| 5.1 | 0 (0%) | 1 (0%) |
| 7.1 | 0 (0%) | 48 (2%) |
| * Secondary RUCA Codes—Rural | ||
| 3.0 | 3 (1%) | 0 (0%) |
| 4.0 | 140 (27%) | 0 (0%) |
| 5.0 | 36 (7%) | 0 (0%) |
| 6.0 | 2 (0%) | 0 (0%) |
| 7.0 | 62 (12%) | 0 (0%) |
| 8.0 | 33 (6%) | 0 (0%) |
| 10.0 | 237 (46%) | 0 (0%) |
| 10.2 | 5 (1%) | 0 (0%) |
| Overall N (%) or Mean ± SD | Urban N (%) or Mean ± SD | Rural N (%) or Mean ± SD | |
|---|---|---|---|
| N | 2726 | 2208 (81%) | 518 (19%) |
| Demographic information | |||
| Mean age ± SD, year | 61.7 ± 13.4 | 61.5 ± 13.4 | 62.6 ± 13.5 |
| Female gender | 1742 (64%) | 1404 (63%) | 338 (65%) |
| White race | 2052 (77%) | 1607 (75%) | 445 (87%) |
| Non-Hispanic White | 1926 (71%) | 1491 (68%) | 435 (84%) |
| Non-Hispanic Black | 299 (11%) | 294 (13%) | 5 (1%) |
| Hispanic (any race) | 271 (10%) | 248 (11%) | 23 (4%) |
| Non-Hispanic (other) | 230 (8%) | 175 (8%) | 55 (11%) |
| Married or living as married | 1309 (48%) | 1016 (46%) | 293 (57%) |
| Employed | 906 (34%) | 722 (33%) | 184 (36%) |
| Low household income ($ < 30 k) | 1408 (53%) | 1158 (54%) | 250 (50%) |
| Education (Less than a college degree) | 1462 (54%) | 1158 (53%) | 304 (59%) |
| Mean number of chronic conditions ± SD | 4.1 ± 1.8 | 4.2 ± 1.8 | 3.9 ± 1.6 |
| Neighborhood characteristics | |||
| Mean social deprivation index | 53.5 ± 27.9 | 53.3 ± 29.9 | 54.2 ± 16.5 |
| Chronic conditions | |||
| Arthritis | 1140 (42%) | 947 (43%) | 193 (37%) |
| Asthma | 596 (22%) | 488 (22%) | 108 (21%) |
| Chronic Obstructive Pulmonary Disease | 889 (33%) | 719 (33%) | 170 (33%) |
| Chronic pain | 2285 (84%) | 1866 (85%) | 419 (81%) |
| Non-Gestational Diabetes | 1238 (45%) | 1052 (48%) | 186 (36%) |
| Heart failure | 227 (8%) | 196 (9%) | 31 (6%) |
| Hypertension | 2244 (82%) | 1850 (84%) | 394 (76%) |
| Irritable bowel syndrome | 115 (4%) | 88 (4%) | 27 (5%) |
| Anxiety or depression | 1734 (64%) | 1402 (64%) | 332 (64%) |
| Insomnia | 673 (25%) | 558 (25%) | 115 (22%) |
| Substance use disorder | 624 (23%) | 514 (23%) | 110 (21%) |
| Outcomes | |||
| Mental health summary score * | 50.1 ± 8.9 | 49.8 ± 8.9 | 51.5 ± 8.8 |
| Physical health summary score * | 45.7 ± 9.6 | 45.4 ± 9.5 | 47.0 ± 9.6 |
| Physical function * | 43.4 ± 9.5 | 43.1 ± 9.5 | 44.6 ± 9.5 |
| Social participation * | 48.1 ± 10.1 | 47.8 ± 10.1 | 49.3 ± 10.1 |
| DASI (METs) * | 6.3 ± 2.0 | 6.2 ± 1.9 | 6.8 ± 1.9 |
| Pain intensity | 4.5 ± 2.8 | 4.6 ± 2.8 | 4.0 ± 2.6 |
| Fatigue | 52.7 ± 10.4 | 52.7 ± 10.5 | 51.6 ± 10.1 |
| Sleep disturbance | 53.2 ± 8.9 | 53.5 ± 8.9 | 52.0 ± 8.9 |
| Pain interference | 58.3 ± 10.1 | 58.6 ± 10.1 | 57.0 ± 10.0 |
| Depression | 52.9 ± 9.8 | 53.3 ± 9.9 | 51.4 ± 9.4 |
| Anxiety | 54.1 ± 10.1 | 54.5 ± 10.2 | 52.4 ± 9.8 |
| PHQ-9 | 6.5 ± 5.4 | 6.8 ± 6.2 | 5.5 ± 5.7 |
| PHQ-9 Categories | |||
| None | 1311 (49%) | 1027 (48%) | 284 (56%) |
| Mild | 671 (25%) | 546 (25%) | 125 (25%) |
| Moderate | 349 (13%) | 301 (14%) | 48 (9%) |
| Moderately Severe | 202 (8%) | 168 (8%) | 34 (7%) |
| Severe | 133 (5%) | 115 (5%) | 18 (3%) |
| GAD-7 | 4.6 ± 5.3 | 4.8 ± 5.4 | 3.8 ± 4.8 |
| GAD-7 Categories | |||
| Minimal | 2267 (85%) | 1821 (83%) | 446 (88%) |
| Mild | 223 (8%) | 189 (9%) | 34 (7%) |
| Moderate | 138 (5%) | 122 (6%) | 16 (3%) |
| Severe | 65 (2%) | 55 (2%) | 10 (2%) |
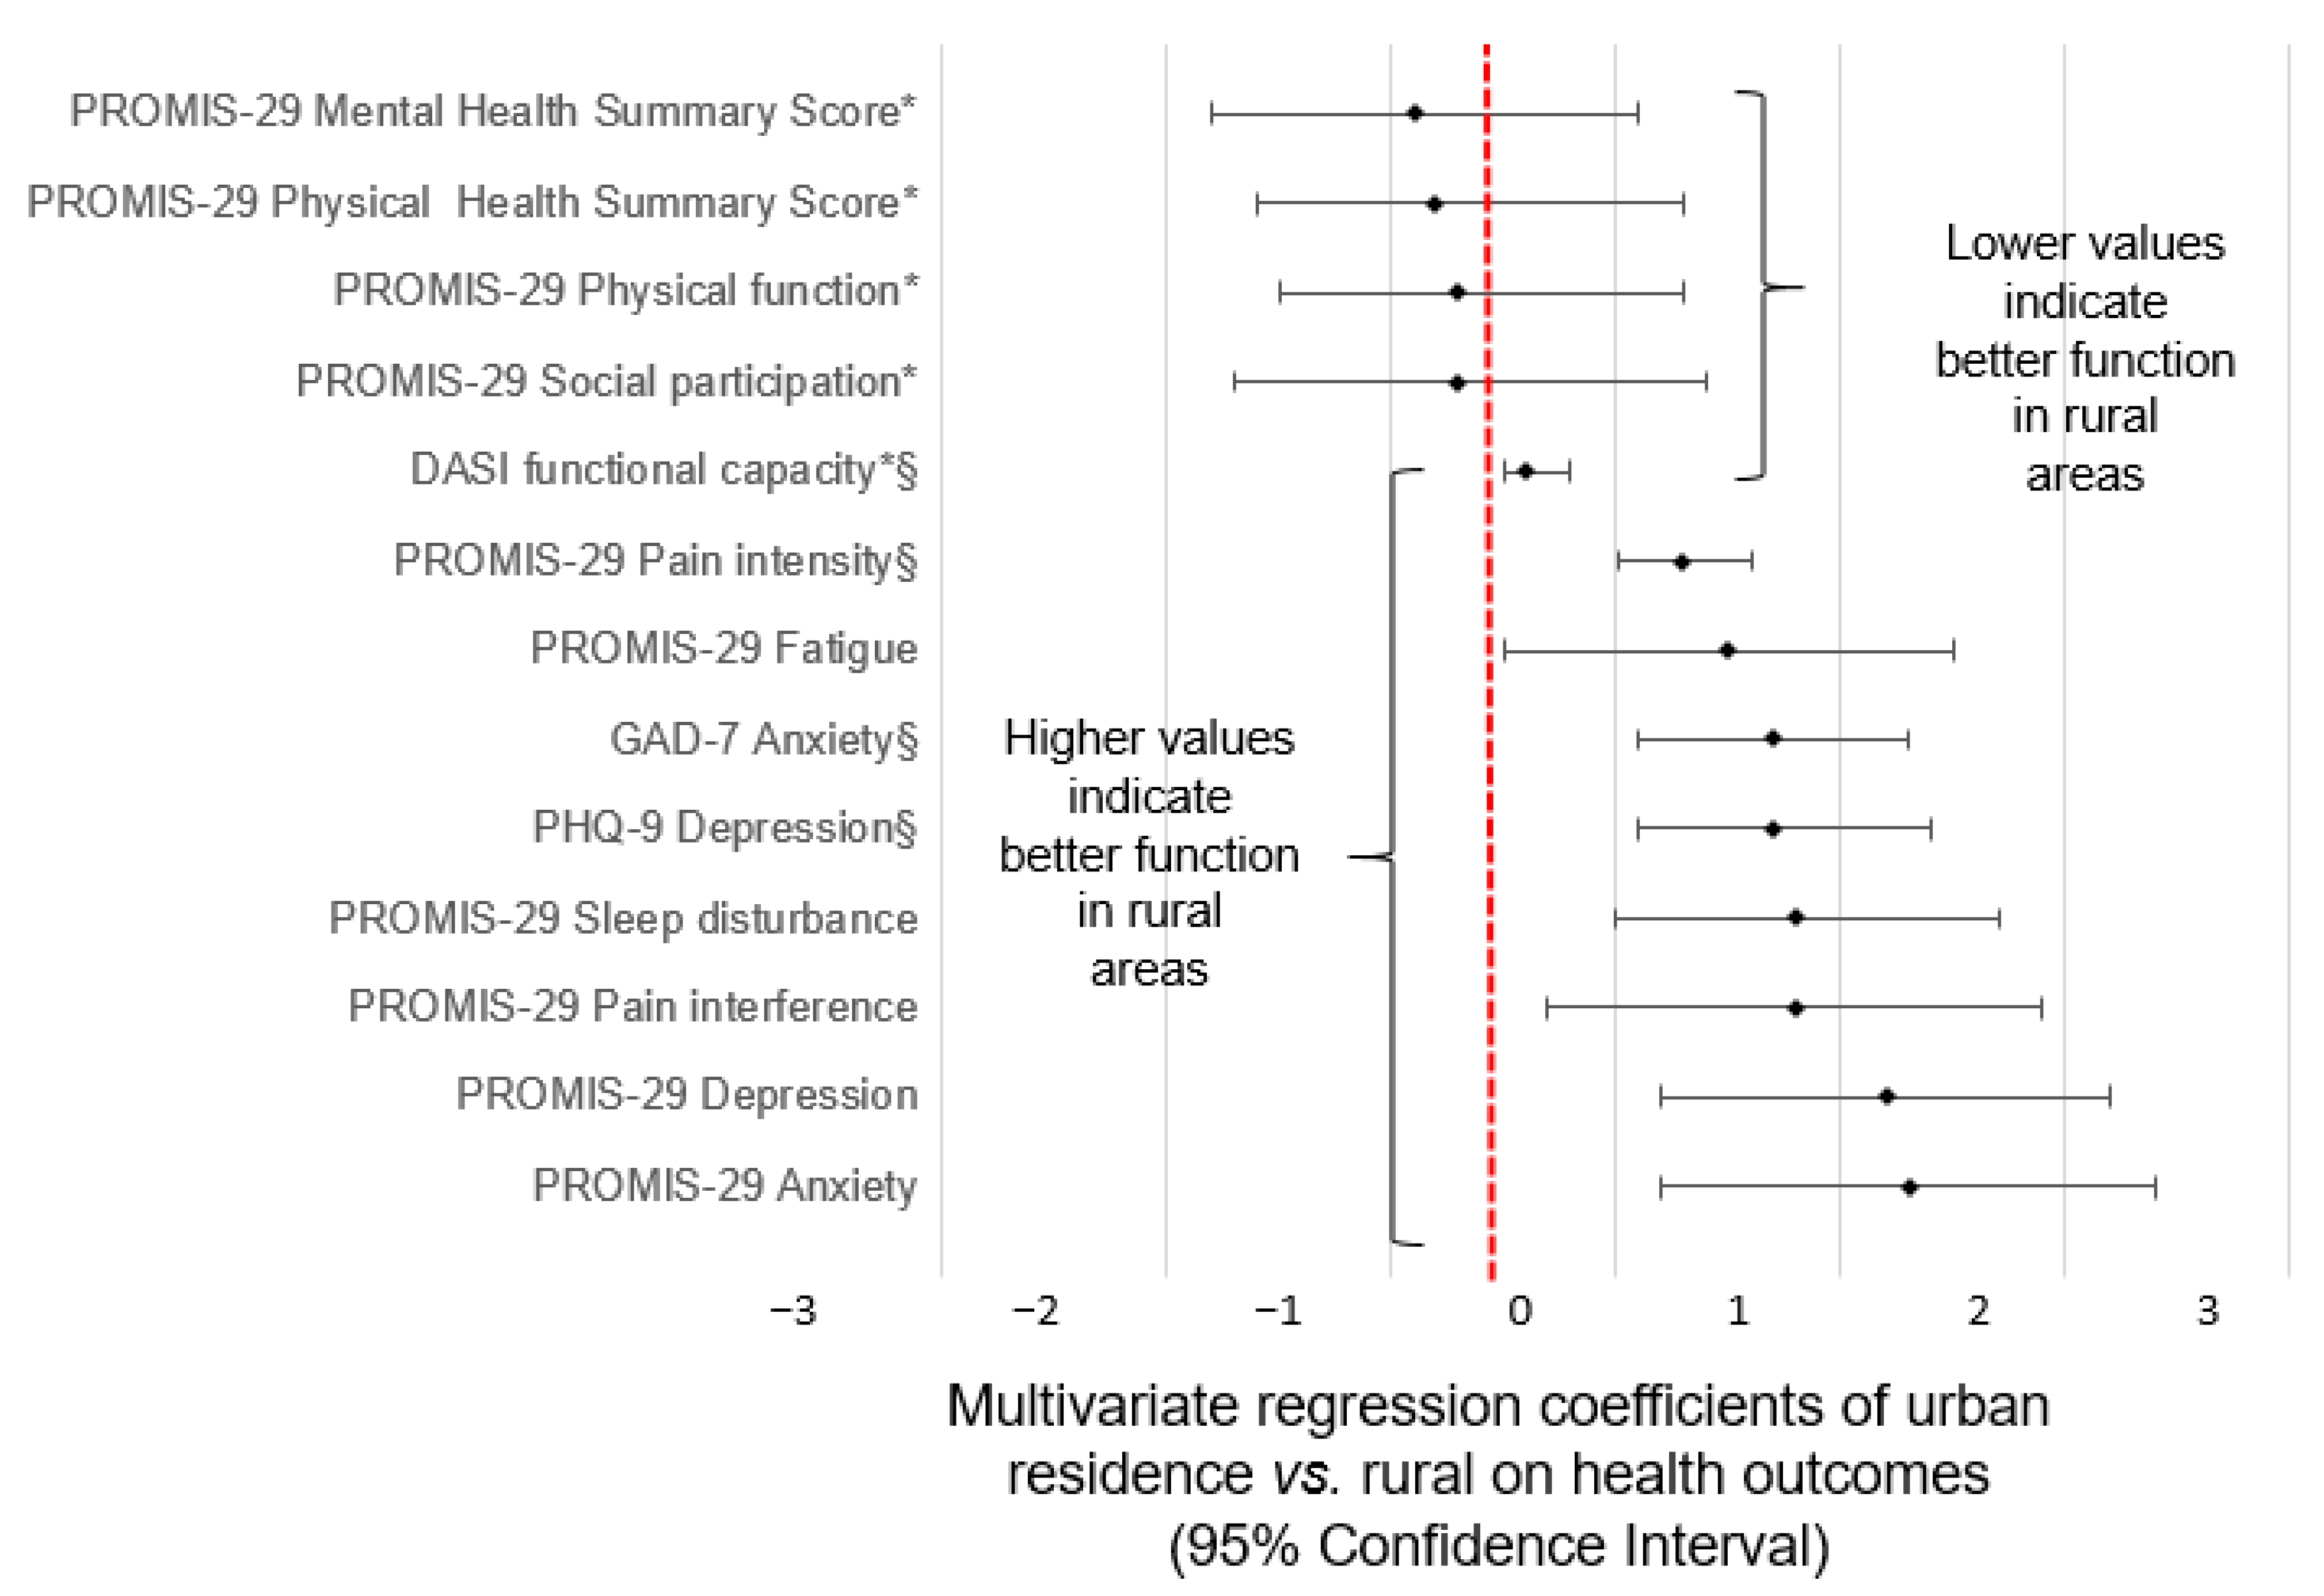
| Unadjusted | Adjusted | |||||
|---|---|---|---|---|---|---|
| Outcomes | Association of Urban vs. Rural | 95% CI | p | Association of Urban vs. Rural | 95% CI | p |
| a PROMIS-29 Mental health summary score * | −1.5 | −2.6, −0.5 | 0.005 | −0.9 | −1.8, 0.1 | 0.071 |
| b PROMIS-29 Physical health summary score * | −1.5 | −2.6, −0.4 | 0.01 | −0.8 | −1.6, 0.3 | 0.066 |
| c PROMIS-29 Physical function * | −1.4 | −2.5, −0.3 | 0.01 | −0.7 | −1.5, 0.2 | 0.118 |
| d PROMIS-29 Social participation * | −1.3 | −2.5, −0.1 | 0.03 | −0.7 | −1.7, 0.4 | 0.225 |
| d DASI functional capacity * | −0.5 | −0.7, −0.2 | <0.001 | −0.4 | −0.5, −0.2 | <0.001 |
| e PROMIS-29 Pain intensity | 0.6 | 0.2, 0.9 | 0.004 | 0.3 | −0.0, 0.6 | 0.067 |
| f PROMIS-29 Fatigue | 1.3 | 0.1, 2.4 | 0. 03 | 0.5 | −0.5, 1.5 | 0.308 |
| g GAD-7 Anxiety | 0.9 | 0.2, 1.6 | 0.008 | 0.7 | 0.1, 1.3 | 0.027 |
| g PHQ-9 Depression | 1.1 | 0.3, 1.8 | 0.004 | 0.7 | 0.1, 1.4 | 0.024 |
| h PROMIS-29 Sleep disturbance | 1.4 | 0.4, 2.4 | 0.008 | 0.8 | −0.1, 1.7 | 0.098 |
| g PROMIS-29 Pain interference | 1.4 | 0.2, 2.7 | 0.03 | 0.8 | −0.3, 1.9 | 0.172 |
| i PROMIS-29 Depression | 1.8 | 0.6, 2.9 | 0.002 | 1.2 | 0.2, 2.2 | 0.016 |
| j PROMIS-29 Anxiety | 2.1 | 0.8, 3.3 | 0.002 | 1.3 | 0.2, 2.4 | 0.021 |
Publisher’s Note: MDPI stays neutral with regard to jurisdictional claims in published maps and institutional affiliations. |
© 2022 by the authors. Licensee MDPI, Basel, Switzerland. This article is an open access article distributed under the terms and conditions of the Creative Commons Attribution (CC BY) license (https://creativecommons.org/licenses/by/4.0/).
Share and Cite
Bonnell, L.N.; Clifton, J.; Rose, G.L.; Waddell, E.N.; Littenberg, B. Urban–Rural Differences in Mental and Physical Health among Primary Care Patients with Multiple Chronic Conditions: A Secondary Analysis from a Randomized Clinical Trial. Int. J. Environ. Res. Public Health 2022, 19, 15580. https://doi.org/10.3390/ijerph192315580
Bonnell LN, Clifton J, Rose GL, Waddell EN, Littenberg B. Urban–Rural Differences in Mental and Physical Health among Primary Care Patients with Multiple Chronic Conditions: A Secondary Analysis from a Randomized Clinical Trial. International Journal of Environmental Research and Public Health. 2022; 19(23):15580. https://doi.org/10.3390/ijerph192315580
Chicago/Turabian StyleBonnell, Levi N., Jessica Clifton, Gail L. Rose, Elizabeth N. Waddell, and Benjamin Littenberg. 2022. "Urban–Rural Differences in Mental and Physical Health among Primary Care Patients with Multiple Chronic Conditions: A Secondary Analysis from a Randomized Clinical Trial" International Journal of Environmental Research and Public Health 19, no. 23: 15580. https://doi.org/10.3390/ijerph192315580
APA StyleBonnell, L. N., Clifton, J., Rose, G. L., Waddell, E. N., & Littenberg, B. (2022). Urban–Rural Differences in Mental and Physical Health among Primary Care Patients with Multiple Chronic Conditions: A Secondary Analysis from a Randomized Clinical Trial. International Journal of Environmental Research and Public Health, 19(23), 15580. https://doi.org/10.3390/ijerph192315580