Article

A Bibliometric Analysis of Wearable Device Research Trends 2001–2022—A Study on the Reversal of Number of Publications and Research Trends in China and the USA

1
Graduate School of Technology Management, Ritsumeikan University, 2-150 Iwakuracho, Ibaraki 567-8570, Japan
2
School of Environment and Society, Tokyo Institute of Technology, Tokyo 108-0023, Japan
3
Center for Research and Education on Drug Discovery, The Graduate School of Pharmaceutical Sciences, Hokkaido University, Sapporo 060-0812, Japan
*
Author to whom correspondence should be addressed.
Int. J. Environ. Res. Public Health 2022, 19(24), 16427; https://doi.org/10.3390/ijerph192416427
Submission received: 30 October 2022 / Revised: 25 November 2022 / Accepted: 28 November 2022 / Published: 7 December 2022
(This article belongs to the Section Digital Health)

Abstract

:
In recent years, Wearable Devices have been used in a wide variety of applications and fields, but because they span so many different disciplines, it is difficult to ascertain the intellectual structure of this entire research domain. No review encompasses the whole research domain related to Wearable Devices. In this study, we collected articles on wearable devices from 2001 to 2022 and quantitatively organized them by bibliometric analysis to clarify the intellectual structure of this research domain as a whole. The cluster analysis, co-occurrence analysis, and network centrality analysis were conducted on articles collected from the Web of Science. As a result, we identified one cluster that represents applied research and two clusters that represent basic research in this research domain. Furthermore, focusing on the top two countries contributing to this research domain, China and the USA., it was confirmed that China is extremely inclined toward basic research and the USA. toward applied research, indicating that applied and basic research are in balance. The basic intellectual structure of this cross-sectional research domain was identified. The results summarize the current state of research related to Wearable Devices and provide insight into trends.

1. Introduction

Wearable means “something that can be worn”. Wearable devices or wearable technology is a general term for small electronic devices, mobile devices, computers, microchips, and other information devices with wireless communication capabilities that can be worn on the human body as accessories, gadgets, or clothing [1]. In recent years, various wearable devices have been developed, including wristwatch-type devices such as the Apple Watch, Fitbit, Samsung Gear, Microsoft Band, and Garmin, and eyeglass-type, ring-type, shoe-type, and clothing-type devices. According to a report by Mordor Intelligence [2], global shipments of smart wearables are expected to reach 266.3 million units by 2020 and 776.23 million units by 2026. International Data Corporation [3] expects full-year shipments to remain flat at 535.5 million units in 2022 due to rising global inflation, semiconductor shortages, and concerns over the recession caused by the global situation but expects growth to pick up again in 2023. According to Reportlinker.com [4], the wearable technology market is expected to grow to $61.32 billion between 2022 and 2026 at a CAGR of 14.31%. Wearable devices are used in a wide variety of settings, including education, medicine, entertainment, gaming, sports, and music; based on Vandrico’s wearable device database, there were 431 registered devices as of 21 September 2022 [5]. The top registered categories were lifestyle (225 devices), fitness (188 devices), and medicine (88 devices), indicating a strong interest in health management (it should be noted, however, that the Vandrico database has some devices classified into multiple categories). The most common health use of wearable devices is to monitor physiological and biochemical parameters of daily life and information associated with human behaviour. Heart rate information obtained from electrocardiograms and phonocardiograms, blood pressure, blood oxygen saturation, body temperature, and physical activity are commonly used. Traditionally, these parameters have been used to monitor physical information such as sleep [6,7] and exercise [8,9,10]. In recent years, based on these parameters, there is also a focus on developing devices, algorithms, and systems for monitoring the body’s stress state (physical and psychological stress) [11,12,13]. In particular, many efforts have been made to monitor the biometric and physical information of workers in the work environment [14,15,16,17,18,19], to analogize workload and physical and psychological stress, and to utilize this information for labour management, work environment safety risk alerts and accident prevention [20,21,22,23,24,25,26,27,28,29].
There have been relatively few studies that have focused on comprehensive knowledge structures despite the enormous growth in wearable device research in recent years. Previous studies have reported use- or industry-focused reviews, such as a bibliometric analysis of wearable technology research in the healthcare field [30] and the application of wearable devices in safety management in the construction industry [31]. Alternatively, a bibliometric analysis of wearable device research has been reported using wearable technology and other related products (e.g., smartwatches and smart glasses) as keywords [32]. However, the use of specific keywords narrows the research domain of interest and, trend analyses are limited to qualitative reviews of research papers under particular conditions, and none of them covers the wearable device research as whole. The reason for this is thought to be that this research domain covers many different fields, making it difficult to see the research domain as a whole. Thus, previous studies intentionally narrow the target research domain by selecting the in-tended use and industry or assigning specific keywords. Therefore, this study does cover the entire wearable device. This study collects information in the research domain of wearable devices from 2001 to 2022, organizes it quantitatively through bibliometric analysis, and clarifies the intellectual structure of this industry to solve this research gap. The objective is to comprehensively and objectively clarify the entire research domain surrounding wearable devices by not limiting the industry in which wearable devices are introduced or by carefully selecting keywords in the literature collection, as in previous studies.

2. Methods

2.1. Bibliometric Analysis

Quantitative analysis, frequency distribution, and statistics of publications are an important factor in science policy in many countries and are referred to as bibliometric analysis. Bibliometric analysis is a research method that utilises mathematics, statistics, and bibliography to quantitatively analyse academic literature [33,34,35]. It is widely used to identify relationships among authors, periods, research directions, and other variables in order to identify knowledge structures, emerging trends, and tendencies in a given research domain [36]. By rigorously understanding large amounts of unstructured data, the nuances of the accumulation and evolution of scientific knowledge in established fields can be deciphered and mapped so that researchers can recognise “hidden patterns” and use them to inform decision-making processes, predict new technologies [37]. Today, bibliometric software such as VOSviewer [38,39] and scientific databases such as Web of Science have advanced and become more accessible, which is one reason why bibliometric analysis has become popular.

2.2. Cluster Analysis

This study used VOSviwer software, which provides visualisation of bibliometric networks, to create a co-occurrence word network and cluster analysis [39] for identifying words with similar characteristics in the collected literature and trends in research activities related to wearable devices. The results of the bibliometric analysis are often presented as visual maps using visualisation tools such as VOSviwer [39], CiteSpace [40], and HistCite [41,42]. Each visualisation tool was differentiated based on its functionality. In this study, VOSviewer was used because it specialises in visualising bibliometric networks, is suitable for visualising large networks, and has sufficient functionality to extract cluster information.
VOSviewer arranges the nodes in a network in a two-dimensional space, assigns them to exactly one cluster, and visualises them according to their individual colours [43]. A cluster comprises a set of closely related nodes. The size of a circle represents its importance/frequency within the bibliographic network (what exactly a circle means depends on the object of analysis), and the closer the distance between circles, the stronger the bibliographic relevance. The VOSviewer uses a smart local moving algorithm [44].

2.3. Co-Occurrence Analysis of Keywords

The (author) keywords provided to a paper reflect the core content of the research paper. Keyword co-occurrence analysis is an important quantitative method in bibliometric analysis for investigating scientific constructs based on the assumption that keywords provide a consistent explanation for the content of an article [45]. This method implies that if keywords co-occur frequently in the literature, the underlying concepts and theories are closely related [46]. This study did not take steps to merge singular and plural keywords (e.g., singular “devices”, “sensors” and plural “devices”, “sensors”, etc.). In this study, what each cluster means was judged by keywords except above one. The reason is that these keywords, which are often listed by authors in wearable device research field, can generate false co-occurrence even if there is not actual relationship. Therefore, these keywords (i.e., “devices” and “devices”) exist as separate nodes and are each classified into a cluster. The association between two keywords indicates the strength of the link between them, which is numerically expressed as a numerical value, with a higher number indicating a stronger association. If a keyword has many co-occurrences, it indicates that it is central, with many connections to other words. These can be quantitatively indicated using a centrality measure [47]. Centrality is an indicator that attempts to capture from a network perspective the presence that influences others (other nodes) in a given network, the central presence, and can quantitatively express the structural characteristics of the network as a whole. The concept of network centrality emerged in the 1940s, and many centrality measures have since been proposed [48]. In this study, we used the following three centrality measures commonly used in network analysis.
  • Degree Centrality
The measure is expressed as the number of lines (edges) connecting a node. This indicates the number of edges connecting nodes. A node with a high degree centrality has many connections with other nodes and can be evaluated as a central node.
2.
Betweenness Centrality
The measure of the degree to which a node is the shortest path to another node [49]. This indicates the extent to which a node is included in the shortest path between other nodes or relays a node. In a network of connected information, connectivity is maintained by the existence of a node that acts as a bridge between networks. If a bridging node does not exist, a situation may arise in which the information transmission path of the network senses would have collapsed. Therefore, we focused on the linkage relationship between nodes and evaluated more nodes and the central node that bridges the network.
3.
Closeness centrality
Closeness centrality is an indicator of the distance between a node and all other nodes [50,51]. It takes the reciprocal of the average of the shortest path lengths between nodes and can evaluate nodes that are most closely related to other nodes.
The following settings were used in VOSviewer to perform co-occurrence analysis:
  • Type of analysis: Co-occurrence
  • Unit of analysis: All keywords
As a result, a total of 49,720 keywords existed in all target articles, and we conducted a co-occurrence analysis using the top 1000 keywords out of 4756 that exceeded the co-occurrence threshold at least five times.

2.4. Data Collection

The Web of Science (WoS) database was used to collect bibliographic information. WoS has strict selection criteria and carefully selects high-quality international journals based on their impact factors. WoS was selected because it has the policy of listing all items in the literature, which makes it possible to handle exhaustive bibliographic information and exclude poor-quality literature. The keyword “Wearable Device” (hereafter WD) was used to collect literature, and all relevant literature was included in the survey. The subject fields were not included. This is because analysing research fields related to wearable devices is the subject of only one survey. However, we excluded proceedings papers and books and limited the text type to “Article” to include only articles published in specialised journals. The study period was from 2001 to 2022 (31 May 2022). The final string used in the search was as follows. (ALL = (Wearable Device)) AND (DT == (“ARTICLE”)) AND (DOP == (2000-01-01/2022-05-31)). The parameters used to annotate the literature are summarised below. As a result, a final total of 20,581 publications were extracted (Figure 1). In this study, screening requirements were loosely set to cover a broad range of studies in the wearable device research domain (time span, Language, Document types). The extracted publications were exported as text files using the WoS export function, and “Full Record and Cited References” was selected as the record content to obtain all relevant information for all 43 references (Appendix A.1).

2.5. The Software Used for the Analysis

Bibliographic information obtained from the WoS was used to form bibliographic networks and clustering using VOSviewer. The network information generated by VOSviewer was analysed for centrality using MATLAB (R20022a). The results were analysed using Microsoft Excel (2019).

3. Results

3.1. Characteristics of Research Domains

Figure 2 shows the number of publications related to “Wearable Device” collected from the Web of Science database by year.
In 2001, only 22 papers were available. However, since 2014, the number of relevant papers has increased dramatically, with 4608 papers published in 2021, an increase in approximately 209 times compared to 2001. A total of 18,553 relevant papers were published between 2001 and 2021. From the results of year 2001 through 2021, a fourth polynomial regression analysis was performed to estimate the number of publications to the year of 2025 ( y = 0.0032 x 4 + 1.5732 x 3 31.788 x 2 + 178.15 x 202.35 , R 2 = 0.9952 ) [36]. As a result, the number of papers related to the domain of research on wearable devices is expected to exceed 10,000 in 2025.
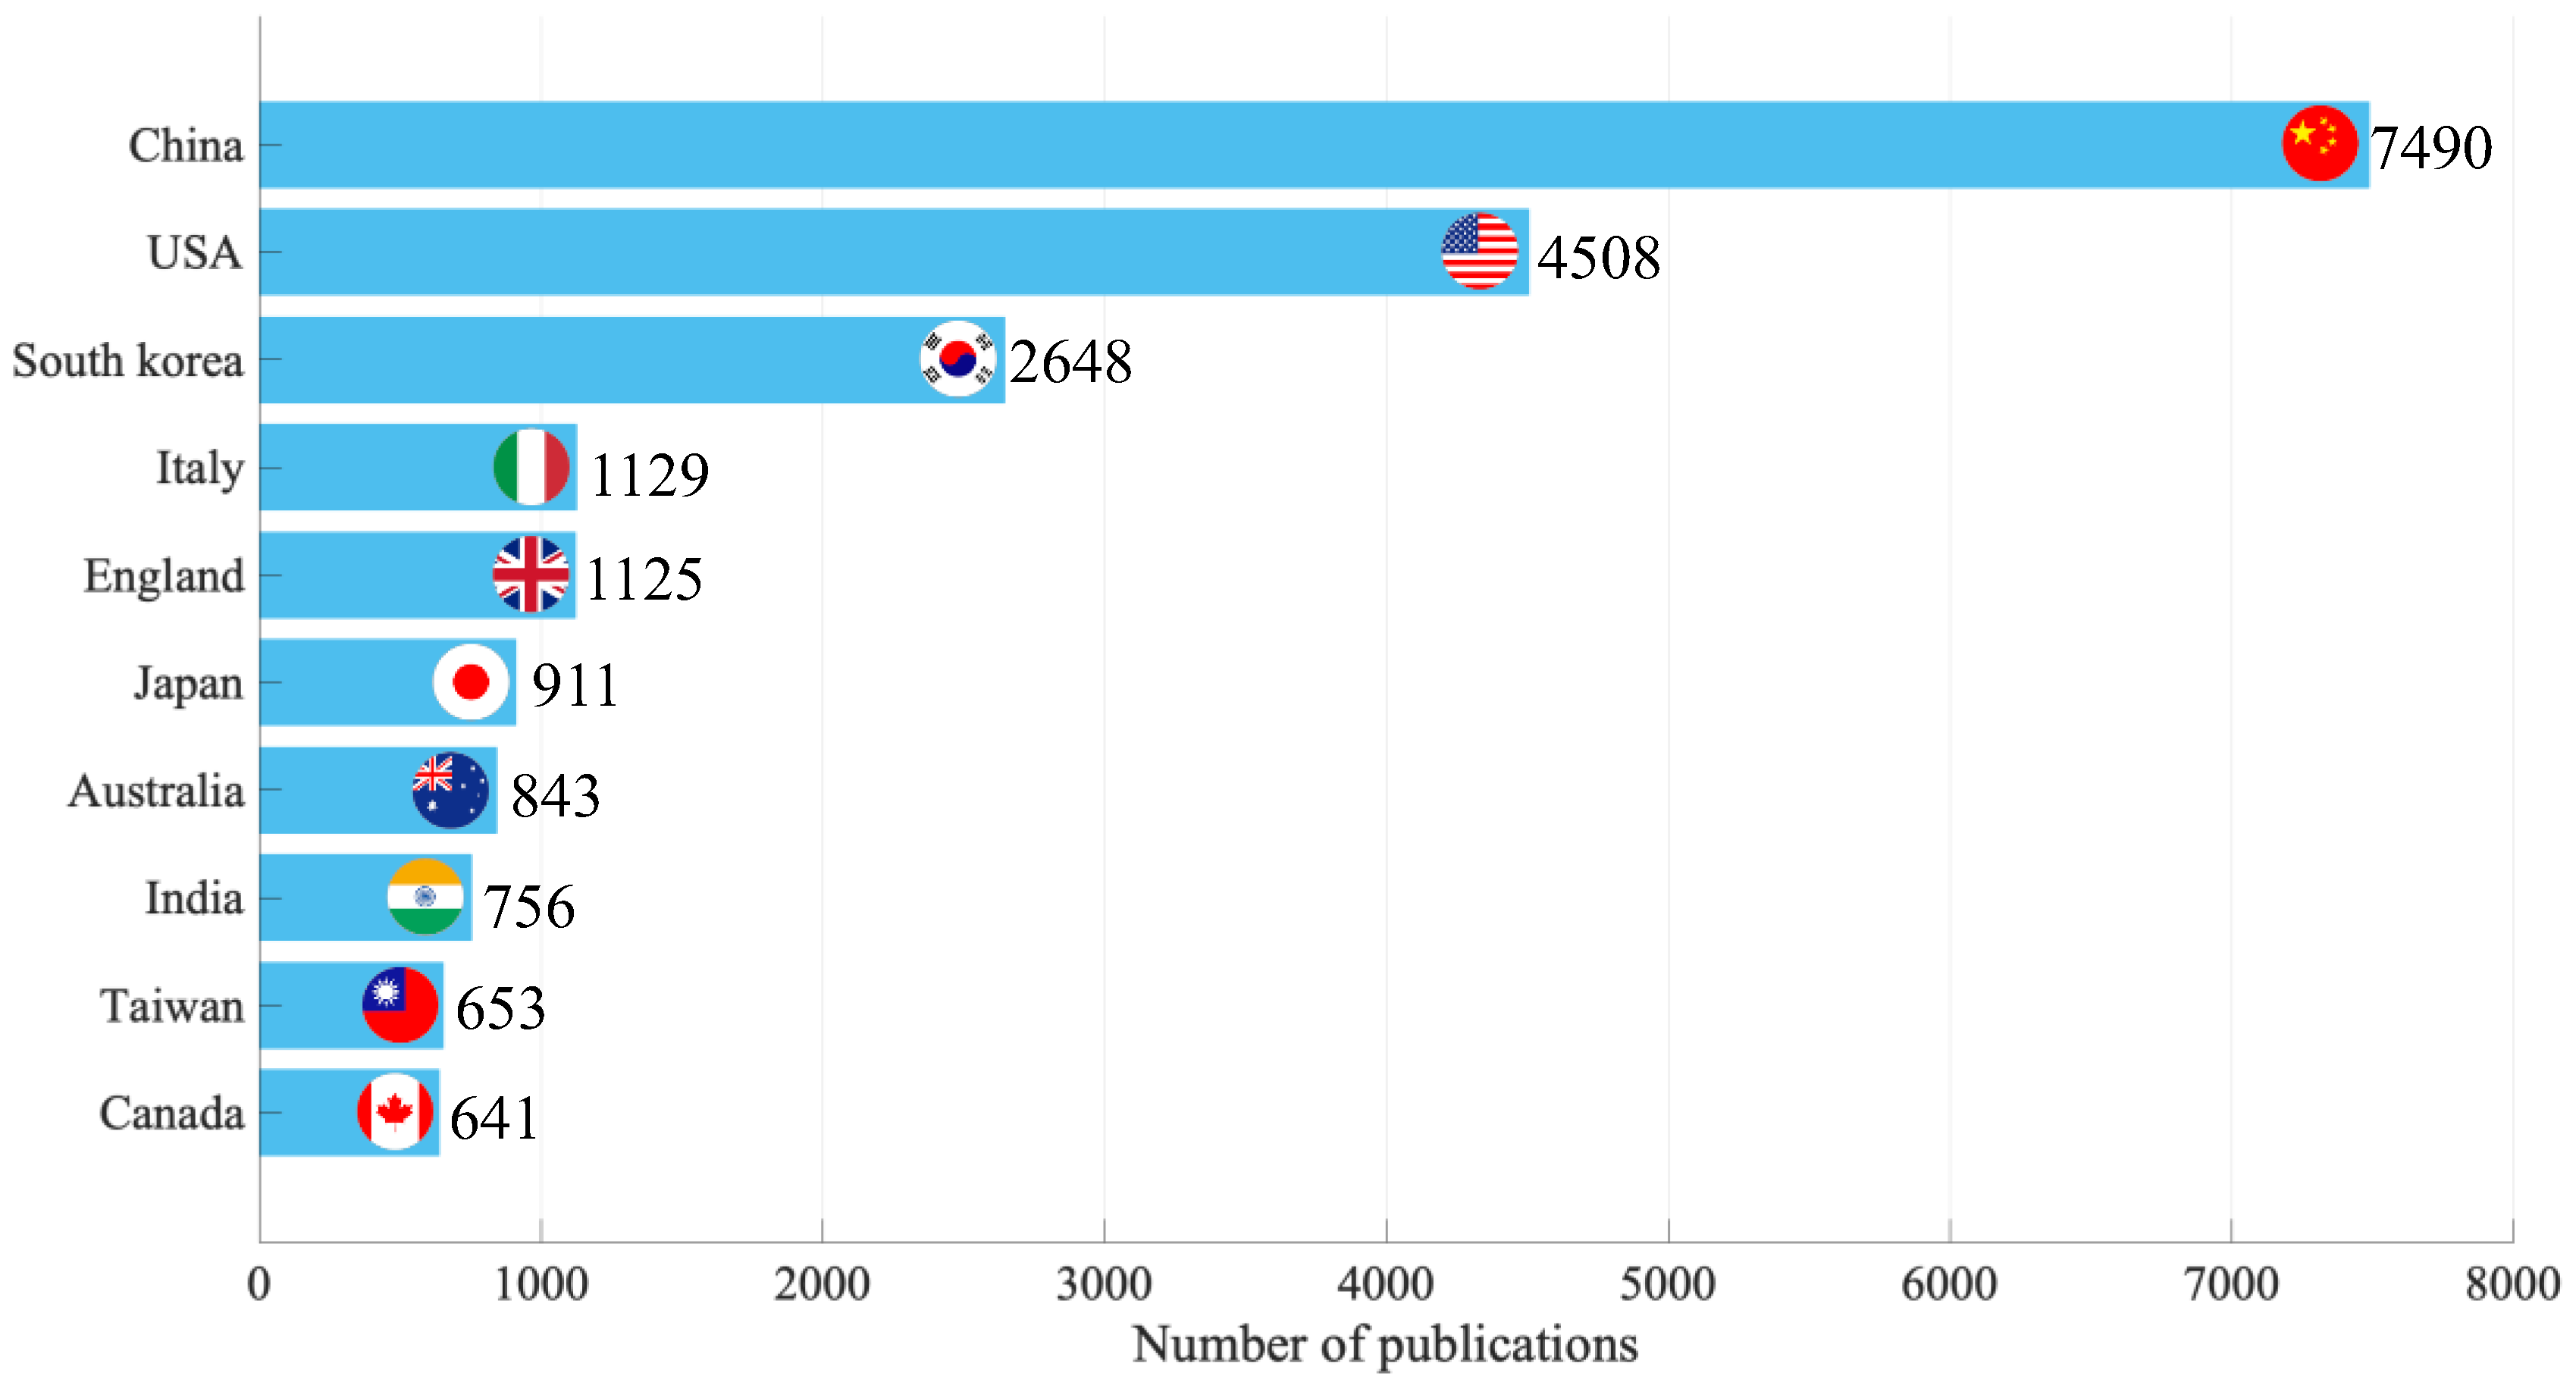
Figure 3 compares the number of papers on wearable devices by country. During the period 2001–2022, People’s Republic of China (hereafter referred to as “China”) has by far the largest number of papers, with a total of 7490 papers published, corresponding to about 37% of the total number of papers. The next largest countries were the United States (4508 papers, or about 23% of the total) and South Korea (2648 papers, or 13% of the total), indicating that China and the United States are leading in this research domain.
Figure 4 shows the co-authorship network for the ten countries that contributed the most to the literature in this research domain. All the top 10 countries belonged to a co-authorship network, indicating world-class collaboration. The co-authorship networks in the top 10 countries formed two clusters. Cluster 1 (red) was a group formed by Italy (rank 4), England (rank 5), Australia (rank 7), and Canada (rank 10), including China (rank 1) and the USA (rank 2). The group included Europe, the U.S., and China. Cluster 2 (green) comprised South Korea (rank 3), Japan (rank 6), India (rank 8), and Taiwan (rank 9), a group formed in Asian countries excluding China. In the field of wearable device research, it is clear that there is a strong and weak collaboration among regions.
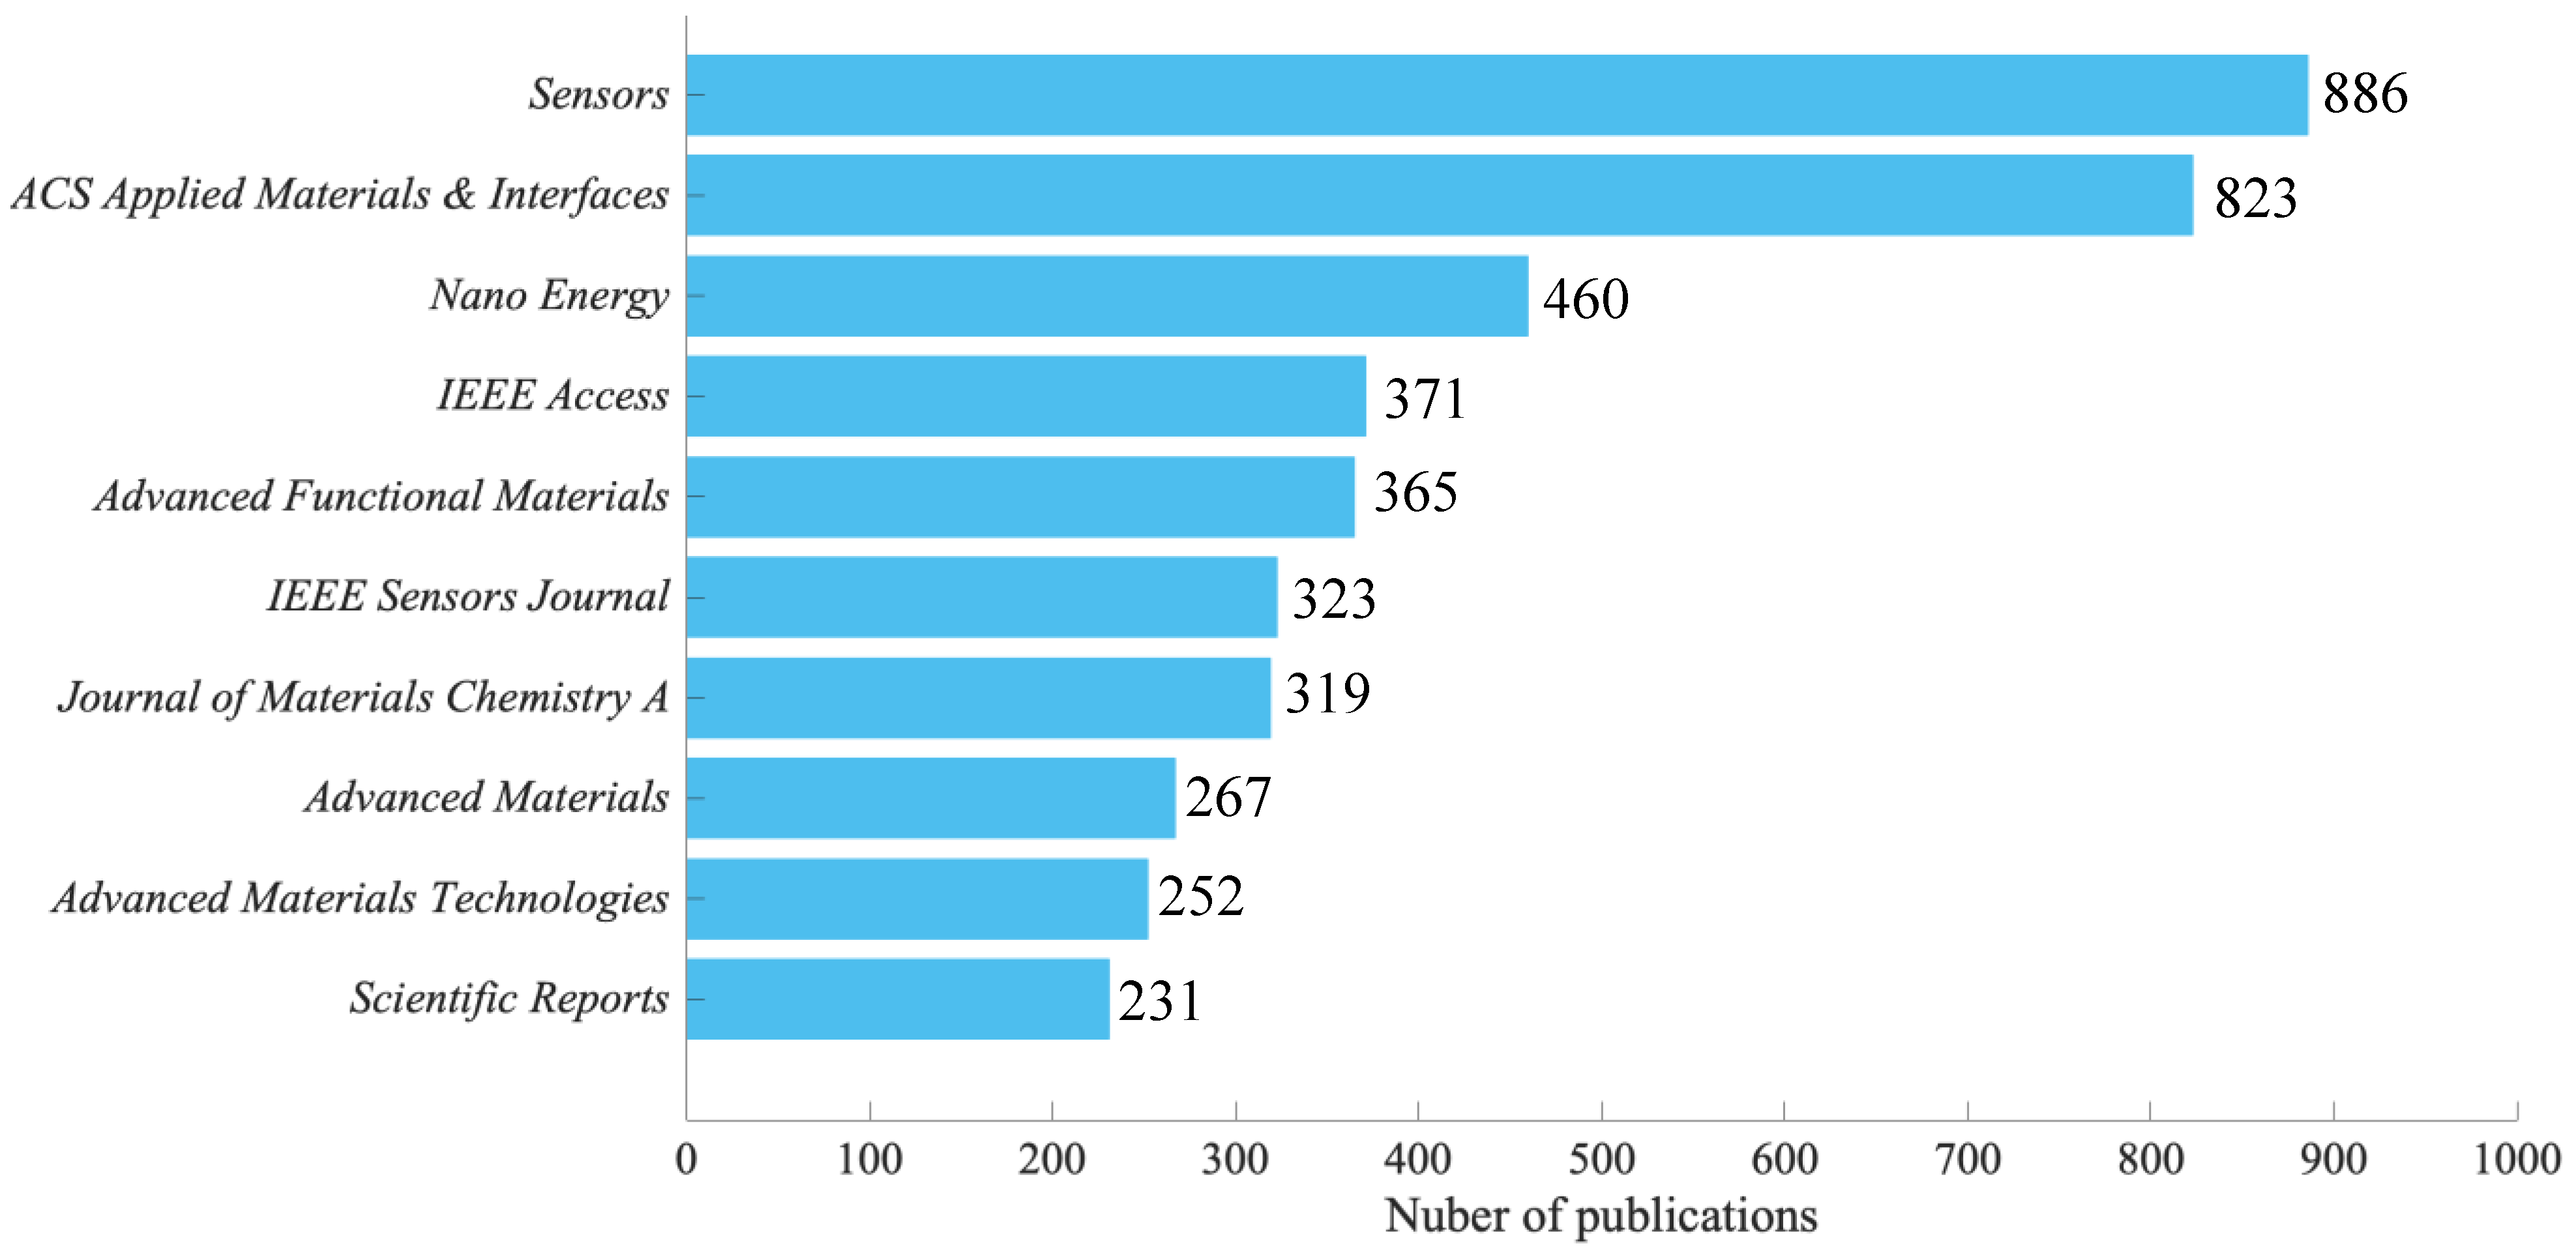
A comparison of the number of papers related to wearable devices by the journal is shown in Figure 5. The number of papers in the period 2001–2022 is the largest for Sensors (886 papers, or approximately 4.4% of the total number of papers), followed by ACS Applied Materials and Interfaces (823 papers, or approximately 4% of the total number of papers). This was followed by Nano Energy (460 papers, corresponding to 2.3% of the total). The top 10 journal categories covered a wide range of fields, including chemistry, materials science, physics, energy, nanotechnology, electrical engineering, and information technology.

3.2. Co-Occurrence Analysis of Keywords

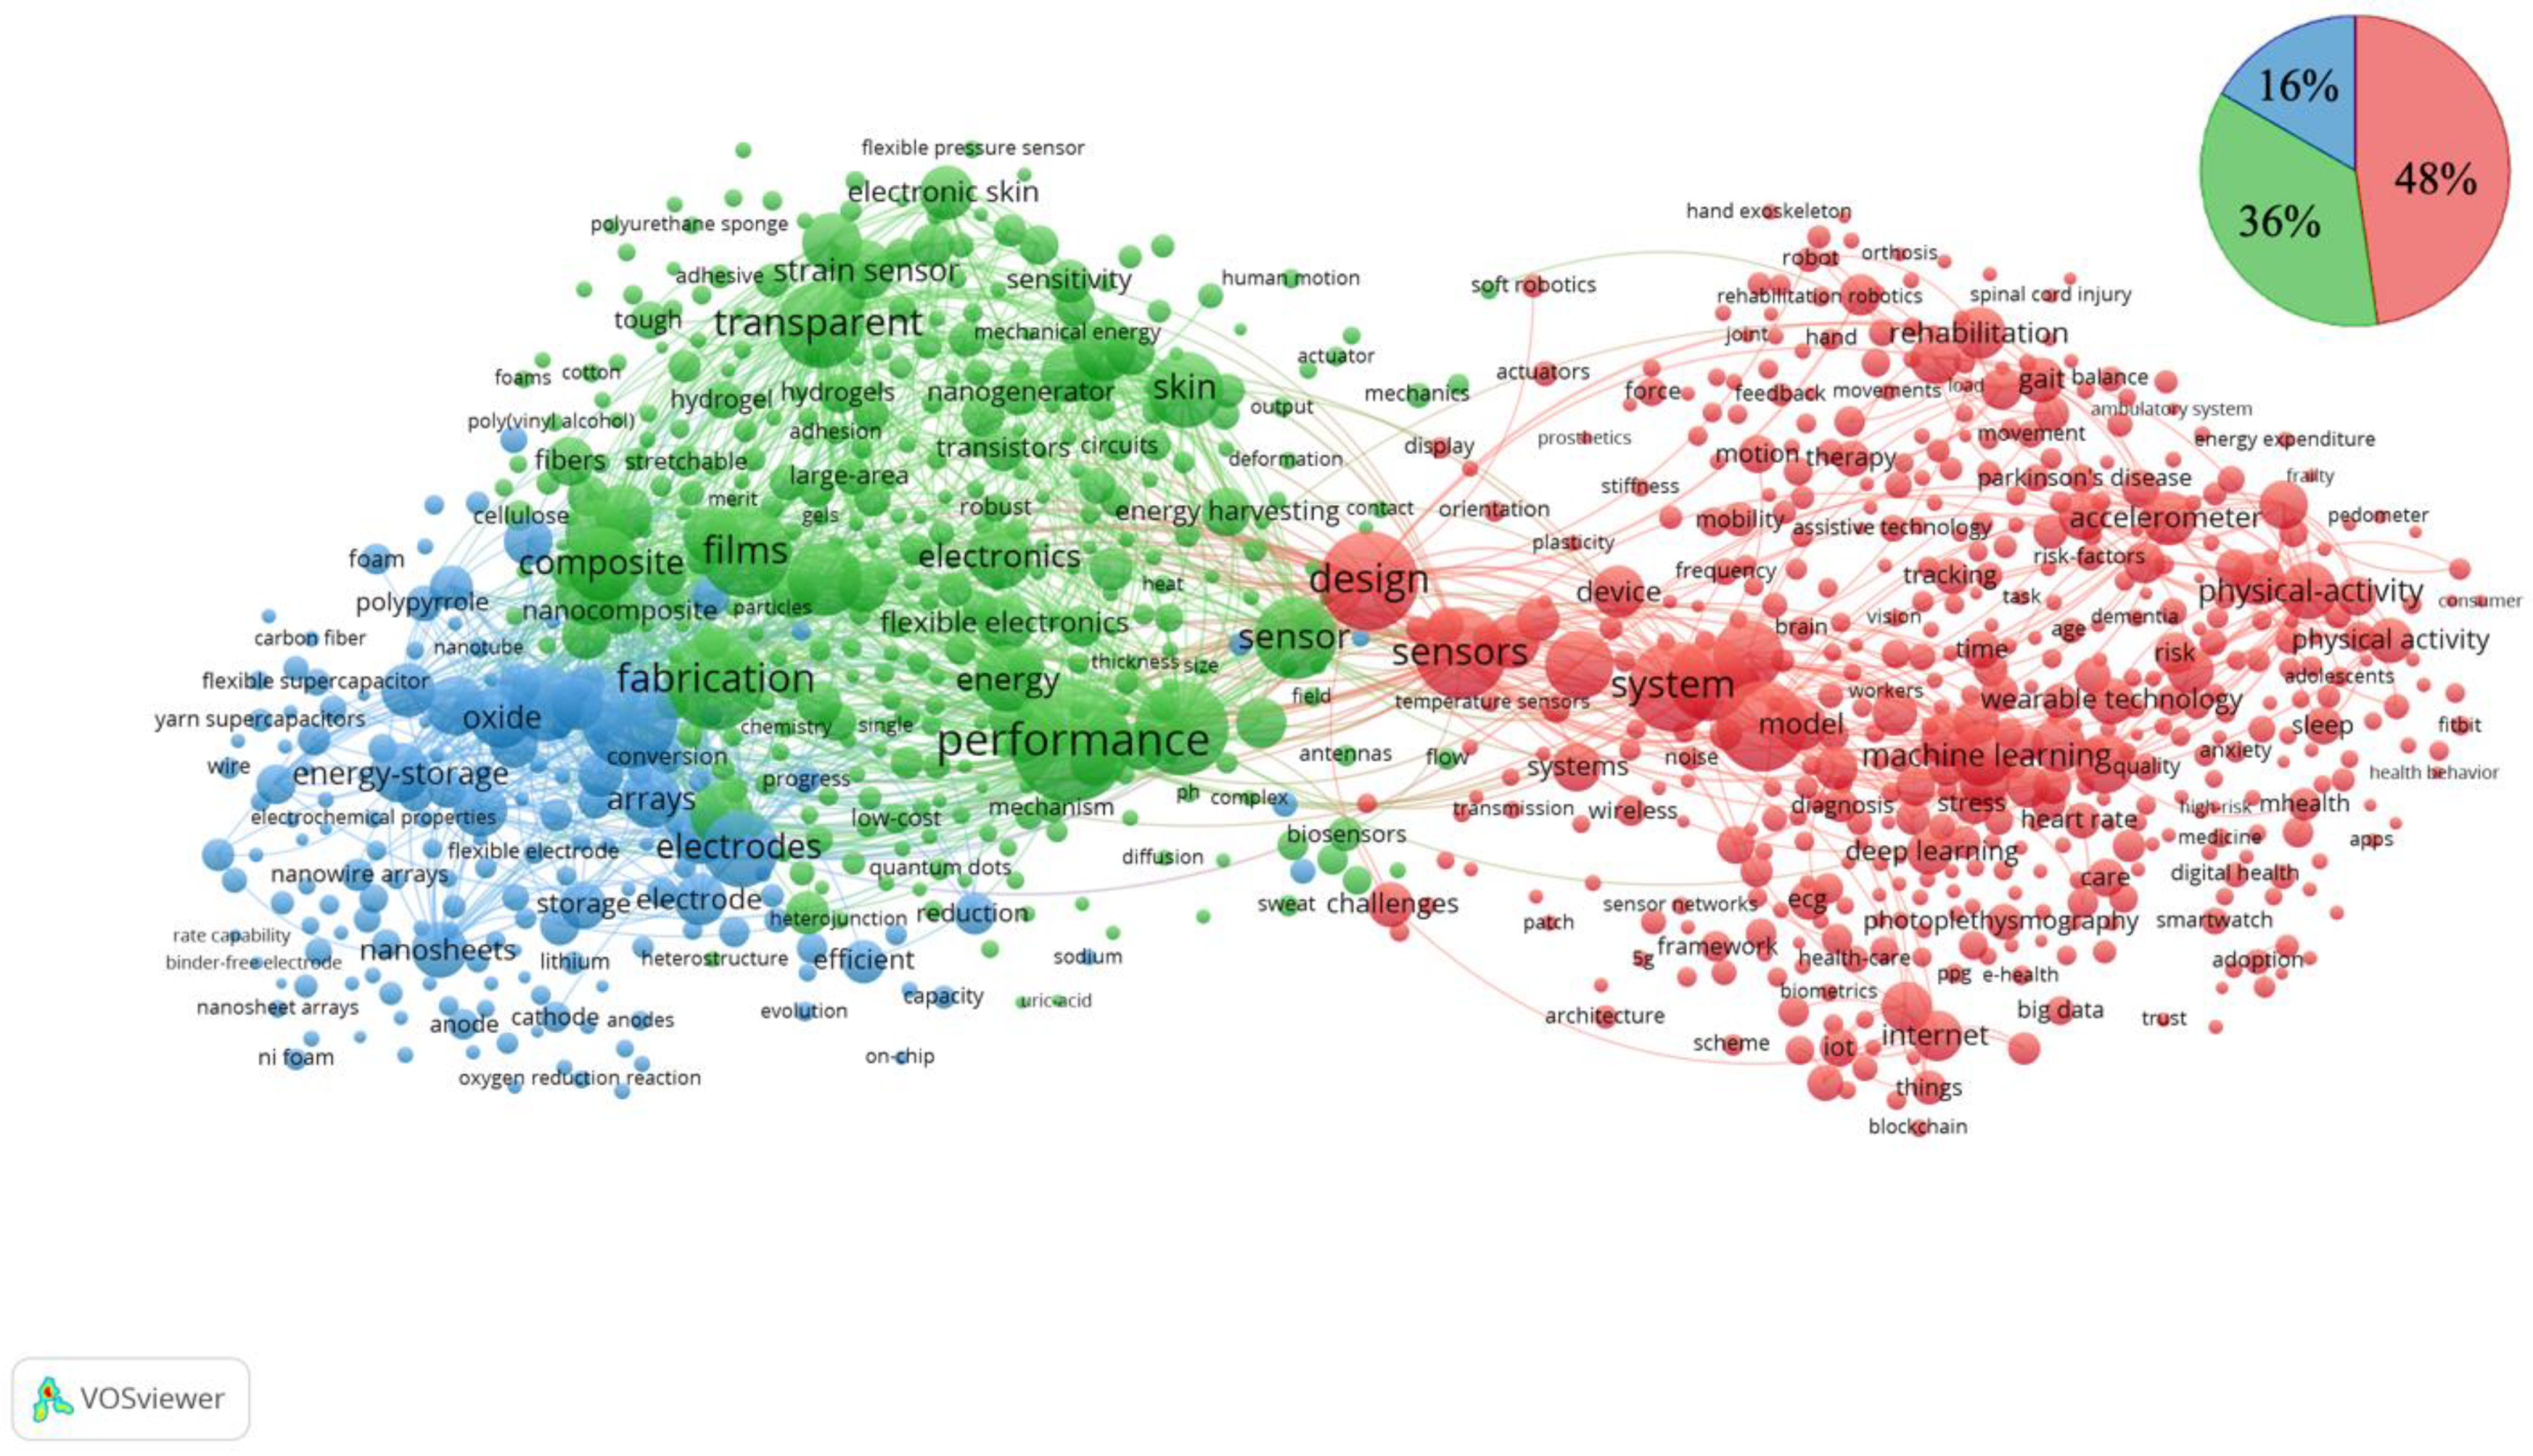
For all articles in this research domain extracted from the Web of Science between 2001 and 2022, a co-occurrence analysis was performed on all author keywords in the literature using VOSviewer to generate a co-occurrence network. The generated networks formed three custers (Figure 6 and Table 1). The top ten keywords for each cluster are shown. Each cluster had the following characteristics. Cluster 1 (red) contains the names of the wearable device research domains themselves, such as “wearable device(s)” and “wearable sensors”. Others included words related to health care such as “health”, “behaviour”, “walking”, “physical activity”, “rehabilitation”, and “disease”, as well as “biomedical monitoring (monitoring)”, “internet”, “system(s)”, and other technical words, and “machine learning”, which has been the focus of much attention in recent years. Thus, we can say that cluster 1 covers words related to applied research, such as medicine, bionics, (medical) engineering, and human–computer interaction. Cluster 2 (green) consists of words related to sensors and elements, such as “sensor”, “wearable electronics”, “carbon nanotube(s)”, “composites”, “conductivity”, and “strain sensor.” Thus, it can be said that cluster 2 is a cluster covering words related to chemistry and (electrical) engineering. Cluster 3 (blue) consists of words related to nanotechnology and compounds such as “graphene”, “oxide”, “reduced graphene oxide”, “nanowires”, “supercapacitor”, “nanostructures”, “nanosheets”, and “polypyrrole”. Cluster 3 comprised words related to nanotechnology and compounds. Thus, it can be said that cluster 3 is composed of words related to materials science (engineering). Cluster 1 covers applied research, and clusters 2 and 3 cover basic research. Of the total 1000 keywords comprising the co-occurrence network, cluster 1 accounted for about 48%, cluster 2 for about 36%, and cluster 3 for about 16%, with the applied research domain (cluster 1) and the basic research domain (clusters 2 and 3) accounting for approximately half.

3.3. Comparing Two Countries’ Contributions to the Research Domains (China vs. USA)

Figure 7 and Appendix A.2 show the number of publications by year for China and the USA in the wearable device research domain from 2001 to 2021. As of 2021, China had 1974 papers, and the USA had 866 papers, approximately twice as many as the USA. The trend in the number of papers published in both countries was divided into three periods. Period 1: The period of USA dominance. Period 1: The period from 2001 to 2013, when the number of papers published in the USA was slightly higher than that in China. During this period, China averaged 7.4 papers/year, and the USA averaged 21.6 papers/year, indicating that the USA had more papers than China, albeit slightly. Period 2: The number of papers in China and the United States competed with each other from 2014–2016. Unlike Period 1, there was almost no difference in the number of papers published in China and the USA. Period 3: The period of China’s dominance, from 2017 to 2021, when the number of papers in China reversed the trend of the number of papers in the U.S. and greatly exceeded the number of papers in the U.S. Unlike in Period 1 and Period 2, the number of papers in China and the number of papers in the USA averaged 1220/year and 686/year, respectively, and the number of papers in China greatly surpassed the number of papers in the USA. While the number of papers in the USA is becoming somewhat steady and parallel, China is still in the growth phase and is expected to increase further in the future.
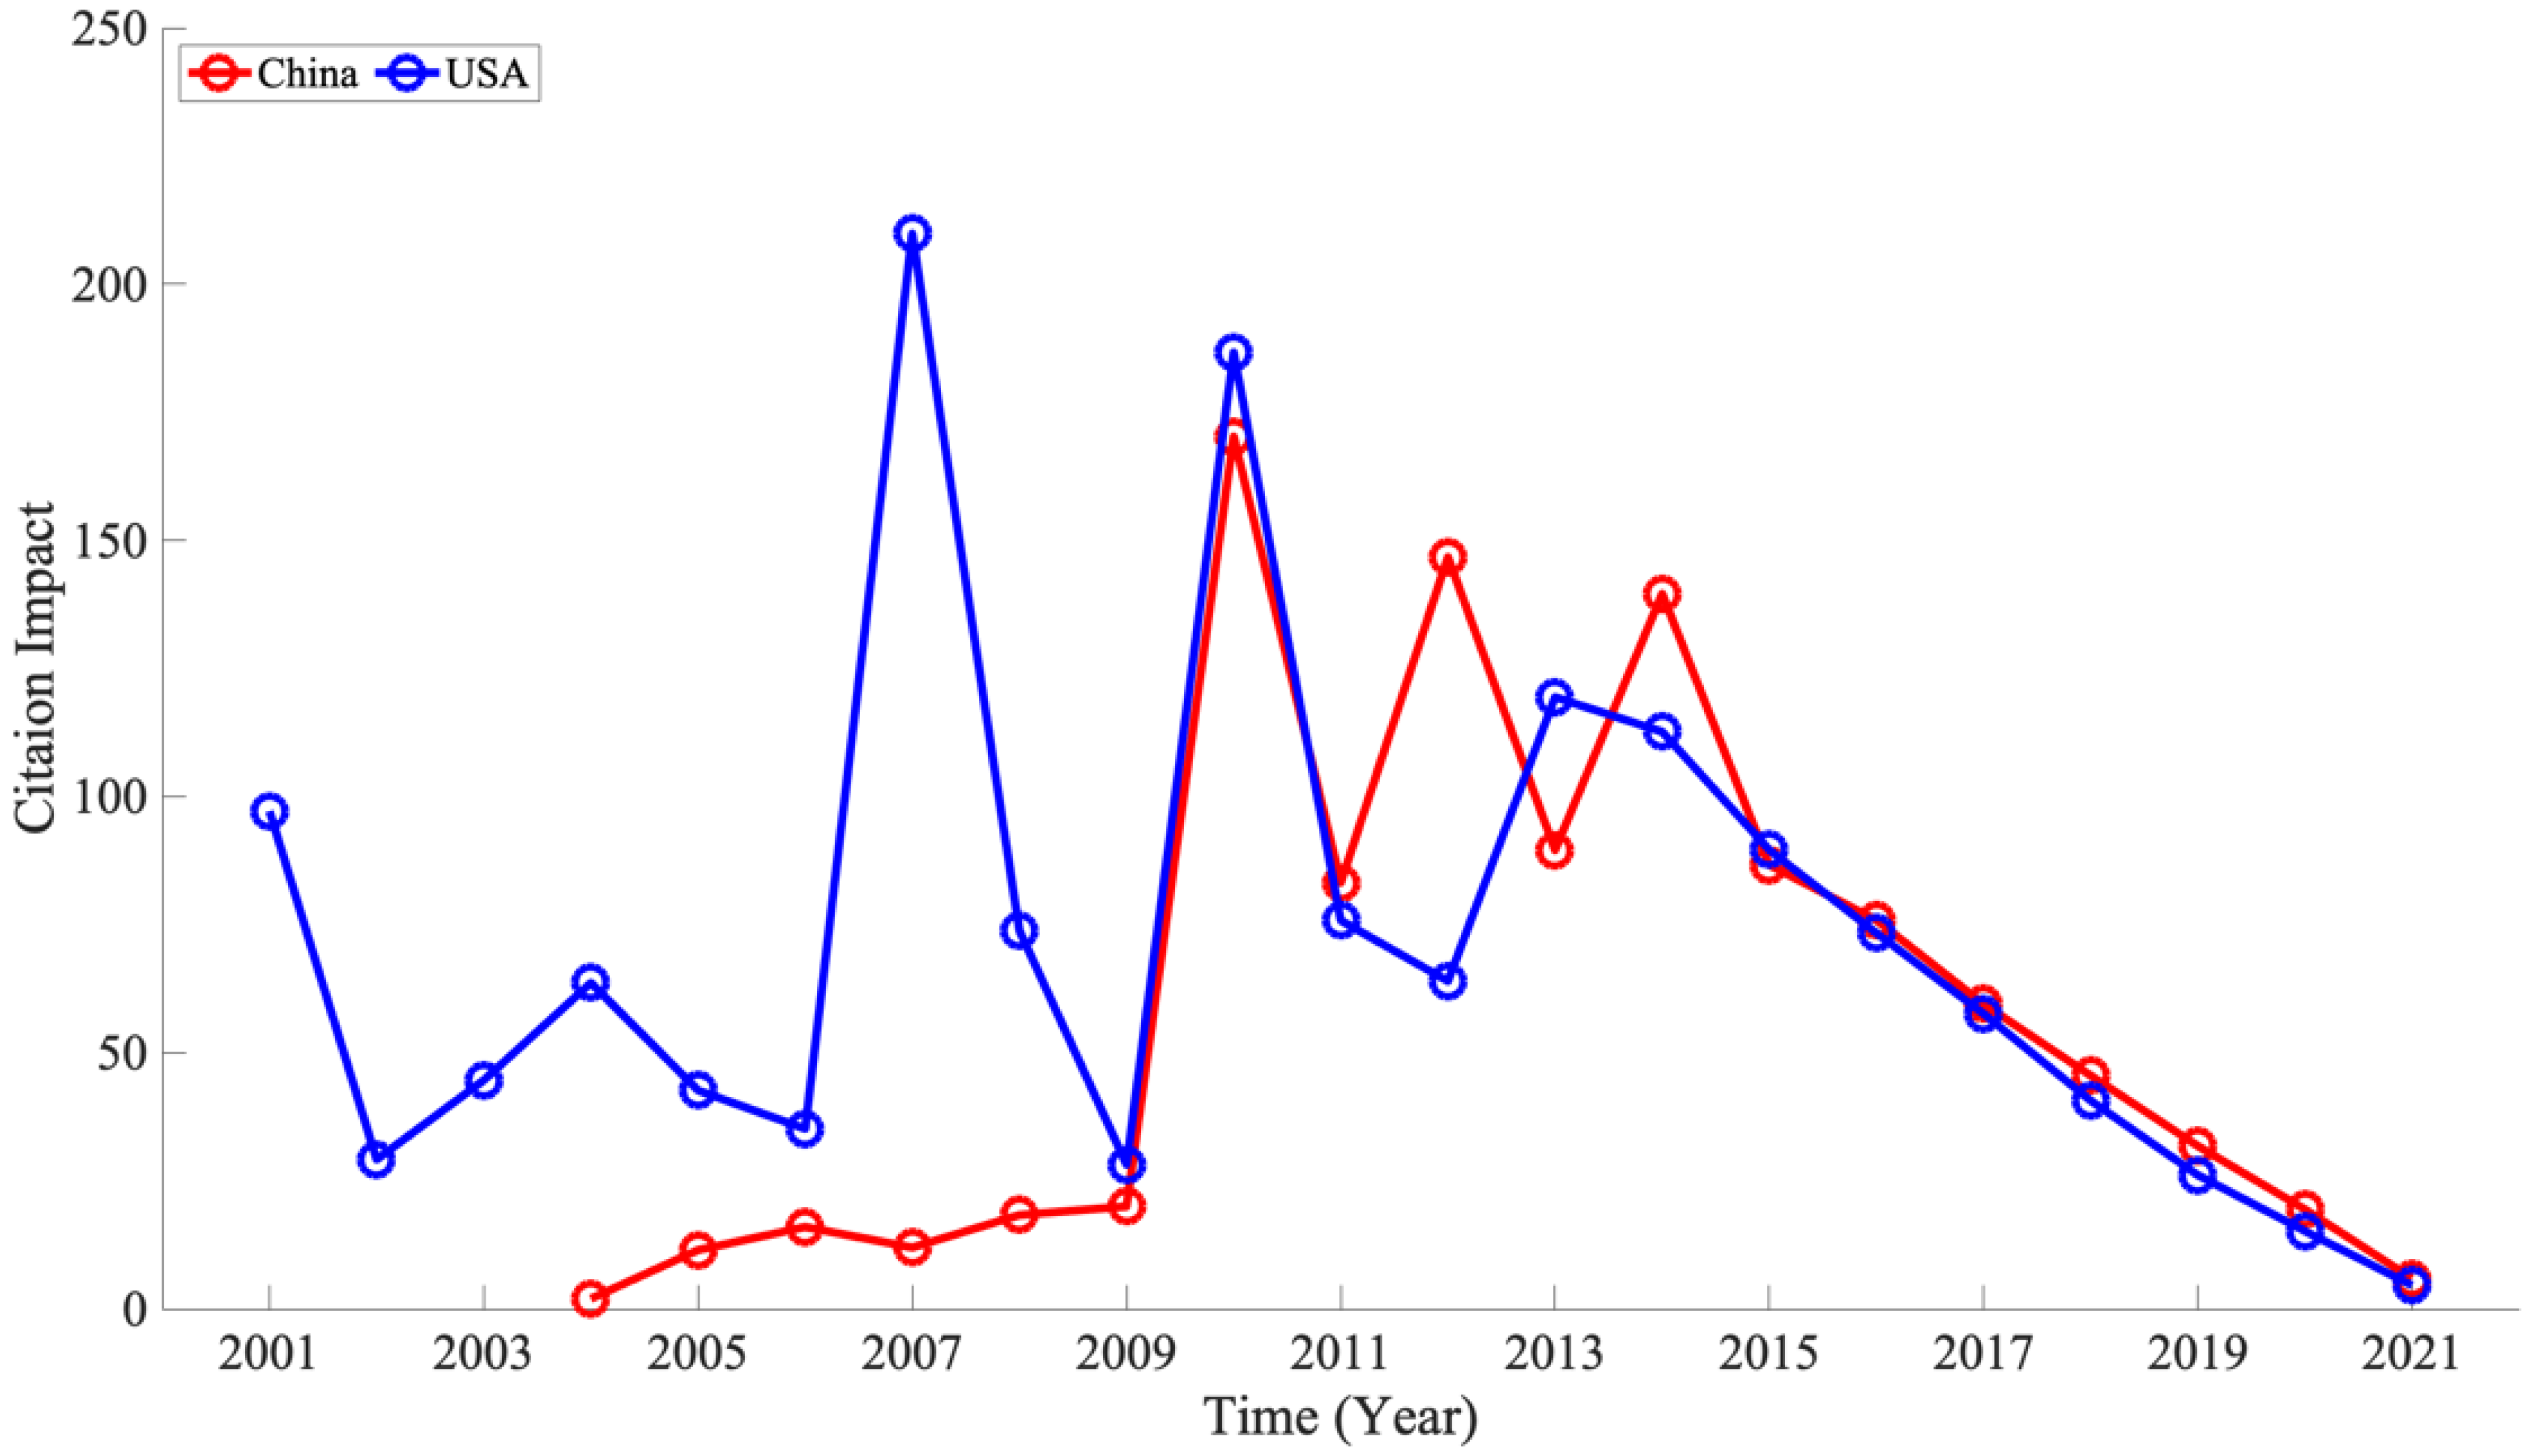
We examined the centrality (i.e., importance) of both countries in their networks within the co-authorship network (Appendix A.3 to determine the roles of China and the USA in this research domain. The USA ranked the highest among all centrality measures. China ranked next in degree centrality and closeness centrality, but in betweenness centrality, China ranked 5th, a gap from the USA’s result. In the co-authorship network, the centrality measures of the USA and China remained the same, or the USA outranked China in some indices, indicating that the USA is central in this network, despite the difference in the number of papers. This result was also reflected in the ratio of citations per literature in both countries (citation impact) (Figure 8, Appendix A.2). The citation impact in both countries also did not differ significantly between China and the USA, contrary to the rapid increase in the number of publications in China in recent years. Although an effect of the calculation based on single year to capture recent increase and a time period after the appearance of a publication (often referred as citation window) should be considered [52], of course, recent trend of citation impact suggests qualitative difference of wearable device research between China and USA.
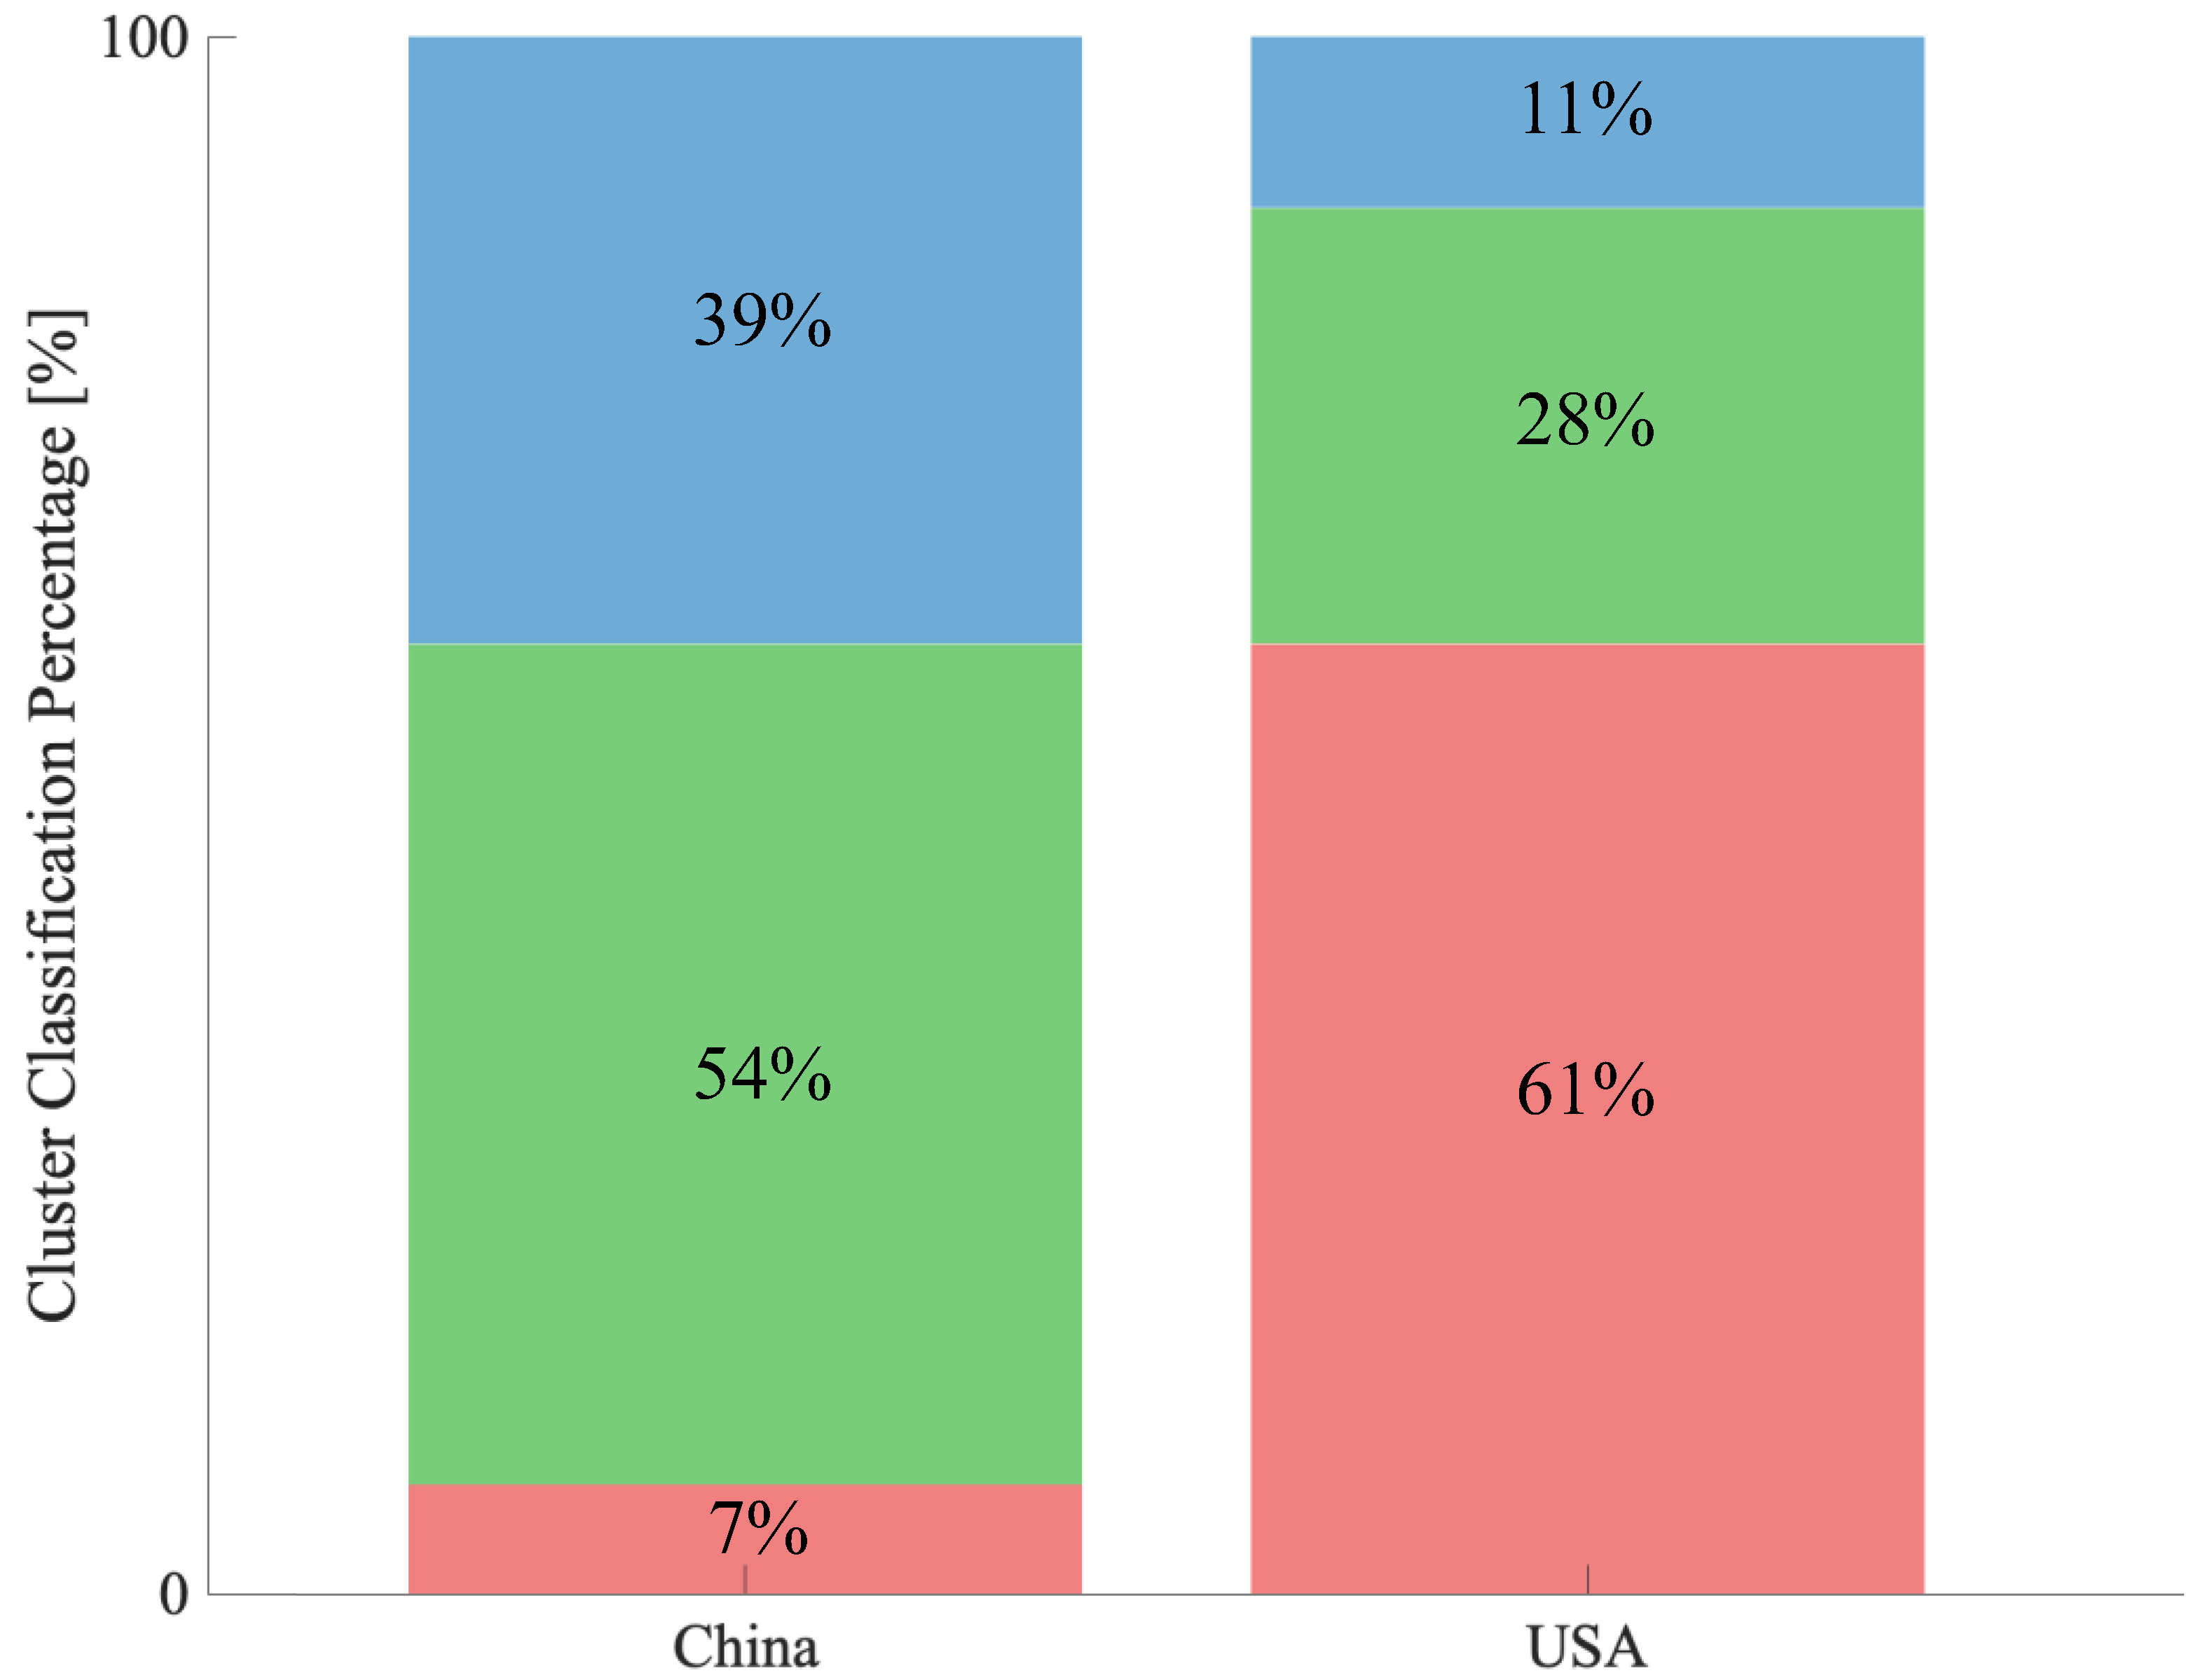
We analysed whether the author keywords used in the literature in China and the USA could be classified as clusters in the co-occurrence network (Figure 6) as of 2022 (Figure 9). In China, keywords belonging to cluster 2 predominated, followed by cluster 3, and keywords belonging to cluster 1 appeared the least (cluster 1: 7%, cluster 2: 54%, cluster 3: 39%). However, USA was dominated by keywords belonging to cluster 1, followed by cluster 2 and then cluster 3 (cluster 1: 61%, cluster 2: 28%, cluster 3: 11%).
Appendix A.4 shows the top 10 most-cited publications in China and the USA for the period 2001–2021. The top 10 cited publications in China were all related to materials and device research and were in the basic research domains of clusters 2 and 3 when classified according to the cluster classification.
On the other hand, in the case of the USA, in addition to basic research domains such as clusters 2 and 3, as in China, there were also some citations in the applied research domain (i.e., cluster 1) related to the utilisation of wearable devices, such as Pantelopoulos et al. [53] and Son, D. et al. [54]. The number of citations in the literature on the use of wearable devices is also presented.

4. Discussion

This study analysed articles in the research domain related to “Wearable Device” using bibliometric analysis. Research related to wearable devices has increased every year since 2001, with a marked increase after 2014. China and the United States were the largest contributors to wearable device research. In general, in many research domains, the country with the highest contribution is the United States. However, in the wearable device research domain, the situation is reversed, with China making the largest contribution, followed by the United States. However, when the centrality measure of the co-authorship network in the research domain was examined, it was higher in the USA than in China in terms of the number of papers, indicating that the USA constitutes the centre of the network in the research domain. In addition, the citation impact of the two countries was at the same level, contrary to the difference in the number of papers published in recent years. These results suggest two possible cases: “1. China has a low number of citations compared to the number of papers.” or “2. The USA has fewer papers than China but is often cited.”
However, comparing the cluster distribution of author keywords between China and the USA suggests the possibility that this was due to the direction of research in both countries. Comparing the cluster distribution of keywords in China and the USA, the majority of keywords in the USA are in cluster 1, while cluster 1 is extremely rare in China, indicating that the characteristics of the two countries are exactly the opposite. Cluster 1 is related to applied research, and the research domains associated with it may be diverse. This result was also reflected in the centrality analysis. Comparing betweenness centrality, China dropped in rank to 5th place compared to the USA, which ranked 1st. Betweenness centrality measures how well a country is connected to more nodes, networks, and small network groups (also called communities). In other words, the USA was shown to be connected to more communities (sectors) than China. These circumstances suggest that China’s citation impact may have been at the same level as that of the USA, contrary to the difference in the number of papers, and may reflect the different orientations toward research in the two countries.
It is also possible that the public is more interested in applied research and less interested in basic research, such as that related to clusters 2 and 3. Similar previous studies have reported that wearable-technology-related research is concentrated in domains such as health [30,55,56]. This is synonymous with the fact that research related to cluster 1 in this study is thriving but may be the result of trends or keywords cut by some countries, such as the USA. In research domains related to wearable technology, the literature related to medicine and engineering contributed the most to this research domain, with a particular focus on healthcare, including rehabilitation and disability [57]. The cluster classification in this study also confirmed both applied and basic research, and in cluster 1, keywords such as “behaviour”, “health”, and “rehabilitation” were identified as the most common, which supports these reports. The introduction of wearable devices in the health and medical fields is expected to accelerate in the future [58]. However, further technological development is essential in the wearable-device research domain, not only in terms of applications.
For example, the improved performance of lithium-ion batteries will enable longer real-world operating times and longer periods of time for information transmission or monitoring. In addition, if sensors and elements can be made smaller and lighter while maintaining the same performance, the devices themselves may become smaller and lighter, enabling operation regardless of the age or location of use. In this research domain, where both basic and applied research are important, the difference in direction between China and the USA is a desirable outcome. In other words, typically through the application in the USA, outcomes derived from the use case of wearable devices in the real world can accelerate active knowledge transfer into the research field for innovative component to improve the wearable device performances, where China has superiority, vice versa.

5. Conclusions

The purpose of this study was to collect literature on the entire research domain surrounding wearable devices and objectively clarify the intellectual structure of this research domain using bibliometric analysis. As a result of co-occurrence analysis of research keywords, three clusters were identified and shown to be composed of applied research domain (Cluster 1) and basic research domain (Clusters 2 and 3). In addition, China (mainly basic research domain) and the USA (mainly applied research domain) were the leaders in this research from 2001–2022. Moreover, wearable device research, which has been difficult to understand due to its extensive coverage in various fields (e.g., chemistry, energy, nanotechnology, etc.), can now be classified into two major categories: applied research and basic research. This may enable a simpler explanation of this research domain. Research on wearable devices has increased every year since 2001 and is expected to continue to grow.
The introduction of wearable devices in the health and medical fields is expected to accelerate in the future [58]. However, further technological development is essential in the wearable-device research domain, not only in terms of applications. For example, the improved performance of lithium-ion batteries will enable longer real-world operating times and longer periods of time for information transmission or monitoring. In addition, if sensors and elements can be made smaller and lighter while maintaining the same performance, the devices themselves may become smaller and lighter, enabling operation regardless of the age or location of use (e.g., recent smart watches can measure body temperature, blood flow, blood pressure, and blood oxygen levels, but research is being conducted to measure blood sugar levels [59]). Thus, technological developments and breakthroughs from basic research can create new uses (applied research), and new applied research can motivate new basic research. Additionally, it will open up new markets. In this research domain, where both fundamentals and applications are important, the different directions of China and the USA are a desirable outcome in a mutually supportive manner.
We recognize the limitations in this study. In the cluster classification, we did not unify some author keywords for simplicity because we could judge meanings of each cluster without lemmatization. To conduct more precise analysis, however, preprocessing of author keywords, such as merging singular and plural keywords or setting some stopwords will be required. Furthermore, we did not analyze trends in this research area in terms of time. This is a problem with the tool used (VOSviewer is not suitable for analyzing from a time perspective. CiteSpace would be a better choice).
The results of this study will provide comprehensive visualization data, identifying developments and trends in this research domain. Additionally, it provides improvements for further in-depth understanding. However, specific technological developments and breakthroughs may change the research trends rapidly. It should be noted that the results of this study are current information.

6. Limitations

This study was limited to articles extracted from the Web of Science database using the keyword “Wearable Device”. Therefore, the results of this study are limited to relevant data. Thus, similar analyses using different databases may yield different results. We also recognise that the co-occurrence analysis and visualisation maps produced by the VOSviewer software have technical limitations.

Author Contributions

Author Contributions: Conceptualization, K.K. (Kota Kodama); methodology, I.K.; software, I.K.; validation, I.K.; formal analysis, I.K.; investigation, K.K. (Karin Kurata), S.S. and Y.L.; resources, K.K. (Kota Kodama), S.S.; data curation, I.K..; writing—original draft preparation, I.K.; writing—review and editing, K.K.(Kota Kodama), S.M., S.S. and Y.L.; visualization, I.K.; supervision, S.M. and K.K. (Kota Kodama); project administration, K.K. (Kota Kodama); funding acquisition, K.K. (Kota Kodama) All authors have read and agreed to the published version of the manuscript.

Funding

This work was supported by the Ministry of the Environment, Japan [grant number JPMEERF20193005, 2019]. The funding source had no role in the study design, data collection and analysis, decision to publish, or manuscript preparation.

Institutional Review Board Statement

Not applicable.

Informed Consent Statement

Not applicable.

Conflicts of Interest

The authors declare no conflict of interest.

Appendix A

Appendix A.1

Table A1. List of Related Abbreviations Associated with Papers Obtained from Web of Science.
AbbreviationDescription
ABAbstract
AFAuthor’s full name
AUAuthor’s name
BPBeginning page
BSSeries Subtitle
C1Author Affiliation
CRWorks Cited
DADate this report was generated (exported)
DEAuthor Keywords
DIDigital Object Identifier (DOI)
DTDocument type
EMEmail address
EPEnd page
ERIdentifier indicating the end of the record
FNFile name
GADocument Delivery Number
ISIssue
J929-character abbreviated form of publication name
JIISO publication name abbreviated form
LALanguage
NRNumber of references cited
PAPublisher’s address
PDDate of issue (month)
PGpage number
PIPlace of Publication
PTPublication type (J=Journal; B=Book; S=Series; P=Patent)
PUPublisher
PYPublication year
RPReprint request address
SCResearch Field
SNInternational Standard Serial Number (ISSN)
SOPublication name
TCNumber of citations in the Web of Science Core Collection
TIDocument title
U1Number of times used (last 180 days)
U2Number of times used (since 2013)
UTAccession Number
VLVolume
VRVersion number
WCWeb of Science field
WEType of Citation Index
Z9Total number of citations

Appendix A.2

Table A2. List of China and USA Publications and Citation Impact.
YearChinaUSA
PublicationCitation ImpactPublicationCitation Impact
2001--1397.15
2002--629.17
2003--1444.64
200412.001163.64
2005211.501242.67
2006216.001335.15
2007112.0013209.85
2008318.332073.85
2009220.001828.17
20108170.2532186.66
20111183.183375.82
201211146.734163.98
20133389.5555119.40
201486139.5874112.65
201517186.6417889.58
201630975.8929673.36
201756359.5345457.63
201885245.5753940.67
2019120931.8174626.13
2020150019.4482615.21
202119745.968664.61

Appendix A.3

Table A3. List of Top 10 Centrality Measures, 2001–2021.
Degree CentralityBetweenness CentralityCloseness Centrality
RankScoreCountryRankScoreCountryRankScoreCountry
168USA1207.78USA10.01042USA
266China2166.06Italy20.01020China
365England3159.53England30.01010England
459Italy4152.16Spain40.00952Italy
559Spain5146.70China50.00952Spain
658Germany6105.94France60.00943Germany
757France789.85South Korea70.00935France
857India888.59Germany80.00935India
956South Korea986.97Saudi Arabia90.00926South Korea
1054Saudi Arabia1086.45India100.00909Saudi Arabia

Appendix A.4

Table A4. Top 10 Most Cited Papers in China and USA, 2001–2021.
CountryAuthorTitleSourceYearNumber of CitationReferences
ChinaLing, Zheng et al.Flexible and conductive MXene films and nanocomposites with high capacitanceProceedings of the National Academy of Sciences of the United States of America, 111(47), 16676–1668120141118[60]
Meng, Chuizhou et al.Highly Flexible and All-Solid-State Paper like Polymer SupercapacitorsNano Letters, 10(10), 4025–40312010998[61]
Wang, XW; Gu, Y; Zhang, TSilk-Molded Flexible, Ultrasensitive, and Highly Stable Electronic Skin for Monitoring Human Physiological SignalsAdvanced Materials, 26(9), 1336–13422014982[62]
Kou, Liang et al.Coaxial wet-spun yarn supercapacitors for high-energy density and safe wearable electronicsNature Communications, 5, 37542014856[63]
Pu, Xiong et al.Ultrastretchable, transparent triboelectric nanogenerator as electronic skin for biomechanical energy harvesting and tactile sensingScience Advances, 3(5), e17000152017696[64]
Meng, Fanlu et al.In Situ Coupling of Strung Co4N and Intertwined N-C Fibers toward Free-Standing Bifunctional Cathode for Robust, Efficient, and Flexible Zn Air-BatteriesJournal of the American Chemical Society, 138(32), 10226–102312016674[65]
Pelaz, Beatriz et al.Diverse Applications of NanomedicineACS Nano, 11(3), 2313–23812017655[66]
Koh, Ahyeon et al.A soft, wearable microfluidic device for the capture, storage, and colorimetric sensing of sweatScience Translational Medicine, 8(366), 366ral652016612[67]
Pu, Xiong et al.Wearable Self-Charging Power Textile Based on Flexible Yarn Supercapacitors and Fabric NanogeneratorsAdvanced Materials, 28(1), 982016572[68]
Lei, Zhouyue et al.A Bioinspired Mineral Hydrogel as a Self-Healable, Mechanically Adaptable Ionic Skin for Highly Sensitive Pressure SensingAdvanced Materials, 29(22), 17003212017572[69]
USAGao, Wei et al.Fully integrated wearable sensor arrays for multiplexed in situ perspiration analysisNature, 529(7587), 50920162367[7]
Lara, Oscar D. and Labrador, Miguel A.A Survey on Human Activity Recognition using Wearable SensorsIEE Communications Surveys and Tutorials, 15(3), 1192–120920131308[70]
Hu, Liangbing et al.Stretchable, Porous, and Conductive Energy TextilesNano Letters, 10(2), 708–71420101244[71]
Pantelopoulos, Alexandros and Bourbakis, Nikolaos G.A Survey on Wearable Sensor-Based Systems for Health Monitoring and PrognosisIEEE Transactions on Systems Man and Cybernetics Part C-Applications and Reviews, 40(1), 1–1220101233[53]
Ling, Zheng et al.Flexible and conductive MXene films and nanocomposites with high capacitanceProceedings of the National Academy of Sciences of the United States of America, 111(47), 16676–1668120141147[60]
Son, Donghee et al.Multifunctional wearable devices for diagnosis and therapy of movement disordersNature Nanotechnology, 9(5), 397–4042014998[54]
Lee, HyunjaeA graphene-based electrochemical device with thermoresponsive microneedles for diabetes monitoring and therapyNature Nanotechnology, 11(6), 5662016970[72]
Shin, Seong Sik et al.Colloidally prepared La-doped BaSnO3 electrodes for efficient, photostable perovskite solar cellsScience, 356(6334), 167–1712017820[73]
Dickey, Michael D.Stretchable and Soft Electronics using Liquid MetalsAdvanced Materials, 29(27), 16064252017795[74]
McAlpine, Michael C.Highly ordered nanowire arrays on plastic substrates for ultrasensitive flexible chemical sensorsNature Materials, 6(5), 379–3842007789[75]

References

  1. Ometov, A.; Shubina, V.; Klus, L.; Skibińska, J.; Saafi, S.; Pascacio, P.; Flueratoru, L.; Gaibor, D.Q.; Chukhno, N.; Chukhno, O.; et al. A survey on wearable technology: History, state-of-the-art and current challenges. Comput. Netw. 2021, 193, 108074. [Google Scholar] [CrossRef]
  2. Mordor Intelligence, GROWTH: Smart Wearable Market, Trends COVID-19 Impact, and Forecasts (2022–2027). Available online: https://www.mordorintelligence.com/industry-reports/smart-wearables-market (accessed on 10 October 2022).
  3. International Data Corporation. Worldwide Quarterly Wearable Device Tracker. Volume 2022. Available online: https://www.idc.com/getdoc.jsp?containerId=IDC_P31315 (accessed on 10 October 2022).
  4. Reportlinker.com. Global Wearable Technology Market 2022–2026. Available online: https://www.reportlinker.com/p05849727/Global-Wearable-Technology-Market.html (accessed on 10 October 2022).
  5. Vandrico. The Wearable Database. Available online: https://vandrico.com/wearables.html (accessed on 10 October 2022).
  6. Katori, M.; Shi, S.; Ode, K.L.; Tomita, Y. The 103,200-arm acceleration dataset in the UK Biobank revealed a landscape of human sleep phenotypes. Proc. Natl. Acad. Sci. USA 2022, 119, e2116729119. [Google Scholar] [CrossRef]
  7. Gao, W.; Emaminejad, S.; Nyein, H.Y.Y.; Challa, S.; Chen, K.; Peck, A.; Fahad, H.M.; Ota, H.; Shiraki, H.; Kiriya, D.; et al. Fully integrated wearable sensor arrays for multiplexed in situ perspiration analysis. Nature 2016, 529, 509. [Google Scholar] [CrossRef] [Green Version]
  8. Ho, W.T.; Yang, Y.J.; Li, T.C. Accuracy of wrist-worn wearable devices for determining exercise intensity. Digit. Health 2022, 8, 20552076221124393. [Google Scholar] [CrossRef]
  9. Hewitt, B.; Deranek, K.; McLeod, A.; Gudi, A. Exercise motives impact on physical activities measured using wearable devices. Health Promot. Int. 2022, 37, daac071. [Google Scholar] [CrossRef]
  10. Imani, S.; Bandodkar, A.J.; Mohan, A.M.V.; Kumar, R.; Yu, S.F.; Wang, J.; Mercier, P.P. A wearable chemical-electrophysiological hybrid biosensing system for real-time health and fitness monitoring. Nat. Commun. 2016, 7, 11650. [Google Scholar] [CrossRef] [Green Version]
  11. Castaldo, R.; Montesinos, L.; Melillo, P.; James, C.; Pecchia, L. Ultra-short term HRV features as surrogates of short term HRV: A case study on mental stress detection in real life. BMC Med. Inform. Decis. Mak. 2019, 19, 12. [Google Scholar] [CrossRef] [PubMed] [Green Version]
  12. Choi, Y.; Jeon, Y.M.; Wang, L.; Kim, K. A Biological Signal-Based Stress Monitoring Framework for Children Using Wearable Devices. Sensors 2017, 17, 1936. [Google Scholar] [CrossRef] [PubMed] [Green Version]
  13. Valenza, G.; Citi, L.; Gentili, C.; Lanata, A.; Scilingo, E.P.; Barbieri, R. Characterization of Depressive States in Bipolar Patients Using Wearable Textile Technology and Instantaneous Heart Rate Variability Assessment. IEEE J. Biomed. Health Inform. 2015, 19, 263–274. [Google Scholar] [CrossRef]
  14. Hwang, S.; Lee, S. Wristband-type wearable health devices to measure construction workers’ physical demands. Autom. Constr. 2017, 83, 330–340. [Google Scholar] [CrossRef]
  15. Lin, C.C.; Yang, C.Y.; Zhou, Z.H.; Wu, S.C. Intelligent health monitoring system based on smart clothing. Int. J. Distrib. Sens. Netw. 2018, 14, 1550147718794318. [Google Scholar] [CrossRef] [Green Version]
  16. Cheng, T.; Teizer, J. Real-time resource location data collection and visualization technology for construction safety and activity monitoring applications. Autom. Constr. 2013, 34, 3–15. [Google Scholar] [CrossRef]
  17. Nath, N.D.; Chaspari, T.; Behzadan, A.H. Automated ergonomic risk monitoring using body-mounted sensors and machine learning. Adv. Eng. Inform. 2018, 38, 514–526. [Google Scholar] [CrossRef]
  18. Jebelli, H.; Choi, B.; Lee, S. Application of Wearable Biosensors to Construction Sites. II: Assessing Workers’ Physical Demand. J. Constr. Eng. Manag. 2019, 145, 04019080. [Google Scholar] [CrossRef]
  19. Ryu, J.; Seo, J.; Jebelli, H.; Lee, S. Automated Action Recognition Using an Accelerometer-Embedded Wristband-Type Activity Tracker. J. Constr. Eng. Manag. 2019, 145, 04018114. [Google Scholar] [CrossRef]
  20. Jebelli, H.; Choi, B.; Kim, H.; Lee, S. Feasibility study of a wristband-type wearable sensor to understand construction workers’ physical and mental status. In Proceedings of the Construction Research Congress, Construction Information Technology, New Orleans, LA, USA, 2–4 April 2018; pp. 267–377. [Google Scholar]
  21. Hashiguchi, N.; Kodama, K.; Lim, Y.; Che, C.; Kuroishi, S.; Miyazaki, Y.; Kobayashi, T.; Kitahara, S.; Tateyama, K. Practical judgment of workload based on physical activity, work conditions, and worker’s age in construction site. Sensors 2020, 20, 3786. [Google Scholar] [CrossRef]
  22. Hashiguchi, N.; Cao, J.F.; Lim, Y.; Kuroishi, S.; Miyazaki, Y.; Kitahara, S.; Sengoku, S.; Matsubayashi, K.; Kodama, K. Psychological Effects of Heart Rate and Physical Vibration on the Operation of Construction Machines: Experimental Study. JMIR Mhealth Uhealth 2021, 9, e31637. [Google Scholar] [CrossRef] [PubMed]
  23. Lindberg, C.M.; Srinivasan, K.; Gilligan, B.; Razjouyan, J.; Lee, H.; Najafi, B.; Canada, K.J.; Mehl, M.R.; Currim, F.; Ram, S.; et al. Effects of office workstation type on physical activity and stress. Occup. Environ. Med. 2018, 75, 689–695. [Google Scholar] [CrossRef] [Green Version]
  24. Itsuki, K.; Nobuki, H.; Jianfei, C.; Masanori, T.; Soichiro, O.; Seiji, H.; Kota, K. Human resource management using biometric data of waste treatment facility workers. Environ. Sci. 2022, 35, 304–309. [Google Scholar] [CrossRef]
  25. Nath, N.D.; Akhavian, R.; Behzadan, A.H. Ergonomic analysis of construction worker’s body postures using wearable mobile sensors. Appl. Ergon. 2017, 62, 107–117. [Google Scholar] [CrossRef]
  26. Park, J.; Kim, K.; Cho, Y.K. Framework of Automated Construction-Safety Monitoring Using Cloud-Enabled BIM and BLE Mobile Tracking Sensors. J. Constr. Eng. Manag. 2017, 143, 05016019. [Google Scholar] [CrossRef]
  27. Ahn, C.R.; Lee, S.; Sun, C.; Jebelli, H.; Yang, K.; Choi, B. Wearable Sensing Technology Applications in Construction Safety and Health. J. Constr. Eng. Manag. 2019, 145, 03119007. [Google Scholar] [CrossRef]
  28. Jebelli, H.; Hwang, S.; Lee, S. EEG-based workers’ stress recognition at construction sites. Autom. Constr. 2018, 93, 315–324. [Google Scholar] [CrossRef]
  29. Antwi-Afari, M.F.; Li, H. Fall risk assessment of construction workers based on biomechanical gait stability parameters using wearable insole pressure system. Adv. Eng. Inform. 2018, 38, 683–694. [Google Scholar] [CrossRef]
  30. Lu, L.; Zhang, J.Y.; Xie, Y.; Gao, F.; Xu, S.; Wu, X.H.; Ye, Z.W. Wearable health devices in health care: Narrative systematic review. JMIR mHealth uHealth 2020, 8, e18907. [Google Scholar] [CrossRef] [PubMed]
  31. Gao, R.; Mu, B.W.; Lyu, S.A.; Wang, H.; Yi, C.D. Review of the application of wearable devices in construction safety: A bibliometric analysis from 2005 to 2021. Buildings 2022, 12, 344. [Google Scholar] [CrossRef]
  32. Dehghani, M.; Kim, K.J. Past and present research on wearable technologies: Bibliometric and Cluster analyses of published research from 2000 to 2016. Int. J. Innov. Technol. Manag. 2019, 16, 1950007. [Google Scholar] [CrossRef]
  33. Pitchard, A. Statistical bibliography or bibliometrics. J. Doc. 1969, 24, 348–349. [Google Scholar]
  34. Broadus, R.N. Early approaches to bibliometrics. J. Am. Soc. Inf. Sci. 1987, 38, 127–129. [Google Scholar] [CrossRef]
  35. Hood, W.W.; Wilson, C.S. The literature of bibliometrics, scientometrics, and informetrics. Scientometrics 2021, 52, 291–314. [Google Scholar] [CrossRef]
  36. Sarajchi, M.; Al-Hares, M.K.; Sirlantzis, K. Wearable Lower-Limb Exoskeleton for Children with Cerebral Palsy: A Systematic Review of Mechanical Design, Actuation Type, Control Strategy, and Clinical Evaluation. IEEE Trans. Neural Syst. Rehabil. Eng. 2021, 29, 2695–2720. [Google Scholar] [CrossRef]
  37. Donthu, N.; Kumar, S.; Mukherjee, D.; Pandey, N.; Lim, W.M. How to conduct a bibliometric analysis: An overview and guidelines. J. Bus. Res. 2021, 133, 285–296. [Google Scholar] [CrossRef]
  38. VOSviewer. Available online: https://www.vosviewer.com (accessed on 10 October 2022).
  39. Van Eck, N.J.; Waltman, L. Software survey: VOSviewer, a computer program for bibliometric mapping. Scientometrics 2010, 84, 523–538. [Google Scholar] [CrossRef] [Green Version]
  40. Chen, C.M. CiteSpace II: Detecting and visualizing emerging trends and transient patterns in scientific literature. J. Assoc. Inf. Sci. Technol. 2006, 57, 359–377. [Google Scholar] [CrossRef] [Green Version]
  41. Garfield, E. Historiographic mapping of knowledge domains literature. J. Inf. Sci. 2004, 30, 119–145. [Google Scholar] [CrossRef]
  42. Garfield, E. From the science of science to Scientometrics visualizing the history of science with HistCite software. J. Inf. 2009, 3, 173–179. [Google Scholar] [CrossRef] [Green Version]
  43. Waltman, L.; van Eck, N.J.; Noyons, E.C.M. A unified approach to mapping and Clustering of bibliometric networks. J. Inf. 2010, 4, 629–635. [Google Scholar] [CrossRef] [Green Version]
  44. Waltman, L.; van Eck, N.J. A smart local moving algorithm for large-scale modularity-based community detection. Eur. Phys. J. B 2013, 86, 471. [Google Scholar] [CrossRef]
  45. Wang, M.Y.; Chai, L.H. Three new bibliometric indicators/approaches derived from keyword analysis. Scientometrics 2018, 116, 721–750. [Google Scholar] [CrossRef]
  46. Bayer, A.E.; Smart, J.C.; McLaughlin, G.W. Mapping intellectual structure of a scientific subfield through author cocitations. J Am. Soc. Inf. Sci. 1990, 41, 444–452. [Google Scholar] [CrossRef]
  47. Latora, V.; Marchiori, M. A measure of centrality based on network efficiency. New J. Phys. 2007, 9, 188. [Google Scholar] [CrossRef]
  48. Das, K.; Samanta, S.; Pal, M. Study on centrality measures in social networks: A survey. Soc. Netw. Anal. Min. 2018, 8, 13. [Google Scholar] [CrossRef]
  49. Freeman, L.C. A set of measures of centrality based on betweenness. Sociometry 1977, 40, 35–41. [Google Scholar] [CrossRef]
  50. Sabidussi, G. The centrality index of a graph. Psychometrika 1966, 31, 581–603. [Google Scholar] [CrossRef]
  51. Freeman, L.C. Centrality in social networks conceptual clarification. Soc. Netw. 1978, 1, 215–239. [Google Scholar] [CrossRef] [Green Version]
  52. Waltman, L. A review of the literature on citation impact indicators. J. Informetr. 2016, 10, 365–391. [Google Scholar]
  53. Pantelopoulos, A.; Bourbakis, N.G. A Survey on Wearable Sensor-Based Systems for Health Monitoring and Prognosis. IEEE Trans. Syst. Man Cybern. Part C 2010, 40, 1–12. [Google Scholar] [CrossRef] [Green Version]
  54. Son, D.; Lee, J.; Qiao, S.; Ghaffari, R.; Kim, J.; Lee, J.E.; Song, C.; Kim, S.J.; Lee, D.J.; Jun, S.W.; et al. Multifunctional wearable devices for diagnosis and therapy of movement disorders. Nat. Nanotechnol. 2014, 9, 397–404. [Google Scholar] [CrossRef]
  55. Chan, M.; Estève, D.; Fourniols, J.Y.; Escriba, C.; Campo, E. Smart wearable systems: Current status and future challenges. Artif. Intell. Med. 2012, 56, 137–156. [Google Scholar] [CrossRef]
  56. Sultan, N. Reflective thoughts on the potential and challenges of wearable technology for healthcare provision and medical education. Int. J. Inf. Manag. 2015, 35, 521–526. [Google Scholar] [CrossRef]
  57. Dehghani, M. A bibliometric review of wearable technologies. In World Scientific Series in R&D Management; World Scientific Publishing: Singapore, 2020; pp. 3–34. [Google Scholar] [CrossRef]
  58. Thakkar, H.K.; Chowdhury, S.R.; Bhoi, A.K.; Barsocchi, P. Applications of wearable technologies in healthcare: An analytical study. In 5G IoT and Edge Computing for Smart Healthcare; Academic Press: Cambridge, MA, USA, 2020; pp. 279–299. [Google Scholar] [CrossRef]
  59. Chang, T.R.; Li, H.; Zhang, N.R.; Jiang, X.R.; Yu, X.G.; Yang, Q.D.; Jin, Z.Y.; Meng, H.; Chang, L.Q. Highly integrated watch for noninvasive continual glucose monitoring. Microsyst. Nanoeng. 2022, 8, 25. [Google Scholar] [CrossRef] [PubMed]
  60. Ling, Z.; Ren, C.E.; Zhao, M.Q.; Yang, J.; Giammarco, J.M.; Qiu, J.S.; Barsoum, M.W.; Gogotsi, Y. Flexible and conductive MXene films and nanocomposites with high capacitance. Proc. Natl. Acad. Sci. USA 2014, 111, 16676–16681. [Google Scholar] [CrossRef] [PubMed] [Green Version]
  61. Meng, C.Z.; Liu, C.H.; Chen, L.Z.; Hu, C.H.; Fan, S.S. Highly Flexible and All-Solid-State Paper like Polymer Supercapacitors. Nano Lett. 2010, 10, 4025–4031. [Google Scholar] [CrossRef]
  62. Wang, X.W.; Gu, Y.; Xiong, Z.P.; Cui, Z.; Zhang, T. Silk-Molded Flexible, Ultrasensitive, and Highly Stable Electronic Skin for Monitoring Human Physiological Signals. Adv. Mater. 2014, 26, 1336–1342. [Google Scholar] [CrossRef] [PubMed]
  63. Kou, L.; Huang, T.Q.; Zheng, B.N.; Han, Y.; Zhao, X.L.; Gopalsamy, K.; Sun, H.Y.; Gao, C. Coaxial wet-spun yarn supercapacitors for high-energy density and safe wearable electronics. Nat. Commun. 2014, 5, 3754. [Google Scholar] [CrossRef] [Green Version]
  64. Pu, X.; Liu, M.M.; Chen, X.Y.; Sun, J.M.; Du, C.H.; Zhang, Y.; Zhai, J.Y.; Hu, W.G.; Wang, Z.L. Ultrastretchable, transparent triboelectric nanogenerator as electronic skin for biomechanical energy harvesting and tactile sensing. Sci. Adv. 2017, 3, e1700015. [Google Scholar] [CrossRef]
  65. Meng, F.L.; Zhong, H.X.; Bao, D.; Yan, J.M.; Zhang, X.B. In Situ Coupling of Strung Co4N and Intertwined N-C Fibers toward Free-Standing Bifunctional Cathode for Robust, Efficient, and Flexible Zn Air-Batteries. J. Am. Chem. Soc. 2016, 138, 10226–10231. [Google Scholar] [CrossRef]
  66. Pelaz, B.; Alexiou, C.; Alvarez-Puebla, R.A.; Alves, F.; Andrews, A.M.; Ashraf, S.; Balogh, L.P.; Ballerini, L.; Bestetti, A.; Brendel, C.; et al. Diverse Applications of Nanomedicine. ACS Nano 2017, 11, 2313–2381. [Google Scholar] [CrossRef] [Green Version]
  67. Koh, A.; Kang, D.; Xue, Y.; Lee, S.; Pielak, R.M.; Kim, J.; Hwang, T.; Min, S.; Banks, A.; Bastien, P.; et al. A soft, wearable microfluidic device for the capture, storage, and colorimetric sensing of sweat. Sci. Transl. Med. 2016, 8, 366ra165. [Google Scholar] [CrossRef] [Green Version]
  68. Pu, X.; Li, L.X.; Liu, M.M.; Jiang, C.Y.; Du, C.H.; Zhao, Z.F.; Hu, W.G.; Wang, Z.L. Wearable Self-Charging Power Textile Based on Flexible Yarn Supercapacitors and Fabric Nanogenerators. Adv. Mater. 2016, 28, 98. [Google Scholar] [CrossRef] [PubMed]
  69. Lei, Z.Y.; Wang, Q.K.; Sun, S.T.; Zhu, W.C.; Wu, P.Y. A Bioinspired Mineral Hydrogel as a Self-Healable, Mechanically Adaptable Ionic Skin for Highly Sensitive Pressure Sensing. Adv. Mater. 2017, 29, 1700321. [Google Scholar] [CrossRef] [PubMed]
  70. Lara, O.D.; Labrador, M.A. A Survey on Human Activity Recognition using Wearable Sensors. IEEE Commun. Surv. Tutor. 2013, 15, 1192–1209. [Google Scholar] [CrossRef]
  71. Hu, L.; Pasta, M.; la Mantia, F.; Cui, L.; Jeong, S.; Deshazer, H.D.; Choi, J.W.; Han, S.M.; Cui, Y. Stretchable, Porous, and Conductive Energy Textiles. Nano Lett. 2010, 10, 708–714. [Google Scholar] [CrossRef] [PubMed] [Green Version]
  72. Lee, H.; Choi, T.K.; Lee, Y.B.; Cho, H.R.; Ghaffari, R.; Wang, L.; Choi, H.J.; Chung, T.D.; Lu, N.; Hyeon, T.; et al. A graphene-based electrochemical device with thermoresponsive microneedles for diabetes monitoring and therapy. Nat. Nanotechnol. 2016, 11, 566. [Google Scholar] [CrossRef] [PubMed]
  73. Yang, W.S.; Park, B.W.; Jung, E.H.; Jeon, N.J.; Kim, Y.C.; Lee, D.U.; Shin, S.S.; Seo, J.; Kim, E.K.; Noh, J.H.; et al. Colloidally prepared La-doped BaSnO3 electrodes for efficient, photostable perovskite solar cells. Science 2017, 356, 167–171. [Google Scholar] [CrossRef]
  74. Dickey, M.D. Stretchable and Soft Electronics using Liquid Metals. Adv. Mater. 2017, 29, 1606425. [Google Scholar] [CrossRef]
  75. McAlpine, M.C.; Ahmad, H.; Wang, D.W.; Heath, J.R. Highly ordered nanowire arrays on plastic substrates for ultrasensitive flexible chemical sensors. Nat. Mater. 2007, 6, 379–384. [Google Scholar] [CrossRef]
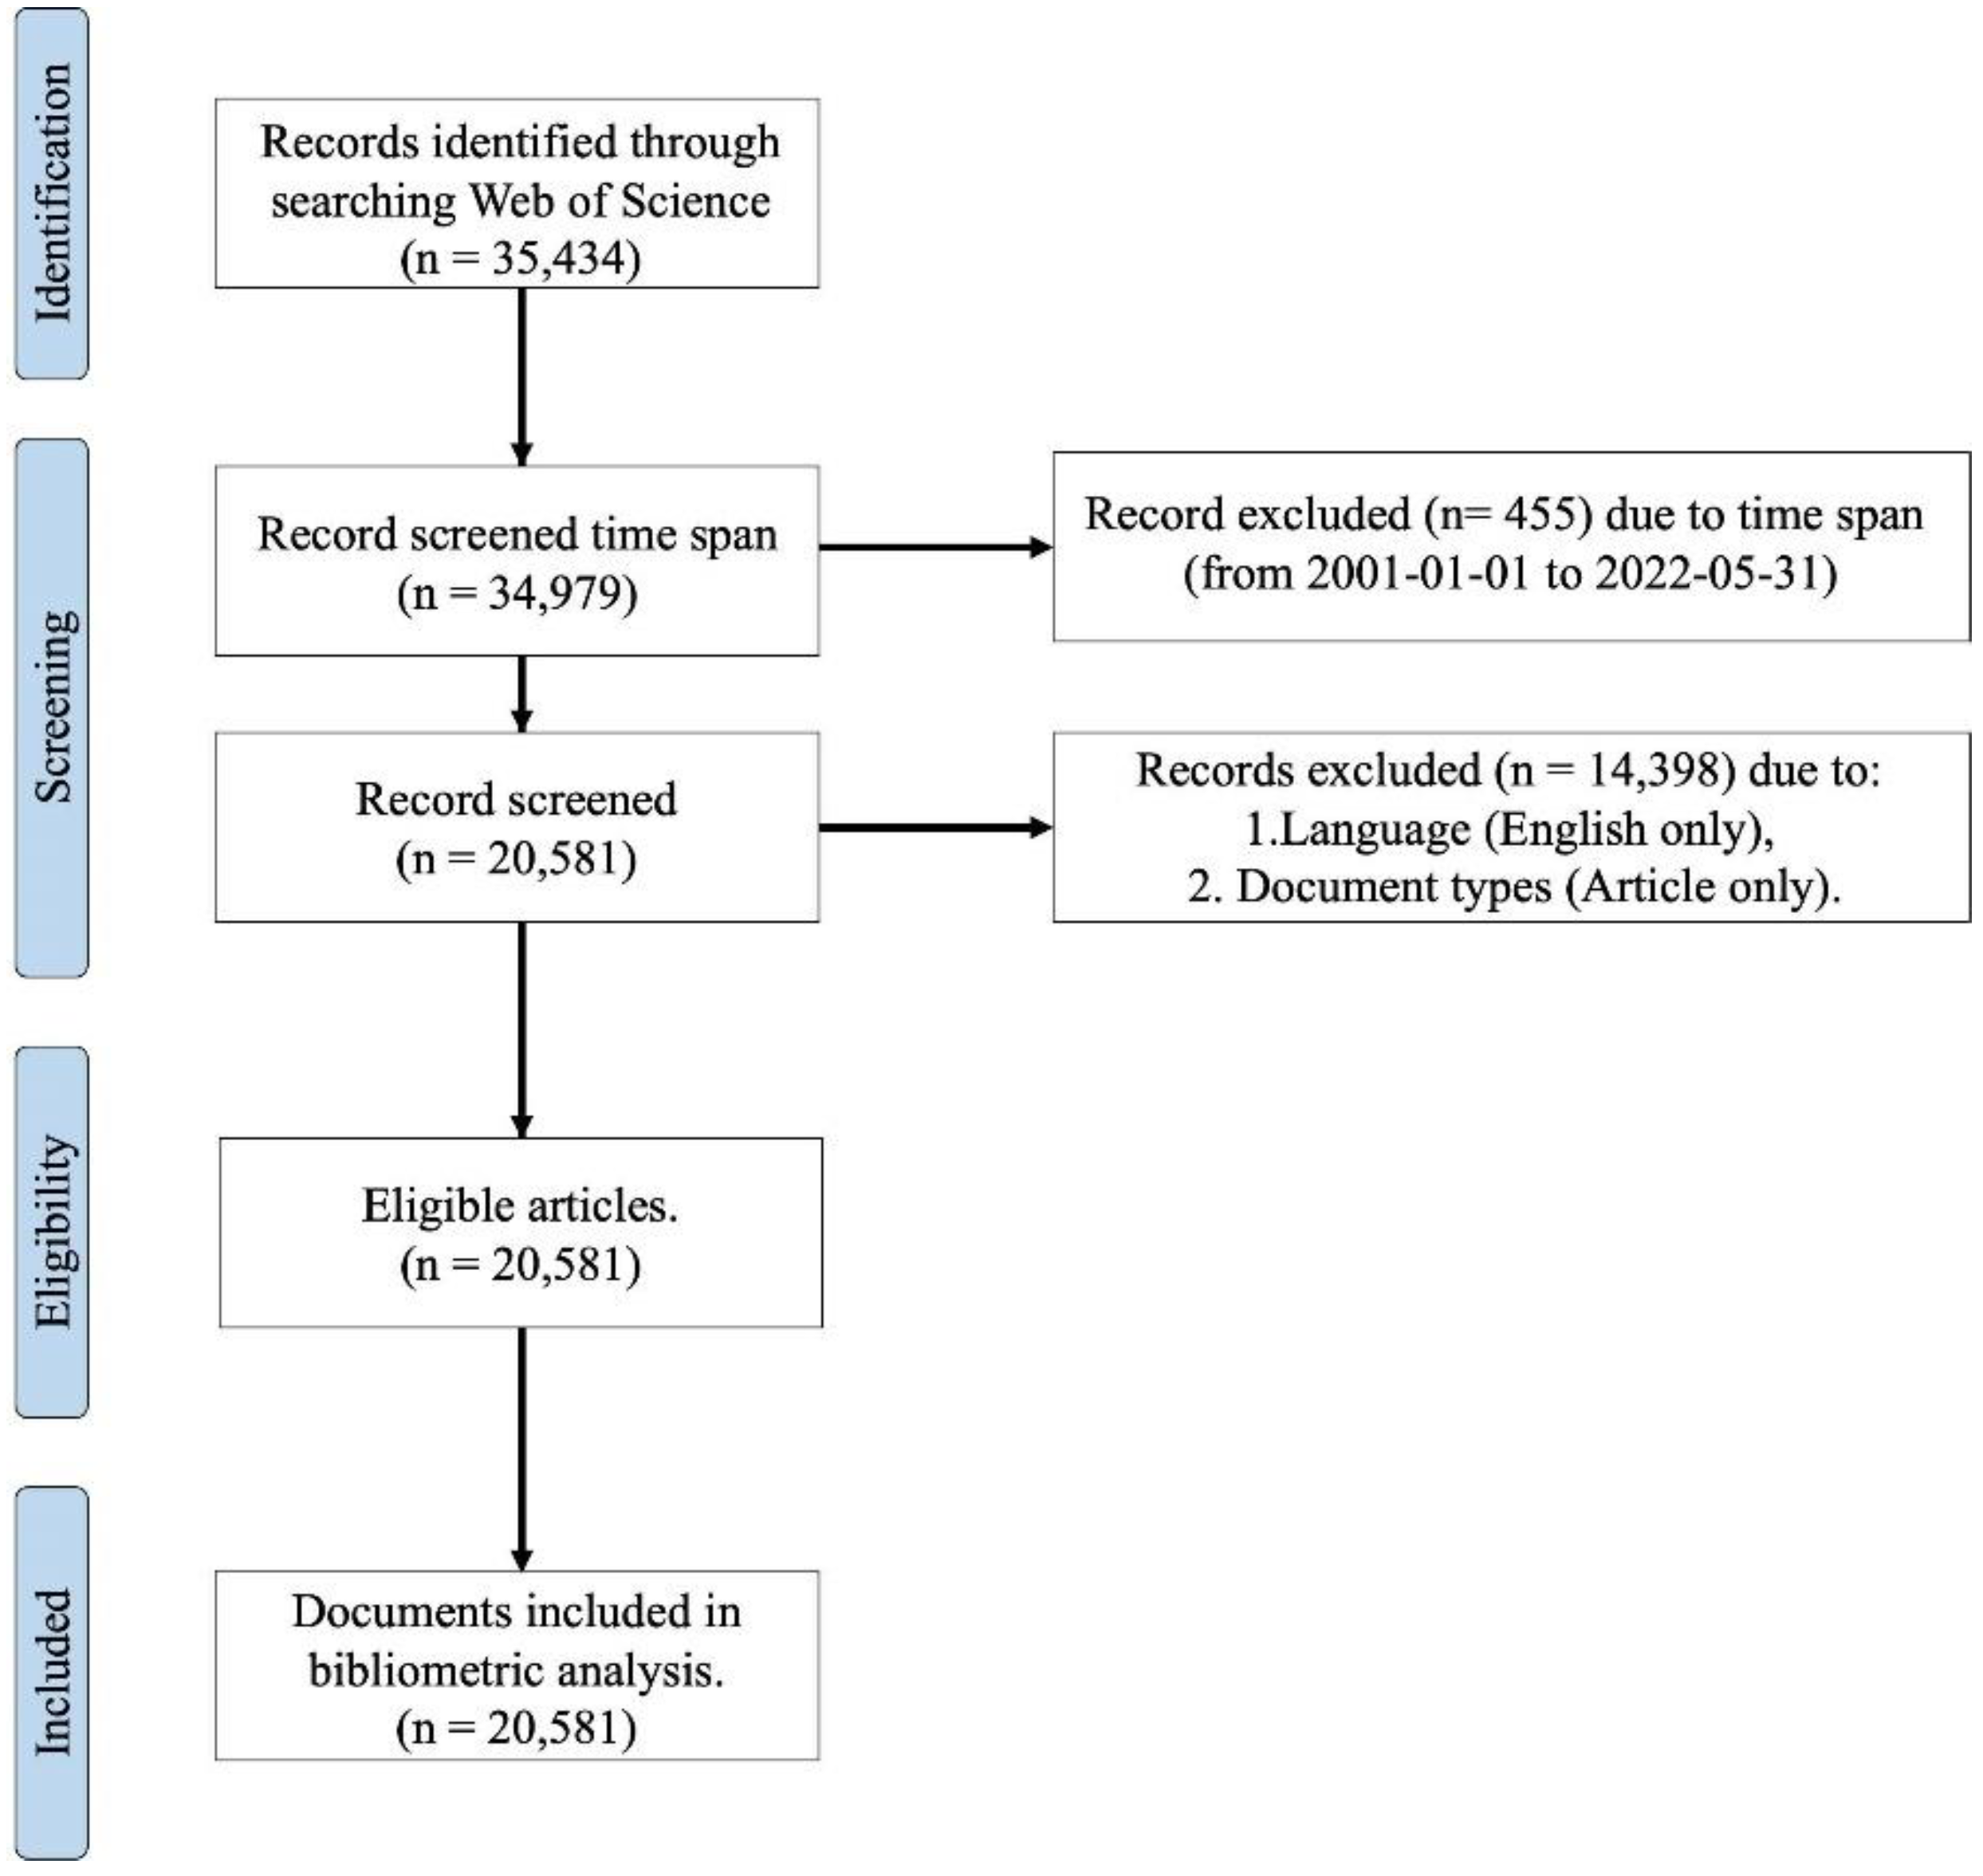
Figure 1. PRISMA flow diagram.
Ijerph 19 16427 g001
Figure 2. Temporal change of number of publications, 2001–2021. Solid bars are measured values and diagnal line bars (2022–2025) are estimated from a fourth polynomial regression.
Ijerph 19 16427 g002
Figure 3. Comparison of number of publications by country, 2001–2022.
Ijerph 19 16427 g003
Figure 4. Co-authorship networks in the Top 10 countries with the largest number of papers, 2001–2022.
Ijerph 19 16427 g004
Figure 5. Top 10 journals publishing research on wearable device, 2001–2022.
Ijerph 19 16427 g005
Figure 6. The co-occurrence network of the top 1000 keywords in wearable device research, 2001–2022.
Ijerph 19 16427 g006
Figure 7. Comparison of temporal changes in the number of papers published in the China and USA, 2001–2021. No data exist for China from 2001 to 2003, as no relevant papers were published.
Ijerph 19 16427 g007
Figure 8. Comparison of citation impact in the Peoples r china and USA, 2001–2021. No data exist for China from 2001 to 2003, as no relevant papers were published.
Ijerph 19 16427 g008
Figure 9. Cluster distribution map of author keywords used in China and USA, 2001–2021. The top 100 keywords with the highest number of co-occurrences among the author keywords are used (Red: cluster 1, Green: cluster 2, Blue: cluster 3).
Ijerph 19 16427 g009
Table 1. Top 30 co-occurrence keywords by cluster, 2001–2022.
RankCluster 1Cluster 2Cluster 3
KeywordWeightKeywordWeightKeywordWeight
1Design849Performance889Electrodes617
2Sensors815Devices794Graphene608
3Wearable devices798Sensor754High-performance536
4Wearable device754Fabrication653Flexible478
5System736Films589Oxide457
6Wearable728Skin587Arrays452
7Wearable sensors622Energy583Electrode442
8Behavior607Wearable electronics577Supercapacitors435
9Device595Pressure556Paper426
10Health515Electronics546Carbon404
11Systems512Transparent541Reduction404
12Model501Composite540Fiber402
13Technology497Carbon nanotubes520Reduced graphene oxide398
14Wearables469Nanoparticles514Nanowires392
15Machine learning468Flexible electronics493Supercapacitor385
16Challenges463Composites492Energy-storage384
17Wearable sensor445Stability488Nanosheets373
18Reliability443Temperature482Efficient372
19Monitoring431Film478Textiles365
20Management397Networks474Nanotubes362
21Wearable technology397Nanocomposites469Storage358
22Classification394Network439Polyaniline349
23Waling394Stain sensor431Nanostructures342
24Rehabilitation377Stain429Batteries322
25Physical-activity376Polymer423Flexibility312
26Recognition373Graphene oxide420Hybrid305
27Biomedical monitoring369Conductivity404Polypyrrole302
28Disease362Stain sensors404Conversion297
29Internet361Fibers402Energy storage294
30Accelerometer360Triboelectric nanogenerator400Capacitance293
Publisher’s Note: MDPI stays neutral with regard to jurisdictional claims in published maps and institutional affiliations.