
The Impact of Green Innovation on Enterprise Green Economic Efficiency

Abstract
:1. Introduction
2. Literature Analysis and Hypothesis
2.1. Literature Analysis
2.2. Theoretical Analysis and Hypothesis Development
3. Methodology
3.1. Samples and Data
3.2. Variable Definition and Research Model
3.2.1. Green Innovation
3.2.2. Green Economic Efficiency
3.2.3. Control Variables
4. Results
4.1. Descriptive Statistics
4.2. Green Innovation and Green Economic Efficiency
4.3. Robustness Test
4.3.1. Sample Selection Bias
4.3.2. Omitted Variable Problem
4.3.3. Self-Selection Bias
4.4. Further Analysis
4.4.1. Production Process Upgrade
4.4.2. Freedom of Technology Selection
4.4.3. Intensity of Market Competition
4.5. Extended Test
4.5.1. The Degree of Protection of Innovation Achievements
4.5.2. The Nature of the Production and Operation Activities of Enterprises
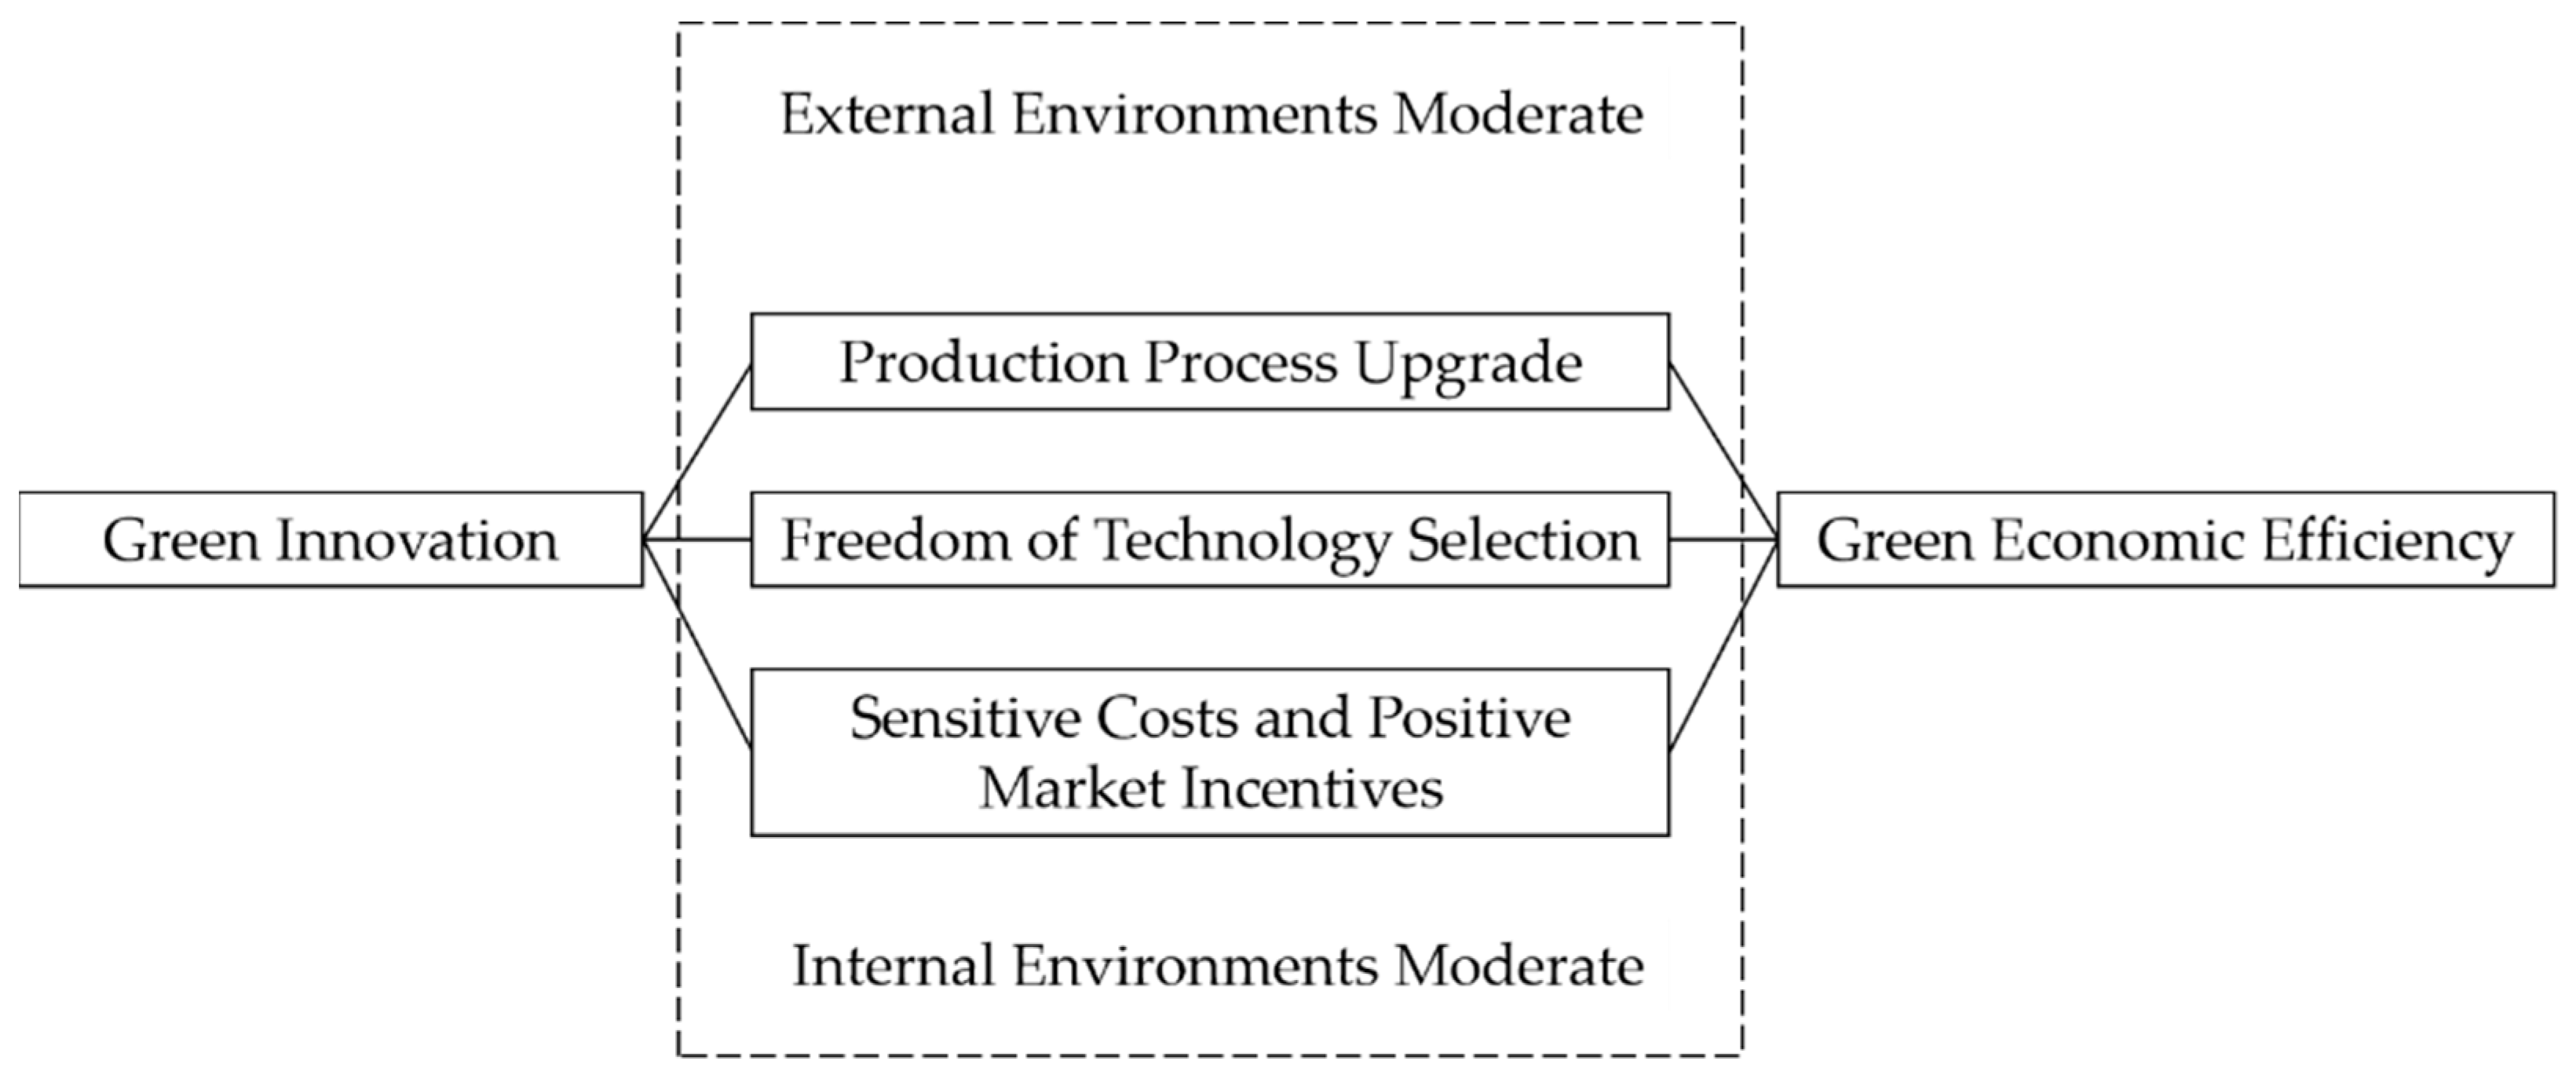
4.6. How Green Innovation Can Positively Impact Enterprise Green Economic Efficiency
5. Conclusions, Recommendations, and Limitations
5.1. Conclusions
5.2. Recommendations for Practice
5.3. Limitations
Author Contributions
Funding
Institutional Review Board Statement
Informed Consent Statement
Data Availability Statement
Conflicts of Interest
Appendix A
Appendix B

| Variable Symbol | Variable Name | Variable Definitions |
|---|---|---|
| GEE | Green economic efficiency | See definition above |
| GI | Green innovation | Number of green patent applications/total number of patent applications |
| Size | Enterprise size | Natural logarithm of total assets of the enterprise |
| ROA | Return on assets | Net profit/Total assets |
| Lev | Asset-liability ratio | Total liabilities/Total assets |
| APTR | Accounts payable turnover ratio | Operating costs/Accounts payable |
| Growth | Growth | (End value of the total assets-Beginning value of total assets)/(Beginning value of total assets) |
| PER | Price-earnings ratio | Closing price today/(Net profit in previous year’s annual report/Value of paid-in capital at end of the current period) |
| MF | Management fees rate | Management costs/Operating revenue |
| RT | Risk-taking level | The standard deviation of return on assets of enterprise in periods t − 1, t, and t + 1 |
| Share | Ownership concentration | Number of shares held by largest shareholder/Number of shares held by all shareholders |
| Inde | The proportion of independent directors | Number of independent directors/Total number of board of directors |
| CEO | Two-in-one | Equals 1 if the chairman of the board is also the general manager; otherwise, equals 0 |
| Age | Enterprise age | Natural logarithm of years since the company’s establishment |
| Variables | Obs | Mean | SD | Median | Min | Max |
|---|---|---|---|---|---|---|
| Capital Input | 2163 | 2.21 × 10⁹ | 5.53 × 10⁸ | 5.85 × 10⁹ | 223,369 | 4.40 × 10¹⁰ |
| Labor Input | 2163 | 10,331 | 3813 | 24,715 | 153 | 508,757 |
| Desired Output | 2163 | 6.21 × 10⁹ | 1.89 × 10⁹ | 1.28 × 10¹⁰ | 5,363,377 | 7.99 × 10¹⁰ |
| Undesired Output | 2163 | 2,778,327 | 138,168 | 10,002,373 | 88 | 74,455,192 |
| Variables | No Control | Financial Controls | Governance Controls | All Controls |
|---|---|---|---|---|
| (1) | (2) | (3) | (4) | |
| GEE | GEE | GEE | GEE | |
| GI | −0.0176 ** | −0.0159 ** | −0.0177 ** | −0.0161 ** |
| (−2.26) | (−2.12) | (−2.30) | (−2.16) | |
| Size | −0.0220 | −0.0208 * | ||
| (−1.62) | (−1.66) | |||
| ROA | 0.0862 ** | 0.0892 ** | ||
| (2.22) | (2.37) | |||
| Lev | −0.0024 | −0.0024 | ||
| (−0.15) | (−0.14) | |||
| APTR | 0.0004 | 0.0004 | ||
| (1.18) | (1.22) | |||
| Growth | 0.0114 * | 0.0105 * | ||
| (1.67) | (1.68) | |||
| PER | −0.0000 | −0.0000 | ||
| (−1.35) | (−1.38) | |||
| MF | −0.0203 ** | −0.0203 ** | ||
| (−2.38) | (−2.42) | |||
| RT | −0.0793 * | −0.0749* | ||
| (−1.88) | (−1.80) | |||
| Share | −0.0446 | −0.0580 | ||
| (−0.71) | (−1.02) | |||
| Inde | 0.0151 | −0.0036 | ||
| (0.36) | (−0.09) | |||
| CEO | −0.0014 | −0.0011 | ||
| (−0.32) | (−0.26) | |||
| Age | −0.0783 | −0.0503 | ||
| (−1.18) | (−0.86) | |||
| _cons | 0.0682 *** | 0.5581 * | 0.3040 | 0.6981 * |
| (19.57) | (1.82) | (1.51) | (1.78) | |
| Year fixed effect | Yes | Yes | Yes | Yes |
| Firm fixed effect | Yes | Yes | Yes | Yes |
| N | 2163 | 2163 | 2163 | 2163 |
| Adj_R2 | 0.0265 | 0.0745 | 0.0295 | 0.0774 |
| Variables | Match | Mean | Bias | Reduct Bias | t-Value | p-Value | |
|---|---|---|---|---|---|---|---|
| Treated | Control | ||||||
| Size | Unmatched | 22.877 | 22.390 | 37.9 | 78.8 | 8.59 | 0.000 |
| Matched | 22.877 | 22.774 | 8.0 | 1.51 | 0.132 | ||
| ROA | Unmatched | 0.049 | 0.054 | −10.4 | 93.2 | −2.30 | 0.021 |
| Matched | 0.049 | 0.048 | 0.7 | 0.14 | 0.887 | ||
| Lev | Unmatched | 0.388 | 0.351 | 19.0 | 51.6 | 4.24 | 0.000 |
| Matched | 0.388 | 0.370 | 9.2 | 1.76 | 0.078 | ||
| APTR | Unmatched | 12.803 | 9.657 | 15.4 | 42.8 | 3.66 | 0.000 |
| Matched | 12.803 | 14.601 | −8.8 | −1.30 | 0.193 | ||
| Growth | Unmatched | 0.134 | 0.140 | −2.5 | −164.4 | −0.55 | 0.585 |
| Matched | 0.134 | 0.149 | −6.6 | −1.30 | 0.193 | ||
| PER | Unmatched | 45.877 | 54.370 | −11.4 | 86.3 | −2.48 | 0.013 |
| Matched | 45.877 | 44.716 | 1.6 | 0.34 | 0.734 | ||
| MF | Unmatched | 0.130 | 0.112 | 4.3 | −687.8 | 0.97 | 0.332 |
| Matched | 0.130 | 0.268 | −34.0 | −3.55 | 0.000 | ||
| TobinQ | Unmatched | 1.572 | 1.886 | −29.1 | 88.1 | −6.24 | 0.000 |
| Matched | 1.572 | 1.609 | −3.5 | −0.76 | 0.445 | ||
| Share | Unmatched | 0.358 | 0.359 | −0.5 | −597.6 | −0.12 | 0.905 |
| Matched | 0.358 | 0.352 | 3.7 | 0.73 | 0.464 | ||
| Inde | Unmatched | 0.370 | 0.372 | −4.8 | −47.7 | −1.07 | 0.283 |
| Matched | 0.370 | 0.373 | −7.1 | −1.35 | 0.177 | ||
| CEO | Unmatched | 0.210 | 0.251 | −9.6 | 17.1 | −2.11 | 0.035 |
| Matched | 0.210 | 0.244 | −8.0 | −1.54 | 0.123 | ||
| Age | Unmatched | 2.971 | 3.011 | −14.8 | 74.1 | −3.33 | 0.001 |
| Matched | 2.971 | 2.961 | 3.8 | 0.73 | 0.465 | ||
| Variables | Match | Mean | Bias | Reduct Bias | t-Value | p-Value | |
|---|---|---|---|---|---|---|---|
| Treated | Control | ||||||
| Size | Unmatched | 22.877 | 22.390 | 37.9 | 85.2 | 8.59 | 0.000 |
| Matched | 22.877 | 22.805 | 5.6 | 1.04 | 0.298 | ||
| ROA | Unmatched | 0.049 | 0.054 | −10.4 | 98.1 | −2.30 | 0.021 |
| Matched | 0.049 | 0.048 | 0.2 | 0.04 | 0.968 | ||
| Lev | Unmatched | 0.388 | 0.351 | 19.0 | 74.7 | 4.24 | 0.000 |
| Matched | 0.388 | 0.378 | 4.8 | 0.91 | 0.361 | ||
| APTR | Unmatched | 12.803 | 9.657 | 15.4 | 76.4 | 3.66 | 0.000 |
| Matched | 12.803 | 13.547 | −3.6 | −0.57 | 0.568 | ||
| Growth | Unmatched | 0.134 | 0.140 | −2.5 | −50.0 | −0.55 | 0.585 |
| Matched | 0.134 | 0.143 | −3.7 | −0.72 | 0.473 | ||
| PER | Unmatched | 45.877 | 54.370 | −11.4 | 67.7 | −2.48 | 0.013 |
| Matched | 45.877 | 48.622 | −3.7 | −0.74 | 0.460 | ||
| MF | Unmatched | 0.130 | 0.112 | 4.3 | −543.0 | 0.97 | 0.332 |
| Matched | 0.130 | 0.243 | −27.8 | −3.19 | 0.001 | ||
| TobinQ | Unmatched | 1.572 | 1.886 | −29.1 | 89.6 | −6.24 | 0.000 |
| Matched | 1.572 | 1.604 | −3.0 | −0.68 | 0.497 | ||
| Share | Unmatched | 0.358 | 0.359 | −0.5 | −296.9 | −0.12 | 0.905 |
| Matched | 0.358 | 0.355 | 2.1 | 0.41 | 0.680 | ||
| Inde | Unmatched | 0.370 | 0.372 | −4.8 | 8.8 | −1.07 | 0.283 |
| Matched | 0.370 | 0.367 | 4.4 | 0.86 | 0.388 | ||
| CEO | Unmatched | 0.210 | 0.251 | −9.6 | 86.7 | −2.11 | 0.035 |
| Matched | 0.210 | 0.216 | −1.3 | −0.25 | 0.801 | ||
| Age | Unmatched | 2.971 | 3.011 | −14.8 | 82.9 | −3.33 | 0.001 |
| Matched | 2.971 | 2.978 | −2.5 | −0.48 | 0.630 | ||
| Variables | Sample | Treated | Controls | Difference | S.E. | T-Stat |
|---|---|---|---|---|---|---|
| GEE | Unmatched | 0.083 | 0.085 | −0.002 | 0.004 | −0.55 |
| ATT | 0.083 | 0.098 | −0.015 | 0.007 | −2.34 |
| Variables | Sample | Treated | Controls | Difference | S.E. | T-Stat |
|---|---|---|---|---|---|---|
| GEE | Unmatched | 0.083 | 0.085 | −0.002 | 0.004 | −0.55 |
| ATT | 0.083 | 0.095 | −0.012 | 0.005 | −2.34 |
| Variables | 1:1 Match | 1:4 Match | ||
|---|---|---|---|---|
| (1) | (2) | (3) | (4) | |
| GEE | GEE | GEE | GEE | |
| GI | −0.0289 *** | −0.0312 *** | −0.0177 ** | −0.0178 ** |
| (−2.87) | (−2.98) | (−2.26) | (−2.25) | |
| Size | −0.0117 | −0.0126 | ||
| (−0.69) | (−0.83) | |||
| ROA | 0.0474 | 0.0977 ** | ||
| (0.78) | (2.31) | |||
| Lev | −0.0287 | 0.0006 | ||
| (−1.00) | (0.04) | |||
| APTR | 0.0003 | 0.0003 | ||
| (0.96) | (1.07) | |||
| Growth | 0.0076 | 0.0059 | ||
| (1.12) | (1.21) | |||
| PER | −0.0000 | −0.0000 | ||
| (−0.59) | (−0.41) | |||
| MF | −0.0079 | −0.0109 *** | ||
| (−1.59) | (−3.13) | |||
| RT | −0.0966 * | −0.1183 *** | ||
| (−1.69) | (−2.60) | |||
| Share | −0.0818 | −0.0636 | ||
| (−1.15) | (−1.02) | |||
| Inde | 0.0295 | 0.0043 | ||
| (0.63) | (0.10) | |||
| CEO | −0.0106 | −0.0020 | ||
| (−1.57) | (−0.45) | |||
| Age | −0.0991 | −0.0886 | ||
| (−1.13) | (−1.36) | |||
| _cons | 0.0726 *** | 0.6460 | 0.0686 *** | 0.6206 |
| (14.84) | (1.14) | (17.95) | (1.33) | |
| Year fixed effect | Yes | Yes | Yes | Yes |
| Firm fixed effect | Yes | Yes | Yes | Yes |
| N | 1238 | 1238 | 1872 | 1872 |
| Adj_R2 | 0.0410 | 0.0833 | 0.0329 | 0.0653 |
| Variables | GEE | IV |
|---|---|---|
| GEE | 1.000 | |
| IV | 0.025 | 1.000 |
| (0.242) |
| Variables | First Stage | Second Stage |
|---|---|---|
| (1) | (2) | |
| GI | GEE | |
| IV | 0.9797 *** | |
| (34.39) | ||
| GI | −0.0163 * | |
| (−1.66) | ||
| Size | −0.0190 | −0.0208 * |
| (−0.82) | (−1.67) | |
| ROA | 0.0602 | 0.0892 ** |
| (0.69) | (2.37) | |
| Lev | 0.0679 * | −0.0024 |
| (1.87) | (−0.15) | |
| APTR | 0.0001 | 0.0004 |
| (0.70) | (1.22) | |
| Growth | −0.0025 | 0.0105 * |
| (−0.21) | (1.68) | |
| PER | 0.0000 | −0.0000 |
| (0.11) | (−1.38) | |
| MF | 0.0317 * | −0.0203 ** |
| (1.90) | (−2.46) | |
| RT | 0.0796 | −0.0748 * |
| (0.70) | (−1.79) | |
| Share | 0.0054 | −0.0580 |
| (−0.12) | (−1.02) | |
| Inde | −0.0348 | −0.0036 |
| (−0.42) | (−0.09) | |
| CEO | −0.0165 | −0.0011 |
| (−1.52) | (−0.26) | |
| Age | 0.0908 | −0.0503 |
| (0.63) | (−0.86) | |
| Year fixed effect | Yes | Yes |
| Firm fixed effect | Yes | Yes |
| N | 2091 | 2091 |
| Adj_R2 | 0.5559 | 0.0774 |
| Kleibergen–Paap rk LM Statistic | 59.759 | |
| Cragg-Donald Wald F Statistic | 1762.702 | |
| Kleibergen–Paap rk Wald F Statistic | 1182.870 | |
| Variables | First Stage | Second Stage |
|---|---|---|
| (1) | (2) | |
| GI | GEE | |
| IV | 8.6956 *** | |
| (18.62) | ||
| GI | −0.0213 ** | |
| (−2.54) | ||
| IMR | 0.0025 * | |
| (1.69) | ||
| Size | 0.4133 *** | −0.0208 * |
| (12.37) | (−1.66) | |
| ROA | 0.6644 | 0.0899 ** |
| (0.95) | (2.38) | |
| Lev | 0.1491 | −0.0028 |
| (0.76) | (−0.17) | |
| APTR | −0.0012 | 0.0004 |
| (−0.68) | (1.20) | |
| Growth | −0.0638 | 0.0105 * |
| (−0.48) | (1.67) | |
| PER | −0.0006 | −0.0000 |
| (−1.45) | (−1.41) | |
| Share | −0.3249 | −0.0573 |
| (−1.43) | (−1.01) | |
| Inde | 0.2586 | −0.0045 |
| (0.42) | (−0.12) | |
| Age | −0.1253 | −0.0500 |
| (−0.98) | (−0.85) | |
| MF | −0.0206 ** | |
| (−2.42) | ||
| RT | −0.0754 * | |
| (−1.81) | ||
| CEO | −0.0011 | |
| (−0.25) | ||
| _cons | −9.3237 *** | 0.6978 * |
| (−11.73) | (1.77) | |
| Year fixed effect | Yes | Yes |
| Firm fixed effect | Yes | Yes |
| N | 2225 | 2163 |
| Pseudo/Adj_R2 | 0.2872 | 0.0786 |
| Variables | Green Invention Innovation | Green Utility Model Innovation | High-Tech Market | Low-Tech Market | High Market Competition | Low Market Competition |
|---|---|---|---|---|---|---|
| (1) | (2) | (3) | (4) | (5) | (6) | |
| GEE | GEE | GEE | GEE | GEE | GEE | |
| GI-I | −0.0096 | |||||
| (−1.45) | ||||||
| GI-UM | −0.0142 ** | |||||
| (−2.35) | ||||||
| GI | −0.0154 | −0.0199 ** | −0.0108 | −0.0185 * | ||
| (−1.27) | (−2.00) | (−0.97) | (−1.92) | |||
| Size | −0.0224 * | −0.0225 * | −0.0118 | −0.0234 | −0.0408 * | 0.0032 |
| (−1.70) | (−1.71) | (−0.88) | (−1.32) | (−1.82) | (0.22) | |
| ROA | 0.0956 ** | 0.0964 ** | 0.0680 | 0.0620 | 0.0755 | 0.1248 ** |
| (2.40) | (2.44) | (1.23) | (1.13) | (1.42) | (2.51) | |
| Lev | −0.0016 | −0.0006 | 0.0069 | −0.0087 | −0.0005 | 0.0064 |
| (−0.10) | (−0.04) | (0.20) | (−0.42) | (−0.03) | (0.25) | |
| APTR | 0.0004 | 0.0004 | 0.0000 | 0.0007 | 0.0005 | 0.0002 |
| (1.17) | (1.21) | (0.02) | (1.15) | (0.95) | (1.50) | |
| Growth | 0.0125 * | 0.0127 * | −0.0008 | 0.0157 | 0.0182 ** | −0.0025 |
| (1.72) | (1.75) | (−0.09) | (1.52) | (2.14) | (−0.31) | |
| PER | −0.0000 | −0.0000 * | −0.0001 ** | 0.0000 | −0.0001 * | 0.0000 |
| (−1.64) | (−1.67) | (−2.52) | (0.13) | (−1.86) | (0.53) | |
| MF | −0.0128 *** | −0.0117 *** | −0.0381 * | −0.0121 ** | −0.0314 ** | −0.0095 *** |
| (−2.73) | (−2.67) | (−1.86) | (−2.29) | (−2.21) | (−3.08) | |
| RT | −0.0741 * | −0.0720 * | 0.0966 | −0.1432 ** | −0.0645 | −0.1199 ** |
| (−1.78) | (−1.69) | (1.13) | (−2.36) | (−1.10) | (−2.17) | |
| Share | −0.0597 | −0.0633 | −0.0855 | −0.0525 | −0.0793 | −0.0685 |
| (−1.04) | (−1.10) | (−1.20) | (−0.53) | (−0.77) | (−1.09) | |
| Inde | −0.0055 | −0.0058 | −0.0525 | 0.0113 | 0.0106 | −0.0085 |
| (−0.14) | (−0.15) | (−0.61) | (0.25) | (0.22) | (−0.13) | |
| CEO | −0.0002 | 0.0001 | 0.0096 | −0.0100 ** | 0.0049 | −0.0064 |
| (−0.03) | (0.01) | (1.57) | (−2.02) | (0.75) | (−1.00) | |
| Age | −0.0455 | −0.0382 | −0.2079 * | −0.0658 | −0.0849 | 0.0080 |
| (−0.68) | (−0.58) | (−1.94) | (−0.76) | (−0.88) | (0.14) | |
| _cons | 0.7211 * | 0.7021 * | 0.9899 ** | 0.7855 | 1.2360 * | −0.0068 |
| (1.73) | (1.69) | (2.32) | (1.30) | (1.86) | (−0.02) | |
| Year fixed effect | Yes | Yes | Yes | Yes | Yes | Yes |
| Firm fixed effect | Yes | Yes | Yes | Yes | Yes | Yes |
| N | 2108 | 2108 | 862 | 1301 | 1191 | 972 |
| Adj_R2 | 0.0638 | 0.0653 | 0.1373 | 0.0961 | 0.1256 | 0.0633 |
| Variables | Strong Legal Environment | Weak Legal Environment | Strong Technical Protection | Weak Technical Protection |
|---|---|---|---|---|
| (1) | (2) | (3) | (4) | |
| GEE | GEE | GEE | GEE | |
| GI | −0.0067 | −0.0152 * | −0.0129 | −0.0174 * |
| (−0.50) | (−1.90) | (−1.23) | (−1.71) | |
| Size | 0.0129 | −0.0092 | −0.0081 | −0.0148 |
| (0.90) | (−0.84) | (−0.56) | (−1.28) | |
| ROA | 0.0787 | 0.0404 | 0.0221 | 0.1189 *** |
| (1.27) | (0.98) | (0.40) | (3.00) | |
| Lev | −0.0108 | −0.0079 | −0.0219 | 0.0112 |
| (−0.40) | (−0.40) | (−0.77) | (0.52) | |
| APTR | 0.0006 | 0.0002 | 0.0007 | 0.0001 |
| (1.08) | (1.36) | (1.14) | (0.80) | |
| Growth | 0.0035 | 0.0085 | 0.0189 | 0.0100 ** |
| (0.43) | (1.60) | (1.28) | (2.06) | |
| PER | −0.0000 | −0.0000 * | −0.0000 | −0.0001 |
| (−0.88) | (−1.92) | (−1.12) | (−1.31) | |
| MF | −0.0039 | −0.0396 * | −0.0078 * | −0.0275 ** |
| (−0.46) | (−1.79) | (−1.89) | (−2.42) | |
| RT | −0.0255 | −0.0788 | −0.0346 | −0.0601 |
| (−0.25) | (−1.37) | (−0.45) | (−1.15) | |
| Share | 0.0273 | 0.0417 | −0.0617 | −0.0459 |
| (0.40) | (1.00) | (−0.53) | (−0.91) | |
| Inde | 0.0435 | −0.0751 | 0.0448 | −0.0635 |
| (0.70) | (−1.57) | (0.86) | (−1.40) | |
| CEO | −0.0025 | −0.0052 | −0.0091 | 0.0045 |
| (−0.60) | (−0.94) | (−1.35) | (0.87) | |
| Age | −0.2055 ** | 0.0309 | −0.0948 | 0.0450 |
| (−1.97) | (0.51) | (−1.19) | (0.80) | |
| _cons | 0.3453 | 0.1998 | 0.5283 | 0.3069 |
| (0.91) | (0.66) | (1.17) | (1.09) | |
| Year fixed effect | Yes | Yes | Yes | Yes |
| Firm fixed effect | Yes | Yes | Yes | Yes |
| N | 933 | 1230 | 987 | 1176 |
| Adj_R2 | 0.0933 | 0.1494 | 0.0803 | 0.1255 |
| Variables | High-Tech Enterprise | Nonhigh-Tech Enterprise | Heavily Polluting Enterprise | Nonheavily Polluting Enterprise |
|---|---|---|---|---|
| (1) | (2) | (3) | (4) | |
| GEE | GEE | GEE | GEE | |
| GI | −0.0108 | −0.0171 ** | −0.0050 | −0.0316 ** |
| (−0.73) | (−2.10) | (−0.65) | (−2.33) | |
| Size | −0.0463 * | −0.0006 | −0.0394 | 0.0019 |
| (−1.80) | (−0.05) | (−1.57) | (0.22) | |
| ROA | 0.0430 | 0.1675 *** | 0.0512 | 0.0885 ** |
| (0.79) | (4.10) | (0.68) | (2.16) | |
| Lev | 0.0125 | −0.0090 | −0.0612 * | 0.0169 |
| (0.54) | (−0.44) | (−1.90) | (0.83) | |
| APTR | 0.0005 | 0.0002 * | 0.0000 | 0.0006 |
| (0.87) | (1.92) | (0.01) | (1.32) | |
| Growth | 0.0175 * | 0.0014 | 0.0142 | 0.0072 |
| (1.93) | (0.22) | (1.05) | (1.25) | |
| PER | −0.0001 | −0.0000 | −0.0001 | −0.0000 |
| (−1.39) | (−0.64) | (−1.16) | (−0.86) | |
| MF | −0.0332 ** | −0.0093 *** | −0.0426 *** | −0.0053 |
| (−2.27) | (−3.47) | (−2.95) | (−1.57) | |
| RT | −0.0911 | −0.1013 * | −0.0651 | −0.0777 * |
| (−1.33) | (−1.82) | (−0.59) | (−1.77) | |
| Share | −0.0775 | −0.0569 | −0.1376 | 0.0596 |
| (−0.55) | (−1.15) | (−1.64) | (0.95) | |
| Inde | −0.0365 | 0.0239 | 0.0646 | −0.0176 |
| (−0.48) | (0.58) | (0.96) | (−0.37) | |
| CEO | 0.0099 | −0.0102 * | 0.0093 | −0.0061 |
| (1.40) | (−1.72) | (1.08) | (−1.21) | |
| Age | −0.1001 | −0.0044 | −0.1153 | −0.0047 |
| (−0.95) | (−0.08) | (−0.87) | (−0.08) | |
| _cons | 1.3980 * | 0.1098 | 1.3236 | 0.0161 |
| (1.82) | (0.37) | (1.64) | (0.07) | |
| Year fixed effect | Yes | Yes | Yes | Yes |
| Firm fixed effect | Yes | Yes | Yes | Yes |
| N | 1026 | 1137 | 749 | 1414 |
| Adj_R2 | 0.1089 | 0.0929 | 0.1926 | 0.0762 |
| Variables | Lack of Production Process Upgrade | Lack of High Degree of Freedom of Technology Selection | Lack of High Market Competition Intensity | All Conditions Are Met |
|---|---|---|---|---|
| (1) | (2) | (3) | (4) | |
| GEE | GEE | GEE | GEE | |
| GI | 0.0151 | |||
| (1.23) | ||||
| GI-I | −0.0091 | −0.0086 | 0.0196 * | |
| (−0.73) | (−0.94) | (1.95) | ||
| Size | −0.0308 | −0.0408 * | −0.0121 | −0.0312 |
| (−1.53) | (−1.83) | (−0.92) | (−1.56) | |
| ROA | 0.0788 | 0.0745 | 0.0690 | 0.0780 |
| (1.56) | (1.39) | (1.26) | (1.49) | |
| Lev | 0.0006 | −0.0009 | 0.0061 | 0.0018 |
| (0.02) | (−0.05) | (0.18) | (0.06) | |
| APTR | −0.0002 | 0.0005 | −0.0000 | −0.0002 |
| (−1.38) | (0.94) | (−0.09) | (−1.28) | |
| Growth | 0.0064 | 0.0183 ** | −0.0003 | 0.0059 |
| (0.72) | (2.16) | (−0.04) | (0.67) | |
| PER | −0.0001 ** | −0.0001 * | −0.0001 ** | −0.0001 ** |
| (−2.00) | (−1.85) | (−2.51) | (−2.04) | |
| MF | −0.0815 *** | −0.0319 ** | −0.0381 * | −0.0815 *** |
| (−4.27) | (−2.29) | (−1.86) | (−4.28) | |
| RT | 0.1007 | −0.0648 | 0.0938 | 0.1005 |
| (1.06) | (−1.12) | (1.11) | (1.05) | |
| Share | 0.0064 | −0.0786 | −0.0836 | 0.0023 |
| (0.11) | (−0.76) | (−1.19) | (0.04) | |
| Inde | 0.0534 | 0.0114 | −0.0511 | 0.0557 |
| (0.62) | (0.24) | (−0.60) | (0.65) | |
| CEO | 0.0058 | 0.0049 | 0.0095 | 0.0063 |
| (0.91) | (0.76) | (1.54) | (0.99) | |
| Age | −0.1338 | −0.0875 | −0.2045 * | −0.1303 |
| (−0.95) | (−0.89) | (−1.92) | (−0.93) | |
| _cons | 1.1184 * | 1.2422 * | 0.9861 ** | 1.1177 * |
| (1.74) | (1.87) | (2.32) | (1.74) | |
| Year fixed effect | Yes | Yes | Yes | Yes |
| Firm fixed effect | Yes | Yes | Yes | Yes |
| N | 489 | 1191 | 862 | 489 |
| Adj_R2 | 0.3316 | 0.1255 | 0.1366 | 0.3333 |
References
- Aguilera-Caracuel, J.; Ortiz-de-Mandojana, N. Green innovation and financial performance: An institutional approach. Organ. Environ. 2013, 26, 365–385. [Google Scholar] [CrossRef]
- Wang, X.; Wang, Y. Research on the green innovation promoted by green credit policies. J. Manag. World 2021, 37, 173–188+11. [Google Scholar]
- Zhou, P.; Ang, B.W.; Wang, H. Energy and CO2 emission performance in electricity generation: A non-radial directional distance function approach. Eur. J. Oper. Res. 2012, 221, 625–635. [Google Scholar] [CrossRef]
- Yuan, H.; Feng, Y.; Lee, C.C.; Cen, Y. How does manufacturing agglomeration affect green economic efficiency? Energy Econ. 2020, 92, 104944. [Google Scholar] [CrossRef]
- Li, J.; Chen, L.; Chen, Y.; He, J. Digital economy, technological innovation, and green economic efficiency—Empirical evidence from 277 cities in China. Manag. Decis. Econ. 2022, 43, 616–629. [Google Scholar] [CrossRef]
- Wang, L.; Wang, Y.; Sun, Y.; Han, K.; Chen, Y. Financial inclusion and green economic efficiency: Evidence from China. J. Environ. Plan. Manag. 2022, 65, 240–271. [Google Scholar] [CrossRef]
- Cui, J.; Zhang, J.; Zheng, Y. Carbon pricing induces innovation: Evidence from China’s regional carbon market pilots. In Proceedings of the 130th Annual Meeting of the American-Economic-Association, Philadelphia, PA, USA, 7 May 2018. [Google Scholar]
- Weng, H.H.; Chen, J.S.; Chen, P.C. Effects of green innovation on environmental and corporate performance: A stakeholder perspective. Sustainability 2015, 7, 4997–5026. [Google Scholar] [CrossRef] [Green Version]
- Asadi, S.; Pourhashemi, S.O.; Nilashi, M.; Abdullah, R.; Samad, S.; Yadegaridehkordi, E.; Aljojo, N.; Razali, N.S. Investigating influence of green innovation on sustainability performance: A case on Malaysian hotel industry. J. Clean Prod. 2020, 258, 120860. [Google Scholar] [CrossRef]
- Yuan, B.; Li, C.; Yin, H.; Zeng, M. Green innovation and China’s CO2 emissions—The moderating effect of institutional quality. J. Environ. Plan. Manag. 2022, 65, 877–906. [Google Scholar] [CrossRef]
- Zhao, S.; Cao, Y.; Feng, C.; Guo, K.; Zhang, J. How do heterogeneous R&D investments affect China’s green productivity: Revisiting the Porter hypothesis. Sci. Total Environ. 2022, 825, 154090. [Google Scholar]
- Wu, J.; Xia, Q.; Li, Z. Green innovation and enterprise green total factor productivity at a micro level: A perspective of technical distance. J. Clean Prod. 2022, 344, 131070. [Google Scholar] [CrossRef]
- Porter, M.E. America’s green strategy. Sci. Am. 1991, 264, 168. [Google Scholar] [CrossRef]
- Porter, M.E.; Van-der-Linde, C. Toward a new conception of the environment-competitiveness relationship. J. Econ. Perspect. 1995, 9, 97–118. [Google Scholar] [CrossRef] [Green Version]
- Rehman, S.U.; Kraus, S.; Shah, S.A.; Khanin, D.; Mahto, R.V. Analyzing the relationship between green innovation and environmental performance in large manufacturing firms. Technol. Forecast. Soc. Chang. 2021, 163, 120481. [Google Scholar] [CrossRef]
- Li, L.; Msaad, H.; Sun, H.; Tan, M.X.; Lu, Y.; Lau, A.K. Green innovation and business sustainability: New evidence from energy intensive industry in China. Int. J. Environ. Res. Public Health 2020, 17, 7826. [Google Scholar] [CrossRef] [PubMed]
- Huang, J.W.; Li, Y.H. Green innovation and performance: The view of organizational capability and social reciprocity. J. Bus. Ethics 2017, 145, 309–324. [Google Scholar] [CrossRef]
- Zhang, Y.; Xing, C.; Wang, Y. Does green innovation mitigate financing constraints? evidence from China’s private enterprises. J. Clean Prod. 2020, 264, 121698. [Google Scholar] [CrossRef]
- Javeed, S.A.; Teh, B.H.; Ong, T.S.; Chong, L.L.; Abd-Rahim, M.F.B.; Latief, R. How does green innovation strategy influence corporate financing? corporate social responsibility and gender diversity play a moderating role. Int. J. Environ. Res. Public Health. 2022, 19, 8724. [Google Scholar] [CrossRef]
- Tang, M.; Walsh, G.; Lerner, D.; Fitza, M.A.; Li, Q. Green innovation, managerial concern and firm performance: An empirical study. Bus. Strateg. Environ. 2018, 27, 39–51. [Google Scholar] [CrossRef]
- Sellitto, M.A.; Camfield, C.G.; Buzuku, S. Green innovation and competitive advantages in a furniture industrial cluster: A survey and structural model. Sustain. Prod. Consump. 2020, 23, 94–104. [Google Scholar] [CrossRef]
- Zheng, J.; Khurram, M.U.; Chen, L. Can green innovation affect ESG ratings and financial performance? evidence from Chinese GEM listed companies. Sustainability 2022, 14, 8677. [Google Scholar] [CrossRef]
- Zhang, D.; Rong, Z.; Ji, Q. Green innovation and firm performance: Evidence from listed companies in China. Resour. Conserv. Recycl. 2019, 144, 48–55. [Google Scholar] [CrossRef]
- Tariq, A.; Badir, Y.; Chonglerttham, S. Green innovation and performance: Moderation analyses from Thailand. Eur. J. Innov. Manag. 2019, 22, 446–467. [Google Scholar] [CrossRef]
- Hao, X.; Chen, F.; Chen, Z. Does green innovation increase enterprise value? Bus. Strateg. Environ. 2022, 31, 1232–1247. [Google Scholar] [CrossRef]
- Dai, D.; Xue, Y. The impact of green innovation on a firm’s value from the perspective of enterprise life cycles. Sustainability 2022, 14, 1226. [Google Scholar] [CrossRef]
- Yu, J.; Park, J.; Lee, K.; Han, H. Can environmentally sustainable development and green innovation of hotels trigger the formation of a positive brand and price premium? Int. J. Environ. Res. Public Health 2021, 18, 3275. [Google Scholar] [CrossRef]
- Tu, Y.; Wu, W. How does green innovation improve enterprises’ competitive advantage? the role of organizational learning. Sustain. Prod. Consump. 2021, 26, 504–516. [Google Scholar] [CrossRef]
- Hsu, C.C.; Quang-Thanh, N.; Chien, F.; Li, L.; Mohsin, M. Evaluating green innovation and performance of financial development: Mediating concerns of environmental regulation. Environ. Sci. Pollut. Res. 2021, 28, 57386–57397. [Google Scholar] [CrossRef]
- Kunapatarawong, R.; Martínez-Ros, E. Towards green growth: How does green innovation affect employment? Res. Policy 2016, 45, 1218–1232. [Google Scholar] [CrossRef]
- Amore, M.D.; Bennedsen, M. Corporate governance and green innovation. J. Environ. Econ. Manag. 2016, 75, 54–72. [Google Scholar] [CrossRef]
- Huang, Z.; Liao, G.; Li, Z. Loaning scale and government subsidy for promoting green innovation. Technol. Forecast. Soc. Chang. 2019, 144, 148–156. [Google Scholar] [CrossRef]
- Zhang, D.; Zheng, M.; Feng, G.F.; Chang, C.P. Does an environmental policy bring to green innovation in renewable energy? Renew. Energy 2022, 195, 1113–1124. [Google Scholar] [CrossRef]
- Elsayed, K.; Paton, D. The impact of environmental performance on firm performance: Static and dynamic panel data evidence. Struct. Chang. Econ. Dyn. 2005, 16, 395–412. [Google Scholar] [CrossRef]
- Palmer, K.; Oates, W.E.; Portney, P.R. Tightening environmental standards: The benefit-cost or the no-cost paradigm? J. Econ. Perspect. 1995, 9, 119–132. [Google Scholar] [CrossRef]
- Liu, X.; Dai, H.; Cheng, P. Drivers of integrated environmental innovation and impact on company competitiveness: Evidence from 18 Chinese firms. Int. J. Technol. Global. 2011, 5, 255–280. [Google Scholar] [CrossRef]
- Doran, J.; Ryan, G. The importance of the diverse drivers and types of environmental innovation for firm performance. Bus. Strateg. Environ. 2016, 25, 102–119. [Google Scholar] [CrossRef]
- Rezende, A.L.; Bansi, A.C.; Alves, M.F.R.; Galina, S.V.R. Take your time: Examining when green innovation affects financial performance in multinationals. J. Clean Prod. 2019, 233, 993–1003. [Google Scholar] [CrossRef]
- Oliveira, J.A.S.; Basso, L.F.C.; Kimura, H.; Sobreiro, V.A. Innovation and financial performance of companies doing business in Brazil. Int. J. Innov. Stud. 2018, 2, 153–164. [Google Scholar] [CrossRef]
- Schumpeter, J.A. The creative response in economic history. J. Econ. Hist. 1947, 7, 149–159. [Google Scholar] [CrossRef] [Green Version]
- Pigou, A.C. The Economics of Welfare; Macmillan and Co. Ltd.: London, UK, 1920. [Google Scholar]
- Zailani, S.; Govindan, K.; Iranmanesh, M.; Shaharudin, M.R.; Chong, Y.S. Green innovation adoption in automotive supply chain: The Malaysian case. J. Clean Prod. 2015, 108, 1115–1122. [Google Scholar] [CrossRef]
- Zhang, N.; Kong, F.; Choi, Y.; Zhou, P. The effect of size-control policy on unified energy and carbon efficiency for Chinese fossil fuel power plants. Energy Policy 2014, 70, 193–200. [Google Scholar] [CrossRef]
- Jaffe, A.B.; Palmer, K. Environmental regulation and innovation: A panel data study. Rev. Econ. Stat. 1997, 79, 610–619. [Google Scholar] [CrossRef]
- Liu, J.; Xiao, Y. China’s Environmental protection tax and green innovation: Incentive effect or crowding-out effect? Econ. Res. J. 2022, 57, 72–88. [Google Scholar]
- Wang, X.; Hu, L.; Fan, G. Marketization Index of China’s Provinces: NERI Report 2021; Social Sciences Academic Press (China): Beijing, China, 2021. [Google Scholar]
- Dosi, G.; Marengo, L.; Pasquali, C. How much should society fuel the greed of innovators?: On the relations between appropriability, opportunities and rates of innovation. Res. Policy 2006, 35, 1110–1121. [Google Scholar] [CrossRef]
- Castellacci, F.; Zheng, J. Technological regimes, Schumpeterian patterns of innovation and firm-level productivity growth. Ind. Corp. Chang. 2010, 19, 1829–1865. [Google Scholar] [CrossRef] [Green Version]
- Chen, Y.S.; Lai, S.B.; Wen, C.T. The influence of green innovation performance on corporate advantage in Taiwan. J. Bus. Ethics 2006, 67, 331–339. [Google Scholar] [CrossRef]
- Liu, C.; Zhang, S.; Li, X. Has green credit policy boosted green total factor productivity in China’s heavily polluting industries? Stud. Int. Financ. 2022, 406, 3–11. [Google Scholar]


| Variables | Obs | Mean | SD | Median | Min | Max |
|---|---|---|---|---|---|---|
| GEE | 2163 | 0.0840 | 0.0928 | 0.0546 | 0.0007 | 0.6145 |
| GI | 2163 | 0.1238 | 0.1696 | 0.0606 | 0.0000 | 0.8462 |
| Size | 2163 | 22.5569 | 1.2759 | 22.3884 | 20.1819 | 25.8538 |
| ROA | 2163 | 0.0520 | 0.0502 | 0.0398 | −0.2719 | 0.2497 |
| Lev | 2163 | 0.3623 | 0.1931 | 0.3455 | 0.0150 | 0.9584 |
| APTR | 2163 | 10.7435 | 19.1876 | 5.8323 | 0.5973 | 156.3812 |
| Growth | 2163 | 0.1371 | 0.2295 | 0.0816 | −0.3311 | 1.4300 |
| PER | 2163 | 51.2148 | 75.5002 | 27.8139 | 4.0473 | 512.7808 |
| MF | 2163 | 0.1186 | 0.4042 | 0.0532 | 0.0059 | 5.7002 |
| RT | 2163 | 0.0179 | 0.0288 | 0.0094 | 0.0001 | 0.2694 |
| Share | 2163 | 0.3582 | 0.1495 | 0.3379 | 0.0998 | 0.7505 |
| Inde | 2163 | 0.3711 | 0.0519 | 0.3333 | 0.3333 | 0.5714 |
| CEO | 2163 | 0.2367 | 0.4252 | 0 | 0 | 1 |
| Age | 2163 | 2.9961 | 0.2640 | 3.0445 | 2.1972 | 3.4657 |
| Variables | No Control | Financial Controls | Governance Controls | All Controls |
|---|---|---|---|---|
| (1) | (2) | (3) | (4) | |
| GEE | GEE | GEE | GEE | |
| GI | −0.0176 ** | −0.0159 ** | −0.0177 ** | −0.0161 ** |
| (−2.26) | (−2.12) | (−2.30) | (−2.16) | |
| Financial Controls | Yes | Yes | ||
| Governance Controls | Yes | Yes | ||
| Year fixed effect | Yes | Yes | Yes | Yes |
| Firm fixed effect | Yes | Yes | Yes | Yes |
| N | 2163 | 2163 | 2163 | 2163 |
| Adj_R2 | 0.0265 | 0.0745 | 0.0295 | 0.0774 |
| Variables | 1:1 Match | 1:4 Match | ||
|---|---|---|---|---|
| (1) | (2) | (3) | (4) | |
| GEE | GEE | GEE | GEE | |
| GI | −0.0289 *** | −0.0312 *** | −0.0177 ** | −0.0178 ** |
| (−2.87) | (−2.98) | (−2.26) | (−2.25) | |
| Controls | Yes | Yes | ||
| Year fixed effect | Yes | Yes | Yes | Yes |
| Firm fixed effect | Yes | Yes | Yes | Yes |
| N | 1238 | 1238 | 1872 | 1872 |
| Adj_R2 | 0.0410 | 0.0833 | 0.0329 | 0.0653 |
| Variables | 2SLS | Heckman Two-Stage | ||
|---|---|---|---|---|
| First Stage | Second Stage | First Stage | Second Stage | |
| (1) | (2) | (3) | (4) | |
| GI | GEE | GI | GEE | |
| IV | 0.9797 *** | 8.6956 *** | ||
| (34.39) | (18.62) | |||
| GI | −0.0163 * | −0.0213 ** | ||
| (−1.66) | (−2.54) | |||
| IMR | 0.0025 * | |||
| (1.69) | ||||
| Controls | Yes | Yes | Yes | Yes |
| Year fixed effect | Yes | Yes | Yes | Yes |
| Firm fixed effect | Yes | Yes | Yes | Yes |
| N | 2091 | 2091 | 2225 | 2163 |
| Pseudo/Adj_R2 | 0.5559 | 0.0774 | 0.2872 | 0.0786 |
| Kleibergen–Paap rk LM Statistic | 59.759 | |||
| Cragg-Donald Wald F Statistic | 1762.702 | |||
| Kleibergen–Paap rk Wald F Statistic | 1182.870 | |||
| Variables | Green Invention Innovation | Green Utility Model Innovation | High-Tech Market | Low-Tech Market | High Market Competition | Low Market Competition |
|---|---|---|---|---|---|---|
| (1) | (2) | (3) | (4) | (5) | (6) | |
| GEE | GEE | GEE | GEE | GEE | GEE | |
| GI-I | −0.0096 | |||||
| (−1.45) | ||||||
| GI-UM | −0.0142 ** | |||||
| (−2.35) | ||||||
| GI | −0.0154 | −0.0199 ** | −0.0108 | −0.0185 * | ||
| (−1.27) | (−2.00) | (−0.97) | (−1.92) | |||
| Controls | Yes | Yes | Yes | Yes | Yes | Yes |
| Year fixed effect | Yes | Yes | Yes | Yes | Yes | Yes |
| Firm fixed effect | Yes | Yes | Yes | Yes | Yes | Yes |
| N | 2108 | 2108 | 862 | 1301 | 1191 | 972 |
| Adj_R2 | 0.0638 | 0.0653 | 0.1373 | 0.0961 | 0.1256 | 0.0633 |
| Variables | Strong Legal Environment | Weak Legal Environment | Strong Technical Protection | Weak Technical Protection |
|---|---|---|---|---|
| (1) | (2) | (3) | (4) | |
| GEE | GEE | GEE | GEE | |
| GI | −0.0067 | −0.0152 * | −0.0129 | −0.0174 * |
| (−0.50) | (−1.90) | (−1.23) | (−1.71) | |
| Controls | Yes | Yes | Yes | Yes |
| Year fixed effect | Yes | Yes | Yes | Yes |
| Firm fixed effect | Yes | Yes | Yes | Yes |
| N | 933 | 1230 | 987 | 1176 |
| Adj_R2 | 0.0933 | 0.1494 | 0.0803 | 0.1255 |
| Variables | High-Tech Enterprise | Nonhigh-Tech Enterprise | Heavily Polluting Enterprise | Nonheavily Polluting Enterprise |
|---|---|---|---|---|
| (1) | (2) | (3) | (4) | |
| GEE | GEE | GEE | GEE | |
| GI | −0.0108 | −0.0171 ** | −0.0050 | −0.0316 ** |
| (−0.73) | (−2.10) | (−0.65) | (−2.33) | |
| Controls | Yes | Yes | Yes | Yes |
| Year fixed effect | Yes | Yes | Yes | Yes |
| Firm fixed effect | Yes | Yes | Yes | Yes |
| N | 1026 | 1137 | 749 | 1414 |
| Adj_R2 | 0.1089 | 0.0929 | 0.1926 | 0.0762 |
| Variables | Lack of Production Process Upgrade | Lack of High Degree of Freedom of Technology Selection | Lack of High Market Competition Intensity | All Conditions Are Met |
|---|---|---|---|---|
| (1) | (2) | (3) | (4) | |
| GEE | GEE | GEE | GEE | |
| GI | 0.0151 | |||
| (1.23) | ||||
| GI-I | −0.0091 | −0.0086 | 0.0196 * | |
| (−0.73) | (−0.94) | (1.95) | ||
| Controls | Yes | Yes | Yes | Yes |
| Year fixed effect | Yes | Yes | Yes | Yes |
| Firm fixed effect | Yes | Yes | Yes | Yes |
| N | 489 | 1191 | 862 | 489 |
| Adj_R2 | 0.3316 | 0.1255 | 0.1366 | 0.3333 |
Publisher’s Note: MDPI stays neutral with regard to jurisdictional claims in published maps and institutional affiliations. |
© 2022 by the authors. Licensee MDPI, Basel, Switzerland. This article is an open access article distributed under the terms and conditions of the Creative Commons Attribution (CC BY) license (https://creativecommons.org/licenses/by/4.0/).
Share and Cite
Li, Y.; Huang, N.; Zhao, Y. The Impact of Green Innovation on Enterprise Green Economic Efficiency. Int. J. Environ. Res. Public Health 2022, 19, 16464. https://doi.org/10.3390/ijerph192416464
Li Y, Huang N, Zhao Y. The Impact of Green Innovation on Enterprise Green Economic Efficiency. International Journal of Environmental Research and Public Health. 2022; 19(24):16464. https://doi.org/10.3390/ijerph192416464
Chicago/Turabian StyleLi, Yuan, Nan Huang, and Yang Zhao. 2022. "The Impact of Green Innovation on Enterprise Green Economic Efficiency" International Journal of Environmental Research and Public Health 19, no. 24: 16464. https://doi.org/10.3390/ijerph192416464