Article

Combination of Water-Saving Irrigation and Nitrogen Fertilization Regulates Greenhouse Gas Emissions and Increases Rice Yields in High-Cold Regions, Northeast China

1
Institute of Crop Cultivation and Tillage, Heilongjiang Academy of Agricultural Sciences, Harbin 150086, China
2
Key Laboratory of Germplasm Enhancement and Physiology and Ecology of Food Crop in Cold Region, Ministry of Education, Harbin 150030, China
3
Heilongjiang Academy of Agricultural Sciences, Harbin 150086, China
4
Plant Nutrition and Resources Institute, Beijing Academy of Agriculture and Forestry Sciences, Beijing 100097, China
5
Northeast Institute of Geography and Agroecology, Chinese Academy of Sciences, Changchun 130012, China
*
Author to whom correspondence should be addressed.
Int. J. Environ. Res. Public Health 2022, 19(24), 16506; https://doi.org/10.3390/ijerph192416506
Submission received: 3 November 2022 / Revised: 3 December 2022 / Accepted: 5 December 2022 / Published: 8 December 2022
(This article belongs to the Special Issue Agricultural Soil Pollution and Treatment Technology)

Abstract

:
Increased rice production, which benefitted from cropping areas expansion and continuous N applications, resulted in severe increases in greenhouse gases (GHG) emissions from 1983 to 2019 in Heilongjiang Province, China. Therefore, field trials were performed in the high-cold Harbin region, Northeast China, to determine the efficiency of incorporating water regimes with N fertilization in minimizing the impact of rice production on GHG emissions. Two water-saving irrigation strategies, intermittent irrigation (W1) and control irrigation (W2), were used relative to continuous flooding (W0), and we combined them with six fertilized treatments. Our results demonstrated that W1 and W2 significantly decreased seasonal CH4 emissions by 19.7–30.0% and 11.4–29.9%, enhanced seasonal N2O emissions by 77.0–127.0% and 16.2–42.4%, and increased significantly yields by 5.9–12.7% and 0–4.7%, respectively, compared with W0. Although trade-offs occurred between CH4 and N2O emissions, W1 and W2 resulted in significant reductions in global warming potential (GWP). Moreover, low N rates (<120 kg N ha−1) performed better in GWP than high N rates. N fertilization and irrigation regimes had remarkable effects on rice yields and GWP. In conclusion, the incorporation of W1 and a N application under 120 kg N ha−1 could simultaneously mitigate GWP while enhancing production in black soils in high-cold Northeast China.

1. Introduction

Rice (Oryza sativa L.) is an important food crop for global food security, feeding roughly half of the world’s population; furthermore, its demand is expected to increase by 28% in 2050 [1]. However, rice farming has been identified as a major anthropogenic source of greenhouse gas (GHG), contributing up to 11% and 30% of global anthropogenic emissions of methane (CH4) and nitrous oxide (N2O), respectively [2,3], which is approximately four times higher than that of either wheat or maize farming [4]. Therefore, identifying effective management techniques for agroecosystems is crucial to reduce the impact of rice production on global warming.
Irrigation methods and N fertilization applications are the two main drivers for rice production, not only in optimizing rice yield but also regulating N2O and CH4 emissions [5,6]. Mitigation strategies for the impact of rice production on global warming should focus on modifications to current water and N management practices. Intermittent irrigation, as a “win–win” management strategy, has become increasingly popular, not only in inhibiting ineffective tillers, removing toxic substances, and improving root activities, but also reducing water consumption and enhancing water-use efficiency compared with continuous flooding [7,8,9] in China and many other countries [10,11]. Furthermore, intermittent irrigation, defined as a period of drainage lasting several days in the middle of the rice season, and drying–wetting alternation during the growing season, alter anaerobic and aerobic cycling, thereby affecting various processes underlying CH4 and N2O production. It has gained increasing attention as a promising strategy for mitigating GHG emissions in rice agroecosystems.
Numerous studies have shown that the intermittent irrigation of paddy fields reduced seasonal CH4 emissions [12,13,14] while simultaneously stimulating N2O emissions, resulting in a trade-off between CH4 and N2O emissions. Although CH4 and N2O emissions showed a trade-off relationship, switching from continuous flooding to intermittent irrigation methods considerably reduced the total global warming potential (GWP) of rice production [9,11,13], mainly owing to the reduction in CH4 emissions. On the contrary, Jiang et al. [15] reported that non-continuous flooding practices reduced CH4 emissions by 53% and increased N2O emissions by 105%, which contributed 12% on average to the combined global warming potential compared with continuous flooding by conducting a meta-analysis using 201 paired observations from 52 studies. More importantly, the magnitude of trade-offs between CH4 and N2O emissions from intermittent irrigation varied with soil type, drainage timing, drainage interval, duration, soil-drying severity, water stress level, and other management factors, such as fertilization [9,13,16]. Evidence suggested that CH4 and N2O emissions from rice fields can be strongly affected by N fertilization management [16,17,18,19].
N2O is primarily produced by nitrification and denitrification processes and influenced by available soil substrates (NO3, NH4+) [20,21]. Previous studies have sufficiently documented that N2O emissions from rice systems increased as N fertilization rates increased [6,22,23]. In contrast, when N fertilization inputs exceeded rice demand, a threshold response of N2O emissions to N fertilization rates was met [24]. The contributions of exogenous N fertilization for N2O production in rice fields using intermittent irrigation techniques are not well understood. Chemical fertilizations affect CH4 emissions from rice fields mainly through the following three processes: the production, transport, and oxidation of CH4 emissions [25]. Conflicting results regarding the effects of N rates on CH4 emissions during the rice-growing season have been reported, including stimulation [23,26], no effects [5], or inhibition [17], which are dependent on N fertilization species and rates [5,27,28]. Thus, an optimal fertilization regime is critical not only for regulating CH4 and N2O emissions but also for sustaining crop yields during rice growing.
Heilongjiang Province is a major rice-growing region where the black soil belt runs north to south, producing 27 million rice grains (4.0% of the total grain production in China) in 2019 [29]. The black soil zone in cold Northeastern China is the most important commodity grain base in China, and it is hailed as the “stabilizer” and “ballast stone” of China’s grain production due to its inherently fertile and productive characteristics. The rice-growing area markedly increased from 0.24 to 3.81 million ha between 1983 and 2019, and the total chemical fertilization application increased from 10.62 × 10⁵ t in 1983 to 52.93 × 10⁵ t in 2019 [29]. The expansion of rice areas and increases in N application levels not only resulted in significant GHG emissions [30,31] but also significant irrigation water consumption, causing the groundwater table to decline, which increased pumping costs for farmers. The importance of interactive effects between intermittent irrigation and N fertilization has been widely recognized, with the majority of research focusing mainly on double-cropping paddy fields in Southern China [5,16,26,31,32]; however, the interactive impacts still remain elusive. For instance, more recently, Shi et al. [16] investigated the effects of reduced irrigation and N application on GHG emissions in double-cropping rice paddy fields in Jiangxi Province, China. Their results indicated that early- and late-season rice decreased CH4 emissions by 14.5–37.4% and 16.7–52.3%, respectively, whereas they increased N2O emissions by 12.5–35.3% and 23.1–34.1%, respectively, under the same N fertilization management processes. This interaction involved a complex system that regulates GHG dynamics and yields variable cumulative emissions across soil types, rice-growing seasons, and locations, with large spatio-temporal variations [33]. The black soil zone in Northeastern China experiences long and cold winters and possesses relatively high levels of organic content in the soil. Thus, only single-cropping rice can be grown, as opposed to the major double-rice producing areas in Southern China. Therefore, the urgent need to mitigate GHG emissions while maintaining high rice yields has spurred research into the optimal interrelation between intermittent irrigation and N fertilization in cold black soil. However, not much is known about the measurement of GHG emissions at higher latitudes in cold regions, particularly the interactive impacts of water management and N fertilization on CH4 and N2O emissions. Thus, this study hypothesized that increasing N fertilization would reduce both N2O and CH4 emissions, and that water-saving irrigations would reduce CH4 while increasing N2O emissions beneficial to decreasing the GWP. Therefore, we conducted a field experiment at higher latitudes in cold Heilongjiang, Northeast China, with the objectives of (i) testing the individual positive or negative effects of N fertilization and water-saving irrigations on CH4 and N2O emissions, as well as its specific contributions to the GWP; (ii) evaluating the combined impacts of water-saving irrigations and N fertilizations on the GWP as well as rice production; and (iii) identifying efficient fertilization and water management practices to optimize rice yields while minimizing GHG emissions. The outcomes could make significant contributions toward achieving “Peak Carbon Dioxide Emissions” as well as sustainable rice crop production under a limited water resource regime.

2. Materials and Methods

2.1. Study Area

We conducted the field experiment in 2018 at the National Modern Agricultural Demonstration Park’s experimental station in Minzhu Town, Harbin City, China (45°49′ N, 126°48′ E.) on chernozem soil (Mollisols in USA-ST) (Figure 1). The site has an elevation of 117 m above mean sea level. The climate is cold temperate continental monsoon, with a mean annual temperature of 4.5 °C, and has mean winter and summer air temperatures of −18 °C, and 24 °C, respectively, as well as an effective accumulated temperature (≥10 °C) of 2968 °C. It has an annual sunshine time of 2668 h, a frostless period of 131–146 days, and a mean annual precipitation of 585 mm in the last 20 years, characterized by one main rainfall period in summer (July–September). This region is dominated by a typical single-cropping rice system. The soil type is Phaeozem, and the basic properties of soil were as follows: pH (1:5 soil:water) 7.4, total N 3.45 g kg−1, total P 0.89 g kg−1, total K 31.69 g kg−1, available N 79.77 mg kg−1, available P 56.81 mg kg−1, available K 167.41 mg kg−1, and soil organic matter 29.69 g kg−1.

2.2. Crop Management and Treatments

We conducted a split-plot experiment involving the irrigation regime and N rate in this study. The irrigation regime was the main factor comprising: (1) continuous flooding (W0), continuously flooded with a water depth of 10–15 cm until 1 week before crop harvesting; (2) intermittent irrigation (W1), submerged in a 0–2 cm water depth from transplanting to re-greening and then applied to a 3–7 cm water depth at a 7–9-day interval. This process was repeated until milk stage and then drained one week before rice harvest; and (3) control irrigation (W2), submerged in a 0–2 cm water depth from transplanting to re-greening and then applied to a 20–30 cm depth of water and finally drained one week before rice harvest. The second factor was N fertilization, which had six levels: no fertilization (N0, control), 60 kg N ha−1 (N60), 80 kg N ha−1 (N80), 100 kg N ha−1 (N100, 120 kg N ha−1 (N120), and 140 kg N ha−1 (N140). There were 18 treatments in total, and each treatment had three replicates. Each plot was 4 m × 4 m and was isolated by brick concrete, 1.2 m deep, between any two adjacent plots to prevent water and fertilization exchange. We set all plots under a rain shelter to control irrigation water usage.
We sowed a major japonica rice variety in this region, namely “Longdao 21”, in a nursery bed on 14 April; then, we transplanted rice seedlings to the paddies on 16 May and harvested on 19 September 2018. We applied the total amount of urea as N fertilization in three interventions: 50% as a basal application on 16 April, 30% as a re-greening topdressing on 25 May, and 20% as a tillering topdressing on 12 June. We employed P fertilization (P2O5, 55 kg ha−1) as the basal fertilization in all treatments. We applied potassium fertilization (K2O, 50 kg ha−1) with 50% as a basal application on 16 April and 50% at the returning green stage on 25 May.

2.3. N2O and CH4 Measurements

We simultaneously collected GHG samples using the static chamber technique. Transparent chambers with dimensions 40 cm × 30 cm × 50 cm (length × width × height) were made of acrylic sheets. Before rice transplanting, we permanently installed a PVC soil base frame (channel) of 15 cm height and 5 cm internal diameter in each plot to ensure reproducible placement of the gas-collecting chamber during the rice-growing period. The top edge of the frame had a groove (5 cm in depth and 2 cm in width) filled with water to ensure that the system was airtight during gas sampling. We attached a small battery-operated rotary fan to each chamber to guarantee complete gas mixing. Each chamber was wrapped with a layer of sponge and aluminum foil to minimize the air temperature changes inside the chamber during gas sampling. We collected gas samples from a silicone septum on top of the chamber by inserting a 50 mL airtight syringe attached to 24-gauge hypodermic needles with a 3-way stopcock into pre-evacuated vacuum tubes at 0-, 10- and 20-min intervals after closure. We recorded the headspace volume inside the chambers to calculate N2O and CH4 concentrations. We chose gas samples to correspond as closely as possible to the key growth stages of rice, which were collected from 9:00 a.m. to 11:00 a.m. on sunny days. We used an attached digital thermometer to measure the temperature inside the chamber. We stored gas samples in syringes and then in evacuated vials for <1 day before analysis on a gas chromatograph. We analyzed the gas samples using a modified gas chromatograph (Agilent 7890A, UMPA, Palmyra, PA, USA) equipped with a flame ionization detector (GC 8 A Series, Shimadzu, Japan) and an electron capture detector to obtain the CH4 and N2O concentrations. We equipped the gas chromatograph with a flame ionization detector (FID) to detect CH4 and an electron capture detector (ECD) to detect N2O. We used nitrogen and a gas mixture of argon and methane (95% Ar-5% CH4) as the carrier gases for CH4 and N2O, respectively. The oven temperature was 55 °C and the FID temperature was 200 °C. We determined fluxes of CH4 and N2O from the slope of the mixing ratio change with the four sequential samples. We only selected available sample sets when they followed a linear correlation coefficient value of R2 greater than 0.90. We sequentially accumulated cumulative CH4 and N2O emissions for the entire cropping period from the emissions averaged on every two adjacent measurement intervals [31,34]. We calculated the fluxes of CH4 and N2O using linear regression of the measured concentrations against sampling time.
F = ρ h 273 273 + T   dc dt
where F is the gas flux rate (mg m−2 h1), ρ is the gas density in the standard state, h is the height of the chamber above the water surface (m), dc/dt is the slope of the linear regression for gas concentration gradient through time, and T is the mean air temperature inside the chamber during sampling (°C). We calculated the cumulative gas emissions during the study period by integrating the gas emissions between every two adjacent measurement intervals [9].
We calculated the GWP of CH4 and N2O at 100-year time horizon using the following equation [35]:
GWP = t   CO 2   equivalent   ha 1 = 298 × GWP N 2 O + 34 × GWP CH 4
where GHGI represents greenhouse gas intensity.
GHGI ( t   CO 2   equivalent   t 1 ) = GWP rice   yields          

2.4. Plant Sampling and Estimation of Yields

At harvesting, we collected rice grains within 2 m × 2 m frames of each plot to calculate yield and yield components in triplicate. We air-dried and adjusted the grains to 14% moisture content. We also calculated the tiller number, seed-setting rate, 1000-kernel weight, and grain numbers per spike for each plot.

2.5. Data Analysis and Statistics

We conducted analysis of variance (ANOVA; least significant difference method) to assess the effects of N fertilization and water regimes on N2O and CH4 emissions, GWP, GHGI, and rice yield among treatments. All data were presented as mean ± SE (n = 3). We performed a pairwise mean comparison of treatments using Tukey’s honest significant difference test at a 5% level of probability (p ≤ 0.05). We performed the calculations with SPSS (version 21.0; SPSS Inc., Chicago, IL, USA) and drew the figures using Origin 12 (Origin Lab Corporation, Northampton, MA, USA).

3. Results

3.1. Climatic Data

Figure 2 depicts the climatic data for the rice-growing season. Throughout the rice-growing season, the mean temperature was 20.1 °C, with the mean maximum threshold recorded in July. On 16 April and 18 June, the maximum and minimum air temperatures were recorded at 1.6 °C and 38.0 °C, respectively. The total rainfall and sunshine times were 543.2 mm and 1581 h, respectively.

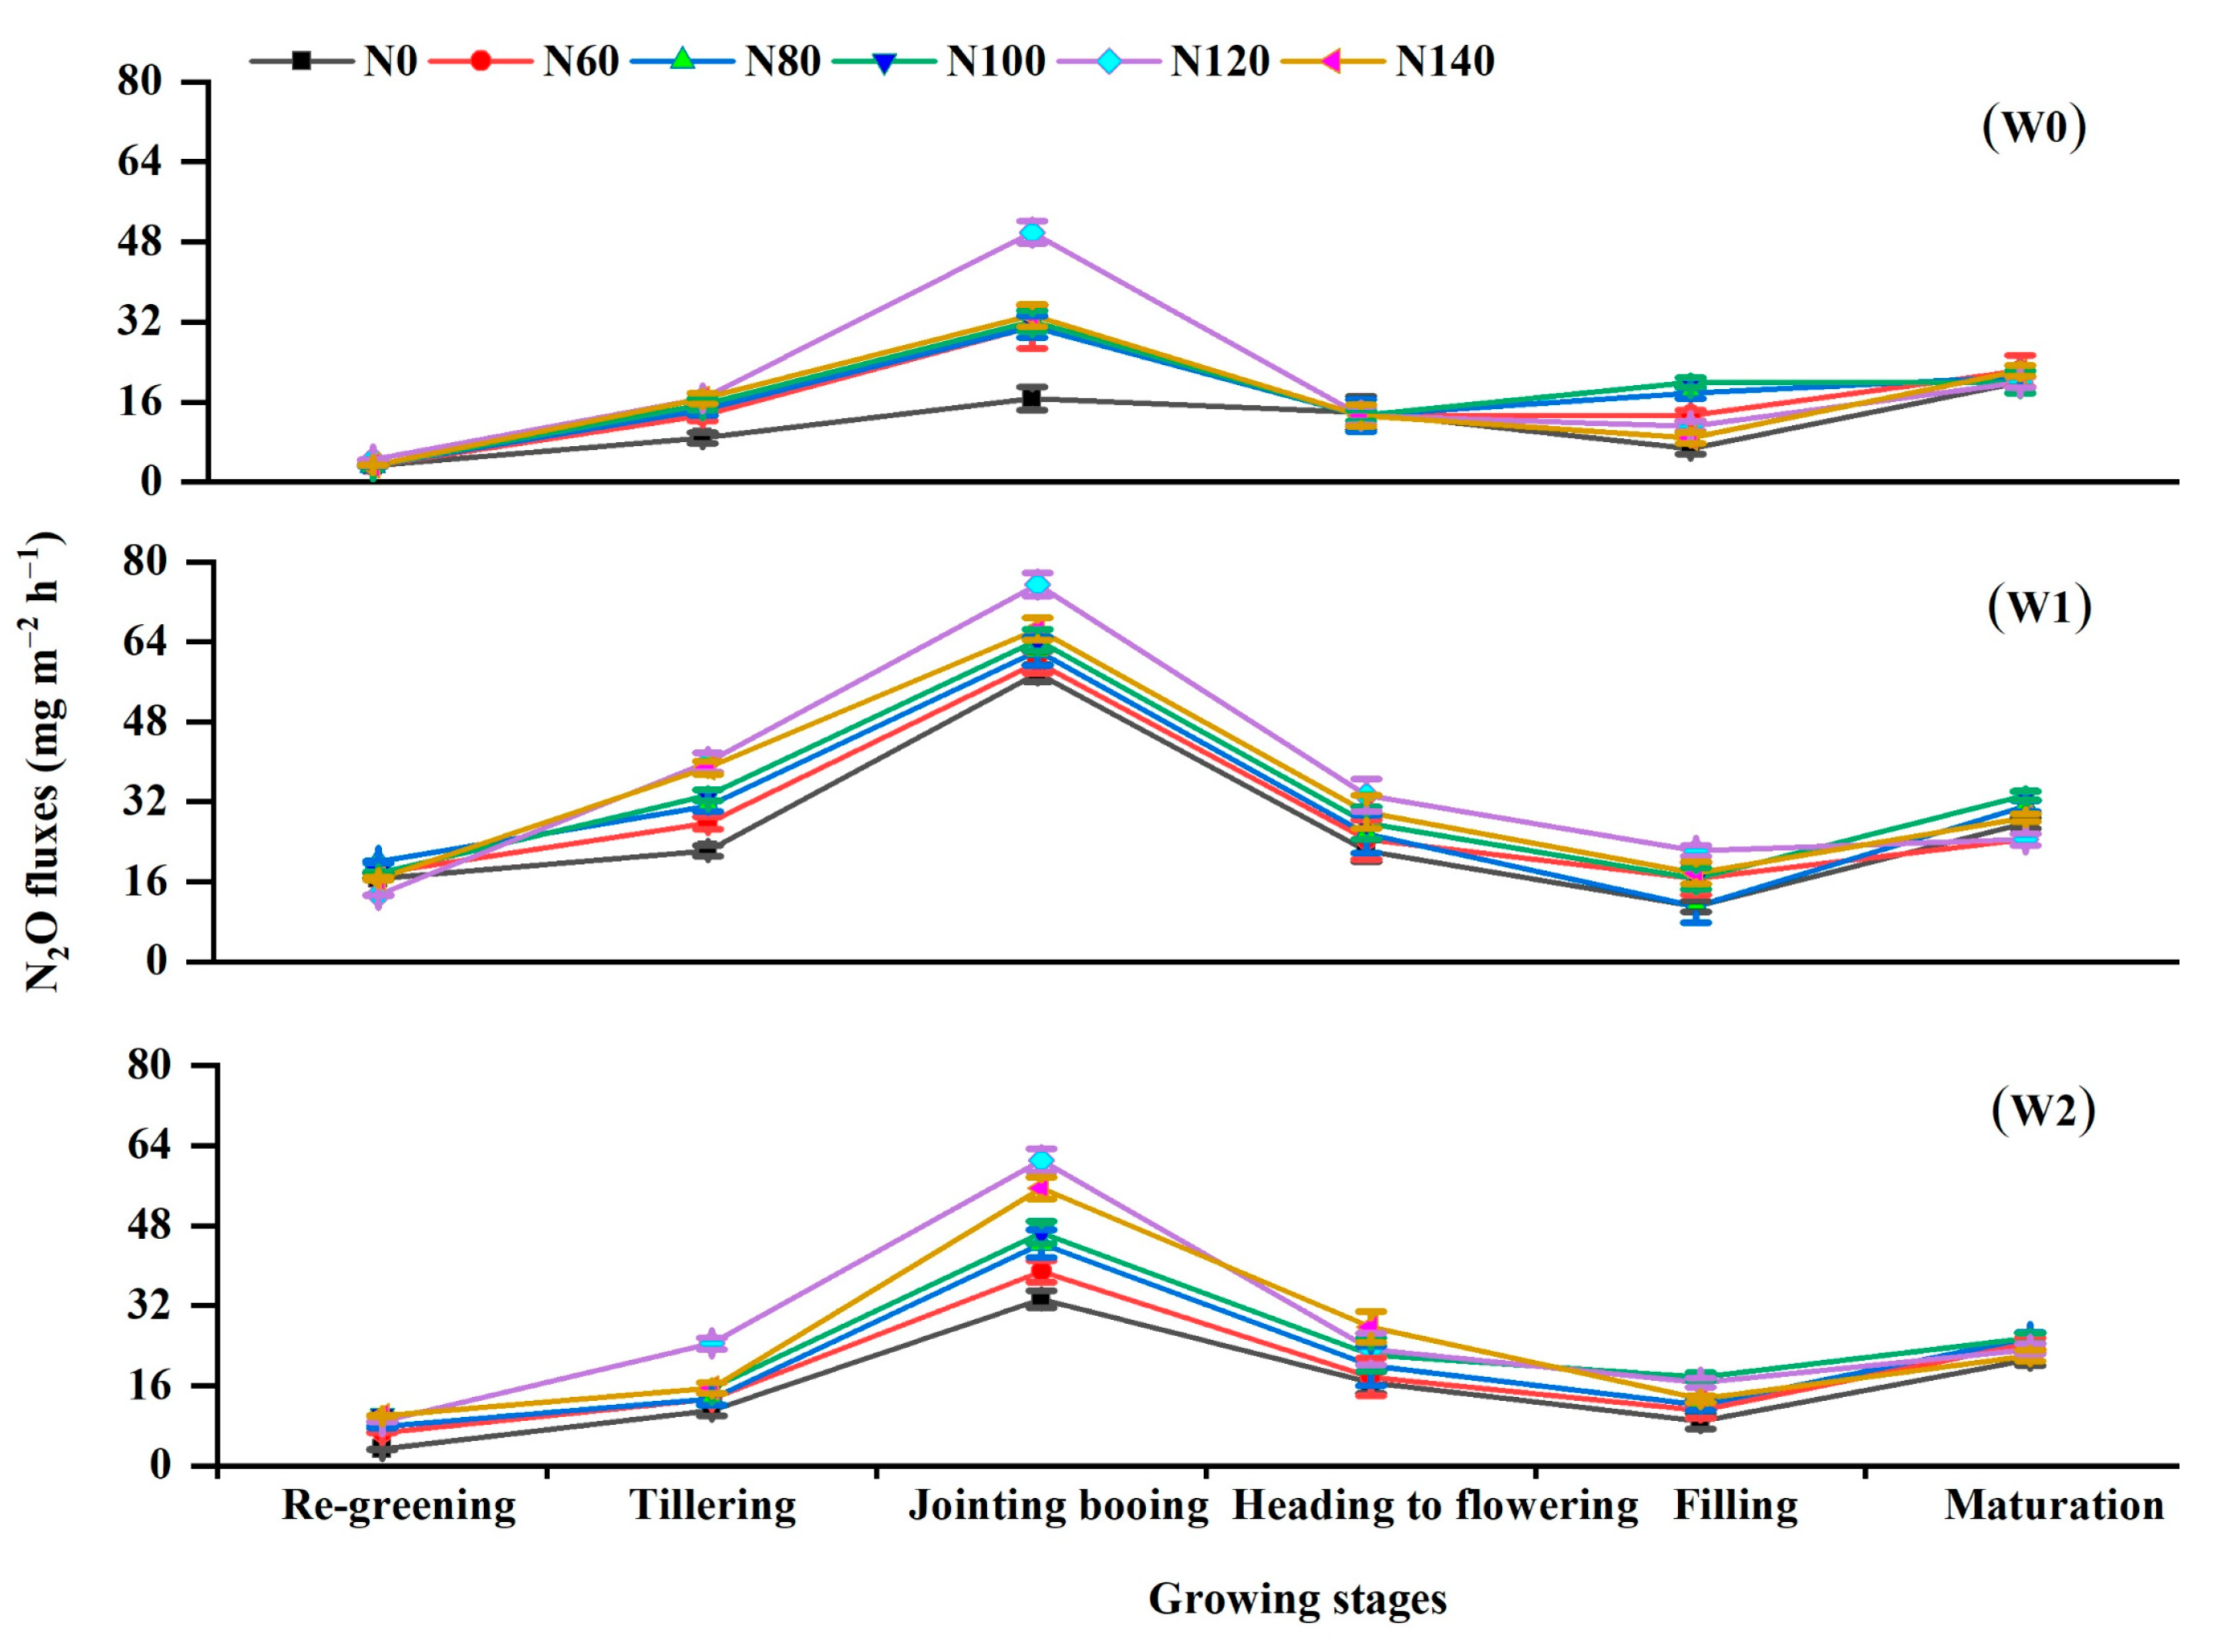
3.2. CH4 and N2O Fluxes

The dynamics of the measured CH4 fluxes are presented in Figure 3. They were characterized by a unimodal curve, which showed that the CH4 emissions steadily ascended with time, peaked at the tillering stage, gradually decreased by the jointing–booting stage, and then remained at low levels until the end of the rice season. Moreover, the CH4 emissions peaks reached as high as 40.47 mg m−2 h–1, 32.95 mg m–2 h–1, and 36.25 mg m–2 h–1 on average for the W0, W1, and W2 treatments, respectively. The average CH4 flux was highest for W0 (13.44 mg m−2 h−1), followed by W1 (10.06 mg m−2 h−1), and then W2 (10.87 mg m−2 h−1), except for the re-greening and maturation stages at the same N fertilization level. In all the water regimes, CH4 emissions were stimulated by low N promotion and prevented by high N fertilization (Figure 3).
Overall, N2O emission patterns were relatively low compared with CH4 emission patterns during the rice-growing seasons (Figure 4). Application of N fertilization at the tillering stage caused a sharp increase in flux in all treatments, which peaked at the jointing–booting stages. Except for a few small peaks at the maturation stage, the fluxes then gradually declined and remained elevated (Figure 4). Among the six N fertilization levels, the peaks were in the order of N120 > N140 > N100 > N80 > N60 > N0, except for N80 = N60 under W0. Furthermore, the peak N2O fluxes differed significantly among different water regimes. Compared with W0 irrigation, W1 and W2 produced peak N2O emissions that were on average 99.0% and 44.1% higher than that of the W0 irrigation after the second dressing, respectively. Among the different treatments, the highest N2O fluxes were observed under the W1N120 treatment, while the lowest N2O fluxes occurred under the W0N0 treatment.

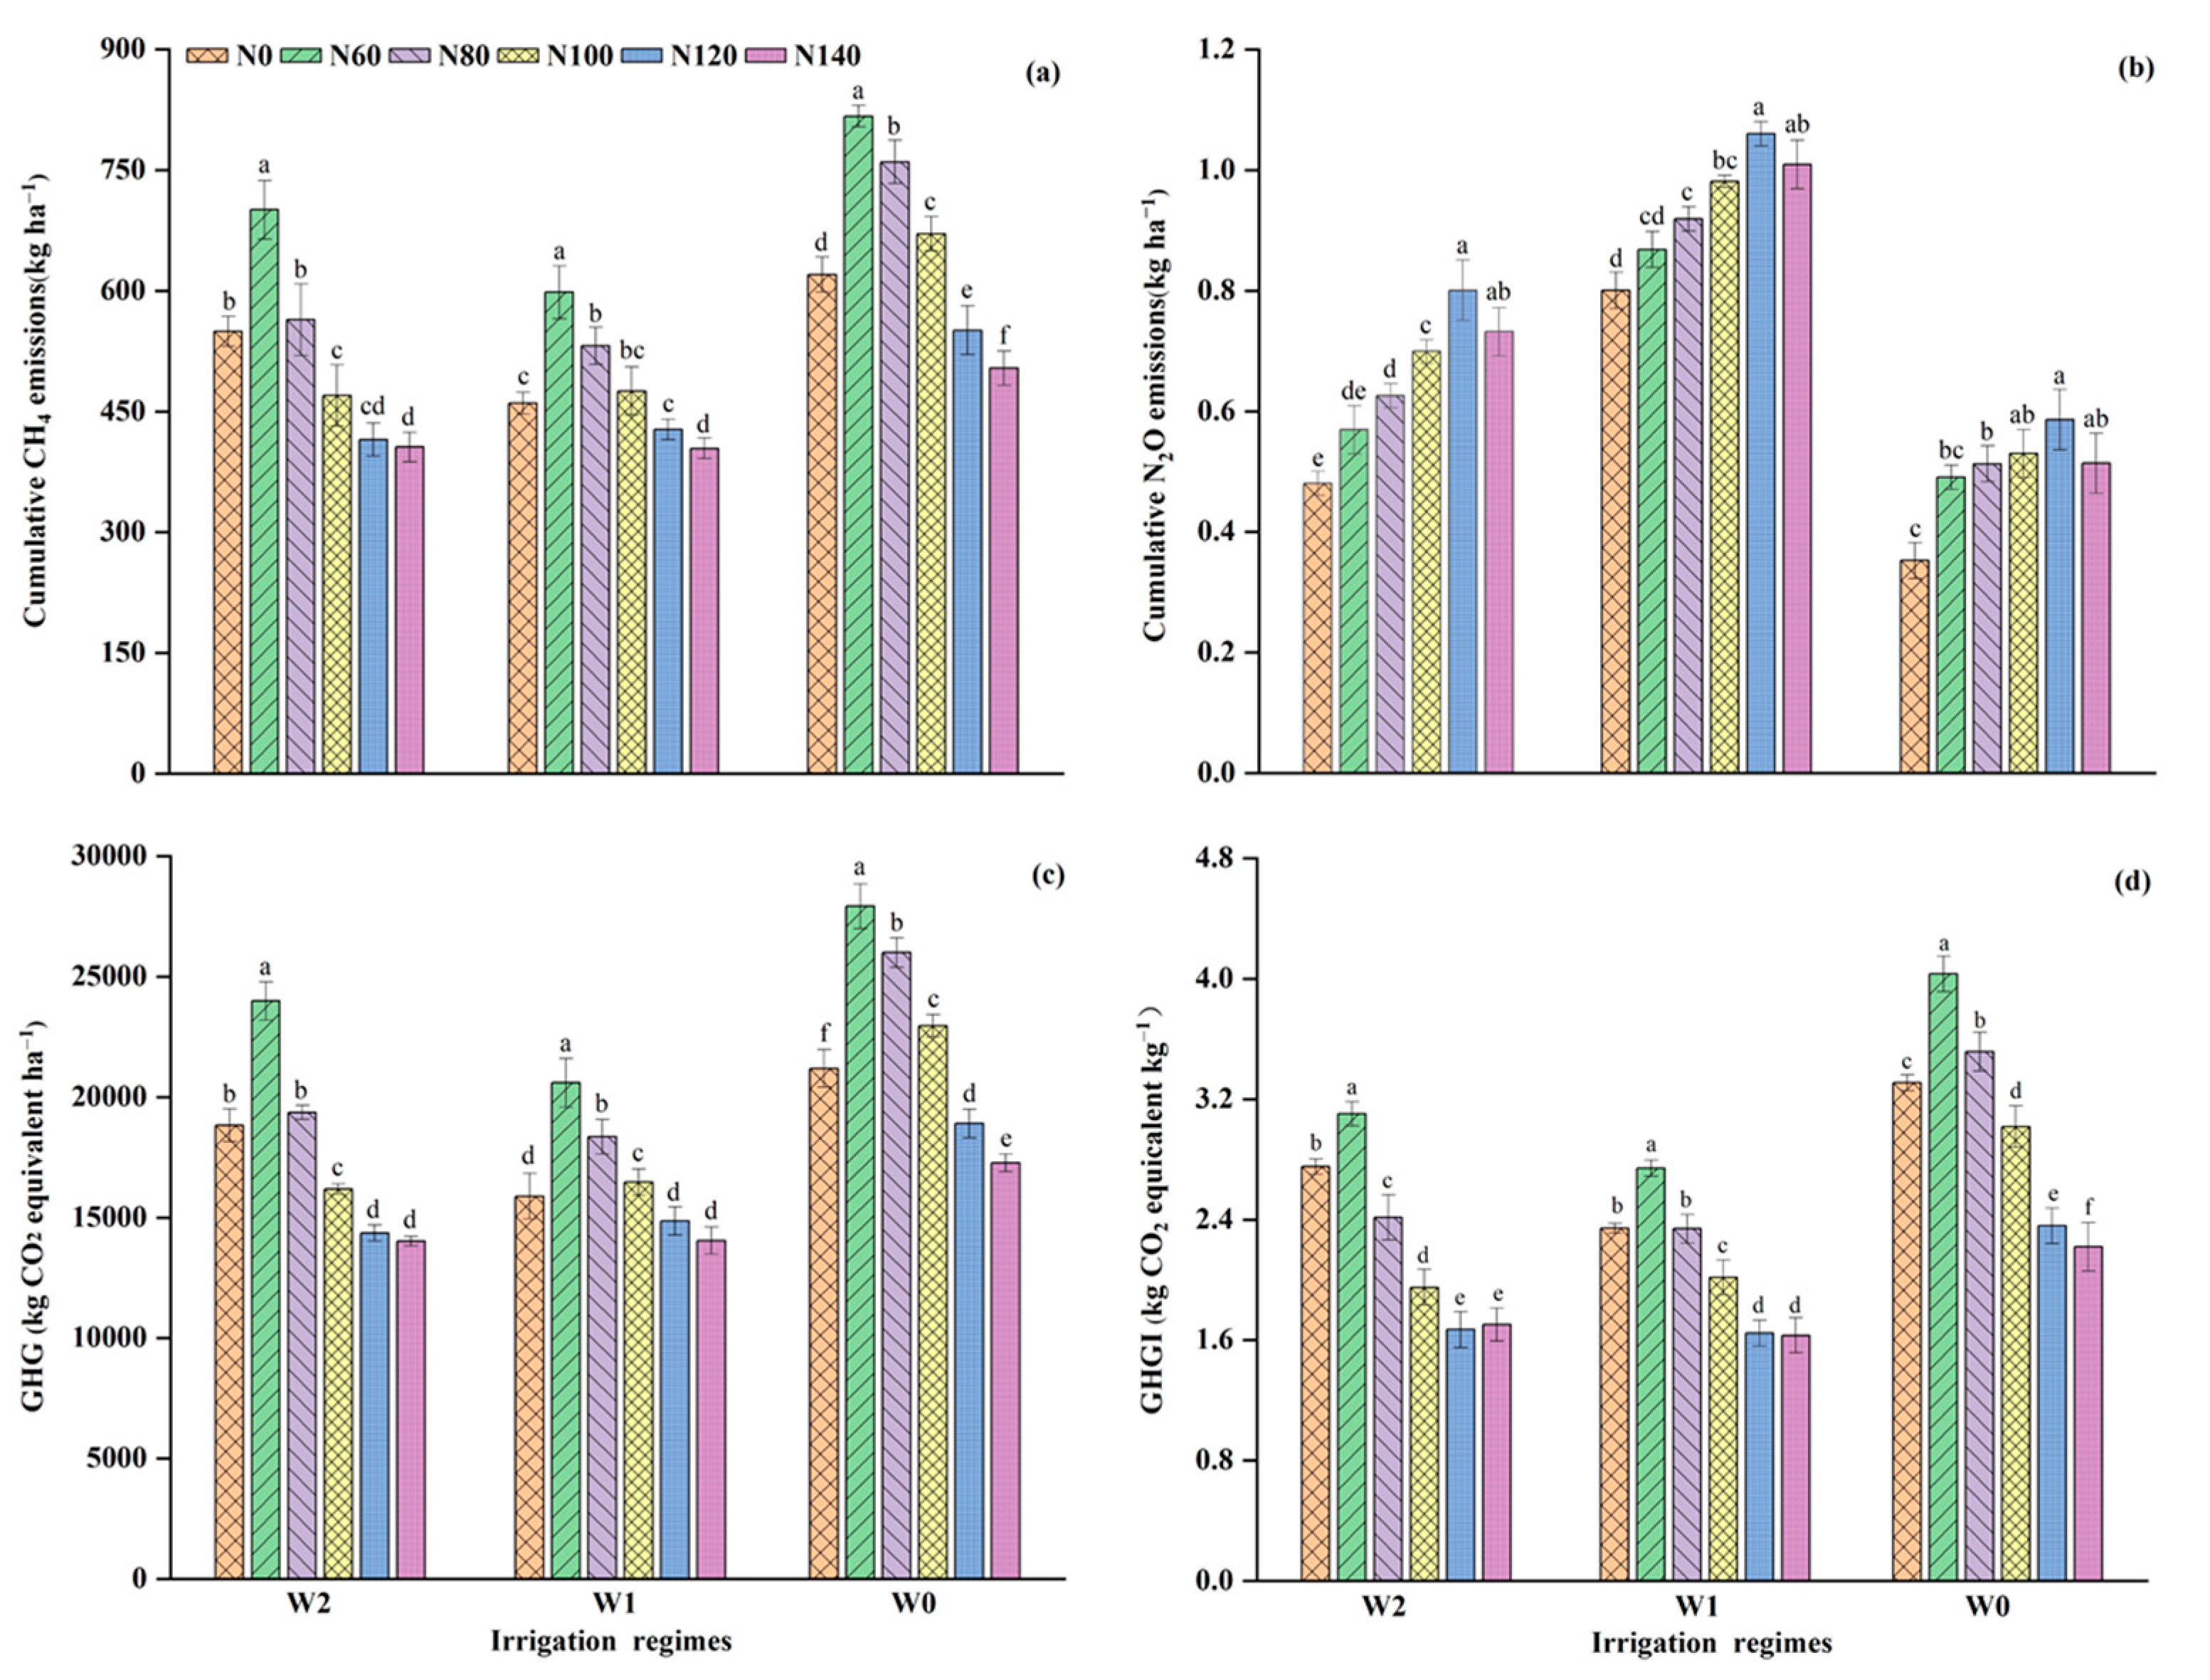
3.3. CH4 and N2O Emissions

The tillering and jointing–booting periods comprise considerable portions of growing-season CH4 emissions (Figure 5), accounting for 38.6% and 26.9%, respectively. The opposite trend in CH4 emissions was observed with increases in the N fertilization dosage. For example, mean cumulative CH4 emissions under W1 decreased by 28.5% and 32.4% at N120 and N140 compared with N60, despite the fact that there were no significant differences (p > 0.05) between them. A comparison of cumulative CH4 emissions measured with the different irrigation regimes revealed that the emissions in W1 and W2 significantly decreased by an average of 19.7–30.0% and 11.4–29.9% compared with W0, respectively.
On average, N2O emissions during the 10-day drainage at the jointing–booting periods accounted for 34.2% of the seasonal total, which was significantly higher than other growth stages (Figure 6). The effects of irrigation methods and N levels on N2O cumulative seasonal emissions were similar to those of CH4 emissions, as revealed in Figure 7b. The cumulative seasonal N2O fluxes responded strongly to N fertilization applications, increasing with N dosage but decreasing once the dosage exceeded 120 kg ha−1. For example, cumulative N2O emissions from W1N60 and W1N120 increased by almost 22.1%, whereas the increase between W1N120 and W1N140 slowed down to approximately 4.8%. In terms of irrigation treatment, W1 and W2 significantly decreased the cumulative seasonal N2O fluxes by 77.0–127.2% and 16.1–42.4%, respectively, compared with that in W0 under the corresponding N fertilization levels. The combination of W1 and N120 emitted the most N2O, approximately three times higher than the combination of W0 and N0, which emitted the least.

3.4. Grain Yield, GWP and GHGI

The combined irrigation regime and N fertilization application significantly affected grain yields (Table 1). Compared with W0, W1 and W2 both enhanced the mean rice yield by 5.9–12.7% and 0–4.7%, respectively, showing tendencies in the order of W1 > W2 > W0. Relative to N60, higher N fertilization rates enhanced rice yield by 4.9%, 8.6%, 15.8%, and 11.2% for the N80, N100, N120, and N140 treatments, respectively, under the same irrigation regime. However, there were no significant differences (p < 0.05) between N120 and N140 (Table 1). W1N120 produced the highest grain yield among all the treatments (Table 1). For the components of rice yield, the tillering number and grain number per spike with N fertilization application followed a similar tendency to yield except for 1000-kernel weight (Table 1). Under the corresponding N fertilization treatment, W1 significantly increased grain number per spike by 23.2–40.9% and 7.7–31.5% than W0 and W2 (p < 0.05) (Table 2).
The GWP induced by N2O and CH4 emissions during the rice-growing seasons is presented in Figure 7c. A comparison of the GWP across all the treatments showed that CH4 contributed 97.9–99.5% of GWP during the rice-growing season. While water regimes had a significant effect on the GWP, when comparing the corresponding treatments with W0, W1, and W2, the GWP was reduced by 18.7–29.4% and 11.1–19.5%, respectively. The GWP increased and then decreased with the increasing N dosage (Figure 7c). Within W1, compared with N0, the GWP for N60, N80, and N100 were significantly higher at 29.6%, 15.5%, and 3.6%, respectively (p < 0.05), whereas GWP for N120 and N140 were lower at 6.5% and 11.6%, respectively.
Under the same irrigation pattern, GHGI tended to decrease with increasing N dosage (Figure 7d), with the largest reduction occurring at a dosage of 140 kg N ha−1 by 22.5% when compared with N0. When the N rate exceeded 120 kg N ha−1, the mitigating effects of N applications on GHGI tended to decrease. For example, W1N80, W1N100, W1N120, and W1N140 significantly decreased GHGI by 1.2%, 14.0%, 29.8%, and 30.4%, respectively, relative to N0 (p < 0.05), with the exception of W1N60. Similar to the GWP, W1 and W2 significantly reduced the GHGI by 26.5–33.5% and 11.3–31.1% relative to W0. Moreover, W0 exhibited a greater warming effect on GHGI, and in combination with N60, resulted in the highest seasonal GHGI (3.78 ± 0.11 kgCO2 equivalent kg−1), whereas with N140, it resulted in the lowest seasonal GHGI (1.5 ± 0.1 kg CO2 equivalent kg−1). The two-way ANOVA confirmed that the irrigation regime and N fertilization significantly affected GHGI, and their interaction had a considerable impact (Table 3; Figure 7d). These results indicated that water-saving irrigation reduced the GWP of rice per unit yield. Under water-saving irrigation, a high N rate (N140) significantly (p < 0.05) reduced GHGI compared with N0, N60, N80, and N100; however, no significant difference was observed compared with N120 treatments (p > 0.05).

4. Discussion

4.1. CH4 Emissions

This study showed that CH4 emissions from rice fields in Heilongjiang Province exhibited a single-peak variation trend during the rice-growing period, with lower emissions at the regreening stage, peaking at the tillering stage, and then gradually decreasing. This is in line with previous research [36]. There are three possible interpretations for this result. First, the variational depth of the floodwater regulated the fluctuations in soil oxidation reduction conditions. Second, the relatively lower temperature in Heilongjiang Province suppressed CH4 emissions owing to slow organic matter degradation and low methanogens activity. Finally, the rising temperature enabled rice to grow stronger and more vigorously, increasing soil C availability for CH4 production [5]. Water regime influences CH4 emissions from rice fields, which can be attributed to several factors (e.g., soil moisture, O2 content, and organic matter degradation) that impact CH4 production, oxidation, and transportation [37]. Furthermore, CH4 fluxes and cumulative emissions significantly differed between the irrigation treatments. The higher CH4 emissions that occurred in W0 have been reported in similar studies [9,13,38]; however, our experiment provided further evidence that W0 stimulated production and substantially increased CH4 emissions in rice fields because the long-term high soil water content resulted in a reduction in soil redox potential, thus creating a favorable condition for CH4 production [9,37]. Similar measurements were also obtained where W1 exhibited the lowest peak and significantly lower cumulative CH4 emissions than W2 and W0 (Figure 3) over the entire growing season as a result of soil water conditions created by drying–wetting cycles after the tillering stage. This frequently created an aerobic soil environment favorable for inhibiting methanogenesis while accelerating methanotrophy, thus reducing CH4 emissions. This may be because intermittent irrigation promotes root system development, which increases the redox potential in the rhizosphere due to the strong root oxygen secretion ability, which ultimately inhibits CH4 production [6]. The net effect of CH4 production and oxidation in the soil is CH4 emissions from paddy fields. Zhang et al. [12] illustrated the mechanisms by which W1 significantly reduced CH4 production potential while slightly increasing CH4 oxidation potential with a stable carbon isotope technique. In the present study, CH4 fluxes and cumulative emissions were stimulated by low N rates; however, they were prevented by high N rates. Increasing N rates from 60 to 120 kg N ha−1 were consistent with the findings of Banger et al. [39], who reported that CH4 emissions were stimulated at low N rates but inhibited at high N rates across 33 study sites and 155 data pairs worldwide. A possible explanation is that the higher urea input might decrease soil pH and provide an unfavorable redox potential for methanogen growth and activity. Another possible explanation is that the availability of NH4+ enhances the activity of methanotrophic bacteria, thereby stimulating CH4 consumption. However, this differs slightly from the findings of Dong et al. [6], who showed that high-input N fertilization (150 and 225 N ha−1) had no effect on CH4 emissions in the same region of Harbin, China. This discrepancy may be attributed to the different floodwater depths and N rates. Dong et al. [6] used a floodwater depth of 5 cm rather than the 1–3 cm in the present study, and the higher floodwater depth caused significant N leaching losses, lowering available N concentrations. On the contrary, some other studies have found that increased N fertilization can promote CH4 production [40] and had no significant stimulation or mitigation effect by meta-analyses [22]. The mechanism of the effect of N fertilization on CH4 emissions from rice fields is complex and requires further investigation. The interaction between water and N fertilization had a significant effect on seasonal cumulative CH4 emissions (p < 0.01). In line with our hypothesis, the timing of irrigation altered how CH4 emissions changed when N fertilization increased.

4.2. N2O Emissions

N2O emissions are mainly produced by soil microbial nitrification and denitrification processes in the soil, which vary largely with irrigation regimes and the increase in N inputs in rice paddies [6,9]. In our analysis, the seasonal cumulative emissions of N2O increased as the N rate increased. Our data support previous studies that reported that the application of inorganic N fertilization enhances the NH4-N and NO3-N (substrate for nitrification and denitrification) content of soil [17], thus increasing N2O emissions. However, when the N rate exceeded 120 kg ha−1, the emission decreased, though the difference was not significant (p > 0.05), indicating a nonlinear response corresponding with the III model theory of Kim et al. [41]. These results agree with the findings of Pittelkow et al. [24] on the threshold effect of N fertilization rate on N2O emission. As N input continues to exceed the capacity of soil microbes to take up and utilize N, the emissions of N2O would slow down and eventually reach a steady state [6,41]. Water management significantly affected cumulative N2O emissions (Figure 7b). W1 and W2 increased N2O emissions by 16.1–42.4% and 77.0–127.2%, respectively, under identical fertilization conditions compared with W0, which is likely a result of the aerobic conditions that facilitated thorough nitrification due to improved aeration in W1 and W2, particularly alternate anaerobic and aerobic cycling in W1 compared with constant anaerobic conditions in W0. This results in increased nitrification and incomplete denitrification due to improving soil redox potential in accordance with the previously reported studies [9,42,43]. Thus, by enhancing the oxygenated soil pores, the cumulative N2O emissions of N120 increased by 27.4% compared with N60, whereas W2 irrigation increased by 16.09–42.4% and 77.0–127.2% compared with W0 and W1 irrigation. These findings demonstrated that the irrigation method is a more important factor for N2O emissions [40,44] and that N fertilization application has a significantly lower effect on N2O emissions than water management. Furthermore, under water-saving irrigation, the seasonal cumulative N2O emissions of the high N fertilization treatments were lower in W1 and W2 than that of the low N fertilization treatment, and the interaction of water and N fertilization had a significant effect on N2O (p < 0.01). This suggests that the effect of N fertilization on N2O emissions can only be stimulated under appropriate water conditions; therefore, the interactions between water and N fertilization cannot be ignored. Furthermore, the individual effects of N addition and water amendment on N2O fluxes are consistent with our hypothesis.

4.3. GWP, Yields and GHGI

In this study, the GWP was used as an indicator for the relative incidence of CH4 and N2O emissions in overall GHG emissions under different irrigation systems in combination with N fertilization application (Figure 7c). As expected, the GWP was mainly attributed to CH4 emissions, covering more than 97.9% during the rice-growing period. These findings were consistent with previous studies [6,43], which showed that the total GWP in rice fields was positively correlated with that of CH4 emissions. Despite this, our contribution rate of CH4 to GWP was higher than the results of Dong et al. [6] in the same high-cold regions. Based on our measurements, the adoption of W1 and W2 resulted in a mean decrease in the GWP by 26.3% and 21.6%, respectively, relative to W0. These reductions underlined that water-saving irrigation could effectively mitigate GWP, even if the decrease in CH4 emissions was partially offset by a slight increase in N2O emissions in the high-cold rice fields. Notably, the mitigation effect in our study was less obvious than that reported by Peyron et al. [45], who observed that intermittent irrigation can effectively reduce emissions by 83%. However, their analysis did not involve N application. Instead, their results were the consequences of combined actions, such as sampling frequency [6], rice variety [43], drainage frequency, duration, and the level of water stress [22]. Our results indicated that W1 irrigation had the most significant impact in the rice fields, followed by W2, which was similar to the findings of Dong et al. [6]. Intermittent irrigation could be an effective tool for reducing total GHG emissions without losing rice productivity [30] by controlling the limiting values of soil water potential related to specific stages and ineffective tillers, enhancing root growth and activities [5], and thereby increasing grain yield [46]. Moreover, by achieving a maximum drying index, the intermittent irrigation can maintain rice yield [47]. The effects of water management on rice yield vary with rice varieties and meteorological conditions. In this study, rice yields were also significantly influenced by N treatments and increased with N rates but decreased when the fertilization rate was higher than 120 kg ha−1. If crops competed more with soil N than nitrification and denitrification microbes, N2O emissions would not only be reduced, but rice production would also be insured [31], which was confirmed by our analysis (Table 3). Therefore, the W1N120 treatment is the best option for water regime–N fertilization incorporation in this area because it may be the reciprocal relationship between water and N fertilization that increases rice yield.
GHGI can be used to assess both GWP and potential economic benefits from crop production. Our analysis showed that W1 and W2 significantly reduced GHGI by 26.5% and 21.6%, respectively, with an increased rice yield compared with W0, which was within the range of previously reported studies [30] in Bangladesh, demonstrating that the adoption of the intermittent irrigation reduced GHGI by 21–43% compared with conventional irrigation regimes. Except for the N120 level, GHGI levels at high N rates (N140) (p < 0.05) were significantly lower than at other N rates under the same irrigation process, and the mitigating effects tended to decrease when the N rate was greater than 120 kg N ha−1. These results indicated that N fertilization increased rice yield more than GWP, resulting in a large reduction in the GHGI. Therefore, a balance exists between rice yield increase and GWP reduction by adjusting the N application rate, which is consistent with the results of a meta-analysis by Feng et al. [22]. W1 in combination with N120 had the lowest GHGI, which was proposed as a win–win strategy for mitigating the GWP while maintaining grain yields in rice fields. Although W1 increased grain yield in comparison with W0, the GHGI did not decrease, indicating that it may not achieve an optimal yield. Improving yields and reducing CH4 and N2O emissions in the cold rice field remain a great challenge for the future, and we hope to spur more work in this direction.

5. Conclusions

In this study, we found that water-saving irrigation processes suppressed CH4 emissions in comparison with W0. Seasonal cumulative CH4 emissions from W1 and W2 decreased by 19.7–30.0% and 11.4–29.9%, respectively, which mainly concentrated during the two growth stages of rice tillering and jointing–booting, whereas seasonal N2O emissions in W1 and W2 increased by 77.0–127.2% and 16.1–42.4% respectively, peaking at the jointing–booting stage; thus, the emissions mainly concentrated during this growing stage. The CH4 emissions from rice fields had a higher contribution to global warming potential (GWP), accounting for 97.9–99.6%, while N2O only accounted for a small portion. Moreover, water-saving irrigation was the best solution for GHG mitigation. W1 and W2 significantly decreased the GWP by 18.7–29.4% and 11.1–29.5%, respectively, compared with W0. The combination of water irrigation regimes and N fertilization had significant effects on rice grain yield, seasonal CH4 and N2O emissions, GWP, and GHGI. Based on our findings, we suggest that intermittent irrigation in combination with 120 kg N ha−1 N applications could be a potential option for mitigating the yield-scaled GWP without sacrificing grain yield in the high-cold rice fields of Northeast China. However, the long-term effects of this strategy on yield and greenhouse gases emissions should be further investigated.

Author Contributions

Investigation, funding acquisition, and writing manuscript, Y.S.; funding acquisition revision and editing, Y.L., Q.S. and Q.W.; conception, revision, and editing, X.L.; investigation and resources, L.J., X.Z., and Y.F. All authors have read and agreed to the published version of the manuscript.

Funding

This work was supported by the Open Project of Key Laboratory of Germplasm Enhancement and Physiology and Ecology of Food Crop in Cold Region of the Ministry of Education (CXSTOP202201), Strategic Priority Research Program of the Chinese Academy of Sciences (No. XDA28020401), National Key Research and Development Program of China (2017YFD0300105), National Natural Science Foundation of China (41671241, 41877325), Scientific Research Fees of Heilongjiang-affiliated Scientific research institutes (CZKYF2021-2-C027),the Heilongjiang Postdoctoral Foundation (LBH-Q18137), the Youth Innovation Promotion Association of Chinese Academy of Sciences (2018349), Ministry of Agriculture, P. R. China (AESMA-OPP-2019002).

Institutional Review Board Statement

Not applicable.

Informed Consent Statement

Not applicable.

Data Availability Statement

The data presented in this study are available on request from the corresponding author.

Acknowledgments

We thank our colleagues from the wetlands restoration and agriculture team of Northeast Institute of Geography and Agroecology, Chinese Academy of Sciences, for their valuable discussions.

Conflicts of Interest

The authors declare that they have no conflict of interest.

References

  1. Alexandratos, N.; Bruinsma, J. World Agriculture towards 2030/2050: The 2012 Revision; ESA Working Paper; FAO: Rome, Italy, 2012. [Google Scholar] [CrossRef]
  2. US E.P.A. Global Anthropogenic Non-CO2 Greenhouse Gas Emissions: 1990–2020; EPA 430-R-06-003; United States Environmental Protection Agency: Washington, DC, USA, 2006. [Google Scholar]
  3. Saunois, M.; Stavert, A.R.; Poulter, B.; Bousquet, P.; Canadell, J.G.; Jackson, R.B.; Raymond, P.A.; Dlugokencky, E.J.; Houweling, S.; Patra, P.K.; et al. The global methane budget 2000–2017. Earth Syst. Sci. Data 2020, 12, 1561–1623. [Google Scholar] [CrossRef]
  4. Ku, H.H.; Hayashi, K.; Agbisit, R.; Villegas-Pangga, G. Evaluation of fertilization and water management effect on rice performance and greenhouse gas intensity in different seasonal weather of tropical climate. Sci. Total Environ. 2017, 601, 1254–1262. [Google Scholar] [CrossRef]
  5. Cai, Z.C.; Shan, Y.H.; Xu, H. Effects of nitrogen fertilization on CH4 emissions from rice fields. Soil Sci. Plant Nutr. 2007, 53, 353–361. [Google Scholar] [CrossRef]
  6. Dong, W.J.; Guo, J.; Xu, L.J.; Song, Z.F.; Zhang, J.; Tang, A.; Zhang, X.J.; Leng, C.X.; Liu, Y.H.; Wang, L.M.; et al. Water regime-nitrogen fertilization incorporation interaction: Field study on methane and nitrous oxide emissions from a rice agroecosystem in Harbin, China. J. Environ. Sci. 2018, 64, 289–297. [Google Scholar] [CrossRef]
  7. Pan, J.F.; Liu, Y.Z.; Zhong, X.H.; Lampayan, R.M.; Singleton, G.R.; Huang, N.R.; Liang, K.M.; Peng, B.L.; Tian, K. Grain yield, water productivity and nitrogen use efficiency of rice under different water management and fertilization-N inputs in South China. Agr. Water Manag. 2017, 184, 191–200. [Google Scholar] [CrossRef]
  8. Zhuang, Y.; Zhang, L.; Li, S.S.; Liu, H.B.; Zhai, L.M.; Zhou, F.; Ye, Y.S.; Ruan, S.H.; Wen, W.J. Effects and potential of water-saving irrigation for rice production in China. Agric. Water Manag. 2019, 217, 374–382. [Google Scholar] [CrossRef]
  9. Wang, H.; Zhang, Y.; Zhang, Y.J.; McDaniel, M.D.; Sun, L.; Su, W.; Fan, X.R.; Liu, S.H.; Xiao, X. Water-saving irrigation is a “win-win” management strategy in rice paddies—with both reduced greenhouse gas emissions and enhanced water use efficiency. Agric. Water Manag. 2020, 228, 105889. [Google Scholar] [CrossRef]
  10. Nishimura, S.; Kimiwada, K.; Yagioka, A.; Hayashi, S.; Oka, N. Effect of intermittent drainage in reduction of methane emission from paddy soils in Hokkaido, Northern Japan. Soil Sci. Plant Nutr. 2020, 66, 360–368. [Google Scholar] [CrossRef]
  11. Islam, S.M.M.; Gaihre, Y.K.; Islam, M.R.; Al Mahmud, A.; Singh, U.; Sander, B.O. Effects of water management on greenhouse gas emissions from farmers’ rice fields in Bangladesh. Sci. Total Environ. 2020, 734, 139382. [Google Scholar] [CrossRef]
  12. Zhang, X.; Zhang, G.; Ji, Y.; Ma, J.; Xu, H.; Cai, Z.C. Straw application altered CH4 emission, concentration and 13C-isotopic signature of dissolved CH4 in a rice field. Pedosphere 2012, 22, 13–21. [Google Scholar] [CrossRef]
  13. Cowan, N.; Cowan, N.; Bhatia, A.; Jain, N.; Singh, R.; Tomer, R.; Kumar, V.; Kumar, O.; Prasanna, R.; Ramakrishnan, B. Experimental comparison of continuous and intermittent flooding of rice in relation to methane, nitrous oxide and ammonia emissions and the implications for nitrogen use efficiency and yield. Agric. Ecosyst. Environ. 2021, 319, 107571. [Google Scholar] [CrossRef]
  14. Linquist, B.A.; Anders, M.; Adviento-Borbe, M.; Chaney, R.L.; Nalley, L.L.; Da Rosa, E.F.F.; Van Kessel, C. Reducing greenhouse gas emissions water use, and grain arsenic levels in rice systems. Glob. Chang. Biol. 2015, 21, 407–417. [Google Scholar] [CrossRef]
  15. Jiang, Y.; Carrijo, D.; Huang, S.; Balaine, N.; Zhang, W.J.; van Groenigen, K.J.; Linquist, B. Water management to mitigate the global warming potential of rice systems: A global meta-analysis. Field Crop Res. 2019, 234, 47–54. [Google Scholar] [CrossRef]
  16. Shi, H.; Cai, S.; Sun, Z.X.; Shi, Y.Z. Water-use efficiency and greenhouse gas emissions of rice affected by water saving and nitrogen reduction. Agron. J. 2021, 113, 4777–4792. [Google Scholar] [CrossRef]
  17. Lan, T.; Zhang, H.; Han, Y.; Deng, O.P.; Tang, X.Y.; Luo, L.; Zeng, J.; Chen, G.D.; Wang, C.Q.; Gao, X.S. Regulating CH4, N2O, and NO emissions from an alkaline paddy field under rice-wheat rotation with controlled release N fertilization. Environ. Sci. Pollut. R 2021, 28, 18246–18259. [Google Scholar] [CrossRef]
  18. Souza, R.; Yin, J.; Calabrese, S. Optimal drainage timing for mitigating methane emissions from rice paddy fields. Geoderma 2021, 394, 114986. [Google Scholar] [CrossRef]
  19. Zheng, J.; Fan, J.L.; Zhang, F.C.; Guo, J.J.; Yan, S.C.; Zhuang, Q.L.; Cui, N.B.; Guo, L. Interactive effects of mulching practice and nitrogen rate on grain yield, water productivity, fertilization use efficiency and greenhouse gas emissions of rainfed summer maize in northwest China. Agric. Water Manag. 2021, 248, 106778. [Google Scholar] [CrossRef]
  20. Migliorati, M.D.; Scheer, C.; Grace, P.R.; Rowlings, D.W.; Bell, M.; McGree, J. Influence of different nitrogen rates and DMPP nitrification inhibitor on annual N2O emissions from a subtropical wheat-maize cropping system. Agric. Ecosyst. Environ. 2014, 186, 33–43. [Google Scholar] [CrossRef] [Green Version]
  21. Wang, G.S.; Liang, Y.P.; Zhang, Q.; Jha, S.K.; Gao, Y.; Shen, X.J.; Sun, J.S.; Duan, A.W. Mitigated CH4 and N2O emissions and improved irrigation water use efficiency in winter wheat field with surface drip irrigation in the North China Plain. Agric. Water Manag. 2016, 163, 403–407. [Google Scholar] [CrossRef]
  22. Feng, J.F.; Chen, C.Q.; Zhang, Y.; Song, Z.W.; Deng, A.X.; Zheng, C.Y.; Zhang, W.J. Impacts of cropping practices on yield-scaled greenhouse gas emissions from rice fields in China: A meta-analysis. Agric. Ecosyst. Environ. 2013, 164, 220–228. [Google Scholar] [CrossRef]
  23. Zhou, M.; Zhu, B.; Brüggemann, N.; Wang, X.G.; Zheng, X.H.; Butterbach-Bahl, K. Nitrous oxide and methane emissions from a subtropical rice-rapeseed rotation system in China: A 3-year field case study. Agric. Ecosyst. Environ. 2015, 212, 297–309. [Google Scholar] [CrossRef]
  24. Pittelkow, C.M.; Adviento-Borbe, M.A.; Hill, J.E.; Six, J.; van Kessel, C.; Linquist, B.A. Yield-scaled global warming potential of annual nitrous oxide and methane emissions from continuously flooded rice in response to nitrogen input. Agric. Ecosyst. Environ. 2013, 177, 10–20. [Google Scholar] [CrossRef]
  25. Hussain, S.; Peng, S.B.; Fahad, S.; Khaliq, A.; Huang, J.L.; Cui, K.H.; Nie, L.X. Rice management interventions to mitigate greenhouse gas emissions: A review. Environ. Sci. Pollut. Res. 2015, 22, 3342–3360. [Google Scholar] [CrossRef]
  26. Zhou, G.P.; Gao, S.J.; Lu, Y.H.; Liao, Y.L.; Nie, J.; Cao, W.D. Co-incorporation of green manure and rice straw improves rice production, soil chemical, biochemical and microbiological properties in a typical paddy field in Southern China. Soil Till Res. 2020, 197, 104499. [Google Scholar] [CrossRef]
  27. Linquist, B.A.; Adviento-Borbe, M.A.; Pittelkow, C.M.; van Kessel, C.; van Groenigen, K.J. Fertilization management practices and greenhouse gas emissions from rice systems: A quantitative review and analysis. Field Crop Res. 2012, 135, 10–21. [Google Scholar] [CrossRef]
  28. Guo, C.; Ren, T.; Li, P.F.; Wang, B.; Zou, J.L.; Hussain, S.; Cong, R.H.; Wu, L.S.; Lu, J.W.; Li, X.K. Producing more grain yield of rice with less ammonia volatilization and greenhouse gases emission using slow controlled-release urea. Environ. Sci. Pollut. Res. 2019, 26, 2569–2579. [Google Scholar] [CrossRef]
  29. Heilongjiang Bureau of Statistics. Heilongjiang Statistical Yearbook; China Statistics Press: Beijing, China, 2020.
  30. Haque, M.M.; Biswas, J.C.; Maniruzzaman, M.; Hossain, M.B.; Islam, M.R. Water management and soil amendment for reducing emission factor and global warming potential but improving ice yield. Paddy Water Environ. 2021, 19, 515–527. [Google Scholar] [CrossRef]
  31. Wang, J.; Jia, X.; Xiong, Z.; Khalil, M.; Xing, G. Water regime–nitrogen fertilizer-straw incorporation interaction: Field study on nitrous oxide emissions from a rice agroecosystem in Nanjing, China. Agric. Ecosyst. Environ. 2011, 141, 437–446. [Google Scholar] [CrossRef]
  32. Li, L.; Li, F.; Dong, Y. Greenhouse gas emissions and global warming potential in double- cropping rice fields as influenced by two water-saving irrigation modes in South China. J. Soil Sci. Plant Nutr. 2020, 20, 2617–2630. [Google Scholar] [CrossRef]
  33. Chakraborty, A.; Bhattacharya, D.K.; Li, B.L. Spatiotemporal dynamics of methane emission from rice fields at global scale. Ecol. Complex 2006, 3, 231–240. [Google Scholar] [CrossRef]
  34. Zou, J.; Huang, Y.; Jiang, J.; Zheng, X.; Sass, R. A 3-year field measurement of methane and nitrous oxide emissions from rice paddies in China: Effects of water regime, crop residue, and fertilizer application. Glob. Biogeochem. 2005, 19, 153–174. [Google Scholar] [CrossRef]
  35. Maucieri, C.; Zhang, Y.; McDaniel, M.D.; Borin, M.; Adams, M.A. Short−term effects of biochar and salinity on soil greenhouse gas emissions from a semi-arid Australian soil after re-wetting. Geoderma 2017, 307, 267–276. [Google Scholar] [CrossRef]
  36. Xiao, W.C.; Jia, H.W.; Qiu, X.K.; Huang, W.Y. Effects of irrigation adjusted by rainfall on emissions of CH4 and N2O from paddy fields. J. Irrig. Drain. 2017, 36, 36–40. (In Chinese) [Google Scholar] [CrossRef]
  37. Mosier, A.; Wassmann, R.; Verchot, L.; King, J. Methane and nitrogen oxide fluxes in tropical agricultural soils: Sources, sinks and mechanisms. Environ. Dev. Sustain. 2004, 6, 11–49. [Google Scholar] [CrossRef]
  38. Win, K.T.; Nonaka, R.; Win, A.T.; Sasada, Y.; Toyota, K.; Motobayashi, T. Effects of water saving irrigation and rice variety on greenhouse gas emissions and water use efficiency in a paddy field fertilized with anaerobically digested pig slurry. Paddy Water Environ. 2015, 13, 51–60. [Google Scholar] [CrossRef]
  39. Banger, K.; Tian, H.; Lu, C. Do nitrogen fertilizers stimulate or inhibit methane emissions from rice fields? Glob. Chang. Biol. 2012, 18, 3259–3267. [Google Scholar] [CrossRef]
  40. Liao, B.; Wu, X.; Yu, Y.; Luo, S.Y.; Hu, R.G.; Lu, G.A. Effects of mild alternate wetting and drying irrigation and mid-season drainage on CH4 and N2O emissions in rice cultivation. Sci. Total Environ. 2020, 698, 134212. [Google Scholar] [CrossRef]
  41. Kim, D.G.; Hernandez-Ramirez, G.; Giltrap, D. Linear and nonlinear dependency of direct nitrous oxide emissions on fertilization nitrogen input: A meta-analysis. Agric. Ecosyst. Environ. 2013, 168, 53–65. [Google Scholar] [CrossRef]
  42. Xu, P.; Zhang, Y.S.; Gong, W.W.; Hou, X.K.; Kroeze, C.; Gao, W.; Luan, S.J. An inventory of the emission of ammonia from agricultural fertilization application in China for 2010 and its high-resolution spatial distribution. Atmos. Environ. 2015, 115, 141–148. [Google Scholar] [CrossRef]
  43. Feng, Z.Y.; Qin, T.; Du, X.Z.; Sheng, F.; Li, C.F. Effects of irrigation regime and rice variety on greenhouse gas emissions and grain yields from paddy fields in central China. Agric. Water Manag. 2021, 250, 106830. [Google Scholar] [CrossRef]
  44. Chidthaisong, A.; Cha-un, N.; Rossopa, B.; Buddaboon, C.; Kunuthai, C.; Sriphirom, P.; Towprayoon, S.; Tokida, T.; Padre, A.T.; Minamikawa, K. Evaluating the effects of alternate wetting and drying (AWD) on methane and nitrous oxide emissions from a paddy field in Thailand. Soil Sci. Plant Nutr. 2016, 64, 31–38. [Google Scholar] [CrossRef] [Green Version]
  45. Peyron, M.; Bertora, C.; Pelissetti, S.; Said-Pullicino, D.; Celi, L.; Miniotti, E.; Romani, M.; Sacco, D. Greenhouse gas emissions as affected by different water management practices in temperate rice paddies. Agric. Water Manag. 2016, 232, 17–28. [Google Scholar] [CrossRef]
  46. Yang, S.H.; Liu, X.J.; Liu, X.Y.; Xu, J.Z. Effect of water management on soil respiration and NEE of paddy fields in Southeast China. Paddy Water Environ. 2017, 15, 787–796. [Google Scholar] [CrossRef]
  47. Quang, L.X.; Nakamura, K.; Hung, T.; Tinh, N.V.; Matsuda, S.; Kadota, K.; Horino, H.; Hai, P.T.; Komatsu, H.; Hasegawa, K. Effect of organizational paddy water management by a water user group on methane and nitrous oxide emissions and rice yield in the Red River Delta, Vietnam. Agric. Water Manag. 2019, 217, 179–192. [Google Scholar] [CrossRef]
Figure 1. The map of the experimental site.
Ijerph 19 16506 g001
Figure 2. Climatic data for the rice-growing season.
Ijerph 19 16506 g002
Figure 3. Variations in CH4 fluxes as affected by irrigation regimes with different N application rates during the rice-growing period. W0, W1, and W2 represent continuous flooding, intermittent irrigation, and control irrigation, respectively. Urea application at rates of 0 (N0), 60 (N60), 80 (N80), 100 (N100), 120 (N120), and 140 (N140) kg N ha−1.
Ijerph 19 16506 g003
Figure 4. Variations in N2O fluxes, as affected by irrigation regimes with different N application rates during the rice-growing period. W0, W1, and W2 represent continuous flooding, intermittent irrigation, and control irrigation (W2), respectively. Urea application at rates of 0 (N0), 60 (N60), 80 (N80), 100 (N100), 120 (N120), and 140 (N140) kg N ha1.
Ijerph 19 16506 g004
Figure 5. Seasonal CH4 emissions affected by irrigation regimes with different N application rates during the rice-growing period. W0, W1, and W2 represents continuous flooding, intermittent irrigation, and control irrigation (W2), respectively. Urea application at rates of 0 (N0), 60 (N60), 80 (N80), 100 (N100), 120 (N120), and 140 (N140) kg N ha−1. Values followed by the different letter are significant different at p < 0.05.
Ijerph 19 16506 g005
Figure 6. Seasonal N2O emissions affected by irrigation regimes with different N application rates during the rice-growing period. W0, W1, and W2 represent continuous flooding, intermittent irrigation, and control irrigation (W2), respectively. Urea application at rates of 0 (N0), 60 (N60), 80 (N80), 100 (N100), 120 (N120), and 140 (N140) kg N ha−1. Values followed by the different letter are significant different at p < 0.05.
Ijerph 19 16506 g006
Figure 7. Cumulative emissions of (a) CH4, (b) N2O, (c) total global warming potential (GWP), and (d) greenhouse gas intensity (GHGI) affected by irrigation regimes with different N application rates. Different lowercase letters above the standard error bars indicate significant differences among treatments during the rice-growing season (p < 0.05). Values followed by the different letter are significant different at p < 0.05.
Ijerph 19 16506 g007
Table 1. Effective tillering numbers, grain numbers per spike, 1000-kernel weight, and grain yield induced by water irrigation regime and N fertilization over the rice-growing season.
Water RegimesTreatmentEffective Tillering NumbersGrains Numbers per Panicle1000-Kernel Weight (g)Grain Yield (kg ha−1)
Flooding Irrigation (W0)W0N010.7 ± 0.4 e52.8 ± 0.2 d28.4 ± 0.4 a6830.0 ± 120.2 e
W0N6016.1 ± 0.4 cd54.6 ± 0.3 d29.4 ± 0.4 a7387.6 ± 121.3 d
W0N8016.5 ± 0.5 c69.1 ± 1.1 d26.9 ± 0.6 bc7886.7 ± 164.6 cd
W0N10019.5 ± 0.5 ab85.8 ± 1.4 c26.5 ± 0.7 bc8114.7 ± 158.7 bc
W0N12020.4 ± 0.3 a91.4 ± 0.9 a27.5 ± 0.5 b8550.0 ± 180.5 a
W0N14019.3 ± 0.3 ab89.2 ± 0.8 b26.0 ± 0.5 c8300.0 ± 105.1 b
Intermittent irrigation (W2)W1N014.3 ± 0.5 c71.8 ± 1.2 d27.1 ± 0.2 a7233.3 ± 105.1 f
W1N6016.2 ± 0.6 ac74.4 ± 1.2 d27.2 ± 0.2 a8013.2 ± 120.6 e
W1N8018.7 ± 0.8 ab97.1 ± 1.7 b27.8 ± 0.2 a8370.0 ± 86.1 d
W1N10019.7 ± 0.8 a101.8 ± 1.8 a27.7 ± 0.2 a8716.7 ± 87.8 b
W1N12016.6 ± 0.6 b96.5 ± 1.2 bc27.1 ± 0.2 a9633.6 ± 220.4 a
W1N14014.3 ± 0.5 c71.8 ± 1.2 d27.1 ± 0.2 a9187.0 ± 165.6 c
Controlled irrigation (W3)W2N010.7 ± 0.4 e52.8 ± 0.2 d28.4 ± 0.4 a6841.4 ± 25.6 e
W2N609.2 ± 1.2 e60.2 ± 0.8 e27.2 ± 1.1 b7732.3 ± 49.7 d
W2N8014.2 ± 0.5 d69.3 ± 1.1 c26.9 ± 0.5 c8017.7 ± 116.5 bc
W2N10016.4 ± 0.6 c73.3 ± 1.1 d25.9 ± 0.5 c8300.9 ± 156.4 b
W2N12018.6 ± 0.7 b85.1 ± 1.2 b25.3 ± 0.6 c8601.7 ± 113.3 a
W2N14020.0 ± 0.4 a94.8 ± 1.1 a27.5 ± 0.6 a8234.8 ± 186.5 b
Note: Values followed by the different letter are significant different at p < 0.05.
Table 2. Correlation analysis between rice yield and yield components.
TraitEffective TilleringGrains per Panicle1000-Kernel WeightYield
Effective tillerings1
Grains numbers per panicle0.810 **1
1000-kernel weight0.180 ns0.286 ns1
Yield0.783 **0.927 **0.179 ns1
Note: “ns” means no significant difference; ** mean significant difference at the level of 0.05 and 0.01, respectively.
Table 3. Two-way ANOVA analysis of rice yield; average CH4 and N2O flux; and seasonal emissions of CH4, N2O, GWP, and GHGI under N fertilization and water regimes (W), as well as their interactions (n = 3).
SourceGrain YieldAverage
CH4 Flux
Average N2O Flux CH4
Emissions
N2O
Emissions
GWPGHGI
W****ns**ns***
N**ns*****ns**
W × Nns*********
ns: insignificant; *: significant at 0.05 level; **: significant at 0.01 level. GWP and GHGI represent the global warming potential and total GWP in terms of grain yield, respectively. ANOVA: analysis of variance.
Publisher’s Note: MDPI stays neutral with regard to jurisdictional claims in published maps and institutional affiliations.

