
Accuracy of Vegetation Indices in Assessing Different Grades of Grassland Desertification from UAV

Abstract
:1. Introduction
2. Materials and Methods
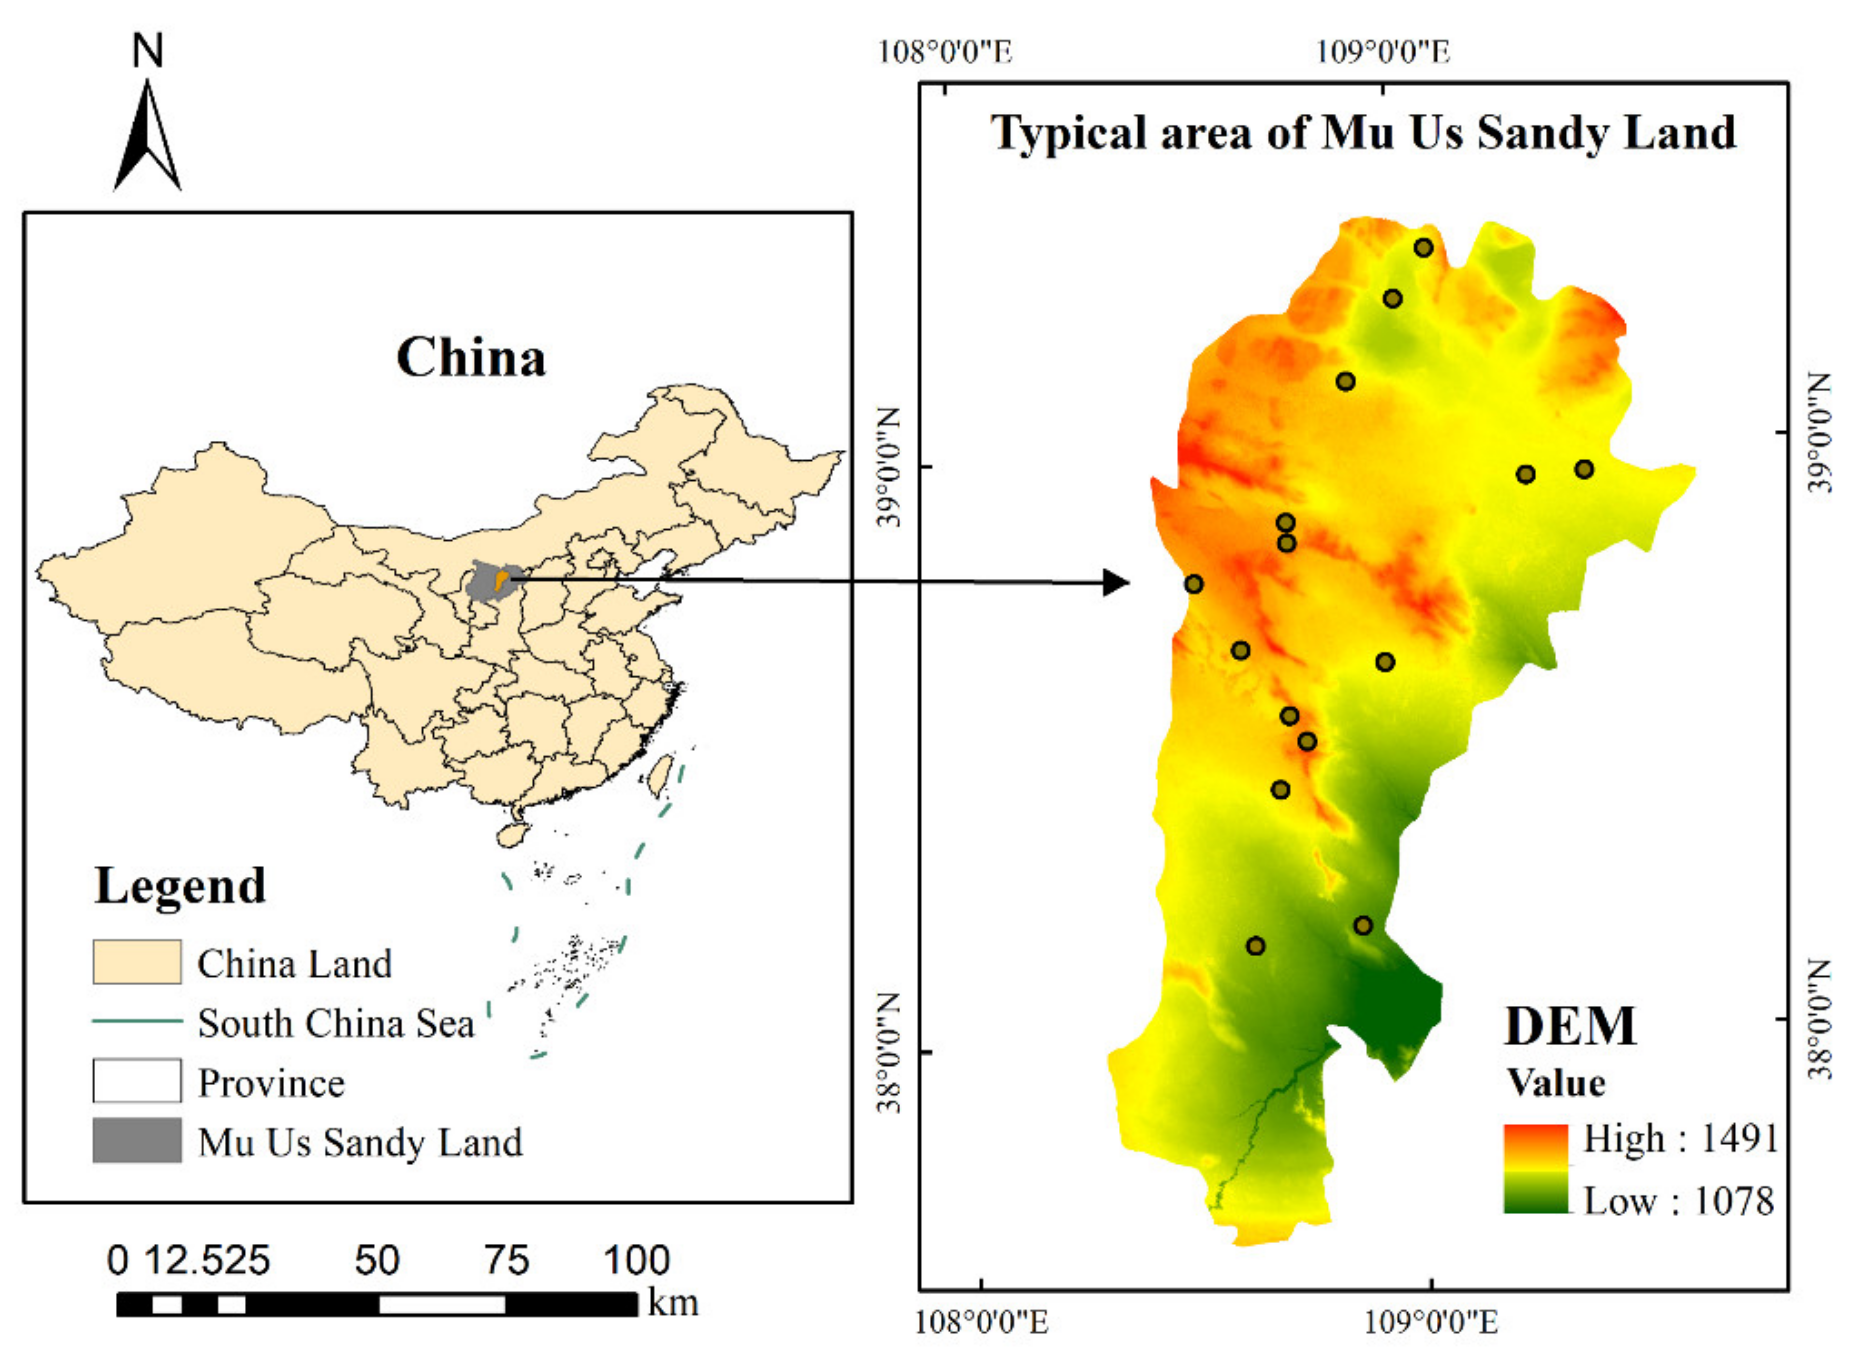
2.1. Study Area
2.2. UAV Visible Light Image Acquisition
2.3. Supervised Classification and Desertification Grades
2.4. Vegetation Index Assessment of Desertification
2.5. Accuracy Verification and Statistical Analysis
3. Results
3.1. UAV Visible Light Image Surveillance Classification
3.2. Visible Light Vegetation Index Accuracy Assessment
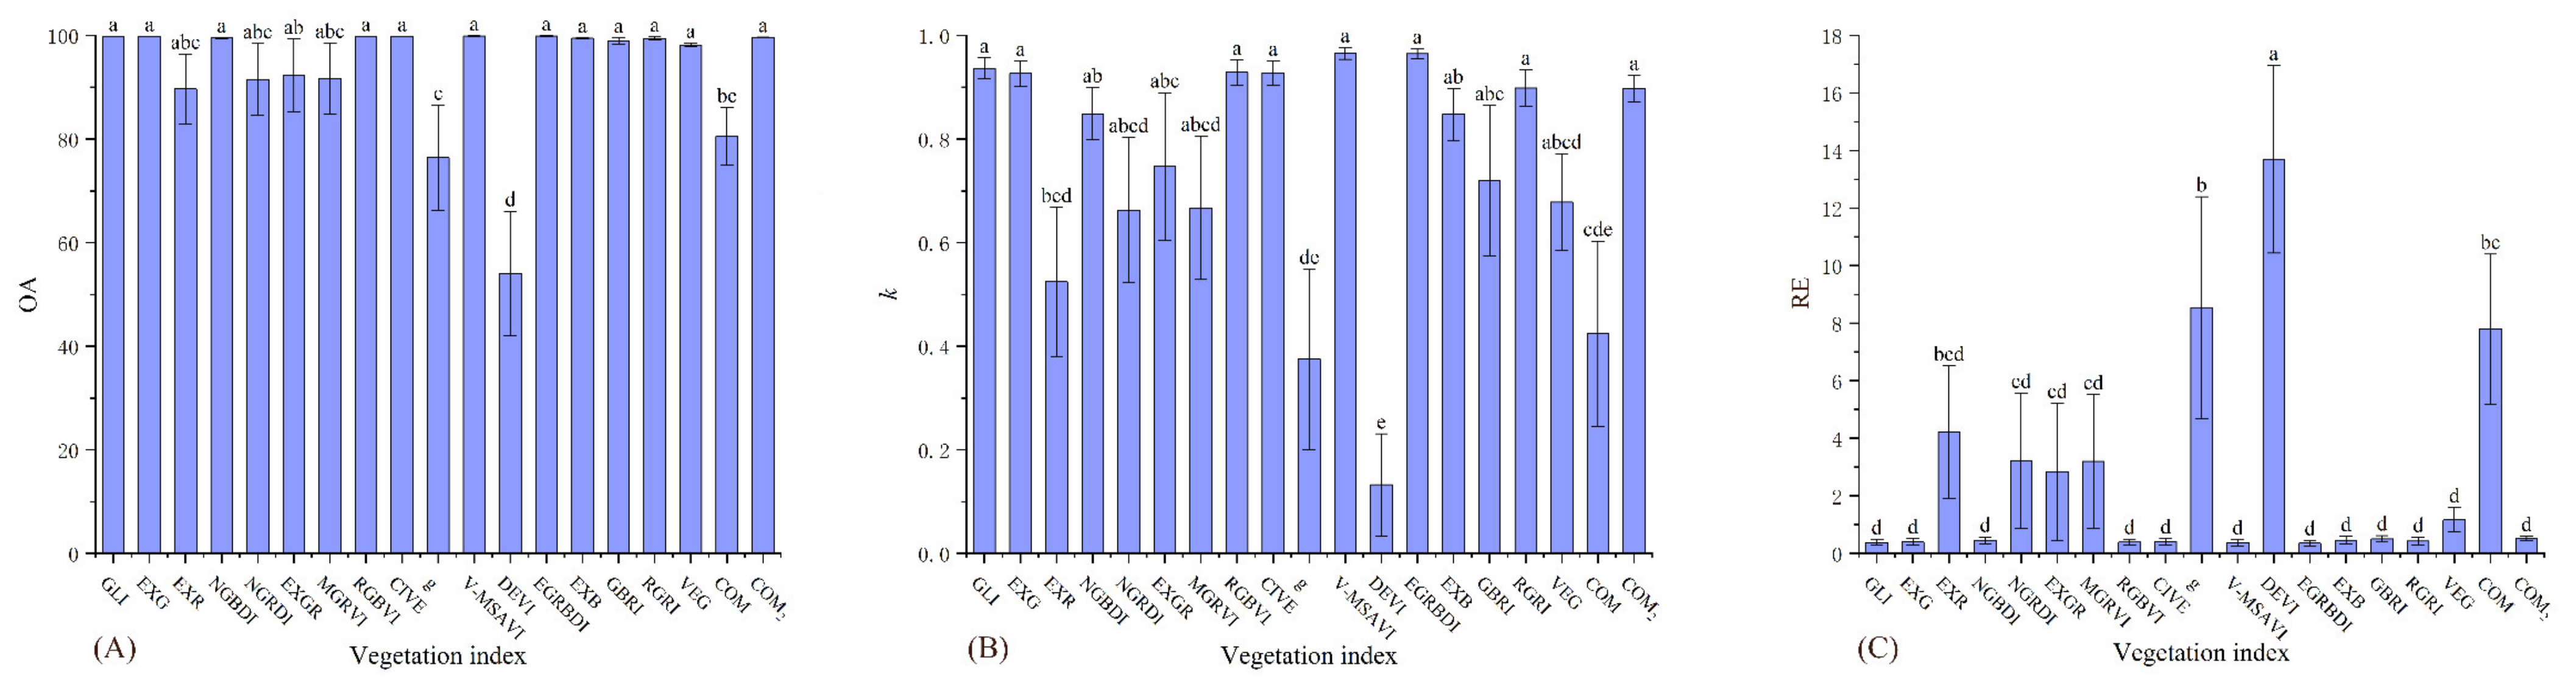
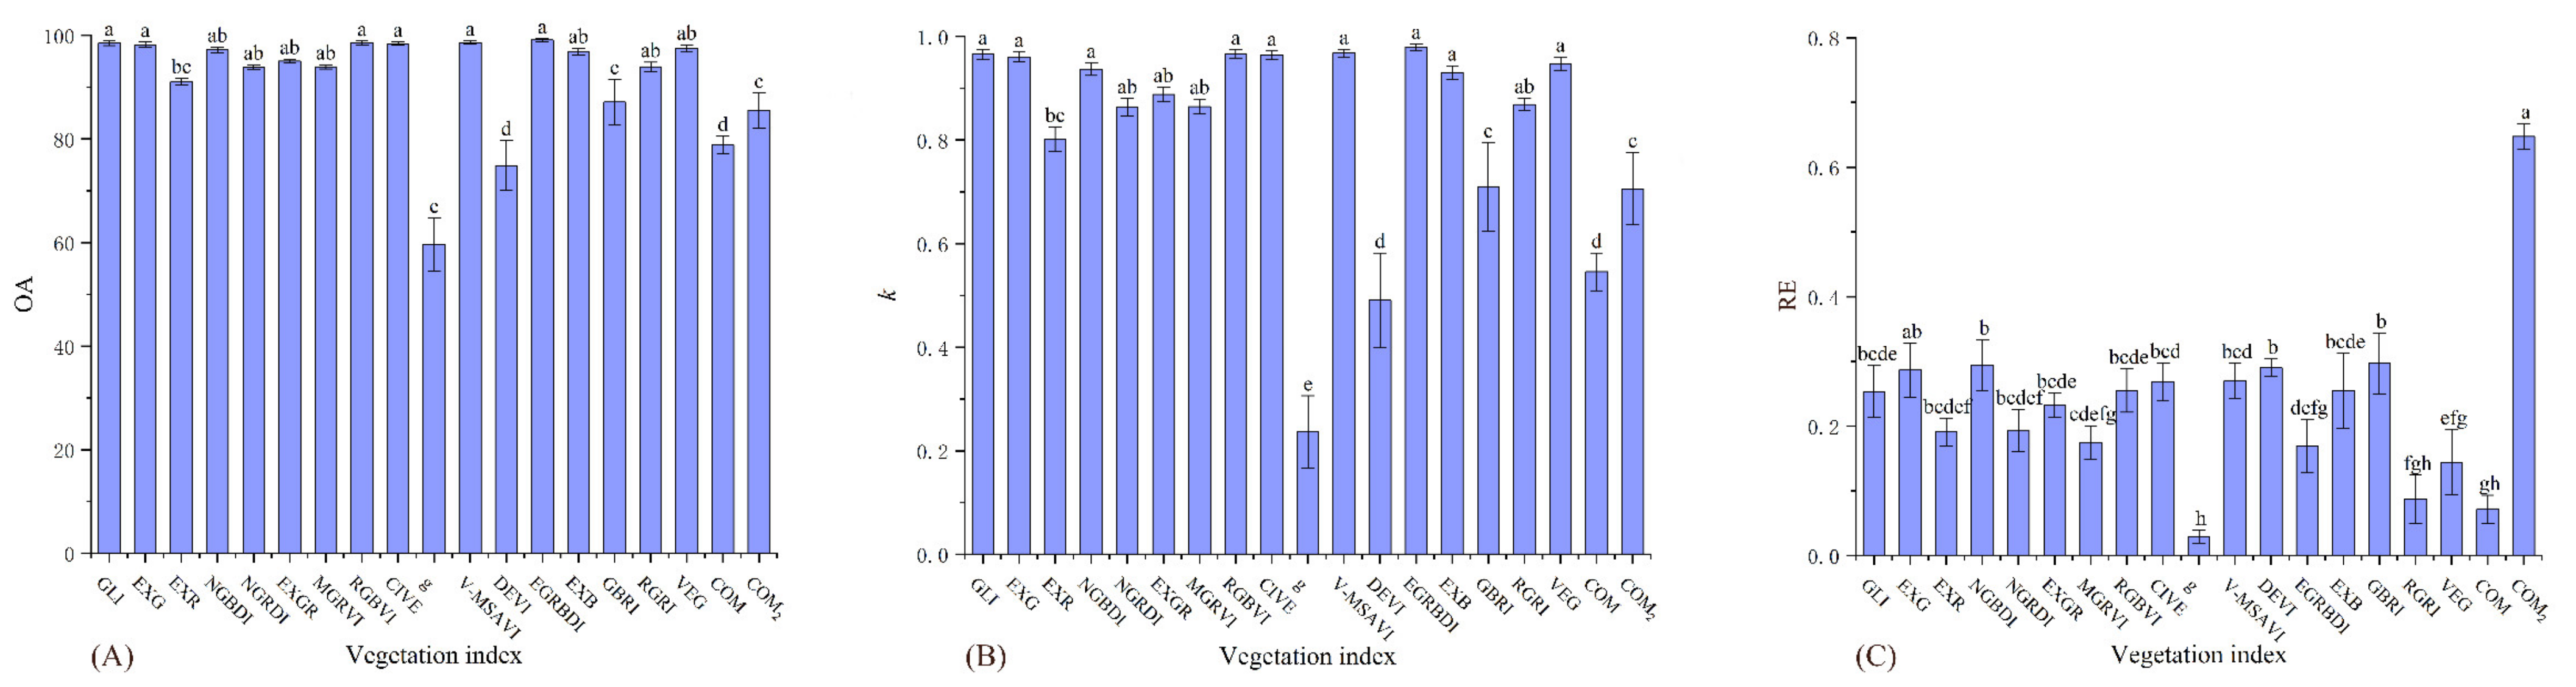
3.2.1. Vegetation Index Accuracy Assessment of the Severe Desertification Grade
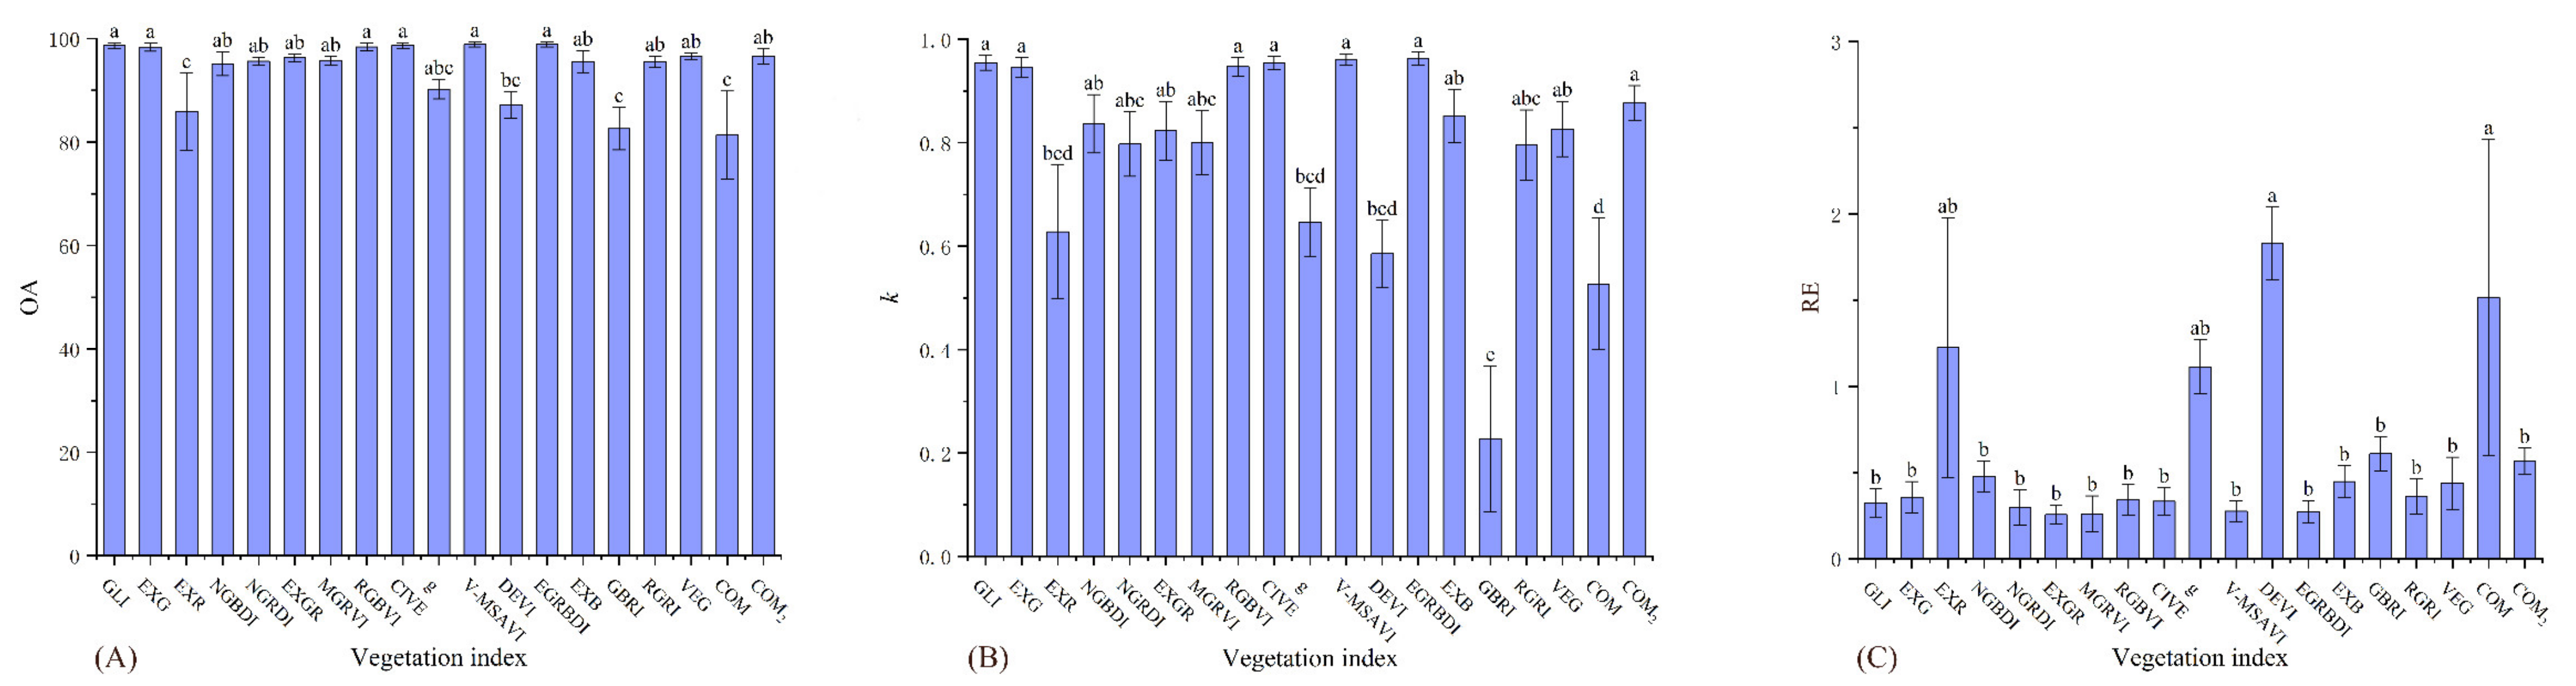
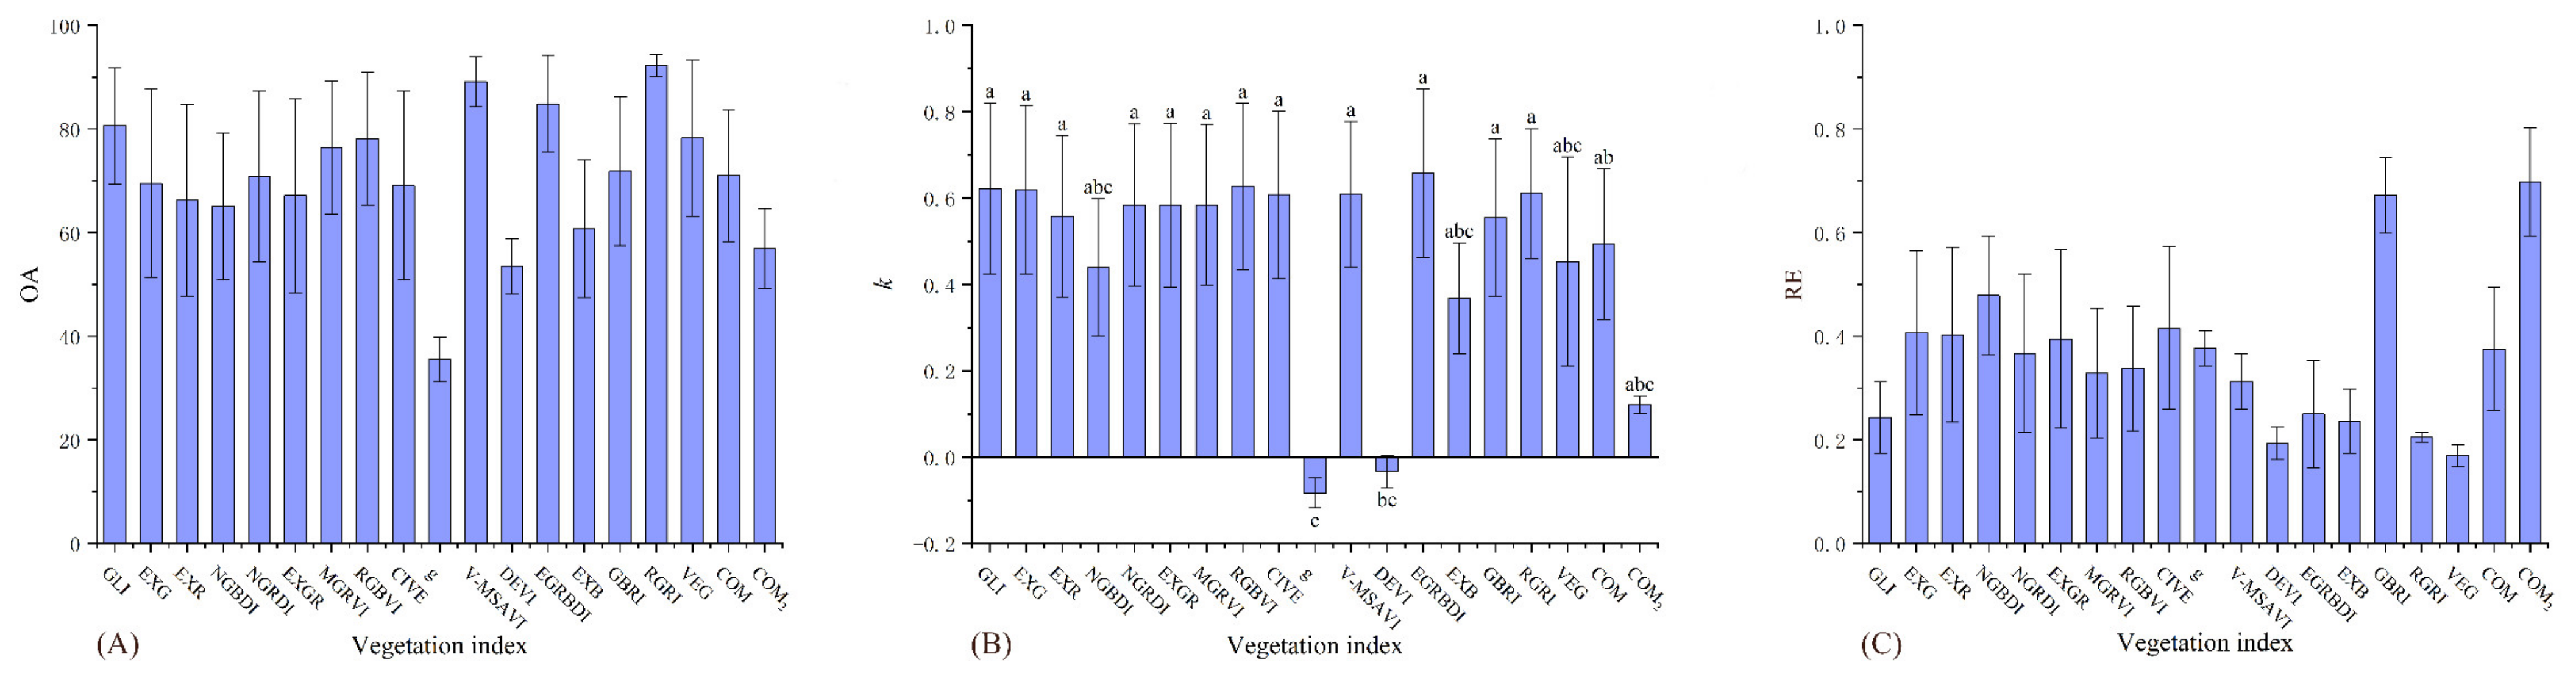
3.2.2. Vegetation Index Accuracy Assessment of the High Desertification Grade
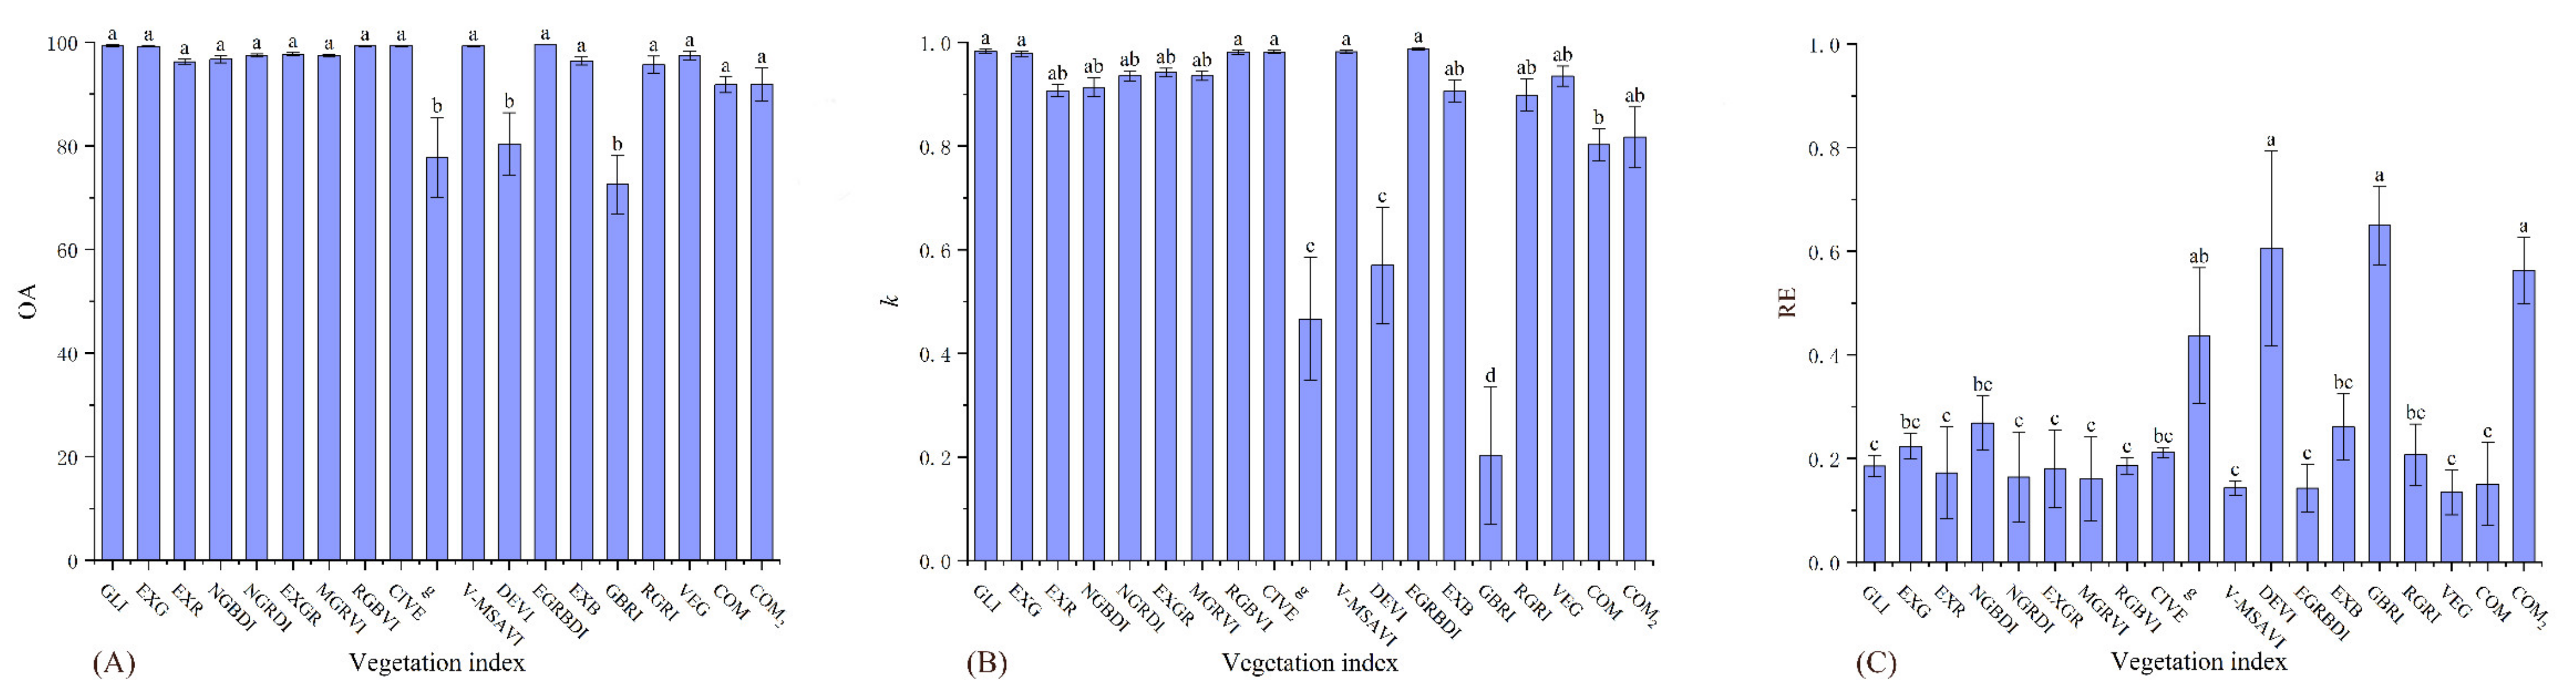
3.2.3. Vegetation Index Accuracy Assessment of the Moderate Desertification Grade
3.2.4. Vegetation Index Accuracy Assessment of the Slight Desertification Grade
3.2.5. Vegetation Index Accuracy Assessment of the Non-Desertification Grade
4. Discussion
5. Conclusions
Author Contributions
Funding
Institutional Review Board Statement
Informed Consent Statement
Data Availability Statement
Acknowledgments
Conflicts of Interest
References
- Zhang, G.; Biradar, C.M.; Xiao, X.; Dong, J.; Zhou, Y.; Qin, Y.; Zhang, Y.; Liu, F.; Ding, M.; Thomas, R.J. Exacerbated grassland degradation and desertification in Central Asia during 2000–2014. Ecol. Appl. 2018, 28, 442–456. [Google Scholar] [CrossRef] [PubMed] [Green Version]
- Liu, S.; Wang, T.; Kang, W.; David, M. Several challenges in monitoring and assessing desertification. Environ. Earth Sci. 2015, 73, 7561–7570. [Google Scholar] [CrossRef]
- Qian, K.; Yuan, Q.-Z.; Han, J.-C.; Leng, R.; Wang, Y.-S.; Zhu, K.-H.; Lin, S.; Ren, P. A remote sensing monitoring method for alpine grasslands desertification in the eastern Qinghai-Tibetan Plateau. J. Mt. Sci. 2020, 17, 1423–1437. [Google Scholar] [CrossRef]
- Reynolds, J.F.; Stafford Smith, D.M.; Lambin, E.F.; Turner, B.L.; Mortimore, M.; Batterbury, S.P.J.; Downing, T.E.; Dowlatabadi, H.; Fernandez, R.J.; Herrick, J.E.; et al. Global desertification: Building a science for dryland development. Science 2007, 316, 847–851. [Google Scholar] [CrossRef] [Green Version]
- Rubio, J.L.; Bochet, E. Desertification indicators as diagnosis criteria for desertification risk assessment in Europe. J. Arid. Environ. 1998, 39, 113–120. [Google Scholar] [CrossRef]
- Li, J.; Xu, B.; Yang, X.; Qin, Z.; Zhao, L.; Jin, Y.; Zhao, F.; Guo, J. Historical grassland desertification changes in the Horqin Sandy Land, Northern China (1985–2013). Sci. Rep. 2017, 7, 3009. [Google Scholar] [CrossRef] [Green Version]
- Collado, A.D.; Chuvieco, E.; Camarasa, A. Satellite remote sensing analysis to monitor desertification processes in the crop-rangeland boundary of Argentina. J. Arid. Environ. 2002, 52, 121–133. [Google Scholar] [CrossRef]
- Song, X.; Wang, T.; Xue, X.; Yan, C.; Li, S. Monitoring and analysis of aeolian desertification dynamics from 1975 to 2010 in the Heihe River Basin, northwestern China. Environ. Earth Sci. 2015, 74, 3123–3133. [Google Scholar] [CrossRef]
- Du, Y.; Song, W.; He, Q.; Huang, D.; Liotta, A.; Su, C. Deep learning with multi-scale feature fusion in remote sensing for automatic oceanic eddy detection. Inf. Fusion 2019, 49, 89–99. [Google Scholar] [CrossRef] [Green Version]
- Sternberg, T.; Tsolmon, R.; Middleton, N.; Thomas, D. Tracking desertification on the Mongolian steppe through NDVI and field-survey data. Int. J. Digit. Earth 2011, 4, 50–64. [Google Scholar] [CrossRef]
- Liu, Q.; Zhang, Q.; Yan, Y.; Zhang, X.; Niu, J.; Svenning, J.-C. Ecological restoration is the dominant driver of the recent reversal of desertification in the Mu Us Desert (China). J. Clean. Prod. 2020, 268, 122241. [Google Scholar] [CrossRef]
- Zhang, X.; Liao, C.; Li, J.; Sun, Q. Fractional vegetation cover estimation in arid and semi-arid environments using HJ-1 satellite hyperspectral data. Int. J. Appl. Earth Obs. Geoinf. 2013, 21, 506–512. [Google Scholar] [CrossRef]
- Fensholt, R.; Langanke, T.; Rasmussen, K.; Reenberg, A.; Prince, S.D.; Tucker, C.; Scholes, R.J.; Le, Q.B.; Bondeau, A.; Eastman, R.; et al. Greenness in semi-arid areas across the globe 1981–2007—An Earth Observing Satellite based analysis of trends and drivers. Remote Sens. Environ. 2012, 121, 144–158. [Google Scholar] [CrossRef]
- Bari, E.; Nipa, N.J.; Roy, B. Association of vegetation indices with atmospheric & biological factors using MODIS time series products. Environ. Chall. 2021, 5, 100376. [Google Scholar] [CrossRef]
- Chen, A.; Yang, X.; Guo, J.; Xing, X.; Yang, D.; Xu, B. Synthesized remote sensing-based desertification index reveals ecological restoration and its driving forces in the northern sand-prevention belt of China. Ecol. Indic. 2021, 131, 108230. [Google Scholar] [CrossRef]
- Jiapaer, G.; Chen, X.; Bao, A.M. A comparison of methods for estimating fractional vegetation cover in arid regions. Agric. For. Meteorol. 2011, 151, 1698–1710. [Google Scholar] [CrossRef]
- Qi, J.; Marsett, R.C.; Moran, M.S.; Goodrich, D.C.; Heilman, P.; Kerr, Y.H.; Dedieu, G.; Chehbouni, A.; Zhang, X.X. Spatial and temporal dynamics of vegetation in the San Pedro River basin area. Agric. For. Meteorol. 2000, 105, 55–68. [Google Scholar] [CrossRef] [Green Version]
- Tucker, C.J.; Dregne, H.E.; Newcomb, W.W. Expansion and contraction of the sahara desert from 1980 to 1990. Science 1991, 253, 299–300. [Google Scholar] [CrossRef]
- Li, X.B.; Chen, Y.H.; Yang, H.; Zhang, Y.X. Improvement, comparison, and application of field measurement methods for grassland vegetation fractional coverage. J. Integr. Plant Biol. 2005, 47, 1074–1083. [Google Scholar] [CrossRef]
- Purevdorj, T.; Tateishi, R.; Ishiyama, T.; Honda, Y. Relationships between percent vegetation cover and vegetation indices. Int. J. Remote Sens. 1998, 19, 3519–3535. [Google Scholar] [CrossRef]
- Song, B.; Park, K. Detection of Aquatic Plants Using Multispectral UAV Imagery and Vegetation Index. Remote Sens. 2020, 12, 387. [Google Scholar] [CrossRef] [Green Version]
- Gitelson, A.A.; Kaufman, Y.J.; Stark, R.; Rundquist, D. Novel algorithms for remote estimation of vegetation fraction. Remote Sens. Environ. 2002, 80, 76–87. [Google Scholar] [CrossRef] [Green Version]
- Huete, A.R. A Soil-adjusted vegetation index SAVI. Remote Sens. Environ. 1988, 25, 295–310. [Google Scholar] [CrossRef]
- Kaufman, Y.J.; Tanre, D. Atmospherically resistant vegetation index (ARVI) for EOS-MODIS. IEEE Trans. Geosci. Remote Sens. 1992, 30, 261–270. [Google Scholar] [CrossRef]
- Huete, A.R.; Liu, H.Q.; Batchily, K.; Van Leeuwen, W. A comparison of vegetation indices over a global set of TM image for EOS-MODIS. Remote Sens. Environ. 1997, 59, 440–451. [Google Scholar] [CrossRef]
- Huete, A.; Didan, K.; Miura, T.; Rodriguez, E.P.; Gao, X.; Ferreira, L.G. Overview of the radiometric and biophysical performance of the MODIS vegetation indices. Remote Sens. Environ. 2002, 83, 195–213. [Google Scholar] [CrossRef]
- Naji, T.A.-H. Study of vegetation cover distribution using DVI, PVI, WDVI indices with 2D-space plot. J. Phys. Conf. Ser. IOP Publ. 2018, 1003, 012083. [Google Scholar] [CrossRef]
- Dos Santos Galvanin, E.A.; Alves da Silva Neves, S.M.; Madureira Cruz, C.B.; Neves, R.J.; Hack de Jesus, P.H.; Kreitlow, J.P. Evaluation of vegetation indexes NDVI, SR and TVI in the discrimination of vegetation types of environments of ‘pantanal’ in Caceres, Mato Grosso State. Cienc. Florest. 2014, 24, 707–715. [Google Scholar]
- Pickell, P.D.; Hermosilla, T.; Frazier, R.J.; Coops, N.C.; Wulder, M.A. Forest recovery trends derived from Landsat time series for North American boreal forests. Int. J. Remote Sens. 2016, 37, 138–149. [Google Scholar] [CrossRef]
- Wu, W. The Generalized Difference Vegetation Index (GDVI) for Dryland Characterization. Remote Sens. 2014, 6, 1211–1233. [Google Scholar] [CrossRef] [Green Version]
- Li, X.; Zhang, Y.; Luo, J.; Jin, X.; Xu, Y.; Yang, W. Quantification winter wheat LAI with HJ-1CCD image features over multiple growing seasons. Int. J. Appl. Earth Obs. Geoinf. 2016, 44, 104–112. [Google Scholar] [CrossRef]
- Becerril-Pina, R.; Diaz-Delgado, C.; Mastachi-Loza, C.A.; Gonzalez-Sosa, E. Integration of remote sensing techniques for monitoring desertification in Mexico. Hum. Ecol. Risk Assess. 2016, 22, 1323–1340. [Google Scholar] [CrossRef]
- Marcial-Pablo, M.D.; Gonzalez-Sanchez, A.; Jimenez-Jimenez, S.I.; Ontiveros-Capurata, R.E.; Ojeda-Bustamante, W. Estimation of vegetation fraction using RGB and multispectral images from UAV. Int. J. Remote Sens. 2019, 40, 420–438. [Google Scholar] [CrossRef]
- Higginbottom, T.P.; Symeonakis, E. Assessing Land Degradation and Desertification Using Vegetation Index Data: Current Frameworks and Future Directions. Remote Sens. 2014, 6, 9552–9575. [Google Scholar] [CrossRef] [Green Version]
- Anderson, K.; Gaston, K.J. Lightweight unmanned aerial vehicles will revolutionize spatial ecology. Front. Ecol. Environ. 2013, 11, 138–146. [Google Scholar] [CrossRef] [PubMed] [Green Version]
- Miranda, V.; Pina, P.; Heleno, S.; Vieira, G.; Mora, C.; Schaefer, C.E.G.R. Monitoring recent changes of vegetation in Fildes Peninsula (King George Island, Antarctica) through satellite imagery guided by UAV surveys. Sci. Total Environ. 2020, 704, 135295. [Google Scholar] [CrossRef]
- Feng, Q.L.; Liu, J.T.; Gong, J.H. UAV Remote Sensing for Urban Vegetation Mapping Using Random Forest and Texture Analysis. Remote Sens. 2015, 7, 1074–1094. [Google Scholar] [CrossRef] [Green Version]
- Getzin, S.; Wiegand, K.; Schoning, I. Assessing biodiversity in forests using very high-resolution images and unmanned aerial vehicles. Methods Ecol. Evol. 2012, 3, 397–404. [Google Scholar] [CrossRef]
- Tu, M.; Lu, H.; Shang, M. Monitoring Grassland Desertification in Zoige County Using Landsat and UAV Image. Pol. J. Environ. Stud. 2021, 30, 5789–5799. [Google Scholar] [CrossRef]
- Zhang, L.; Hong, G.Y.; Li, Z.F.; Gao, X.W.; Wu, Y.Z.; Wang, X.J.; Wang, P.P.; Yang, J. Assessment of the Ecosystem Service Function of Sandy Lands at Different Times Following Aerial Seeding of an Endemic Species. Sustainability 2018, 10, 14. [Google Scholar] [CrossRef] [Green Version]
- Liu, L.; Xu, X.; Wu, J.; Jarvie, S.; Li, F.; Han, P.; Zhang, Q. Comprehensive evaluation and scenario simulation of carrying capacity of water resources in Mu Us Sandy Land, China. Water Supply 2022, 22, 7256–7271. [Google Scholar] [CrossRef]
- Guo, Z.C.; Wang, T.; Liu, S.L.; Kang, W.P.; Chen, X.; Feng, K.; Zhang, X.Q.; Zhi, Y. Biomass and vegetation coverage survey in the Mu Us sandy land—Based on unmanned aerial vehicle RGB images. Int. J. Appl. Earth Obs. Geoinf. 2021, 94, 13. [Google Scholar] [CrossRef]
- Gao, Y.; Lin, Y.; Wen, X.; Jian, W.; Gong, Y. Vegetation information recognition in visible band based on UAV images. Nongye Gongcheng Xuebao/Trans. Chin. Soc. Agric. Eng. 2020, 36, 178–189. [Google Scholar] [CrossRef]
- Wu, J.; Yang, G.; Yang, X.; Xu, B.; Han, L.; Zhu, Y. Automatic Counting of in situ Rice Seedlings from UAV Images Based on a Deep Fully Convolutional Neural Network. Remote Sens. 2019, 11, 691. [Google Scholar] [CrossRef] [Green Version]
- Fahmi, F.; Triandal, D.; Andayani, U.; Siregar, B. Image processing analysis of geospatial uav orthophotos for palm oil plantation monitoring. In Proceedings of the 2nd International Conference on Computing and Applied Informatics. J. Phys. Conf. Ser. IOP Publ. 2018, 11, 28–30. [Google Scholar]
- Hartling, S.; Sagan, V.; Maimaitijiang, M. Urban tree species classification using UAV-based multi-sensor data fusion and machine learning. GISci. Remote Sens. 2021, 58, 1250–1275. [Google Scholar] [CrossRef]
- Cuneo, P.; Jacobson, C.R.; Leishman, M.R. Landscape-scale detection and mapping of invasive African Olive (Olea europaea L. ssp cuspidata Wall ex G. Don Ciferri) in SW Sydney, Australia using satellite remote sensing. Appl. Veg. Sci. 2009, 12, 145–154. [Google Scholar] [CrossRef]
- Stehman, S.V. Selecting and interpreting measures of thematic classification accuracy. Remote Sens. Environ. 1997, 62, 77–89. [Google Scholar] [CrossRef]
- Wang, Y.; Li, S.; Teng, F.; Lin, Y.; Wang, M.; Cai, H. Improved Mask R-CNN for Rural Building Roof Type Recognition from UAV High-Resolution Images: A Case Study in Hunan Province, China. Remote Sens. 2022, 14, 265. [Google Scholar] [CrossRef]
- Jianhua, W.; Yimou, W.; Changzhen, Y.; Yuan, Q. 1:100,000 Desert (Sand) Distribution Dataset in China; National Tibetan Plateau Data Center: Lhasa, China, 2013. [Google Scholar] [CrossRef]
- Otsu, N. A threshold selection method from gray level histograms. IEEE Trans. Syst. Man Cybern. 1979, 9, 62–66. [Google Scholar] [CrossRef] [Green Version]
- Vala, H.J. A Review on Otsu Image Segmentation Algorithm Miss. Int. J. Adv. Res. Comput. Eng. Technol. 2013, 2, 387–389. [Google Scholar]
- Xue, J.-H.; Titterington, D.M. t-Tests, F-Tests and Otsu’s Methods for Image Thresholding. Ieee Trans. Image Process. 2011, 20, 2392–2396. [Google Scholar] [CrossRef] [PubMed]
- Louhaichi, M.; Borman, M.M.; Johnson, D.E. Spatially Located Platform and Aerial Photography for Documentation of Grazing Impacts on Wheat. Geocarto Int. 2001, 16, 65–70. [Google Scholar] [CrossRef]
- Woebbecke, D.M.; Meyer, G.E.; Bargen, K.V.; Mortensen, D.A. Color indices for weed identification under various soil, residue, and lighting conditions. Trans. ASAE 1994, 38, 259–269. [Google Scholar] [CrossRef]
- Meyer, G.E.; Neto, J.C. Verification of color vegetation indices for automated crop imaging applications. Comput. Electron. Agric. 2008, 63, 282–293. [Google Scholar] [CrossRef]
- Guijarro, M.; Pajares, G.; Riomoros, I.; Herrera, P.J.; Burgos-Artizzu, X.P.; Ribeiro, A. Automatic segmentation of relevant textures in agricultural images. Comput. Electron. Agric. 2011, 75, 75–83. [Google Scholar] [CrossRef] [Green Version]
- Bendig, J.; Yu, K.; Aasen, H.; Bolten, A.; Bennertz, S.; Broscheit, J.; Gnyp, M.L.; Bareth, G. Combining UAV-based plant height from crop surface models, visible, and near infrared vegetation indices for biomass monitoring in barley. Int. J. Appl. Earth Obs. Geoinf. 2015, 39, 79–87. [Google Scholar] [CrossRef]
- Sellaro, R.; Crepy, M.; Trupkin, S.A.; Karayekov, E.; Buchovsky, A.S.; Rossi, C.; Casal, J.J. Cryptochrome as a Sensor of the Blue/Green Ratio of Natural Radiation in Arabidopsis. Plant Physiol. 2010, 154, 401–409. [Google Scholar] [CrossRef] [Green Version]
- Verrelst, J.; Schaepman, M.E.; Koetz, B.; Kneubuhler, M. Angular sensitivity analysis of vegetation indices derived from CHRIS/PROBA data. Remote Sens. Environ. 2008, 112, 2341–2353. [Google Scholar] [CrossRef]
- Kataoka, T.; Kaneko, T.; Okamoto, H.; Hata, S. Crop growth estimation system using machine vision. In Proceedings of the IEEE/ASME International Conference on Advanced Intelligent Mechatronics, Kobe, Japan, 20–24 July 2003; pp. 1079–1083. [Google Scholar]
- Hague, T.; Tillett, N.D.; Wheeler, H. Automated crop and weed monitoring in widely spaced cereals. Precis. Agric. 2006, 7, 21–32. [Google Scholar] [CrossRef]
- Zhou, T.; Hu, Z.; Han, J.; Zhang, H. Green vegetation extraction based on visible light image of UAV. China Environ. Sci. 2021, 41, 2380–2390. [Google Scholar]
- Zaiming, Z.; Yanming, Y.; Benqing, C. Study on the extraction of exotic species spartina alterniflora from UAV visible images. J. Subtrop. Resour. Environ. 2017, 12, 90–95. [Google Scholar]
- Guerrero, J.M.; Pajares, G.; Montalvo, M.; Romeo, J.; Guijarro, M. Support Vector Machines for crop/weeds identification in maize fields. Expert Syst. Appl. 2012, 39, 11149–11155. [Google Scholar] [CrossRef]
- Daryaei, A.; Sohrabi, H.; Atzberger, C.; Immitzer, M. Fine-scale detection of vegetation in semi-arid mountainous areas with focus on riparian landscapes using Sentinel-2 and UAV data. Comput. Electron. Agric. 2020, 177, 13. [Google Scholar] [CrossRef]
- Zhao, Y.H.; Chen, N.H.; Chen, J.Y.; Hu, C.Q. Automatic extraction of yardangs using Landsat 8 and UAV images: A case study in the Qaidam Basin, China. Aeolian Res. 2018, 33, 53–61. [Google Scholar] [CrossRef]
- Munyati, C. Wetland change detection on the Kafue Flats, Zambia, by classification of a multitemporal remote sensing image dataset. Int. J. Remote Sens. 2000, 21, 1787–1806. [Google Scholar] [CrossRef]
- Sankey, T.T.; McVay, J.; Swetnam, T.L.; McClaran, M.P.; Heilman, P.; Nichols, M. UAV hyperspectral and lidar data and their fusion for arid and semi-arid land vegetation monitoring. Remote Sens. Ecol. Conserv. 2018, 4, 20–33. [Google Scholar] [CrossRef]
- Ma, Q.; Han, W.T.; Huang, S.J.; Dong, S.D.; Li, G.; Chen, H.P. Distinguishing Planting Structures of Different Complexity from UAV Multispectral Images. Sensors 2021, 21, 22. [Google Scholar] [CrossRef]
- Wu, J.; Liu, Y.; Wang, J.; He, T. Application of Hyperion data to land degradation mapping in the Hengshan region of China. Int. J. Remote Sens. 2010, 31, 5145–5161. [Google Scholar] [CrossRef]
- Lima-Cueto, F.J.; Blanco-Sepulveda, R.; Gomez-Moreno, M.L.; Galacho-Jimenez, F.B. Using Vegetation Indices and a UAV Imaging Platform to Quantify the Density of Vegetation Ground Cover in Olive Groves (Olea Europaea L.) in Southern Spain. Remote Sens. 2019, 11, 2564. [Google Scholar] [CrossRef] [Green Version]
- Jing, Z.; Huanbo, Y.; Yubin, L.; Liqun, L.; Peng, J.; Zhiming, L. Extraction Method of Summer Corn Vegetation Coverage Based on Visible Light Image of Unmanned Aerial Vehicle. J. Trans. Chin. Soc. Agric. Mach. 2019, 50, 232–240. [Google Scholar]
- Zhang, C.-M.; Zhang, J.-M. Research on the Spectral Characteristics of Grassland in Arid Regions Based on Hyperspectral Image. Spectrosc. Spectr. Anal. 2012, 32, 445–448. [Google Scholar] [CrossRef]
- Xue, J.; Su, B. Significant Remote Sensing Vegetation Indices: A Review of Developments and Applications. J. Sens. 2017, 2017, 1353691. [Google Scholar] [CrossRef] [Green Version]
- Zhang, Q.; Niu, J.; Buyantuyev, A.; Zhang, J.; Ding, Y.; Dong, J. Productivity-species richness relationship changes from unimodal to positive linear with increasing spatial scale in the Inner Mongolia steppe. Ecol. Res. 2011, 26, 649–658. [Google Scholar] [CrossRef]
- Yan, G.J.; Li, L.Y.; Coy, A.; Mu, X.H.; Chen, S.B.; Xie, D.H.; Zhang, W.M.; Shen, Q.F.; Zhou, H.M. Improving the estimation of fractional vegetation cover from UAV RGB imagery by colour unmixing. ISPRS-J. Photogramm. Remote Sens. 2019, 158, 23–34. [Google Scholar] [CrossRef]
- Pi, W.; Du, J.; Liu, H.; Zhu, X. Desertification Glassland Classification and Three-Dimensional Convolution Neural Network Model for Identifying Desert Grassland Landforms with Unmanned Aerial Vehicle Hyperspectral Remote Sensing Images. J. Appl. Spectrosc. 2020, 87, 309–318. [Google Scholar] [CrossRef]

| Desertification Grades | FVC | Desertification Area in the Image | UAV Visible Light Images |
|---|---|---|---|
| Severe | <5% | ≥95 m2 |  |
| High | 5–20% | 80–94 m2 | 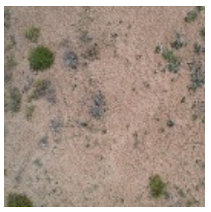 |
| Moderate | 21–50% | 50–79 m2 | 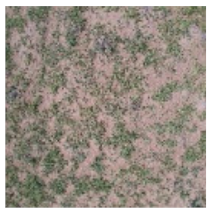 |
| Slight | 51–70% | 30–49 m2 | 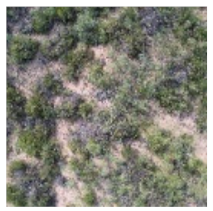 |
| Non-desertification | >70% | <30 m2 | 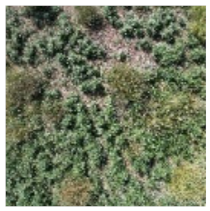 |
| Vegetation Index | Full Name | Equation |
|---|---|---|
| GLI [54] | Green Leaf Index | (2 × G − R − B)/(2 × G + R + B) |
| ExG [55] | Excess Green | 2g − r − b |
| ExR [56] | Excess Red | 1.4r − g |
| ExB [57] | Excess Blue | 1.4b − g |
| NGBDI [56] | Normalized Green Red Difference Index | (G − B)/(G + B) |
| NGRDI [56] | Normalized Green Red Difference Index | (G − R)/(G + R) |
| ExGR [56] | Excess Green Minus Excess Red | E × G − E × R |
| MGRVI [58] | Modified | (G2 − R2)/(G2 + R2) |
| RGBVI [58] | Red Green Blue Vegetation Index | (G2 − B × R)/(G2 + B × R) |
| GBRI [59] | Green Blue Ratio Index | b/g |
| RGRI [60] | Red Green Ratio Index | r/g |
| CIVE [61] | Color Index of Vegetation | 0.441r − 0.881g + 0.385b + 18.78745 |
| VEG [62] | Vegetative | g/(rαb1−α) |
| DEVI [63] | Difference Excess Vegetation Index | G/3G + R/3G + B/3G |
| EGRBDI [43] | Excess Green Red Blue Difference Index | ((2G)2 − B × R)/((2G)2 + B × R) |
| V-MSAVI [64] | Visible Band Modified Soil Adjusted Vegetation Index | |
| g [55] | Green Chromatic Coordinates | G |
| COM [57] | Combined | 0.25E × G + 0.3E × GR + 0.33CIVE + 0.12VEG |
| COM2 [65] | Combined 2 | 0.36E × G + 0.47CIVE + 0.17VEG |
| Image Number | Center Coordinate | Altitude m | FVC % | Desertification Grade | OA % | k | |
|---|---|---|---|---|---|---|---|
| Latitude | Longitude | ||||||
| 1 | 39°20′3871″ E | 109°04′4434″ N | 1269.7 | 4.3243 | Severe | 99.1168 | 0.9821 |
| 2 | 38°30′3617″ E | 108°04 ′0653″ N | 1351.9 | 1.5050 | Severe | 99.011 | 0.9783 |
| 3 | 39°20′3910″ E | 109°04′4392″ N | 1352.1 | 4.0864 | Severe | 99.6525 | 0.9922 |
| 4 | 38°50′5350″ E | 108°44′2955″ N | 1356.0 | 3.3052 | Severe | 99.9252 | 0.9966 |
| 5 | 38°50′5348″ E | 108°44′2929″ N | 1356.0 | 3.3717 | Severe | 98.7145 | 0.9642 |
| 6 | 38°30′3629″ E | 108°46′0643″ N | 1269.9 | 2.8890 | Severe | 99.7404 | 0.9939 |
| 7 | 39°15′3308″ E | 109°00′1219″ N | 1267.6 | 13.2679 | High | 98.9788 | 0.9671 |
| 8 | 39°15′3364″ E | 109°00′1315″ N | 1267.5 | 18.3795 | High | 99.5751 | 0.9725 |
| 9 | 38°09′4113″ E | 108°38′1296″ N | 1247.7 | 6.7185 | High | 99.5239 | 0.9879 |
| 10 | 38°25′4054″ E | 108°42′2405″ N | 1293.8 | 16.2495 | High | 99.7815 | 0.9956 |
| 11 | 38°25′4082″ E | 108°42′2359″ N | 1293.9 | 15.9524 | High | 99.54 | 0.9902 |
| 12 | 38°09′4144″ E | 108°38′1247″ N | 1247.5 | 9.4557 | High | 98.8213 | 0.9764 |
| 13 | 38°38′4889″ E | 108°56′4260″ N | 1270.6 | 32.6411 | Moderate | 99.8111 | 0.9676 |
| 14 | 39°07′1405″ E | 108°53′2209″ N | 1295.8 | 43.2160 | Moderate | 99.9583 | 0.99 |
| 15 | 39°07′1527″ E | 108°53′2101″ N | 1296.9 | 31.7365 | Moderate | 99.5985 | 0.9747 |
| 16 | 38°33′1085″ E | 108°43′5874″ N | 1314.8 | 45.6735 | Moderate | 99.833 | 0.982 |
| 17 | 38°33′1040″ E | 108°44′0091″ N | 1314.5 | 31.8236 | Moderate | 99.6005 | 0.9892 |
| 18 | 38°38′4745″ E | 108°56′4154″ N | 1270.3 | 26.3766 | Moderate | 99.5415 | 0.9894 |
| 19 | 38°52′5931″ E | 108°44′2805″ N | 1344.1 | 53.0043 | Slight | 99.5556 | 0.9855 |
| 20 | 38°52′5931″ E | 108°44′2816″ N | 1344.1 | 55.3886 | Slight | 99.6876 | 0.9937 |
| 21 | 38°57′1514″ E | 109°25′2166″ N | 1266.0 | 51.5241 | Slight | 99.931 | 0.9985 |
| 22 | 38°57′1522″ E | 109°25′2124″ N | 1266.1 | 51.5331 | Slight | 99.8963 | 0.9928 |
| 23 | 38°40′7309″ E | 108°37′4289″ N | 1287.4 | 54.7885 | Slight | 99.6876 | 0.9937 |
| 24 | 38°40′4888″ E | 108°37′4914″ N | 1287.3 | 51.5424 | Slight | 99.9765 | 0.9946 |
| 25 | 38°46′4981″ E | 108°31′0358″ N | 1284.9 | 86.2322 | Non-desertification | 99.874 | 0.9606 |
| 26 | 38°46′5164″ E | 108°31′3291″ N | 1284.8 | 96.5132 | Non-desertification | 99.8873 | 0.9619 |
| 27 | 38°56′4931″ E | 109°17′3098″ N | 1261.4 | 83.4444 | Non-desertification | 99.4857 | 0.9808 |
| 26 | 38°56′5034″ E | 109°17′2680″ N | 1261.3 | 89.2501 | Non-desertification | 99.9279 | 0.9674 |
| 29 | 38°11′5005″ E | 108°52′2792″ N | 1266.9 | 71.6581 | Non-desertification | 99.5638 | 0.9833 |
| 30 | 38°11′5022″ E | 108°52′2811″ N | 1266.8 | 76.3327 | Non-desertification | 99.8111 | 0.9676 |
| TSS | df | MS | F | p | ||
|---|---|---|---|---|---|---|
| OA (%) | Between Groups | 14,840.249 | 18 | 824.458 | 5.562 | 0.000 |
| Within Groups | 14,083.024 | 95 | 148.242 | |||
| Grand Total | 28,923.272 | 113 | ||||
| k | Between Groups | 5.895 | 18 | 0.328 | 5.430 | 0.000 |
| Within Groups | 5.730 | 95 | 0.060 | |||
| Grand Total | 11.625 | 113 | ||||
| RE | Between Groups | 1459.716 | 18 | 81.095 | 4.710 | 0.000 |
| Within Groups | 1635.607 | 95 | 17.217 | |||
| Grand Total | 3095.324 | 113 |
| TSS | df | MS | F | p | ||
|---|---|---|---|---|---|---|
| OA (%) | Between Groups | 3454.562 | 18 | 191.920 | 3.550 | 0.000 |
| Within Groups | 5136.480 | 95 | 54.068 | |||
| Grand Total | 8591.042 | 113 | ||||
| k | Between Groups | 3.914 | 18 | 0.217 | 7.829 | 0.000 |
| Within Groups | 2.639 | 95 | 0.028 | |||
| Grand Total | 6.553 | 113 | ||||
| RE | Between Groups | 23.606 | 18 | 1.311 | 2.584 | 0.002 |
| Within Groups | 48.222 | 95 | 0.508 | |||
| Grand Total | 71.828 | 113 |
| TSS | df | MS | F | p | ||
|---|---|---|---|---|---|---|
| OA (%) | Between Groups | 6957.370 | 18 | 386.521 | 8.413 | 0.000 |
| Within Groups | 4364.848 | 95 | 45.946 | |||
| Grand Total | 11,322.218 | 113 | ||||
| k | Between Groups | 4.774 | 18 | 0.265 | 16.451 | 0.000 |
| Within Groups | 1.531 | 95 | 0.016 | |||
| Grand Total | 6.305 | 113 | ||||
| RE | Between Groups | 2.998 | 18 | 0.167 | 4.671 | 0.000 |
| Within Groups | 3.387 | 95 | 0.036 | |||
| Grand Total | 6.385 | 113 |
| TSS | df | MS | F | p | ||
|---|---|---|---|---|---|---|
| OA (%) | Between Groups | 11,608.489 | 18 | 644.916 | 23.374 | 0.000 |
| Within Groups | 2621.216 | 95 | 27.592 | |||
| Grand Total | 14,229.705 | 113 | ||||
| k | Between Groups | 4.392 | 18 | 0.244 | 26.617 | 0.000 |
| Within Groups | 0.871 | 95 | 0.009 | |||
| Grand Total | 5.262 | 113 | ||||
| RE | Between Groups | 1.785 | 18 | 0.099 | 13.981 | 0.000 |
| Within Groups | 0.674 | 95 | 0.007 | |||
| Grand Total | 2.459 | 113 |
| TSS | df | MS | F | p | ||
|---|---|---|---|---|---|---|
| OA (%) | Between Groups | 18,799.030 | 18 | 1044.391 | 1.009 | 0.457 |
| Within Groups | 98,285.865 | 95 | 1034.588 | |||
| Grand Total | 117,084.895 | 113 | ||||
| k | Between Groups | 5.465 | 18 | 0.304 | 1.750 | 0.044 |
| Within Groups | 16.485 | 95 | 0.174 | |||
| Grand Total | 21.950 | 113 | ||||
| RE | Between Groups | 2.203 | 18 | 0.122 | 1.692 | 0.054 |
| Within Groups | 6.871 | 95 | 0.072 | |||
| Grand Total | 9.074 | 113 |
Publisher’s Note: MDPI stays neutral with regard to jurisdictional claims in published maps and institutional affiliations. |
© 2022 by the authors. Licensee MDPI, Basel, Switzerland. This article is an open access article distributed under the terms and conditions of the Creative Commons Attribution (CC BY) license (https://creativecommons.org/licenses/by/4.0/).
Share and Cite
Xu, X.; Liu, L.; Han, P.; Gong, X.; Zhang, Q. Accuracy of Vegetation Indices in Assessing Different Grades of Grassland Desertification from UAV. Int. J. Environ. Res. Public Health 2022, 19, 16793. https://doi.org/10.3390/ijerph192416793
Xu X, Liu L, Han P, Gong X, Zhang Q. Accuracy of Vegetation Indices in Assessing Different Grades of Grassland Desertification from UAV. International Journal of Environmental Research and Public Health. 2022; 19(24):16793. https://doi.org/10.3390/ijerph192416793
Chicago/Turabian StyleXu, Xue, Luyao Liu, Peng Han, Xiaoqian Gong, and Qing Zhang. 2022. "Accuracy of Vegetation Indices in Assessing Different Grades of Grassland Desertification from UAV" International Journal of Environmental Research and Public Health 19, no. 24: 16793. https://doi.org/10.3390/ijerph192416793