Article

Characteristics of Air Pollutants Emission and Its Impacts on Public Health of Chengdu, Western China

1
College of New Energy and Environment, Jilin University, Changchun 130012, China
2
Key Laboratory of Groundwater Resources and Environment, Ministry of Education, Jilin University, Changchun 130012, China
3
Jilin Province Key Laboratory of Water Resources and Environment, Jilin University, Changchun 130012, China
*
Author to whom correspondence should be addressed.
Int. J. Environ. Res. Public Health 2022, 19(24), 16852; https://doi.org/10.3390/ijerph192416852
Submission received: 13 October 2022 / Revised: 1 December 2022 / Accepted: 13 December 2022 / Published: 15 December 2022

Abstract

:
Pollution caused by PM2.5 and O3 are common environmental problems which can easily affect human health. Chengdu is a major central city in Western China, and there is little research on the regional emissions and health effects of air pollution in Chengdu. According to the Multi-resolution Emissions Inventory of the Chinese Model, 2017 (MEIC v1.3), this study compiled the air pollutant emission inventory of Chengdu. The results show that the pollutant emission of Chengdu is generally higher in winter than in summer. The southeast area of Chengdu is the key area where emissions of residential and industrial sectors are dominant. Through air quality simulation with a Weather Research and Forecasting model, coupled with the Community Multiscale Air Quality (WRF-CMAQ), the health effects of PM2.5 and O3 in winter and summer in Chengdu of 2017 were investigated. The primary pollutant in winter is PM2.5 and O3 in summer. PM2.5 pollution accounted for 351 deaths in January and July 2017, and O3 pollution accounted for 328 deaths in the same period. There were 276 deaths in rural areas and 413 in urban areas. In January and July 2017, the health economic loss caused by PM2.5 accounted for 0.0974% of the gross regional product (GDP) of Chengdu in 2017, and the health economic loss caused by O3 accounted for 0.0910%.

1. Introduction

Air pollution is one of the universal environmental problems in the world. The environmental pollution caused by the concentration of fine particulate matter (PM2.5) and ozone (O3) exceeding the air quality standard has attracted people’s attention [1,2,3,4,5]. Fine particulate matter in the air with small particle size can be suspended in the air for a long time; its composition is complex, containing sulfate, nitrate and other chemical components, as well as toxic trace elements [6,7]. PM2.5 has negative impacts on health by triggering inflammatory, mutagenic/genotoxic, and intracellular oxidative stress responses [8]. Atmospheric ozone pollution is due to anthropogenic emissions of pollutants of many precursors including VOCs and NOx through photochemical reactions [9]. There is a positive and independent association between long-term O3 exposure and cause-specific cardiovascular mortality [10]. Nearly 18% of respiratory mortality in Shanghai from 2013 to 2019 was attributed to O3 exposure [11].
In order to clarify the impact of air pollution on human health, many scholars have conducted research from the perspective of health exposure risk [12,13,14,15,16]. Hu et al. [17] estimated the PM2.5 premature mortality amount was about 3.15 million/year in 2010 globally, and China is the leading country, with about 1.33 million/year. Ding, D et al. [18] indicated that the total mortality of PM2.5 in China in 2013 was estimated to be 1.389 million (95%CI: 10.05 million, 1.631 million), and in 2017 was estimated to be 1.102 million (95%CI: 0.775 million, 1.337 million), the health burden of PM2.5 pollution in China is much higher than the other developed countries. Studies show that respiratory mortality and non-accidental mortality increased by 1.24% (95%CI: 0.29%, 2.22%) and 0.36% (95%CI: 0.10%, 0.63%) with the increase of PM2.5 by 10 μg/m3. For every 10 μg/m3 increase in O3, respiratory mortality and non-accidental mortality increased by 2.22% (95%CI: 0.56%, 3.90%) and 0.05% (95%CI: 0.42%, 0.53%), respectively [19]. In 2030, without controlling policies, PM2.5 pollution could lead to a loss of 2.0% of gross regional product (GDP), and O3 pollution could lead to a loss of 0.09% of GDP [20].
In addition to being a significant metropolis in the center of western China, Chengdu also serves as the business, financial, and transportation hub for southwest China. There is, however, limited research on the emission of pollutants and their consequences on health in various locations within Chengdu.
In this paper, a Weather Research and Forecasting model coupled with the Community Multiscale Air Quality (WRF-CMAQ) is used to simulate the air quality of Chengdu in January and July 2017, to consummate the monitoring value and obtain complete air quality data. Based on this, the emission of pollutants in winter and summer and the health and economic losses caused by PM2.5 and O3 in Chengdu were studied. The study provides insights into the development of air quality control strategies in Chengdu.

2. Data and Methods

2.1. WRF-CMAQ Model and the Study Area

The WRF-CMAQ model is used to simulate the air quality of Chengdu in January (winter) and July (summer) in 2017. The atmospheric pollutants concentration data of environmental quality automatic monitoring station of Chengdu from China’s environmental monitoring station of national urban air quality real-time publishing platform (http://beijingair.sinaapp.com/) (accessed on 5 July 2022) and the meteorological data of Shuangliu District (SL) meteorological station from China meteorological data service center (http://data.cma.cn/) (accessed on 10 July 2022) were collected for WRF-CMAQ model simulation test and the analysis of research. The Community Multiscale Air Quality model (CMAQ v5.3.2) (https://www.cmascenter.org/cmaq/) (accessed on 3 July 2022) model is used in this study.
Figure 1 shows the nested domain used in this study. Domain 1 covers most of western China, including Sichuan Province, Guizhou Province, Chongqing Municipality, Yunnan Province, Tibet Autonomous Region, Qinghai Province, Gansu Province, Shaanxi Province, with a mesh resolution of 27 km × 27 km; Domain 2 covers the Sichuan Province with a grid resolution of 9 km × 9 km and Domain 3 covers Chengdu with a grid resolution of 3 km × 3 km. The input meteorological data used for the model were generated by Weather Research and Forecasting Model (WRF 3.9.1), according to the National Centers for Environmental Prediction Final (NCEP FNL). global tropospheric analysis business model dataset with a spatial resolution of 1° × 1° and a temporal resolution of 6 h. The Multi-resolution Emission Inventory of China (MEIC v1.3, 0.25° × 0.25°) of 2017 (http://www.meicmodel.org/) (accessed on 5 July 2022) [21,22] was used for the pollutant emissions inventory. The inventory contains 10 major air pollutants and CO2 emissions (NMVOC, NH3, PM2.5, PM10, CO, SO2, NOx, BC, OC, CO2) from five sectors: industry, power, residential, transportation and agriculture, with VOCs allocated according to the Carbon Bond-06 mechanism. MEIC is an emission inventory model framework based on bottom-up technology. The study used Inventory Spatial Allocate Tool (ISAT) to redistribute species on the temporal and spatial scales of Multi-resolution Emission Inventory of China of 2017 based on population and facilities, and established a high-resolution emission inventory (3 km × 3 km) of Chengdu, which was used as input to the CMAQ model. To eliminate the influence of initial conditions, the WRF started 7 days in advance.

2.2. Environmental Health Impact Assessment

The environmental population data, mortality data and socio-economic data were obtained from the 2017 Chengdu Statistical Bulletin of National Economic and Social Development. In 2017, Chengdu had a permanent population of 14.353 million, including 8.512 million urban and 5.841 million rural residents. The human health burden of short-term exposure to atmospheric pollutants can be calculated by the following formula [23,24]:
M i = 1 n R R i 1 R R i × Y 0
R R i = exp ( β × ( X X 0 ) )
Mi is the total mortality caused by air pollutants exceeding a certain limit value, n is the number of days of environmental monitoring, Y0 is the baseline mortality, RRi is the daily relative risk associated with short-term exposure to air pollutants, β is the empirical coefficient of concentration and health response obtained based on epidemiological investigation. In this study, the β% value is 0.38 (95%CI: 0.31–0.45) for every 10 μg·m−3 increase in PM2.5 concentration [25]. For every 10 μg·m−3 increase in O3 concentration, the β% value is 0.40 (95%CI: 0.30–0.50) [26]; X is the concentration of air pollutants. In this study, the daily average concentration of PM2.5 is adopted, and O3 is the maximum value of the eight-hour moving average concentration of O3 on the same day (MDA8 O3). X0 is the daily threshold concentration of air pollutants. The daily threshold concentration of PM2.5 is 15 μg·m−3, and the daily threshold concentration of O3 is 60 μg·m−3 according to the latest revised Global Air Quality Guidelines (AQG 2021) issued by the World Health Organization (WHO).

2.3. Economic Valuation of the Health Impacts

Statistical vital value (VSL) is commonly used to monetize the risk of premature death caused by air pollutants. This method mainly includes willingness to pay (WTP) and human capital (HC) methods [27]. Peng, et al. [28] investigated the average willingness to pay and vital statistical value of reducing air pollution health risks in Chengdu-Chongqing region in 2018 based on the single boundary dichotomic conditional value method, which is very consistent with this study. Economic losses from environmental health impacts are calculated as follows [29,30]:
V S L 2017 = V S L 2018   × I 2017 I 2018
E i = V S L 2017 × M i
VSL is the vital statistical value of different years, and the vital statistical value of Chengdu in 2018 is 4.02 million yuan. I is the disposable income per capita of Chengdu in different years, which is 20,300 yuan in 2017 and 22,100 yuan in 2018. Ei is the economic loss caused by premature death.

3. Results

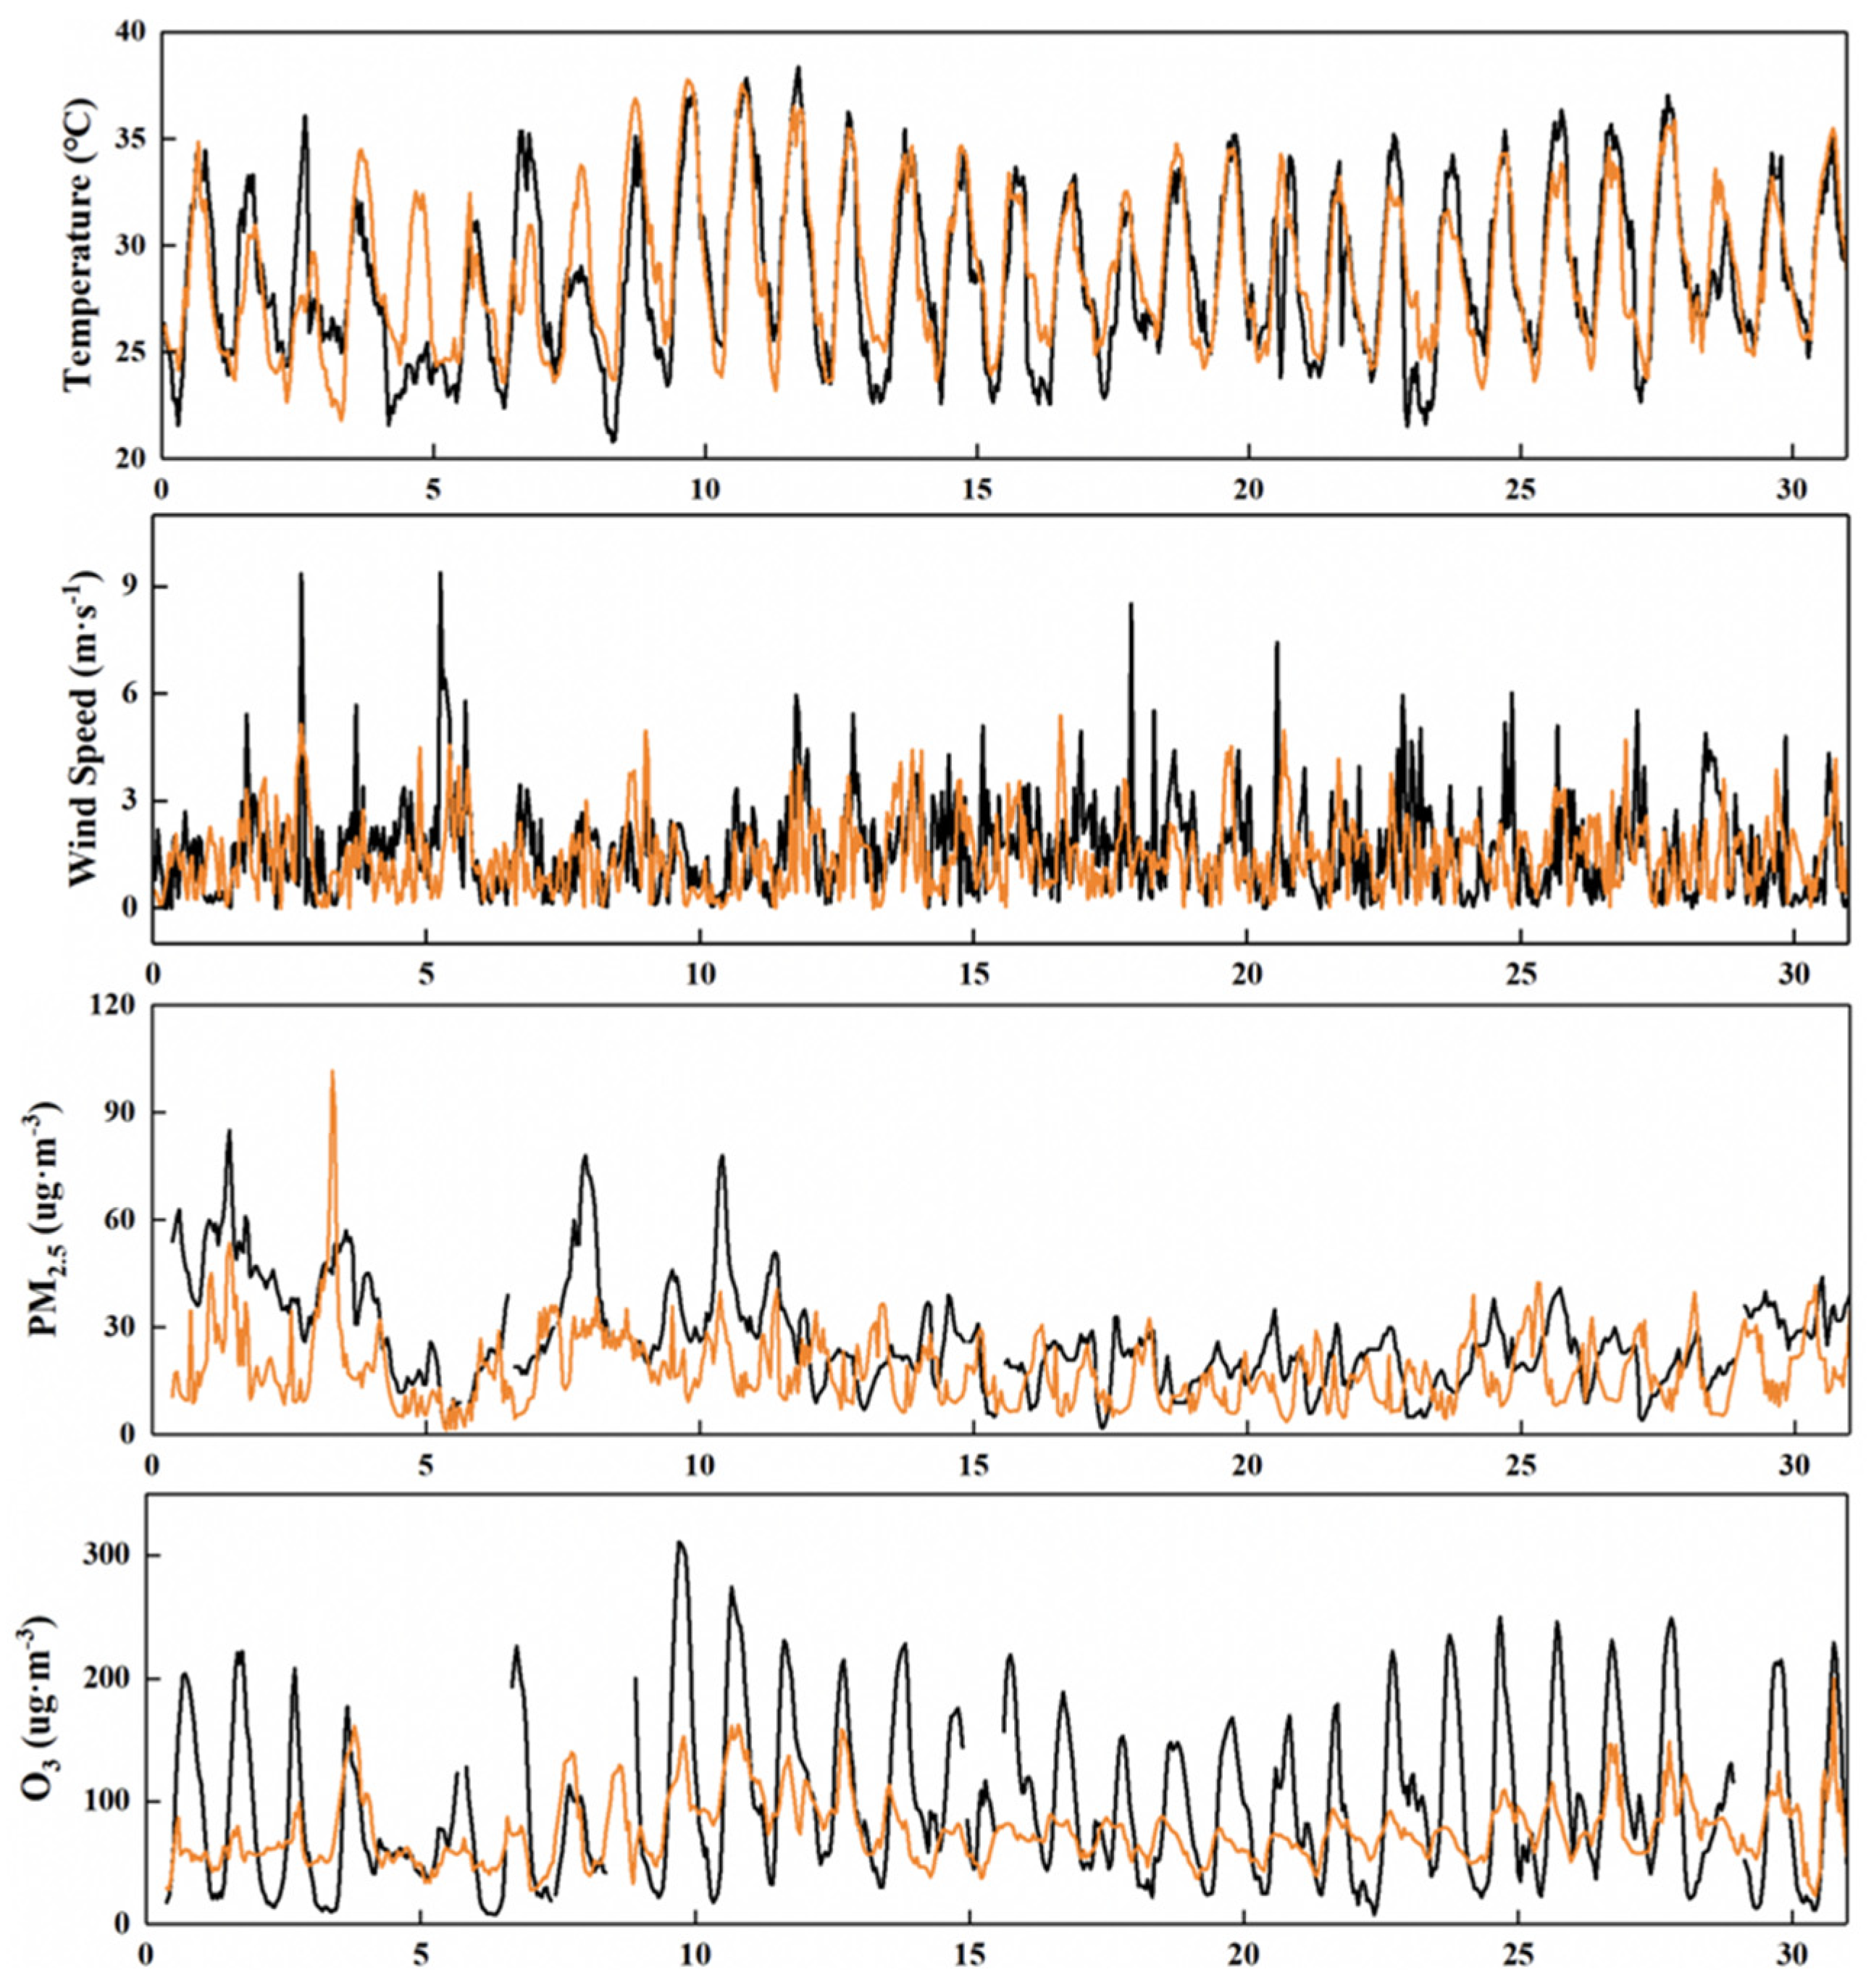
3.1. Model Validation

The simulation of meteorological conditions and pollution levels of key pollutants by the model was verified (Figure 2 and Figure 3). The temperature at 2 m (T2) provided by WRF simulation performed well in January and July, while the wind speed at 10 m (U10) performed poorly, which may be due to the unique basin topography of Sichuan and related to the parameterization scheme. However, the U10 simulation average can reach 87~98% of the observed value. The overall simulated variation in PM2.5 is relatively consistent, while O3 has a good grasp of the diurnal variation range. PM2.5 and O3 in Chengdu are in the low concentration range in summer and winter, respectively, and are underestimated, which is consistent with the study of Hu et al. [31]. The NMB of PM2.5 and O3 is about ±0.50 (Table 1 and Table 2), which also indicates that the change trend of pollutants is well understood [32]. The relevant meteorological parameters and pollutant data can be obtained from the model simulation to improve the monitoring data.

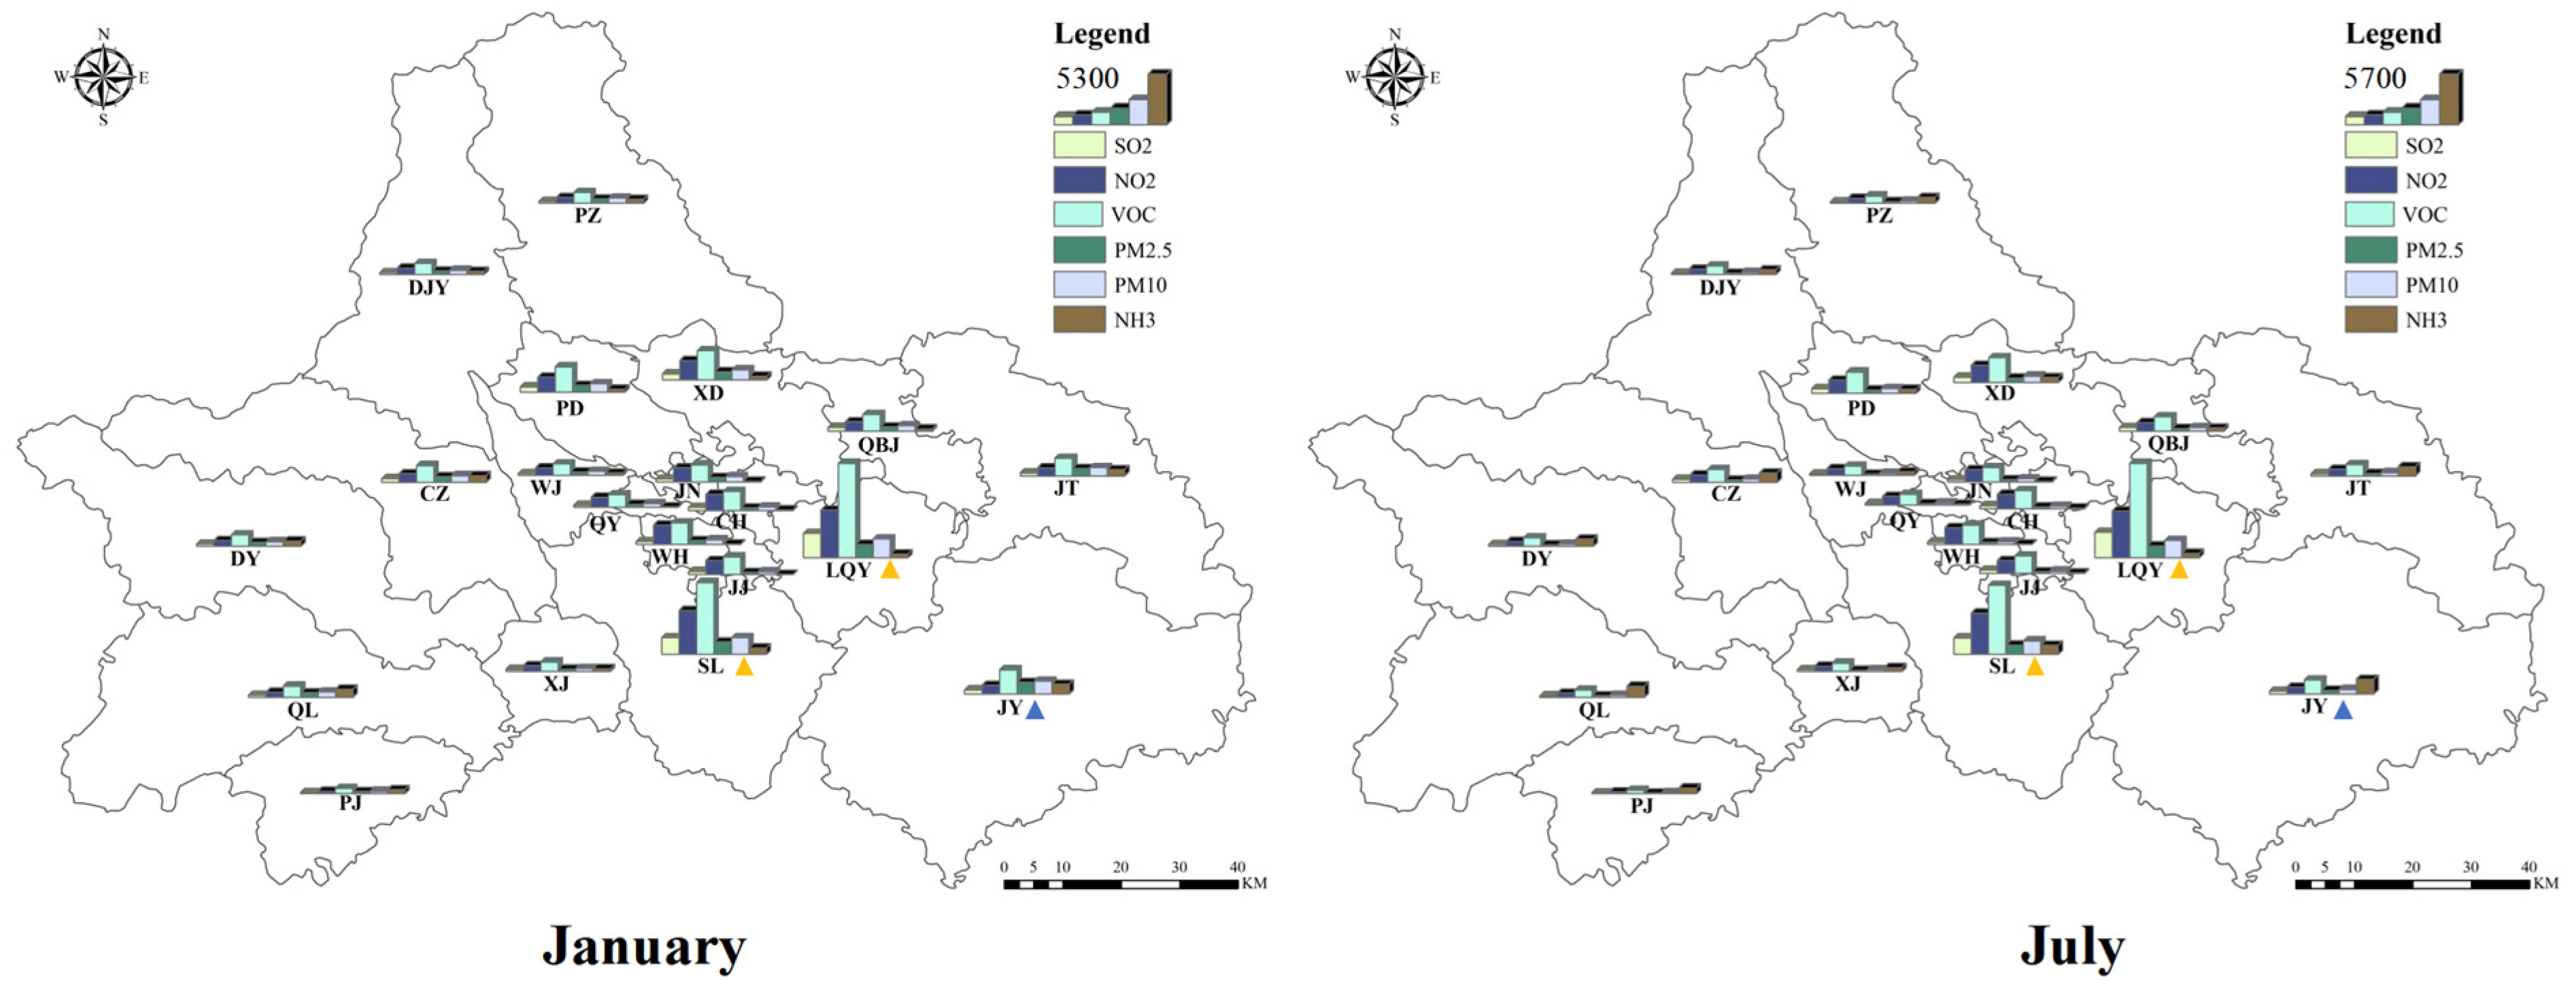
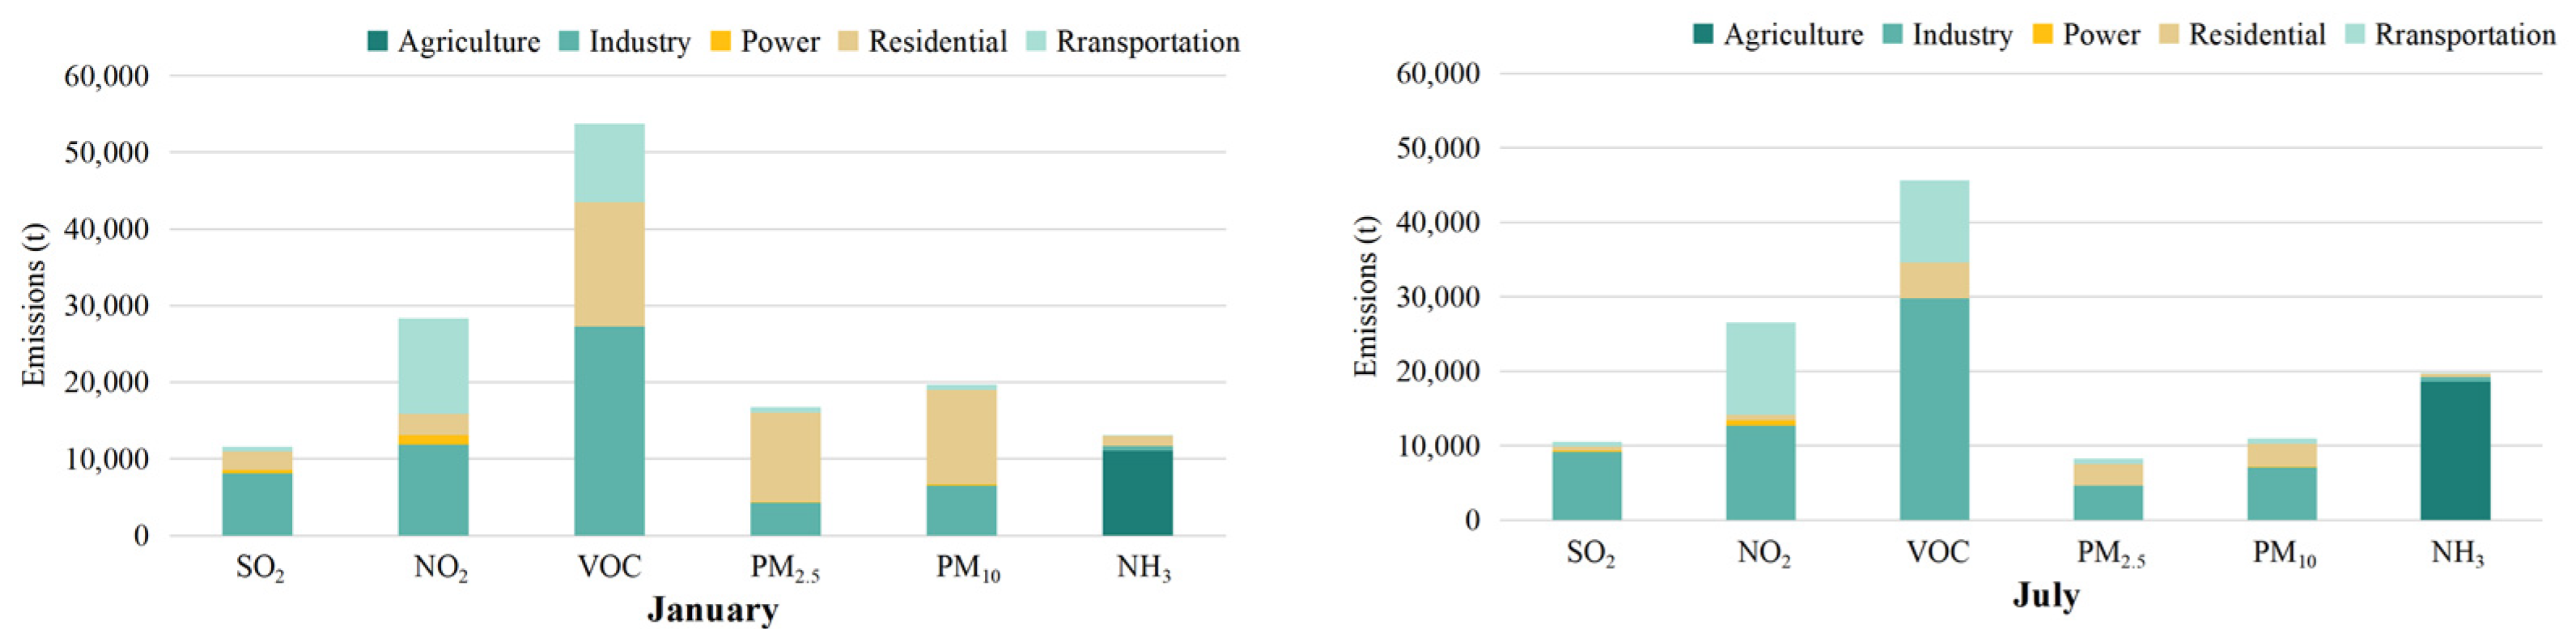
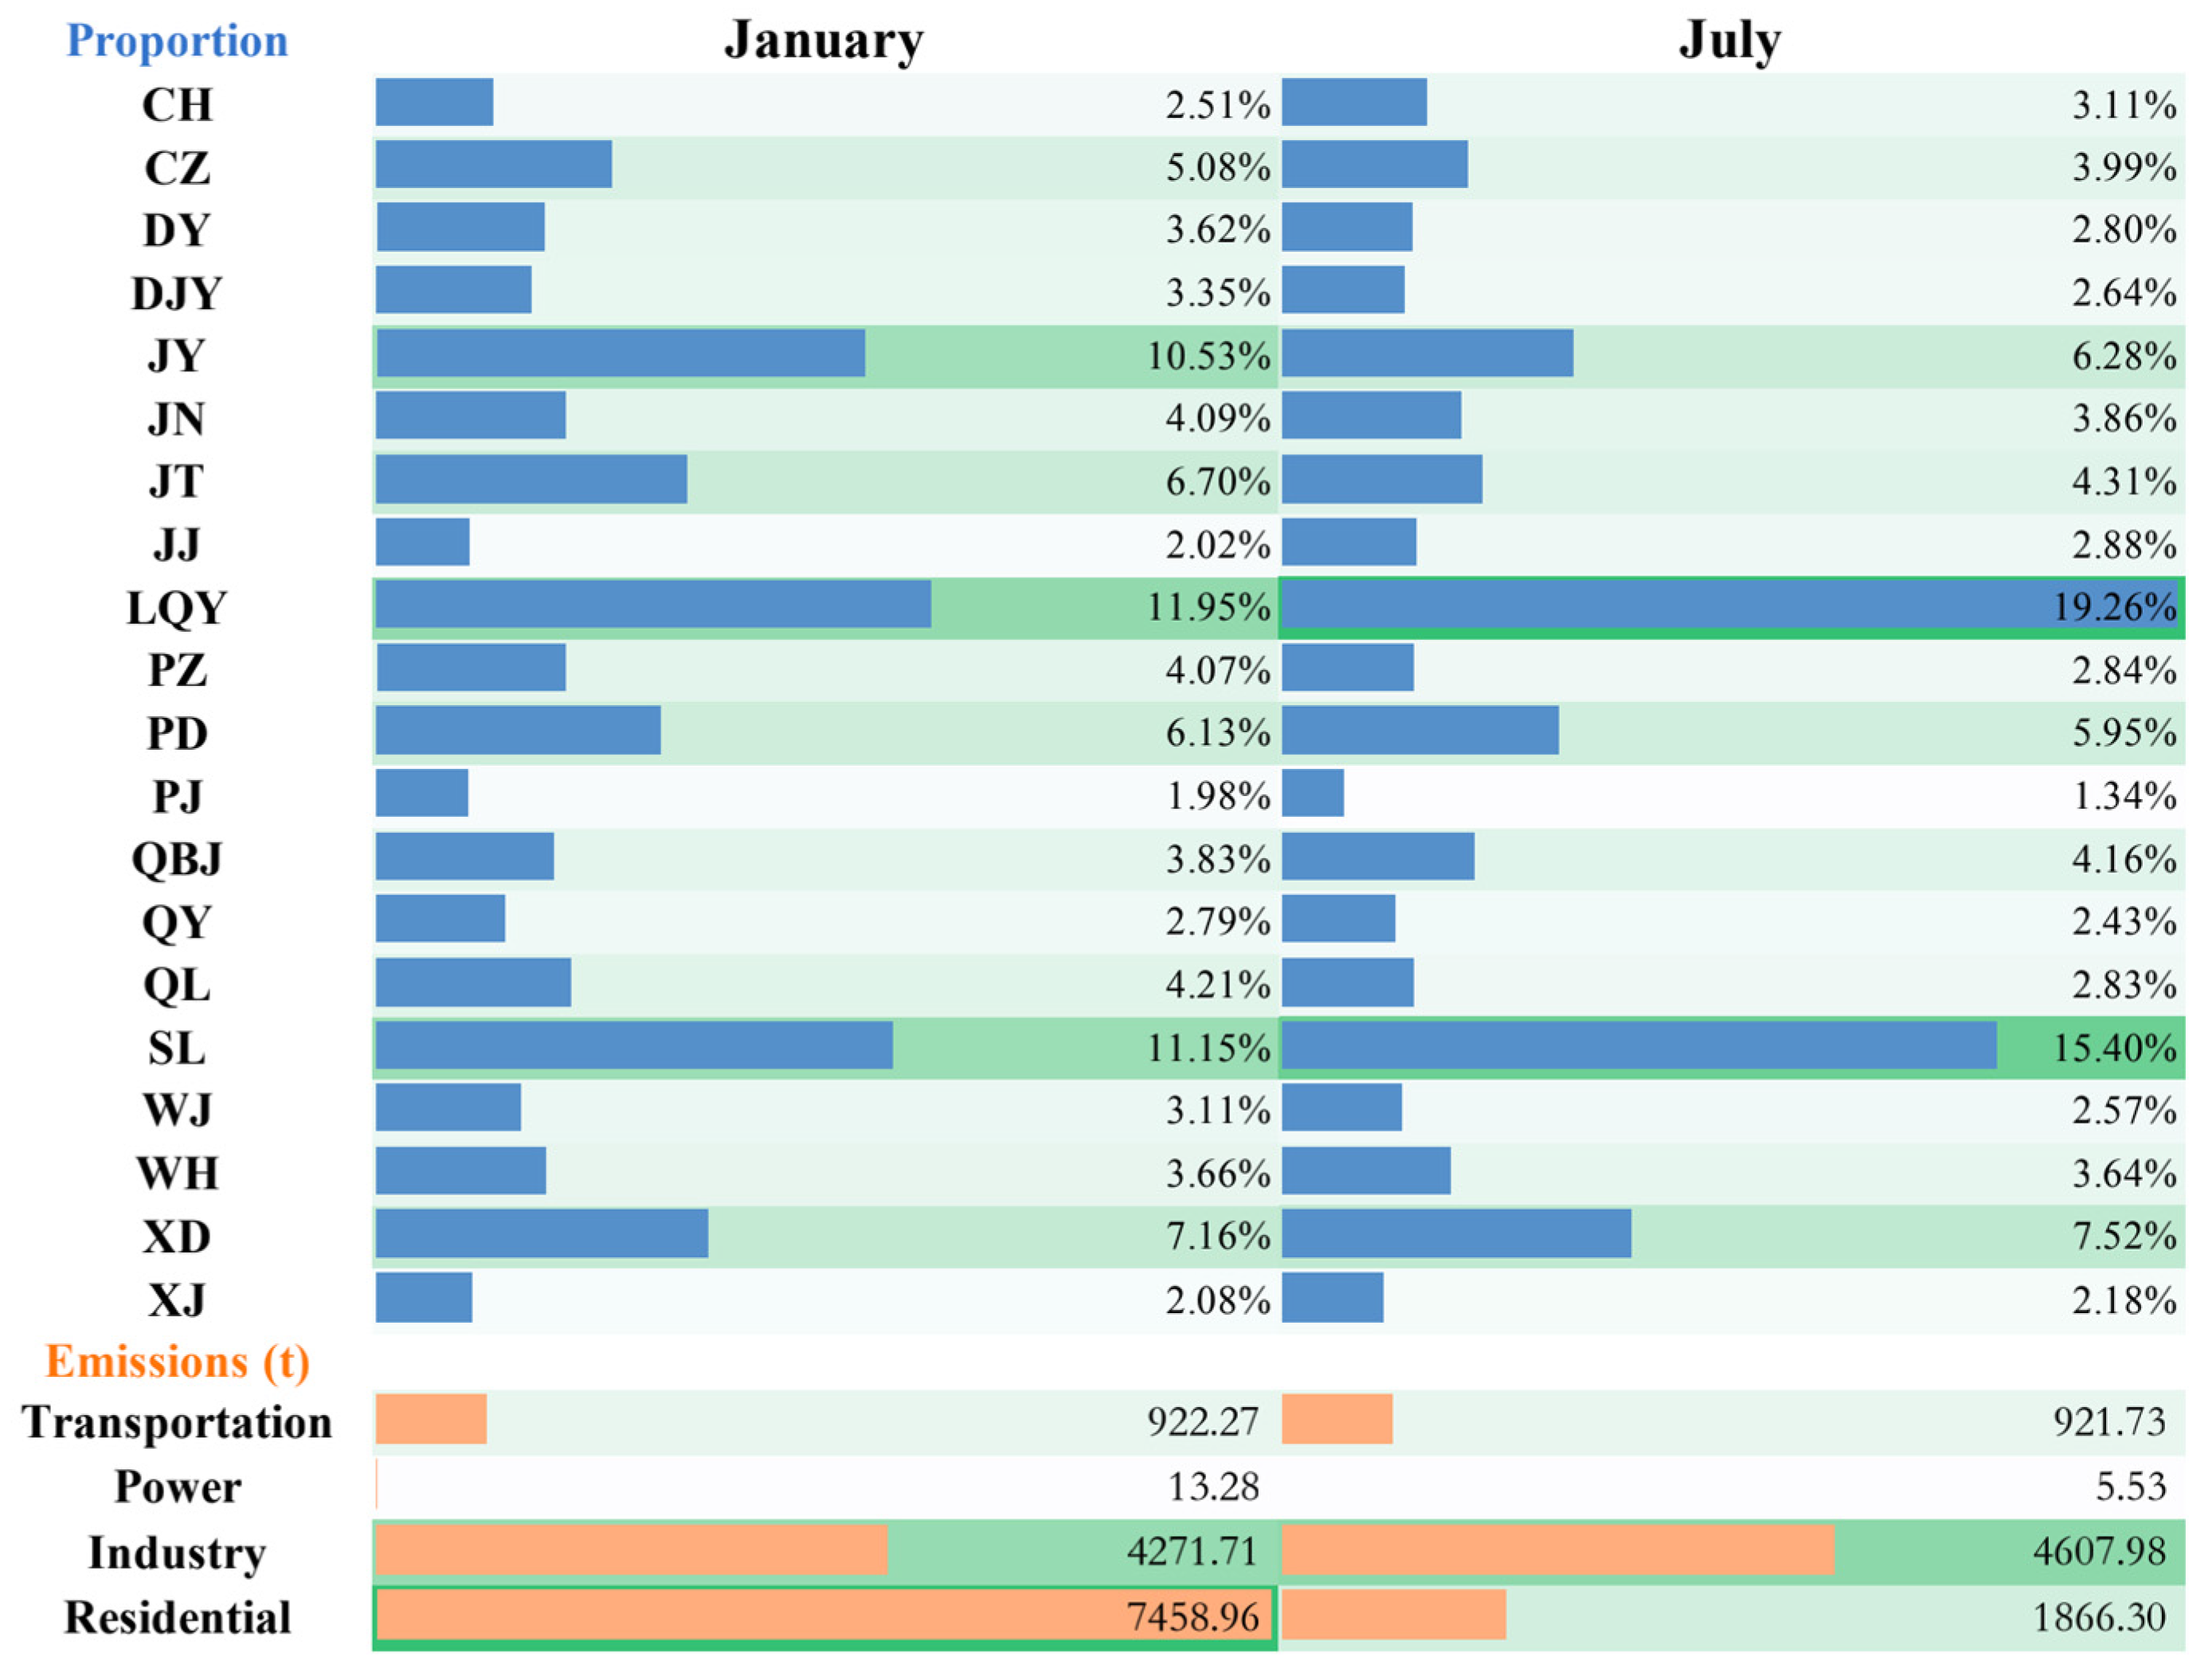
3.2. Spatial Distribution of Pollutant Emission

Based on the geographical and social information of Chengdu City, the multi-resolution Emission Inventory of China was used to make the Emission Inventory of Chengdu City and allocate its space. Figure 4 shows the emission distribution of air pollutants in various regions of Chengdu. Chengdu has jurisdiction over 12 municipal districts, three counties and five county-level cities, with a total area of 14,335 square kilometers. In January 2017, the emissions of SO2, NO2, NMVOC, PM2.5, PM10 and NH3 in Chengdu were 10619.96 t, 31023.33 t, 51228.96 t, 12666.22 t, 15369.05 t, 8625.33 t (Figure 5). In July, the pollutant emissions were 10314.87 t, 29867.42 t, 47378.47 t, 7401.54 t, 9992.24 t, 12804.24 t. Chengdu has a humid subtropical monsoon climate, heavy heating demand in winter and continuous industrial emissions have resulted in increased emissions of pollutants. Different from other pollutants, NH3 emissions in summer are much higher than in winter because NH3 mainly comes from animal husbandry and planting industry (Table 3). The emission of NH3 in the outer cities of Chengdu is relatively higher than that in the inner cities. Moreover, as a big agricultural country, China consumes high levels of nitrogen fertilizer and has large animal herds, which leads to vigorous industrial activities in summer [33,34].
Among the 21 districts in Chengdu, pollutant emissions are more noteworthy in Longquanyi District (LQY), Jianyang City (JY) and Shuangliu District (SL) (Table 3). In January 2017, LQY emitted SO2, NO2, NMVOC, PM2.5, PM10 of 2744.09 t, 5375.36 t, 10626.14 t, 1513.24 t, and 2119.62 t, respectively; SL emitted a total of 1869.86 t, 4947.65 t, 8092.08 t, 1412.34 t and 1874.20 t of SO2, NO2, NMVOC, PM2.5 and PM10, respectively, and the PM2.5, PM10 and NH3 emissions in JY were 1333.38 t. In July 2017, the total emissions of SO2, NO2, NMVOC, PM2.5 and PM10 in LQY were 3054.91 t, 5624.78 t, 11328.73 t, 1425.80 t and 2080.96 t, respectively, the emissions of the SO2, NO2, NMVOC, PM2.5 and PM10 in SL were 1988.40 t, 4968.72 t, 8291.53 t, 1139.61 t and 1623.60 t, respectively, and the NH3 emissions in JY were 1793.86 T. LQY, JY and SL are located in the southeast area of Chengdu, and the area, total population and GDP of the three areas account for about 22.75%, 16.80% and 18.76% of Chengdu. The pollutants emitted from the three regions accounted for 26.51–52.27% of the total emissions in Chengdu, especially JY NH3 emissions accounted for 13.00–14.11% in Chengdu.

Source and Distribution of PM2.5

Figure 6 and Figure 7 show the distribution of PM2.5 emissions in power, industry, residential and transportation sectors in Chengdu in January and July 2017. In Chengdu, the emission of PM2.5 in January was higher than that in July in four sectors, but the emission of PM2.5 in power sector was not obvious, as reflected in the proportion of total PM2.5 emissions in January and July was lower than 1% of the total. The emissions from the transportation sector were consistent with the distribution of roads and the total PM2.5 emissions from the transportation sector accounted for 7.28% in January and 12.45% in July. The total PM2.5 emissions of industrial and residential sectors accounted for a large proportion, but showed different trends. The industrial sectors emissions were relatively stable in two seasons. In January, the total PM2.5 emissions of industrial sectors accounted for 33.72% of the total emissions, and in July, the total PM2.5 emissions of industrial sectors was 4271.71 t (Figure 8), which accounted for 62.26% of the total emissions. The PM2.5 emissions of the residential sector in winter are about four times that of the summer, with the total PM2.5 emissions of the residential sector in January 7458.96 t accounting for 58.88% of the total emissions, and in July 1866.29 t accounting for 25.21% of the total emissions. With the rapid economic development and the continuous improvement of the industrial system, the growth rate of emissions from industrial sources has slowed down. The urbanization process has caused the increase of emissions from urban residents and transportation sources with high population density. Although the reduction of solid fuel has improved this phenomenon, it should be paid attention to under the background of large base [35,36,37].

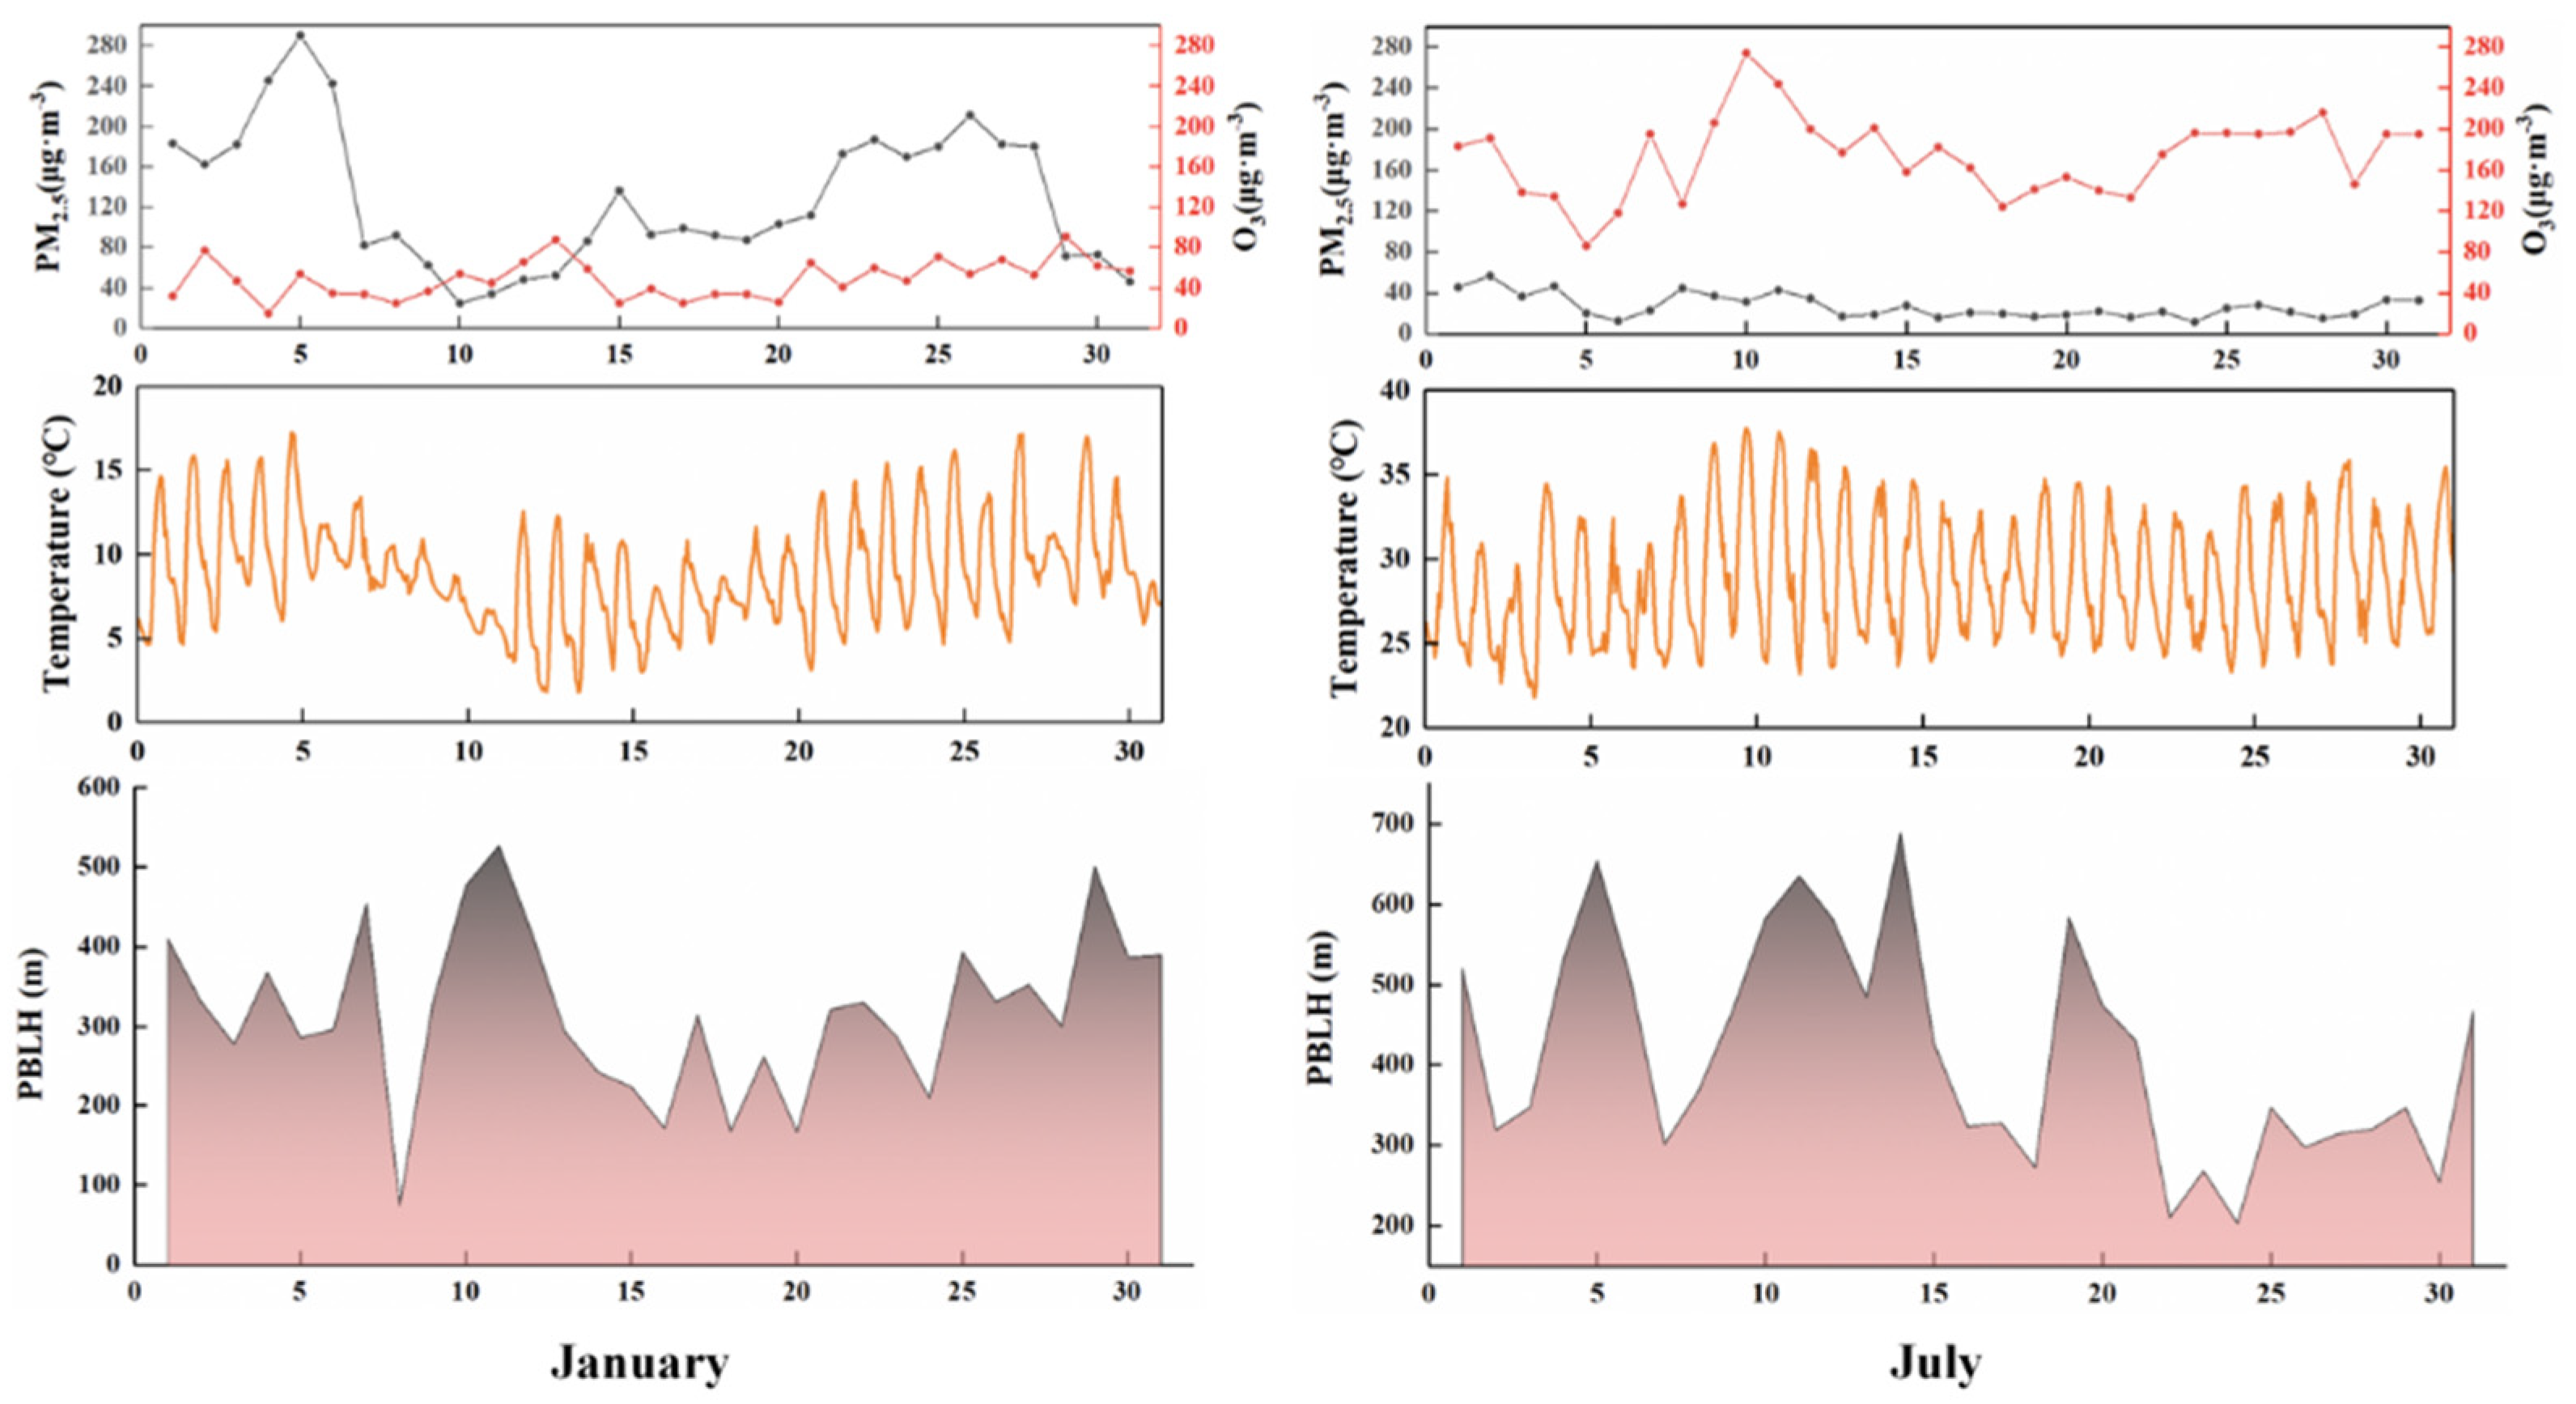
3.3. Variation in Pollutant Concentration
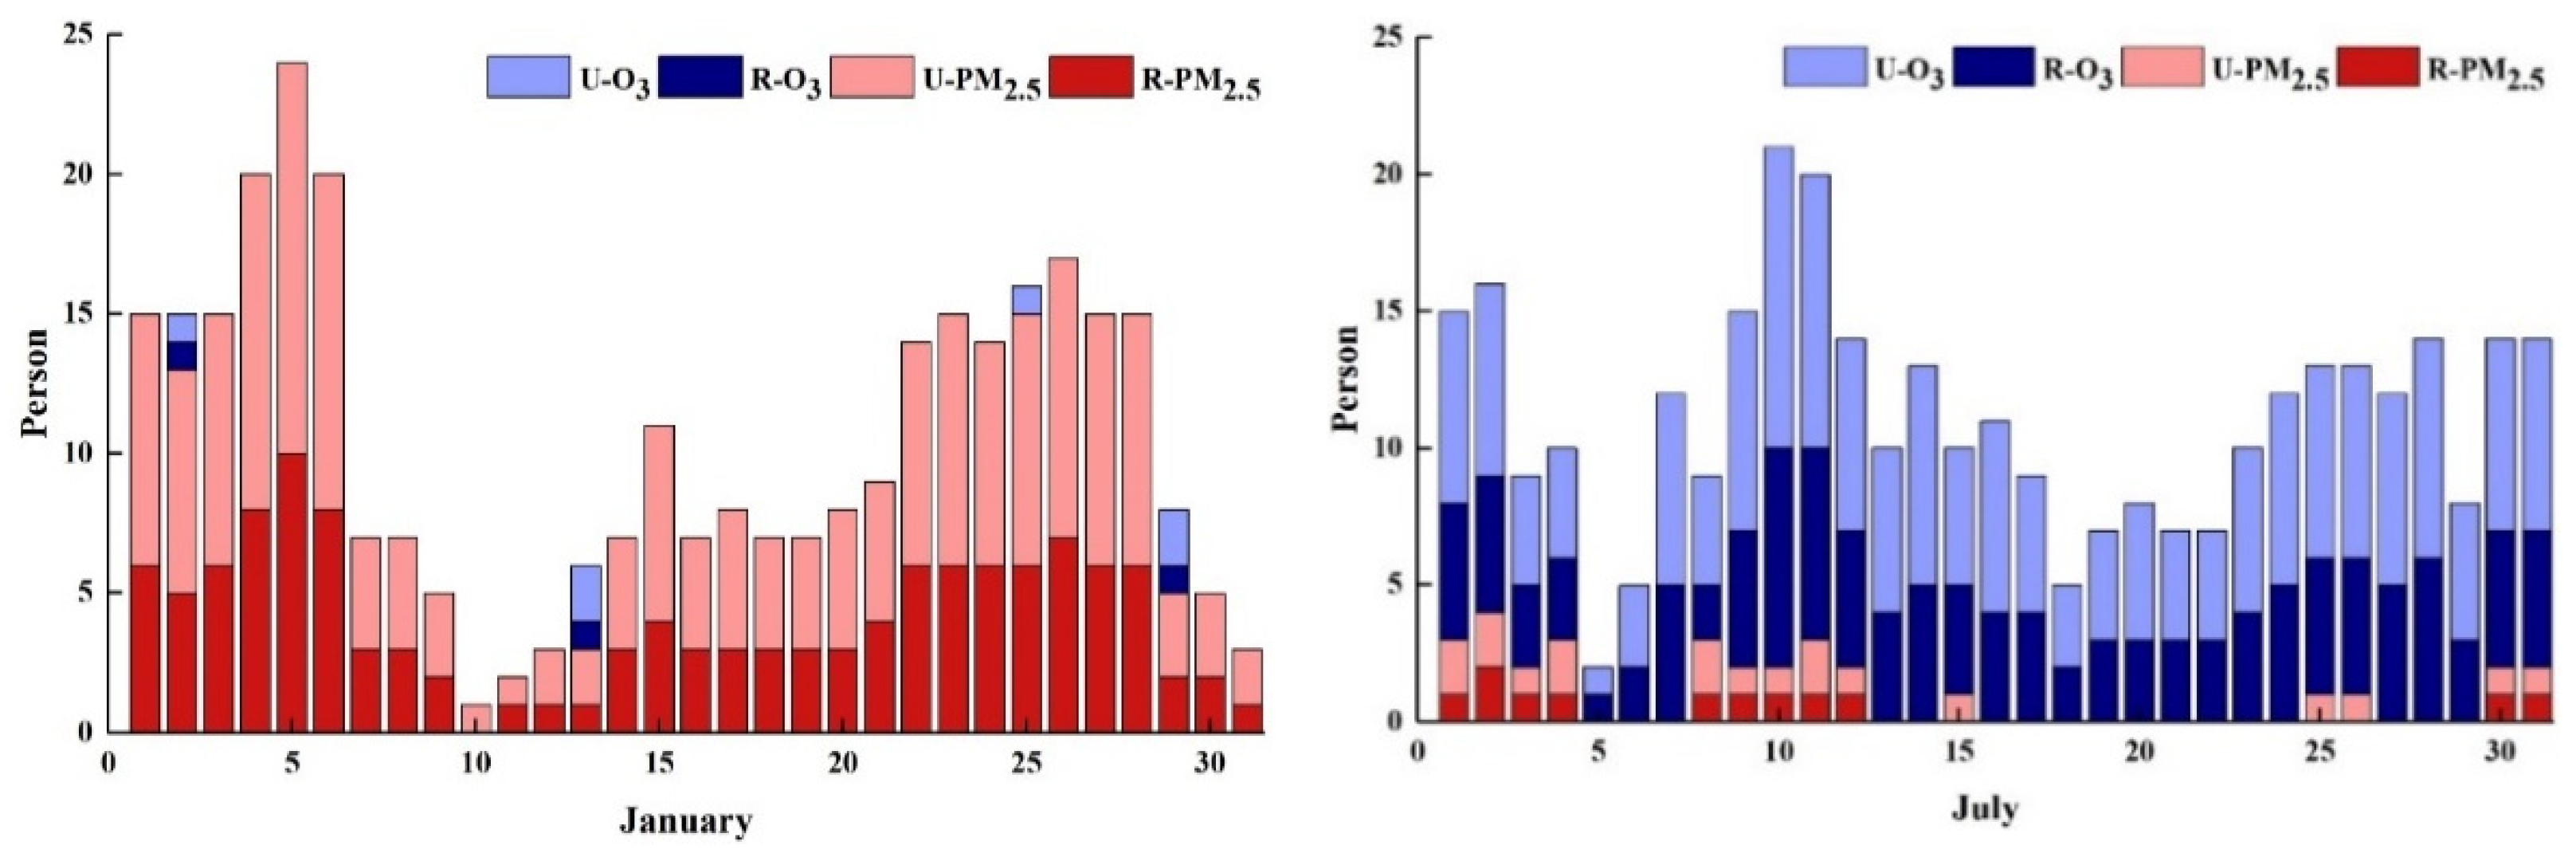
In 2017, the PM2.5 concentration in Chengdu shows an opposite trend to O3 concentration (Figure 9). In winter, the demand and consumption of energy are large in various sectors, especially in the residential sector for household kitchens and heating. The PM2.5 concentration was high in winter and low in summer, with an average PM2.5 concentration of 128.79 ug·m−3 in January and 26.82 ug·m−3 in July. The concentration of O3 in winter was lower than that in summer. The average concentration of O3 in January was 27.42 ug·m−3, and it was 97.47 ug·m−3 in July. In January, PM2.5 concentration showed two large fluctuation peaks from 4th to 6th and from 21th to 28th, and in July, O3 concentration showed two large fluctuation peaks from 9th to 11th and from 25th to 28th. In 2017, the average temperature in January was 8.92 °C and the average temperature in July was 28.57 °C. Temperature can indirectly affect the generation and diffusion of pollutants by affecting the height of planetary boundary (PBLH) and the rate of chemical reactions. The variations in temperature and PBLH from January 1th to 6th and from January 21th to 28th are consistent, but the influence of such changes on the concentration of pollutants is not obvious. This may be because PM2.5 emissions are larger in winter and the overall PBLH height is low. In summer, high temperature and sunshine duration have a strong promoting effect on high O3 pollution events. On sunny days, under the strong ultraviolet radiation, VOCs and NOx emitted by human being are easy to generate O3 through photochemical reactions. In July, Chengdu City had severe daily O3 pollution (265 ug·m−3~800 ug·m−3). The number of days with moderate pollution was (215 ug·m−3~265 ug·m−3) 2 days, and the number of days with mild pollution was (165 ug·m−3~215 ug·m−3) 16 days.

3.4. Health Burden

As shown in Figure 10, the primary pollutant affecting human health in Chengdu in January 2017 was PM2.5, and it was O3 in July 2017. The industrial and residential sectors accounted for 92.61% of the total PM2.5 emissions in January. Therefore, only from the perspective of local emissions, the industrial and residential sectors contributed the most to the health loss caused by PM2.5, which is also consistent with the study of Hu, J.L. et al. [17]. PM2.5 pollution caused 351 deaths, O3 pollution caused 328 deaths, among which 276 deaths in rural areas and 413 deaths in urban areas were caused by pollutants. In January 2017, the mortality rate of PM2.5 pollution was 317 (95%CI: 247–388), including 129 (95%CI: 101–158) in rural areas and 188 (95%CI: 147–230) in urban areas. In July 2017, the mortality rate of PM2.5 pollution was 34 (95%CI: 22–46), including 14 (95%CI: 9–19) in rural areas and 20 (95%CI: 13–27) in urban areas. In January 2017, the mortality rate of O3 pollution was 10 (95%CI: 1–18), including 4 (95%CI: 1–8) in rural areas and 6 (95%CI: 1–11) in urban areas. In July 2017, the mortality rate of O3 pollution was 318 (95%CI: 22–46), including 129 (95%CI: 113–146) in rural areas and 189 (95%CI: 165–213) in urban areas.

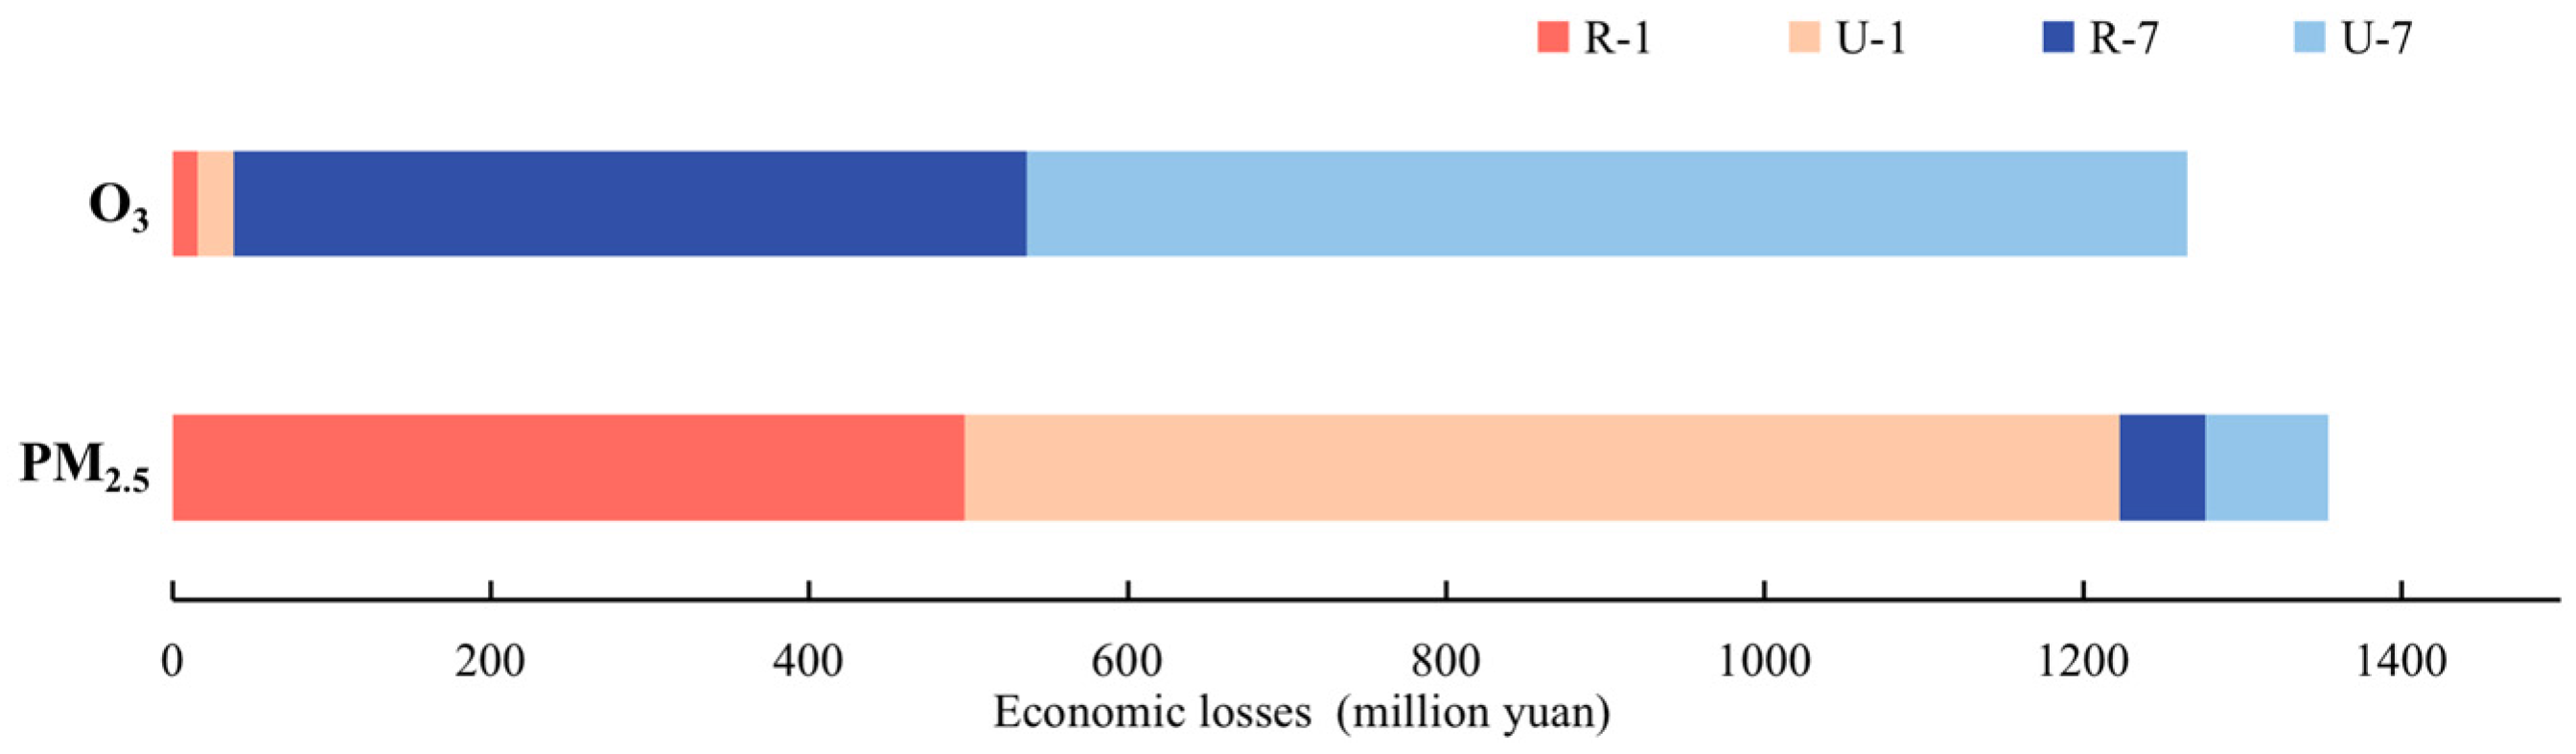
3.5. Economic Losses

The economic losses caused by PM2.5 and O3 air pollution were calculated based on vital statistical value (VSL). PM2.5 and O3 cause great economic losses in winter and summer, respectively (Figure 11). In January 2017, the health economic loss caused by PM2.5 in the air was 497.69 million yuan (95%CI: 389.65–609.55) in rural areas, and 725.29 million yuan (95%CI:567.11–887.32) in urban areas. In July 2017, the health economic loss caused by O3 in the air was 497.69 million yuan (95%CI: 435.94–563.26) in rural areas, and 729.15 million yuan (95%CI: 636.56–821.74) in urban areas. In January and July 2017, the health economic loss caused by PM2.5 was 1354.13 million yuan, accounting for 0.0974% of GDP of Chengdu in 2017. At the same time, the health economic loss caused by O3 was 1265.40 million yuan, accounting for 0.0910% of GDP of Chengdu in 2017.

4. Conclusions

The emission of pollutants in Chengdu is spatially focused on the area extending from downtown Chengdu to the southeast, and special attention should be paid to the LQY, JY and SL districts for regional emission control. The emission of PM2.5 pollutants from industrial and residential sectors is dominant. The seasonal fluctuation of PM2.5 emission from residential sectors is strong, and winter is much higher than summer.
The main pollutant is PM2.5 in winter and O3 in summer. Temperature can indirectly affect the previous diffusion of pollutants by affecting the boundary layer height, and high temperature has a promoting effect on the generation of O3. In Chengdu, PM2.5 and O3 pollution have a great impact on human health. In January and July, 351 deaths were caused by PM2.5 pollution, 328 deaths were caused by O3 pollution, 276 deaths in rural areas and 413 deaths in urban areas. The economic losses caused by PM2.5 and O3 accounted for a large proportion of the gross regional product (GDP) of Chengdu in 2017. In the future, attention should be paid to PM2.5 pollution control in winter and O3 pollution control in summer.
This study was based on the WRF-CMAQ model of pollutants and their health effects in Chengdu. Attention is still required to assess future research model parameterization schemes for the adjustment of the various regions and other pollutants to the health effects of towns and rural locations based on the same level as well as the external conditions, and the regional need to strengthen the monitoring of pollutants in rural areas at the same time, in order to fully understand the environmental pollution and environmental injustice caused by the urbanization process.

Author Contributions

J.W.: conceptualization, project administration, investigation, writing—review and editing. J.L.: conceptualization, methodology, formal analysis, writing—original draft, visualization. X.L.: conceptualization, investigation. C.F.: conceptualization, project administration. All authors have read and agreed to the published version of the manuscript.

Funding

Supported by Graduate Innovation Fund of Jilin University.

Informed Consent Statement

Informed consent was obtained from all subjects involved in the study.

Data Availability Statement

Not applicable.

Acknowledgments

The authors wish to thank all members of the 142 and the 537 research groups for their help and guidance for this study.

Conflicts of Interest

The authors declare no conflict of interest.

References

  1. Chen, Y.; Li, H.; Karimian, H.; Li, M.; Fan, Q.; Xu, Z. Spatio-temporal variation of ozone pollution risk and its influencing factors in China based on Geodetector and Geospatial models. Chemosphere 2022, 302, 134843. [Google Scholar] [CrossRef] [PubMed]
  2. Edlund, K.K.; Killman, F.; Molnar, P.; Boman, J.; Stockfelt, L.; Wichmann, J. Health Risk Assessment of PM2.5 and PM2.5-Bound Trace Elements in Thohoyandou, South Africa. Int. J. Environ. Res. Public Health 2021, 18, 1359. [Google Scholar] [CrossRef] [PubMed]
  3. Lee, J.K.; Kwak, M.J.; Jeong, S.G.; Woo, S.Y. Individual and Interactive Effects of Elevated Ozone and Temperature on Plant Responses. Horticulturae 2022, 8, 211. [Google Scholar] [CrossRef]
  4. Li, Y.; Liao, Q.; Zhao, X.-G.; Bai, Y.; Tao, Y. Influence of PM2.5 Pollution on Health Burden and Economic Loss in China. Huan Jing Ke Xue Huanjing Kexue 2021, 42, 1688–1695. [Google Scholar] [CrossRef] [PubMed]
  5. Wu, Y.; Yang, X.; Wang, H.; Jia, G.; Wang, T. Relationship between ambient PM2.5 exposure and blood cadmium level in children under 14 years in Beijing, China. J. Hazard. Mater. 2021, 403, 123871. [Google Scholar] [CrossRef] [PubMed]
  6. Liu, S.; Tian, H.; Luo, L.; Bai, X.; Zhu, C.; Lin, S.; Zhao, S.; Zhang, K.; Hao, J.; Guo, Z.; et al. Health impacts and spatiotemporal variations of fine particulate and its typical toxic constituents in five urban agglomerations of China. Sci. Total Environ. 2022, 806, 151459. [Google Scholar] [CrossRef]
  7. Bai, R.; Lam, J.C.K.; Li, V.O.K. A review on health cost accounting of air pollution in China. Environ. Int. 2018, 120, 279–294. [Google Scholar] [CrossRef]
  8. Feng, S.; Gao, D.; Liao, F.; Zhou, F.; Wang, X. The health effects of ambient PM2.5 and potential mechanisms. Ecotoxicol. Environ. Saf. 2016, 128, 67–74. [Google Scholar] [CrossRef]
  9. Jin, X.; Holloway, T. Spatial and temporal variability of ozone sensitivity over China observed from the Ozone Monitoring Instrument. J. Geophys. Res.-Atmos. 2015, 120, 7229–7246. [Google Scholar] [CrossRef]
  10. Liu, S.; Zhang, Y.; Ma, R.; Liu, X.; Liang, J.; Lin, H.; Shen, P.; Zhang, J.; Lu, P.; Tang, X.; et al. Long-term exposure to ozone and cardiovascular mortality in a large Chinese cohort. Environ. Int. 2022, 165, 107280. [Google Scholar] [CrossRef]
  11. Li, X.-B.; Fan, G. Interannual variations, sources, and health impacts of the springtime ozone in Shanghai. Environ. Pollut. 2022, 306, 119458. [Google Scholar] [CrossRef]
  12. Faridi, S.; Shamsipour, M.; Krzyzanowski, M.; Kunzli, N.; Amini, H.; Azimi, F.; Malkawi, M.; Momeniha, F.; Gholampour, A.; Hassanvand, M.S.; et al. Long-term trends and health impact of PM2.5 and O-3 in Tehran, Iran, 2006-2015. Environ. Int. 2018, 114, 37–49. [Google Scholar] [CrossRef] [PubMed]
  13. Lei, R.; Nie, D.; Zhang, S.; Yu, W.; Ge, X.; Song, N. Spatial and temporal characteristics of air pollutants and their health effects in China during 2019-2020. J. Environ. Manag. 2022, 317, 115460. [Google Scholar] [CrossRef] [PubMed]
  14. Liu, J.; Yin, H.; Tang, X.; Zhu, T.; Zhang, Q.; Liu, Z.; Tang, X.; Yi, H. Transition in air pollution, disease burden and health cost in China: A comparative study of long-term and short-term exposure. Environ. Pollut. 2021, 277, 116770. [Google Scholar] [CrossRef] [PubMed]
  15. Xiao, Q.; Geng, G.; Xue, T.; Liu, S.; Cai, C.; He, K.; Zhang, Q. Tracking PM2.5 and O3 Pollution and the Related Health Burden in China 2013–2020. Environ. Sci. Technol. 2022, 56, 6922–6932. [Google Scholar] [CrossRef]
  16. Zhang, J.; Chen, Q.; Wang, Q.; Ding, Z.; Sun, H.; Xu, Y. The acute health effects of ozone and PM2.5 on daily cardiovascular disease mortality: A multi-center time series study in China. Ecotoxicol. Environ. Saf. 2019, 174, 218–223. [Google Scholar] [CrossRef]
  17. Hu, J.; Huang, L.; Chen, M.; Liao, H.; Zhang, H.; Wang, S.; Zhang, Q.; Ying, Q. Premature Mortality Attributable to Particulate Matter in China: Source Contributions and Responses to Reductions. Environ. Sci. Technol. 2017, 51, 9950–9959. [Google Scholar] [CrossRef]
  18. Ding, D.; Xing, J.; Wang, S.; Liu, K.; Hao, J. Estimated Contributions of Emissions Controls, Meteorological Factors, Population Growth, and Changes in Baseline Mortality to Reductions in Ambient [Formula: See text] and [Formula: See text]-Related Mortality in China, 2013-2017. Environ. Health Perspect. 2019, 127, 67009. [Google Scholar] [CrossRef]
  19. Lei, R.; Zhu, F.; Cheng, H.; Liu, J.; Shen, C.; Zhang, C.; Xu, Y.; Xiao, C.; Li, X.; Zhang, J.; et al. Short-term effect of PM2.5/O3 on non-accidental and respiratory deaths in highly polluted area of China. Atmos. Pollut. Res. 2019, 10, 1412–1419. [Google Scholar] [CrossRef]
  20. Xie, Y.; Dai, H.; Zhang, Y.; Wu, Y.; Hanaoka, T.; Masui, T. Comparison of health and economic impacts of PM2.5 and ozone pollution in China. Environ. Int. 2019, 130, 104881. [Google Scholar] [CrossRef]
  21. Li, M.; Liu, H.; Geng, G.; Hong, C.; Liu, F.; Song, Y.; Tong, D.; Zheng, B.; Cui, H.; Man, H.; et al. Anthropogenic emission inventories in China: A review. Natl. Sci. Rev. 2017, 4, 834–866. [Google Scholar] [CrossRef]
  22. Zheng, B.; Tong, D.; Li, M.; Liu, F.; Hong, C.; Geng, G.; Li, H.; Li, X.; Peng, L.; Qi, J.; et al. Trends in China’s anthropogenic emissions since 2010 as the consequence of clean air actions. Atmos. Chem. Phys. 2018, 18, 14095–14111. [Google Scholar] [CrossRef] [Green Version]
  23. Nie, D.; Shen, F.; Wang, J.; Ma, X.; Li, Z.; Ge, P.; Ou, Y.; Jiang, Y.; Chen, M.; Chen, M.; et al. Changes of air quality and its associated health and economic burden in 31 provincial capital cities in China during COVID-19 pandemic. Atmos. Res. 2021, 249, 105328. [Google Scholar] [CrossRef] [PubMed]
  24. Silva, R.A.; Adelman, Z.; Fry, M.M.; West, J.J. The Impact of Individual Anthropogenic Emissions Sectors on the Global Burden of Human Mortality due to Ambient Air Pollution. Environ. Health Perspect. 2016, 124, 1776–1784. [Google Scholar] [CrossRef] [Green Version]
  25. Shang, Y.; Sun, Z.; Cao, J.; Wang, X.; Zhong, L.; Bi, X.; Li, H.; Liu, W.; Zhu, T.; Huang, W. Systematic review of Chinese studies of short-term exposure to air pollution and daily mortality. Environ. Int. 2013, 54, 100–111. [Google Scholar] [CrossRef]
  26. Dong, J.; Liu, X.; Zhang, B.; Wang, J.; Shang, K. Meta-analysis of association between short-term ozone exposure and population mortailty in China. Acta Sci. Circum. 2016, 36, 1477–1485. [Google Scholar] [CrossRef]
  27. Huang, D.; Xu, J.; Zhang, S. Valuing the health risks of particulate air pollution in the Pearl River Delta, China. Environ. Sci. Policy 2012, 15, 38–47. [Google Scholar] [CrossRef]
  28. Peng, F.; Li, X.; Ma, D.; Zhou, Y.; Yu, F.; Zhang, Y.; Yang, W. Assessing the Value of a Statistical Life of Air Pollution in Chengdu Chongqing Area by Contingent Value Method with Single Bounded Dichotomy. Chin. J. Environ. Manag. 2021, 13, 136–141+111. [Google Scholar] [CrossRef]
  29. Wang, J.; Wang, S.; Voorhees, A.S.; Zhao, B.; Jang, C.; Jiang, J.; Fu, J.S.; Ding, D.; Zhu, Y.; Hao, J. Assessment of short-term PM2.5-related mortality due to different emission sources in the Yangtze River Delta, China. Atmos. Environ. 2015, 123, 440–448. [Google Scholar] [CrossRef]
  30. Diao, B.; Ding, L.; Zhang, Q.; Na, J.; Cheng, J. Impact of Urbanization on PM2.5-Related Health and Economic Loss in China 338 Cities. Int. J. Environ. Res. Public Health 2020, 17, 990. [Google Scholar] [CrossRef]
  31. Hu, J.; Chen, J.; Ying, Q.; Zhang, H. One-year simulation of ozone and particulate matter in China using WRF/CMAQ modeling system. Atmos. Chem. Phys. 2016, 16, 10333–10350. [Google Scholar] [CrossRef] [Green Version]
  32. Fang, C.; Qiu, J.; Li, J.; Wang, J. Analysis of the meteorological impact on PM2.5 pollution in Changchun based on KZ filter and WRF-CMAQ. Atmos. Environ. 2022, 271, 118924. [Google Scholar] [CrossRef]
  33. Yu, X.N.; Shen, L.; Hou, X.H.; Yuan, L.; Pan, Y.P.; An, J.L.; Yan, S.Q. High-resolution anthropogenic ammonia emission inventory for the Yangtze River Delta, China. Chemosphere 2020, 251, 126342. [Google Scholar] [CrossRef]
  34. Liao, W.; Liu, M.; Huang, X.; Wang, T.; Xu, Z.; Shang, F.; Song, Y.; Cai, X.; Zhang, H.; Kang, L.; et al. Estimation for ammonia emissions at county level in China from 2013 to 2018. Sci. China-Earth Sci. 2022, 65, 1116–1127. [Google Scholar] [CrossRef]
  35. Zheng, H.; Zhao, B.; Wang, S.; Wang, T.; Ding, D.; Chang, X.; Liu, K.; Xing, J.; Dong, Z.; Aunan, K.; et al. Transition in source contributions of PM2.5 exposure and associated premature mortality in China during 2005–2015. Environ. Int. 2019, 132, 105111. [Google Scholar] [CrossRef]
  36. Fang, C.; Wang, L.; Gao, H.; Wang, J. Analysis of the PM2.5 emission inventory and source apportionment in Jilin City, Northeast of China. Environ. Sci. Pollut. Res. 2020, 27, 37324–37332. [Google Scholar] [CrossRef]
  37. Liu, X.; Bai, X.; Tian, H.; Wang, K.; Hua, S.; Liu, H.; Liu, S.; Wu, B.; Wu, Y.; Liu, W.; et al. Fine particulate matter pollution in North China: Seasonal-spatial variations, source apportionment, sector and regional transport contributions. Environ. Res. 2020, 184, 109368. [Google Scholar] [CrossRef]
Figure 1. Three-level nested modeling domains.
Ijerph 19 16852 g001
Figure 2. Time series of temperature at 2 m (T2), wind speed at 10 m (U10), PM2.5 and O3 concentration in Chengdu in January 2017. Black is the observed value and orange is the simulated value.
Ijerph 19 16852 g002
Figure 3. Time series of temperature at 2 m (T2), wind speed at 10 m (U10), PM2.5 and O3 concentration in Chengdu in July 2017. Black is the observed value and orange is the simulated value.
Ijerph 19 16852 g003
Figure 4. Emission distribution map of air pollutants in various regions of Chengdu (unit: t); the districts include Chenghua District (CH), Chongzhou City (CZ), Dayi County (DY), Dujiangyan (DJY), Jianyang City (JY), Jinniu District (JN), Jintang County (JT), Jinjiang District (JJ), Longquanyi District (LQY), Pengzhou City (PZ), Pidu District (PD), Pujiang County (PJ), Qingbaijiang District (QBJ), Qingyang District (QY), Qionglai City (QL), Shuangliu District (SL), Wenjiang District (WJ), Wuhou District (WH), Xindu District (XD), Xinjin District (XJ).
Ijerph 19 16852 g004
Figure 5. Emission of pollutants in agriculture, industry, power, residential and transportation sectors.
Ijerph 19 16852 g005
Figure 6. PM2.5 emission distribution of power, industry, residential and transportation sectors in Chengdu, January 2017.
Ijerph 19 16852 g006
Figure 7. PM2.5 emission distribution of power, industry, residential and transportation sectors in Chengdu, July 2017.
Ijerph 19 16852 g007
Figure 8. The proportion of PM2.5 emissions in Chengdu and the emissions by sectors; blue represents the ranking of PM2.5 emissions, orange represents the ranking of PM2.5 emissions by sector, and green is the background color changing with the ranking.
Ijerph 19 16852 g008
Figure 9. Daily changes in PM2.5, MDA8 O3, temperature, and PBLH.
Ijerph 19 16852 g009
Figure 10. Health losses caused by PM2.5 and O3 in rural (R) and urban (U) areas of Chengdu in 2017.
Ijerph 19 16852 g010
Figure 11. Economic losses caused by pollutants in urban (U) and rural (R).
Ijerph 19 16852 g011
Table 1. Model simulation in Chengdu, January 2017.
NMBNMER
T20.0060550.3794400.781
U10−0.0096000.7895650.048
PM2.5−0.6061180.7468950.463
O30.4099070.4973840.457
Table 2. Model simulation in Chengdu, July 2017.
NMBNMER
T20.0174400.1875260.799
U10−0.1393460.886220−0.005
PM2.5−0.4956270.7264150.400
O3−0.2937570.5968310.577
Table 3. Pollutant emissions by region in Chengdu in January 2017 (units: t), July’s higher pollutant emissions than January are marked by blue numbers.
AreaSO2NO2VOCPM2.5PM10NH3
JanuaryJulyJanuaryJulyJanuaryJulyJanuaryJulyJanuaryJulyJanuaryJuly
CH362.84352.631837.831746.32142.112173.64317.33229.86385.60295.3276.6193.79
CZ411.17349.08992.42884.471882.101527.98643.57295.6753.16386.85755.821132.72
DY267.39227.35667.57605.551298.131034.94458.50207.19532.58269.78619.60898.18
DJY226.94194.17737.596881267.571028.61423.93195.54489.15252.36386.13577.88
JY485.79349.07998.13842.462733.331689.081333.38464.661469.92561.11131.001793.86
JN316.05258.991627.171491.781936.171727.73517.68285.82614.20373.4491.1796.89
JT340.29257.07919.50821.111979.851362.59848.87319.1943.85390.39720.801115.05
JJ371.58378.771593.351538.41991.422079.72255.91213.26324.88282.7259.3370.72
LQY2744.093054.915375.365624.7810628.1411328.731513.241425.82119.622080.96419.82538.8
PZ209.38158.29674.13608.381232.13877.41515.10210.53583.39266.34461.81734.48
PD588.69561.071695.121620.972858.392575.15776.47440.72939.40596.57344.73525.08
PJ109.6186.01273.82242.73588.75413.92251.0299.49283.29125.34478.40702.09
QBJ409.09407.011055.121029.71845.371716.33484.60307.96607.43430.99241.07362.92
QY218.86176.831146.261048.511420.531269.72352.98179.82406.61224.9390.53111.48
QL227.57175.44584.84515.941254.05879.56533.84209.18601.10262.43927.051333.8
SL1869.861988.44947.654968.728092.088291.531412.341139.611874.201623.6736.251101.61
WJ215.41185.35869.13820.681310.341106.12393.76189.87454.47243.25292.75457.08
WH349.37296.862202.872049.342431.322323.2463.36269.46535.86331.6477.1573.69
XD668.57636.462171.212085.583267.322972.39907.06556.51124.98771.72402.94616.03
XJ227.41221.12654.26634.051069.881000.11263.29161.58325.35222.54312.37468.08
Publisher’s Note: MDPI stays neutral with regard to jurisdictional claims in published maps and institutional affiliations.

