Article

The Effects of COVID-19 Lockdown on Air Pollutant Concentrations across China: A Google Earth Engine-Based Analysis

1
School of Geographical Sciences, Key Laboratory of Geographical Processes and Ecological Security of Changbai Mountains, Ministry of Education, Northeast Normal University, Changchun 130024, China
2
CenNavi Technologies Co., Ltd., Beijing 100094, China
3
State Key Laboratory of Resources and Environmental Information System, Beijing 100010, China
*
Authors to whom correspondence should be addressed.
Int. J. Environ. Res. Public Health 2022, 19(24), 17056; https://doi.org/10.3390/ijerph192417056
Submission received: 28 October 2022 / Revised: 13 December 2022 / Accepted: 15 December 2022 / Published: 19 December 2022

Abstract

:
To overcome the spread of the severe COVID-19 outbreak, various lockdown measures have been taken worldwide. China imposed the strictest home-quarantine measures during the COVID-19 outbreak in the year 2020. This provides a valuable opportunity to study the impact of anthropogenic emission reductions on air quality. Based on the GEE platform and satellite imagery, this study analyzed the changes in the concentrations of NO2, O3, CO, and SO2 in the same season (1 February–1 May) before and after the epidemic control (2019–2021) for 16 typical representative cities of China. The results showed that NO2 concentrations significantly decreased by around 20–24% for different types of metropolises, whereas O3 increased for most of the studied metropolises, including approximately 7% in megacities and other major cities. Additionally, the concentrations of CO and SO2 showed no statistically significant changes during the study intervals. The study also indicated strong variations in air pollutants among different geographic regions. In addition to the methods in this study, it is essential to include the differences in meteorological impact factors in the study to identify future references for air pollution reduction measures.

1. Introduction

The COVID-19 outbreak has been one of the most devastating crises throughout the world since World War II. Since the first cases of COVID-19 were reported in Wuhan, China in December 2019, the rapid spread of the virus dramatically challenged people’s lives and their way of living. To limit the virus spread, governments from several countries or regions were forced to take partial or complete lockdown measures, including suspending production and school classes, travel restrictions from the community level to the county level, etc. [1]. These emergency measures significantly reduced industrial and human activities and reduced the emission sources that cause air pollution. Air pollution can induce a variety of fatal diseases, causing great damage to the public’s physical and mental health. Exposure to the air with a high concentration of pollutants can increase the mortality of respiratory and cardiovascular diseases [2,3,4]. Apart from findings related to the COVID-19 lockdown, the role of other environmental governance policies in improving air quality has also been indicated by scholars [5]. For instance, during the 2008 Beijing Olympic Games, the concentration of PM2.5 and PM10 in Beijing was reduced by 60% [6], and the air quality in Beijing improved significantly during the APEC Summit in 2014 [7]. During the 2010 Shanghai World Expo, the concentration of NO2 in the central area of Shanghai, China decreased by 30% [8].
Nitrogen and sulfur dioxides (NO2 and SO2), carbon monoxide (CO), and ozone (O3) are noted as criteria pollutants owing to their adverse impacts on human health and the environment by the United States Environmental Protection Agency [9,10]. As important trace gases in the Earth’s atmosphere, NO2 and NO exist in both the troposphere and the stratosphere. NO2 and NO enter the Earth’s atmosphere through both natural (wildfires, lightning, and microbiological processes in soils) and anthropogenic processes (notably fossil fuel combustion and biomass burning) [11]. NO2 is a reliable indicator for measuring the concentration of nitrogen oxides, since the photochemical cycle between O3, NO, and the NO2 is in the daytime with a timescale of minutes. CO comes from the combustion of fossil fuels (especially in the northern mid-latitudes), biomass burning, and atmospheric oxidation of methane and other hydrocarbons (especially in the tropics). It can be a major atmospheric pollutant in certain urban areas. Both on-site [12] and the remote-sensing measurements [13,14] indicated the decline of NO2 and CO concentration during the lockdowns. Whereas the NO2, NO, and CO emissions are closely related to traffic emissions, the formulation mechanism of O3 is more complicated. O3 in the tropical troposphere reacts with virtually different trace gases, playing various important roles. It can be transported over great distances and affects areas far from the source. Sicard et al. indicated that concentration of O3 has increased in many cities around the globe [15]. For SO2,the major source is anthropogenic processes. Apart from the impact on the short-term pollution, the formation of sulphate aerosol owing to SO2 emission affects the climate through radiative forcing. Bekbulat et al. have indicated that SO2 emissions showed an inconsistent global pattern owing to the variations in power generation during the COVID-19 lockdown period [16].
Compared to traditional on-site measurement, satellite-based remote-sensing technology facilitates a deeper understanding of the long-term spatiotemporal patterns of the air quality on a different scale. The Google Earth Engine (GEE) platform has integrated different satellite imagery resources and geospatial datasets all over the world for 40 years and provides a platform with planetary-scale analysis capabilities. With adequate CPU processing power, the GEE makes it easier to analyze and visualize large volumes of data, including Landsat, Sentinel, and MODIS. Though the relationship between the air quality and the COVID-19 measurement has been widely studied based on remote-sensing techniques [12], a comparative and quantitative assessment of this outcome of stringent emission regulation is still needed. Most of the studies on assessing the role the lockdown measures have been carried out for one single city or place [17,18]. The intensity and extent of restrictions caused by COVID-19 vary in different periods. Furthermore, the fluctuations in emissions and meteorological conditions in different cities and places would affect the role of man-made regulations on air pollutant emission.
The main purpose of this study was to analyze the changes in NO2, O3, SO2, and CO concentrations in 16 metropolitan areas with different development routes in China. The different responses of air pollution concentrations to the lockdown in 16 metropolitan areas during three contemporaneous time periods before and after the epidemic lockdown (2019–2021) were analyzed and compared based on the GEE platform. The work contributes to understanding the limitations of man-made emission regulations and provides a guideline for further efficient air quality management and governance.

2. Materials and Methods
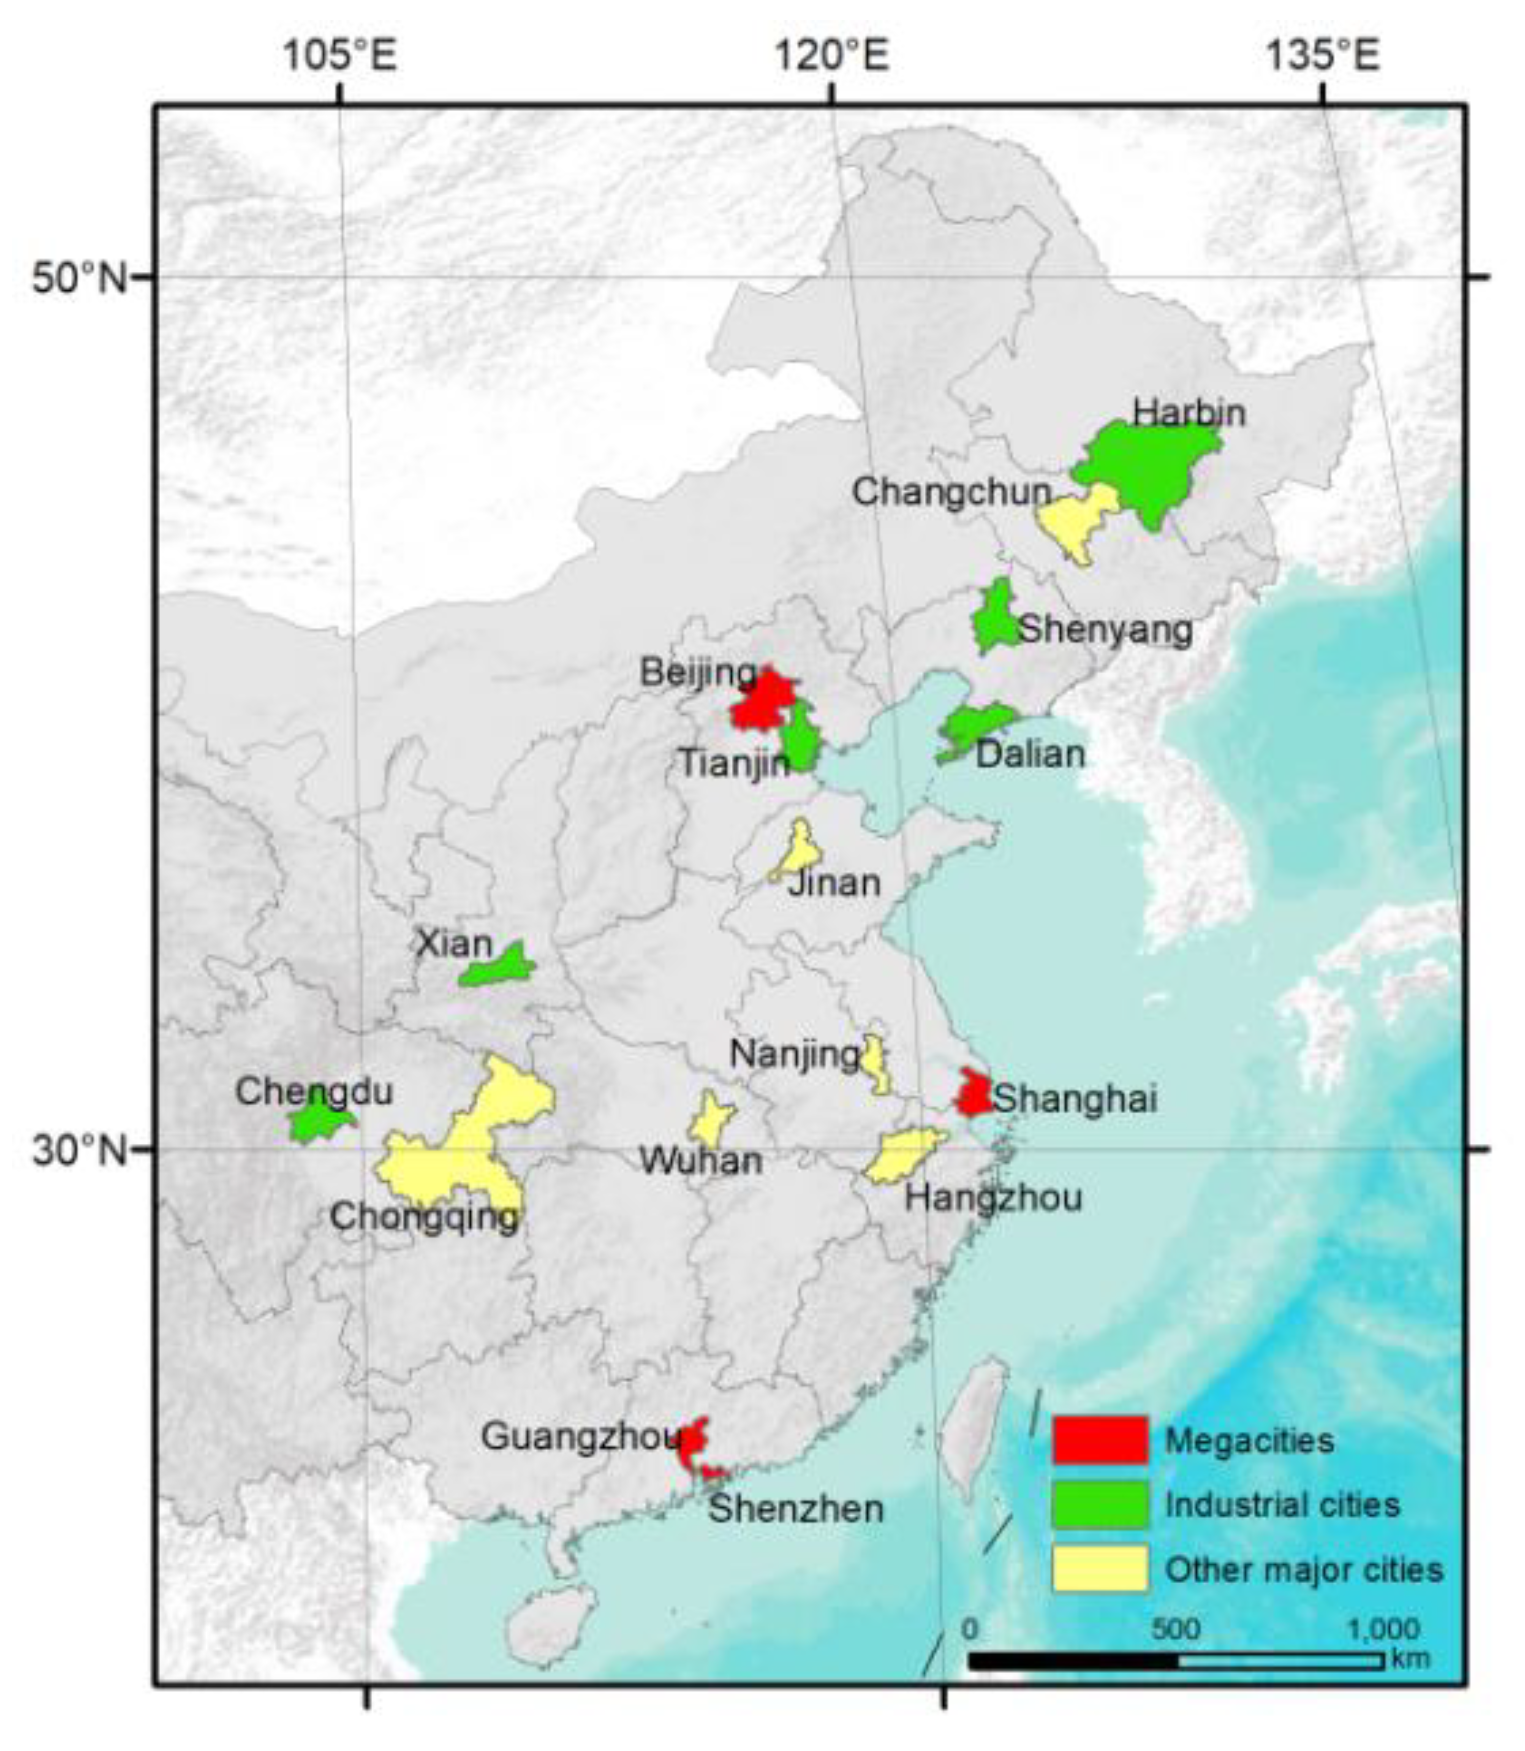
2.1. Study Area

We selected 16 metropolises across the mainland of China in this study for analysis (Figure 1). Among them, there are four municipalities directly led by the central government and 12 metropolises that are titled as “sub-province-level division” by the central government for development with priority. We further grouped the areas into three types: megacities (Beijing, Shanghai, Guangzhou, Shenzhen), industrial cities (Harbin, Changchun, Shenyang, Dalian, Tianjin, Xi’an), and major cities (Jinan, Hangzhou, Nanjing, Chengdu, Chongqing). “Megacities” are characterized by high urbanization intensity, with the highest population density and house price. “Industrial cities”, in which the heavy industry bases at the national level are located, have relatively high industrial pollutants emissions. “Major cities” have a relatively high population density and traffic volume. As Wuhan was characterized by the strictest measures and the longest lockdown time during the COVID-19 outbreak, it was analyzed separately in this study. The studied areas are in different latitudinal zones and different economic development zones of China, providing representative cases to study air quality responses to COVID-19 lockdown (Table 1).

2.2. Data Sources

The Copernicus Sentinel-5P mission, part of the Copernicus Space Component Program, was launched in 2017 to routinely monitor the atmosphere with a high spatiotemporal resolution. The Tropospheric Monitoring Instrument (TROPOMI) was carried by the Sentinel-5P satellite and is designed to monitor air quality through the measurement of the tropospheric concentration of molecules such as NO2, SO2, CO, O3, etc. With four spectrometers, each electronically split into two bands (2 in UV, 2 in VIS, 2 in NIR, 2 in SWIR), the TROPOMI also provides timely observations of greenhouse gases and other environmental themes including stratospheric ozone conditions and surface UV radiation. TROPOMI products are characterized by a width of swaths of 2600 km and a spatial resolution as high as 7 km × 3.5 km (further refined to 3.5 × 5.5 km2 after 6 August 2019). Hence, the products can cover most of the globe daily and have the potential to detect air pollution over individual cities for further comparative assessment among different cities worldwide.
To quantitatively evaluate the atmospheric conditions caused by the COVID-19 epidemic lockdown, the concentration variations of NO2, O3, SO2, and CO were selected as indicators. The TROPOMI NO2 processing system is adopted from the retrieval-assimilation-modelling system and established algorithm developments for the DOMINO-2 product and for the EU QA4ECV NO2 reprocessed dataset [19]. For the TROPOMI tropospheric O3 product, the algorithm was completed by the TROPOMI Level 2 total OZONE and CLOUD products. The algorithm for the TROPOMI SO2 product was developed by the Royal Belgian Institute for Space Aeronomy (BIRA-IASB) on the basis of the Differential Optical Absorption Spectroscopy (DOAS) technique [20]. For the TROPOMI CO data processing, the shortwave-infrared CO retrieval (SICOR) algorithm was applied to retrieve the vertical trace gas columns by considering the atmospheric light scattering by clouds. The algorithm also describes the cloud contamination of the measurements with effective parameters [21].

2.3. Data Processing

The so-called Level 3 Sentinel-5P data (in the latitude–longitude fixed grid) is provided on GEE. It is based on several product versions of the L2 TROPOMI data (Table 2) and is provided on the GEE. The TROPOMI data for NO2, O3, SO2, and CO were processed using the JavaScript editor within the GEE developer framework. The clouds, surface albedo, snow or ice coverage, signal saturation, and geometry of acquisition are the potential influencing factors for the data quality. Based on the Product User Manual sat the TROPOMI website [22], pixels with quality assurance flags below 75% were removed, and pixels with a “QA value” band less than 0.5 in other datasets (except O3 and SO2) were removed to ensure data quality. In addition, pixels with a cloud coverage fraction higher than 20% were also removed based on the “cloud fraction” layer of Level 3 Sentinel-5P data provided by the GEE platform. The original measurement unit of the tropospheric vertical column of atmospheric pollution gas is mol/m2, which was converted to mmol/m2 in this study.
The analysis periods in 2020 were divided into different stages to fully investigate the detailed effects of the lockdown with varying intensity on the atmospheric environment. On 12 January, the World Health Organization (WHO) officially named the novel coronavirus “2019-ncov”. On 30 January 2020, to respond to confirmed cases in each provincial-level administrative region across the country, the central government of China initiated a level I response [23]. On 20 February, although China was facing increasing pressure in COVID-19 prevention, the government still introduced several targeted and coordinated measures to ensure smooth work resumption, especially in sectors of daily necessities. On 17 March, the emergent medical support from various local authorities to Wuhan ended, and the epidemic was brought under control. Since April 28, China began to prevent and control the epidemic in an orderly manner. Therefore, we divided the epidemic lockdown in 2020 into three periods: P1, the early stage of lockdown (from 1 February to 20 February); P2, partial loosening (from 21 February to 17 March); P3, regular prevention and control (from 18 March to 1 May). The atmospheric conditions of the study area in this analytical timeframe in 2020 were compared with those time spans in the “normal” period of 2019 and 2021 (with worldwide regular epidemic prevention).
Non-parametric Wilcoxon tests were used to test whether there was a significant change between different periods. For temporal analysis and comparisons, each pollutant concentration in individual pixels was aggregated into the metropolitan level. The Local Polynomial Regression Fitting (loess) algorithm was applied to indicate the temporal variation in different atmospheric pollutants. All data were processed on GEE and analyzed in R.

3. Results

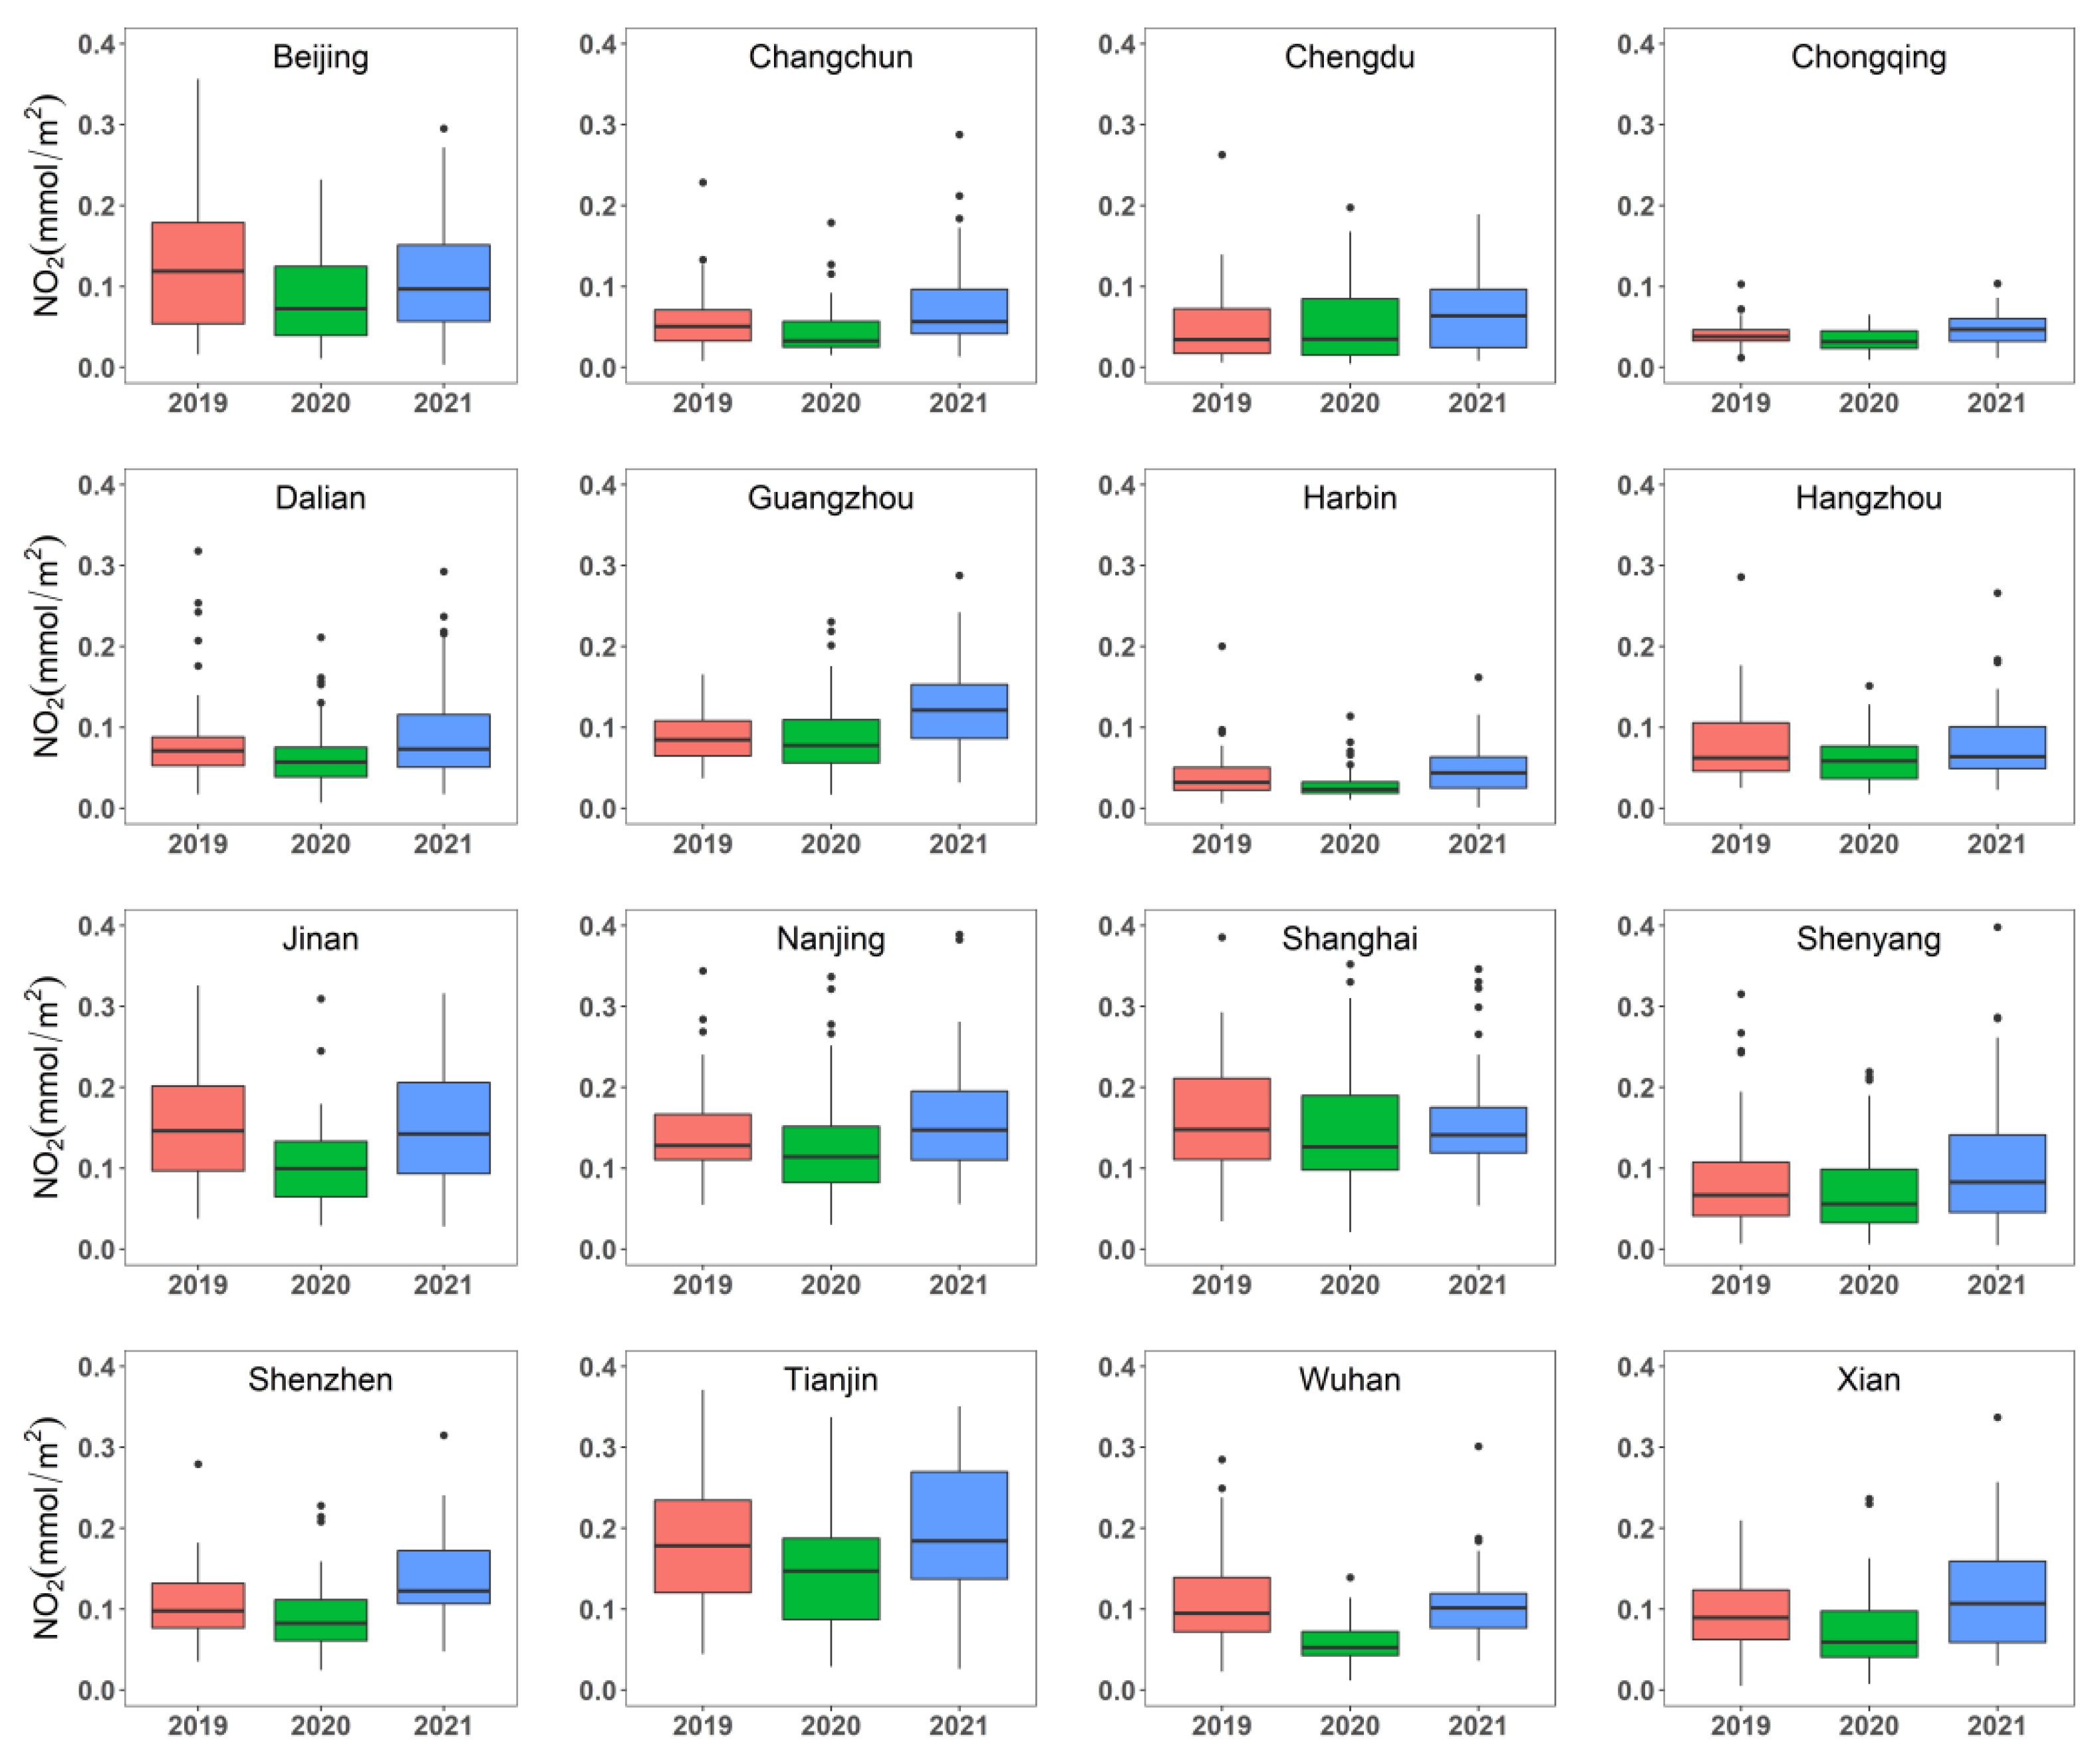
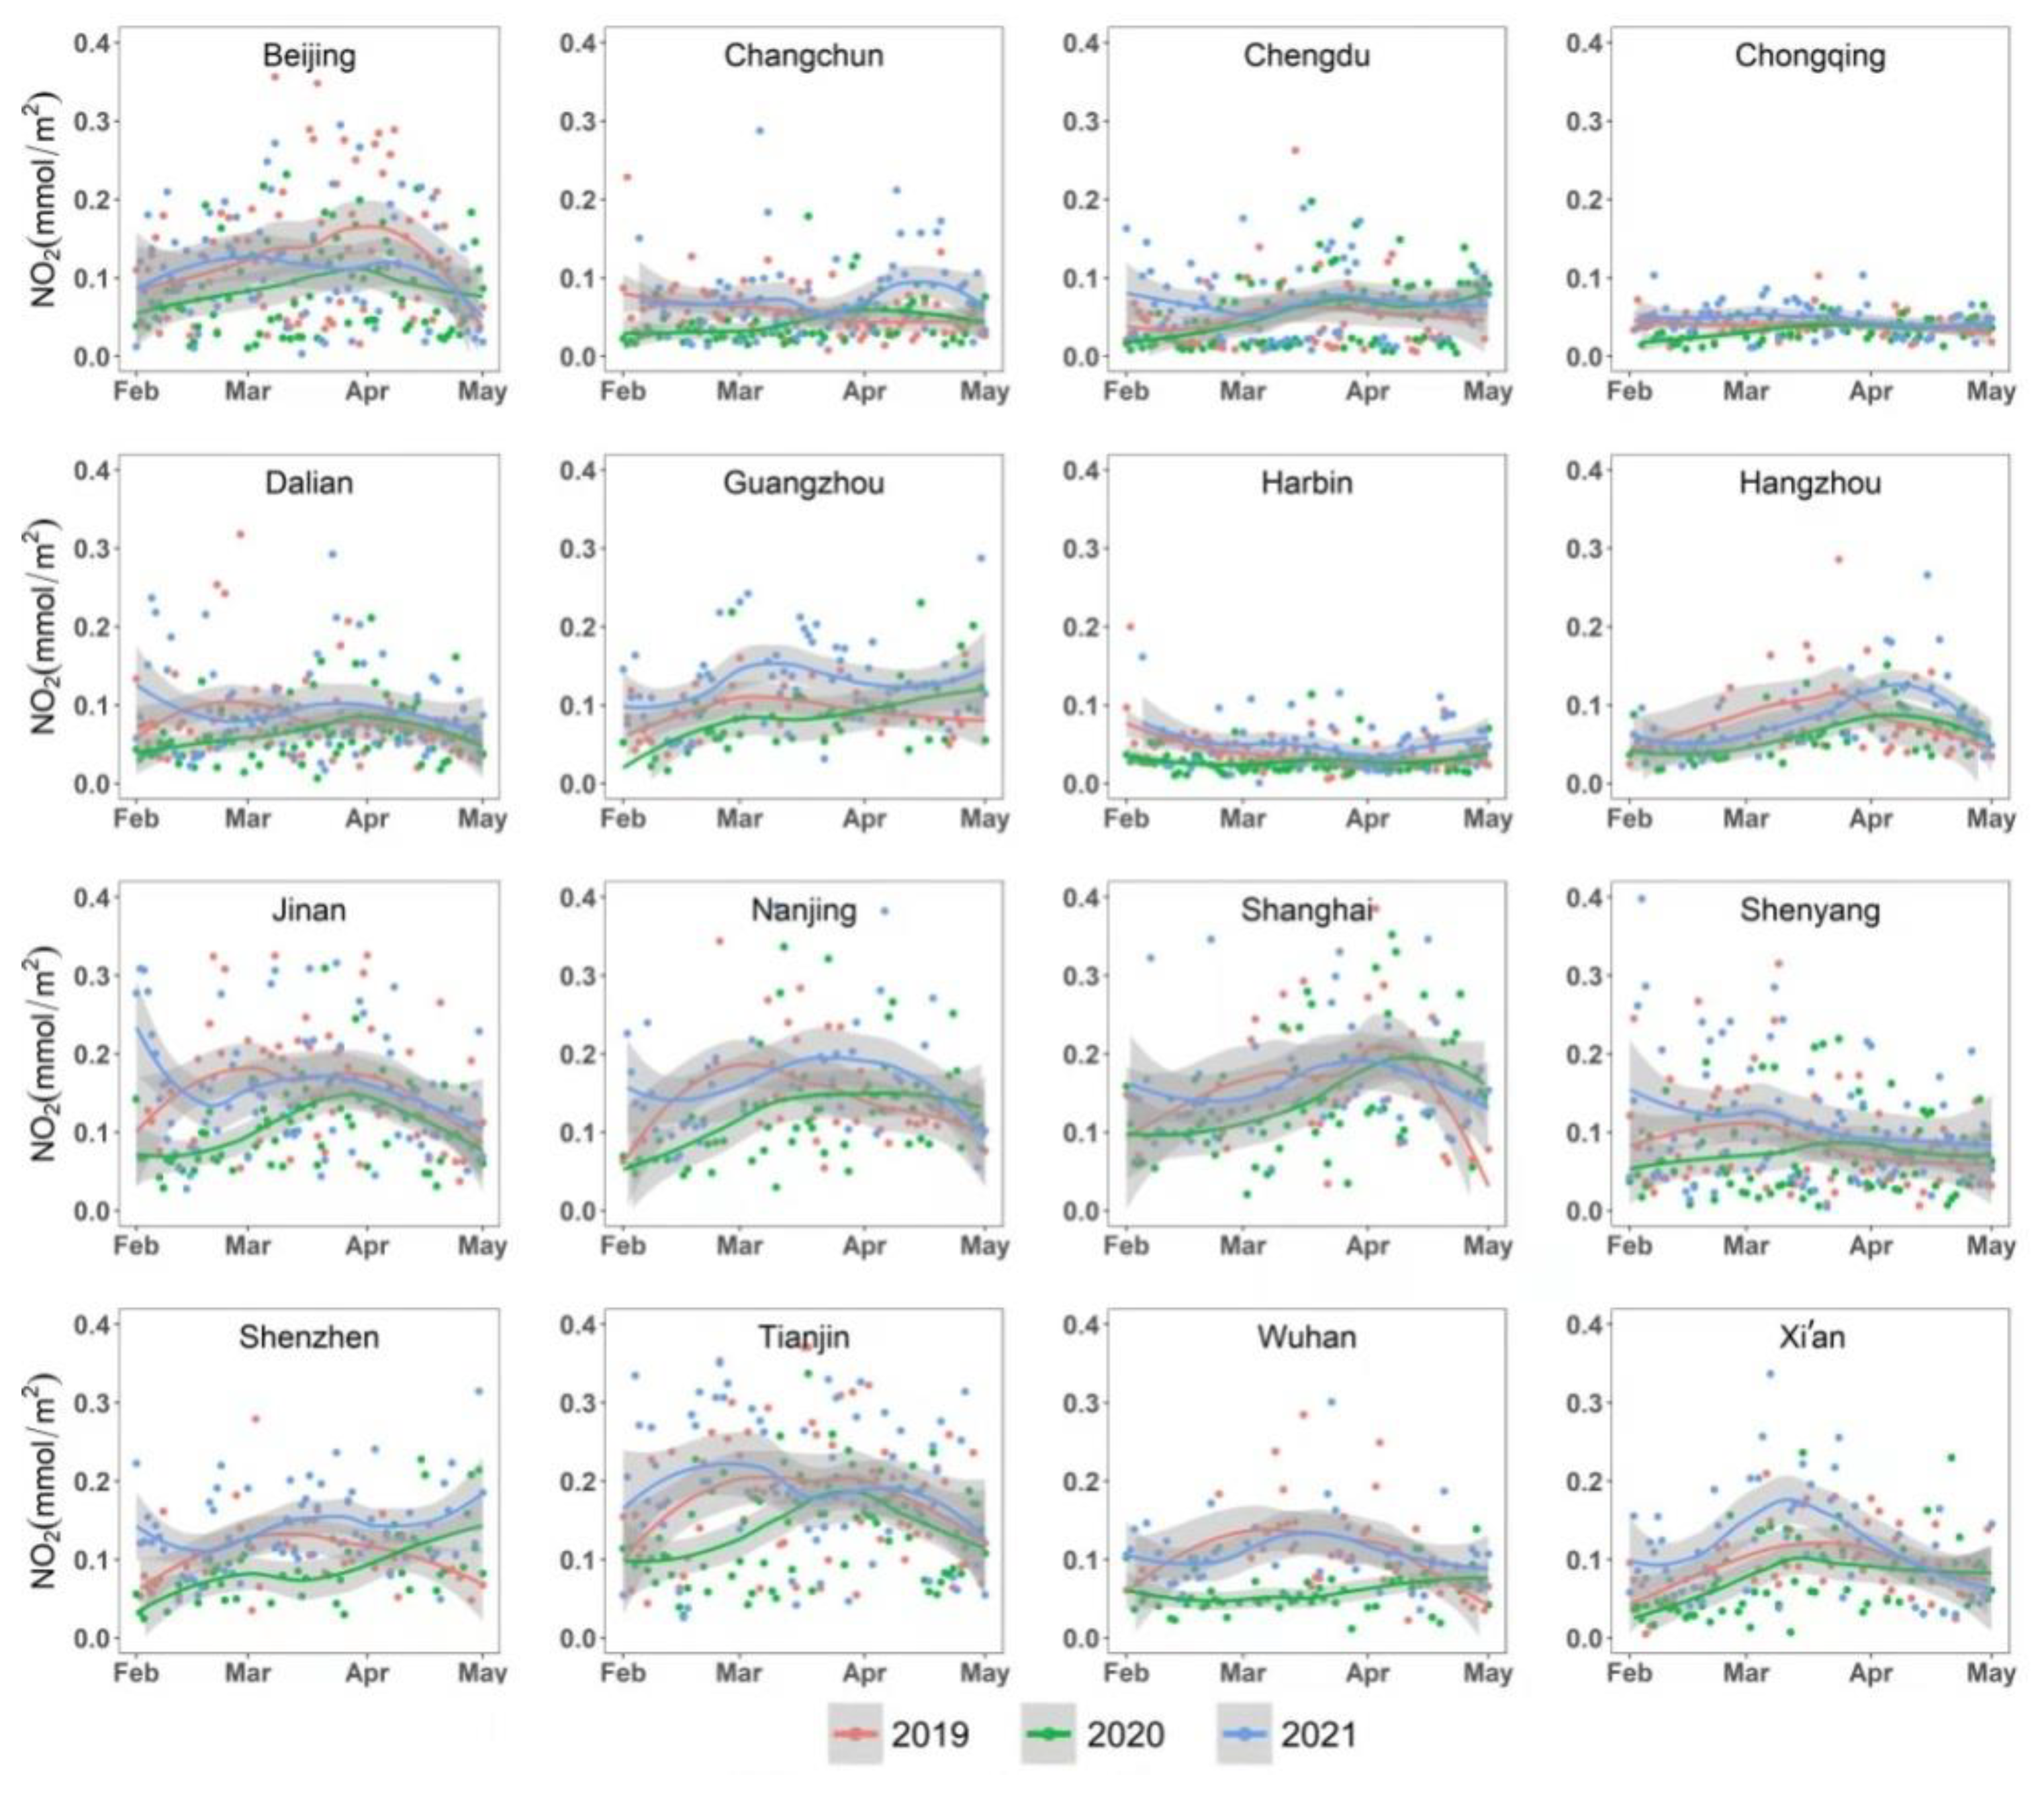
3.1. The Effect of COVID-19 Lockdown on NO2 Concentration

Figure 2 shows box plots of NO2 concentrations in the 16 selected metropolitan areas for the years 2019, 2020, and 2021 (from 1 February to 1 May). The NO2 concentration was highest in Shanghai and Tianjin during the study periods. The NO2 concentration in all metropolitan areas decreased dramatically during the lockdown in 2020 compared to the same period in 2019. However, there were apparent differences in NO2 concentrations among metropolises within the same city development types, whereas there were no pronounced differences among different groups of metropolises. The concentration of NO2 in the metropolitan areas was consistent with the economic conditions and exhibited geographical varying characteristics. The metropolitan areas in Northern China Plain, including Beijing, Tianjin, and Jinan had the highest concentrations of NO2 (approximately 0.142 mmol/m2 on average), followed by areas in the Yangtze River Delta (i.e., Nanjing, Shanghai, and Hangzhou, approximately 0.129 mmol/m2 on average) and the Pearl River Delta (i.e., Guangzhou and Shenzhen). In contrast, the tropospheric NO2 concentrations in Northeast China (i.e., Harbin, Changchun, Shenyang, and Dalian) and Western China (i.e., Xi’an, Chengdu, Chongqing, and Wuhan) were significantly lower.
Figure 3 shows the time series plots of the tropospheric NO2 concentrations in the respective metropolitan areas. Compared to those in 2019 and 2021, the NO2 concentrations in the year 2020 showed a relatively high temporal variation across the three stages from April to May. For most places, from the P1 period (i.e., the early stage of lockdown) to the P2 (i.e., the partial loosening period), the concentration sof NO2 gradually increased with the gradual relaxation of lockdown measures. The concentrations of NO2 in 15 metropolitan areas except Wuhan exhibited a slight upward trend. Though there was no apparent tendency in the NO2 concentration after the middle of April, the concentration of NO2 showed an upward trend from P1 and P2 to the early stages of P3. In some northern metropolitan areas, such as Beijing, Tianjin, Changchun, Dalian, and Jinan, the concentration of NO2 began to decrease from the end of March to the beginning of April. During P3, the concentration of NO2 in some areas even exceeded the concentration level in the same period in 2019 (Figure 3). The concentration of NO2 in Wuhan also exhibited an upward trend in late April 2019.
According to the results of the non-parametric Wilcoxon test, a significant reduction in NO2 concentrations was found over ten cities from 2019 to 2020 (i.e., p (2019 and 2020) < 0.05 in Table 3). The most pronounced decrease in NO2 was found in Wuhan (−45.1%), followed by those identified as the “major cities” group. Interestingly, the NO2 reduction in the industrial cities was comparable to that in the megacities. In 2021, due to the lifting of the lockdown and the nationwide comprehensive work resumption, the emissions of NO2 returned to the “base” level. There was no statistically significant change in NO2 concentrations between 2019 and 2021 (i.e., p (2019 and 2021) > 0.05 in Table 3). Among the 16 cities, the NO2 concentration decreased most significantly in Wuhan (45.1%), followed by Jinan (35.1%) and Beijing (34.3%). There was a similar declining tendency in the NO2 concentration among all types of metropolises, with an average reduction of 21.22% in megacities, 20.5% in representative cities of heavy industry, and 23.8% in other major cities. Overall, there was an obvious effect of the COVID-19 lockdown on the NO2 concentration for most of our study areas.

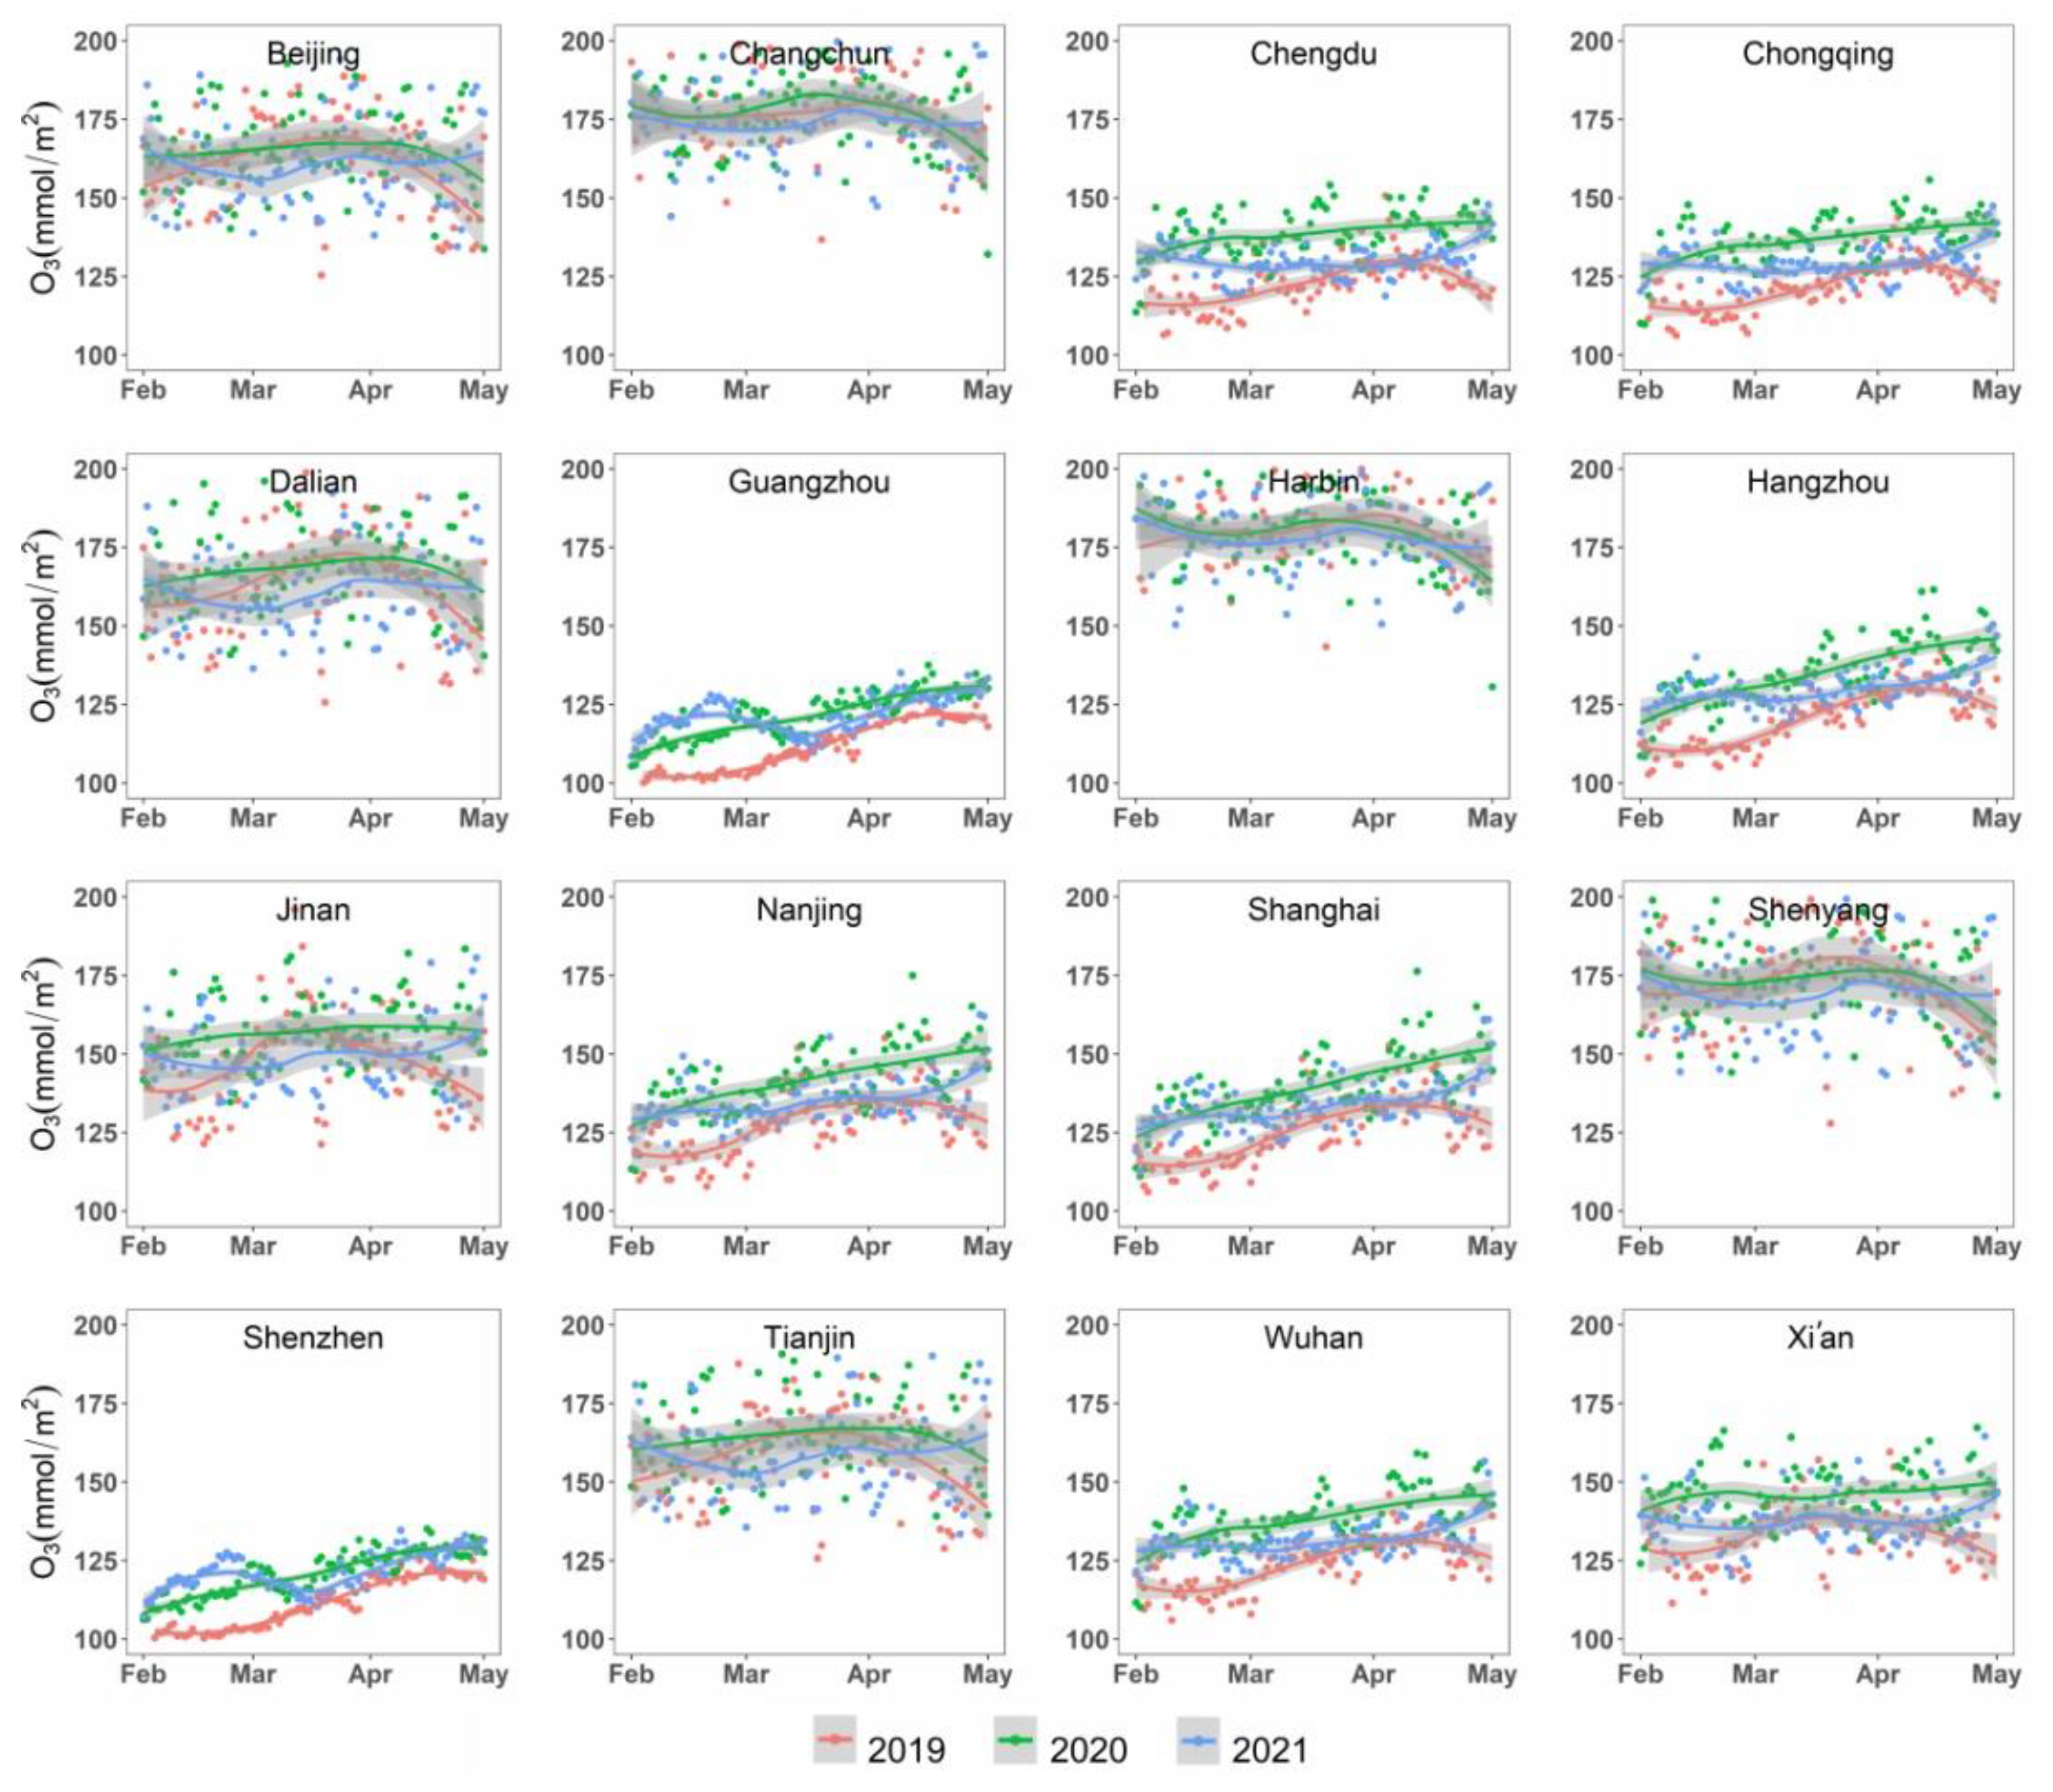
3.2. The Effect of COVID-19 Lockdown on O3 Concentration

There were notable variations in terms of the O3 concentrations among the 16 selected metropolises during the study periods (Figure 4). Harbin, Changchun, Shenyang, and Dalian had the highest O3 concentration during the study periods (higher than 165 mmol/m2 on average), followed by Beijing, Tianjin, and Jinan. For most of the metropolises, there was no considerable variation in O3 concentration among the three intervals. Combined with the location of the metropolises (Figure 1), it was indicated that the concentration of O3 was partially related with the latitude of the study sites. However, there were no apparent differences among different groups of metropolises. Like the NO2 concentration, there were no pronounced differences in O3 concentrations among different groups of metropolises.
During the intervals in 2019, there were apparent variations in O3 concentration, with an increasing and then a decreasing tendency for most of the metropolises. Most turning points occurred in early April, and at the end of March for some northern metropolises (Beijing, Tianjin, Dalian, Jinan, etc.). During the lockdown period in 2020, O3 concentrations in 16 metropolises showed a significant upward trend for a relatively long interval. During P3 (regular prevention and control period in 2020), the O3 concentrations in six metropolises (Beijing, Tianjin, Changchun, Shenyang, Dalian, and Harbin) showed a downward trend, which is different from the tendency of O3 concentrations in other metropolises. Compared to those in 2019 and 2021, the O3 concentration in 2020 exhibited a relatively high temporal variation across the three stages. Overall, the volume of O3 concentration started to return to the basic level during the study interval in 2021 (Figure 5).
The non-parametric Wilcoxon test further indicated statistically significant changes in the concentration of O3 for most of the study areas in 2020 compared to that in 2019. Table 4 indicated that among the 16 metropolises, 12 metropolises showed statistically significant changes (i.e., p 2019 and 2020 < 0.05). The O3 concentration in Chongqing increased the most (12.4%), followed by Hangzhou (12.0%), Wuhan (11.7%), and Shanghai (11.3%). For megacities and major cities, the O3 concentration increased by 7.4% and 7.0% on average, respectively, which was much stronger than that for the heavy industry cities (3.4%). In 2021, there was no statistically significant differences in the O3 concentration compared to 2019 (i.e., p 2019 and 2021 > 0.05 in Table 4) in Tianjin and Jinan, indicating that these two cities mostly recovered to the pre-epidemic levels of O3 concentration. In contrast, the O3 concentration in the remaining 10 metropolises decreased slightly in 2021 compared with that in 2020, but the concentration levels were still higher than those in the year 2019 (Table 4).

3.3. The Effect of COVID-19 Lockdown on CO and SO2 Concentration

Overall, the effect of the COVID-19 lockdown on CO and SO2 concentrations was not apparent in most of our study areas. CO and SO2 concentrations did not fluctuate significantly before or after COVID-19. According to the results of the non-parametric Wilcoxon test, there were no significant changes in CO concentrations over any type of city from 2019 to 2020 (i.e., p (2019 and 2020) > 0.05 in Table 5). The CO concentrations in the megacities (approximately 54.856 mmol/m2 on average) were considerably higher than those in the other two groups of cities. In addition, there were notable variations in terms of SO2 concentrations from 2019 to 2020 for most of the metropolises, except for Shenzhen and Chengdu. The average atmospheric SO2 concentrations in the areas in which heavy industry cities are located were significantly higher than those in the areas noted as “major cities” or “megacities”. A reduction in SO2 was also expected during COVID-19. However, unlike previous conclusions, the SO2 columns did not change obviously during the blockade period.

4. Discussion

4.1. Response of Different Air Pollutants to the COVID-19 Lockdown

This study generally indicated the effects of the COVID-19 lockdown on the criteria of air pollutants across China. First, during the lockdown in 2020, NO2 levels significantly decreased by 21.2% in megacities, 20.5% in representative metropolises of heavy industry, and 23.8% in other major cities. The decreases in NO2 concentrations were similar to the findings based in the continental United States [12] and close to several European cities [24]. The decline in the NO2 concentration was largely due to the reduction in traffic and industrial activities during the COVID-19 lockdown, which is the main combustion process of human activities related to NO2 emissions [11]. This study did find a considerable difference in the responses of NO2 emissions among different geographical regions. One possible reason is that the combustion of fossil fuel and road traffic are the largest contributors to NO2 emissions. The North Plain has been the most polluted area in China due to coal consumption for heating and power in the winter, in addition to highly developed industrial production activities. Beijing-Tianjin-Hebei is the region with the greatest traffic pressure in China, and the Yangtze and Pearl River Delta regions represent the highest levels of economic development in China. In addition, the main source of air pollution in the Chinese cities with rapid economic development has recently shifted from coal combustion to a mixture of coal combustion and road traffic with increasing vehicle numbers [25]. The declining tendency of NO2 emissions was associated with reduced industrial activities and reduced vehicular traffic from people working remotely and limited domestic travel. Meanwhile, the results showed that the NO2 decreased significantly for Wuhan (45.1%), which was much higher than other metropolises. A possible reason for this is that Wuhan had the strictest lockdown measurements due to the severity of the COVID-19 situation.
In contrast, COVID-19 lockdown measures led to an increase in O3 concentration in most of our study areas. Between 2019 and 2020, the results showed that the O3 increased for most of the studied metropolises, including approximately 7% in megacities and other major cities and 11.7% in Wuhan. The tendency of the O3 concentration is consistent with other findings e.g., [16,26]. Nevertheless, we also found differences in terms of the magnitude of changes in O3 levels for different types of metropolises. The formation of O3 is relatively complex and is affected by solar radiation and other atmospheric pollutants [26]. The study indicated that the variations in the O3 concentrations among different types of metropolises were not as strong as those among different geographic regions. Climatic and meteorological conditions also affect the atmospheric environment and contribute to the variability in O3 concentration [27]. Volatile organic pollutants (VOCs) and nitrogen oxides (NOx) emitted by automobile exhaust and industrial production combine with oxygen to generate O3 [15,28]. However, fine particulate matter (PM2.5) in the atmosphere will react with hydrogen peroxide (HO2) and NOx free radicals, thus reducing the concentration of the O3 precursor [29]. During the lockdown, when the emission of air pollutants decreased nationwide, and the concentration of fine particles decreased, the O3 generation reaction occurred at a relatively high frequency. Meanwhile, the O3 generation reaction is the most intense near the equator. Affected by the large-scale circulation of air in the stratosphere, O3 is transported to the middle and high latitudes to accumulate, and the pollution problem of O3 in middle and high latitudes will be more serious. In our study, we found that the O3 concentration was intense in regions with high latitudes. This may be because meteorological factors have a significant impact on the atmospheric environment, and there are various climatic zones in mainland China with a large north–south span. Furthermore, the concentration of O3 is also influenced by the elevation. In the areas with relatively high altitudes, O3 concentrations tended to be influenced by meteorological factors at a wider spatial scale and the related transport factors. Meanwhile, we investigated the O3 concentrations for the metropolitan areas, and the statistics were aggregated based on the individual metropolitan area instead of the urbanized region.
From the above analysis, we also found that effects of the COVID-19 lockdown on both CO and SO2 were not significantly revealed by our analysis. First, CO has a longer atmospheric lifetime than NO2, so the impact of emission changes would be less localized than that for NO2 [14]. For most of the metropolises, especially for the metropolises in Northern China, SO2 remained stable throughout the study stages. A similar finding was also mentioned in the study of Wang et al. [30]. They also pointed out some uncertainties related to the measurement of SO2 (i.e., GEE Sentinel-5P OFFL SO2 data), especially for highly polluted areas in which the actual pollution status tends to be stronger than that revealed by the investigations with satellite imagery [30]. In addition, industry and coal consumption in power plants are the main emission sources of CO and SO2 in China. Heavy industry and coal-fired plants still operated during the COVID-19 lockdown. Hence, CO and SO2 should be relatively stable. Additionally, compared to external forces (i.e., the COVID-19 lockdown), SO2 reductions are more related to natural or random variability. For instance, the lockdown due to the Asian-Pacific Economic Cooperation (APEC) in 2014 did not cause statistically significant SO2 concentration differences over the northern China region [31].

4.2. Limitations and Possible Improvements

In this study, we investigated the air quality for the metropolitan areas of China, and the statistics were aggregated based on the individual metropolitan area instead of the urbanized region. However, compared to the urbanized areas, the rural areas have more intensified green cover but less traffic flow and fewer economic activities. Differences in the impact of the lockdown with regard to air quality between urban and suburban areas were also proved by other studies i.e., [13]. The boundaries of the metropolitan areas in this study are based on their administrative divisions, and the percentage of the urbanized cover varies among different types of metropolises. The aggregation of the air pollutants’ emission values from the pixel level to the administrative level would lead to uncertainties in the results. Future studies are needed to illustrate the spatial variations within the administrative level and to check the ways in which the lockdown impacted the air quality in urban and rural communities.
Further, the same period in the year 2019 was used as a base time for comparison to check the effect of the COVID-19 lockdown. However, the condition of the pollutant emissions is also affected by meteorological conditions, and using 2019 as the base level could have lead to biased estimations. It should be noted that the four air pollutants used in this study cannot fully represent the air quality. Other studies have also indicated that the meteorological conditions controlled the spatiotemporal impacts’ variation in the pollutant concentration and the air quality i.e., [32]. To provide reasonable guidelines for alleviating pollutant emissions, the meteorological parameters should be taken into consideration, and a relatively long investigation period is warranted for further studies.
Regarding our methods and analysis, there are other studies that have also applied satellite observational data, especially those from TROPOMI, to measure the changes in air pollutant concentration, including NO2, SO2, aerosol optical depth (AOD), and CO. For instance, Ghasempour et al. (2021) investigated the spatiotemporal density of TROPOMI-based NO2, and SO2 products and MODIS-derived AOD from January 2019 to September 2020 (also covering the wave of COVID-19) over Turkey based on the GEE platform [33]. By investigating the major twenty locations of urban area clusters across Pakistan, Ali et al. (2021) observed a reduction in NO2 emissions by 40% from coal-based power plants, followed by 30% in major urban areas in 2020 compared to the same period in 2019. Nonetheless, a gradual increase has been observed since 16 April due to relaxations in lockdown implementations. In their study, the TROPOMI data was used to measure the changes in NO2, SO2, and CO [34]. With TROPOMI data, Miyazaki et al. (2020) estimated a reduction in Chinese NOx emissions reaching 36% during the COVID-19 [35]. Hence, the GEE and remote-sensing imagery are helpful for the spatiotemporal evaluation of air quality, especially before and after the COVID-19 lockdown.
In our study, the spatiotemporal variations in ozone O3, one of the secondary pollutants, were also included to study the effects of the COVID-19 lockdown on air pollutant concentrations across China. Different from the primary pollutants (NOx, volatile organic compounds, CO, SO2), ozone O3 is one of the secondary pollutants. The related increase in the concentration of O3 ozone depends on the relative amplitude in the change of volatile organic compounds and in NOx emissions. Apart from this, different components of the atmospheric system should be comprehensively investigated. Thus, the role of different processes and air pollutants affecting the level of pollutants during the COVID-19 pandemic period can be assessed.

5. Conclusions

In this study, four types of air pollutants’ (NO2, O3, SO2, and CO) concentrations were investigated and analyzed before, during, and after the COVID-19 outbreak in 16 metropolitan areas over China. The GEE platform was applied to acquire Sentinel-5P TROPOMI data and further used for data analysis. Results indicated that NO2 concentrations significantly decreased by 21.2% in megacities, by 20.5% in representative metropolises of heavy industry, and by 23.8% in other major cities. In contrast, the results showed that O3 has increased for most of the studied metropolises, including approximately 7% in megacities and other major cities. Unlike the tendency of NO2 and O3 concentrations, a significant change was not observed for CO and SO2 concentrations. After the lockdown, the concentrations have had a rebounding tendency to return to the concentration levels in 2019.
The study indicated that the decline in the NO2 concentration was largely due to the reduction in traffic and industrial activities during the COVID-19 lockdown. Moreover, the O3 concentrations have increased, especially in megacities with serious traffic problems and advanced industrial development. The study indicated the variations in air pollutants among different types of metropolises, whereas different regions also showed different trends in terms of air quality amelioration during the COVID-19 lockdown. The finding of this study could benefit future air quality management at the national level. Further work on formulating policies for coordinated emissions reduction should further consider the city types. Combining the GEE platform and remote-sensing imagery contributes to the identification of air pollution reduction potential. It is also important to investigate and examine the different components of the atmospheric system to identify the various pollutants’ concertation levels during the COVID-19 pandemic period. Further, the method in our study is helpful merely to identify the pollutants’ concentrations, instead of pollutants emissions. Thus, the variations in meteorological impact factors, such as temperature, precipitation, boundary layer physics, cloudiness, as well as the respective multiscale transport processes, should be addressed in order to identify the air pollution reduction potential and provide references for air pollution reduction measures in the future.

Author Contributions

Conceptualization, S.W. and C.Z.; methodology, S.W.; software, S.W.; validation, S.W., H.C. and C.G.; formal analysis, S.W. and H.C.; investigation, S.W.; resources, F.W.; data curation, S.W.; writing—original draft preparation, S.W.; writing—review and editing, S.W. and C.Z.; writing—revised version review and editing, P.W. and C.Z.; visualization, S.W. and C.G.; supervision, C.Z.; project administration, F.W. and C.Z.; funding acquisition, P.W. and C.Z. All authors have read and agreed to the published version of the manuscript.

Funding

This research was supported by a grant from the State Key Laboratory of Resources and Environmental Information Systems, China; the National Natural Science Foundation of China, grant number 4210010491; the Education Department of Jilin Province, China, grant number JJKH20211289KJ; and the Natural Science Foundation of Jilin Scientific Institute, grant number YDZJ202101ZYTS104.

Institutional Review Board Statement

Not applicable.

Informed Consent Statement

Not applicable.

Data Availability Statement

Not applicable.

Conflicts of Interest

The authors declare no conflict of interest. The funders and CenNavi Technologies Co. had no role in the design of the study; in the collection, analyses, or interpretation of data; in the writing of the manuscript; or in the decision to publish the results.

References

  1. Home-Johns Hopkins Coronavirus Resource Center. Available online: https://coronavirus.jhu.edu/ (accessed on 13 September 2022).
  2. Dominici, F.; McDermott, A.; Daniels, M.; Zeger, S.L.; Samet, J.M. Revised Analyses of the National Morbidity, Mortality, and Air Pollution Study: Mortality among Residents of 90 Cities. J. Toxicol. Environ. Health-Part A 2005, 68, 1071–1092. [Google Scholar] [CrossRef] [PubMed]
  3. Cao, J.; Yang, C.; Li, J.; Chen, R.; Chen, B.; Gu, D.; Kan, H. Association between Long-Term Exposure to Outdoor Air Pollution and Mortality in China: A Cohort Study. J. Hazard. Mater. 2011, 186, 1594–1600. [Google Scholar] [CrossRef] [PubMed]
  4. Guan, W.-J.; Zheng, X.-Y.; Chung, K.F.; Zhong, N.-S. Impact of Air Pollution on the Burden of Chronic Respiratory Diseases in China: Time for Urgent Action. Lancet 2016, 388, 1939–1951. [Google Scholar] [CrossRef] [PubMed]
  5. Jin, Y.; Andersson, H.; Zhang, S. Air Pollution Control Policies in China: A Retrospective and Prospects. Int. J. Environ. Res. Public Health 2016, 13, 1219. [Google Scholar] [CrossRef] [PubMed] [Green Version]
  6. Wang, S.; Zhao, M.; Xing, J.; Wu, Y.; Zhou, Y.; Lei, Y.; He, K.; Fu, L.; Hao, J. Quantifying the Air Pollutants Emission Reduction during the 2008 Olympic Games in Beijing. Environ. Sci. Technol. 2010, 44, 2490–2496. [Google Scholar] [CrossRef]
  7. Huang, K.; Zhang, X.; Lin, Y. The “APEC Blue” Phenomenon: Regional Emission Control Effects Observed from Space. Atmos. Res. 2015, 164–165, 65–75. [Google Scholar] [CrossRef]
  8. Chan, K.L.; Hartl, A.; Lam, Y.F.; Xie, P.H.; Liu, W.Q.; Cheung, H.M.; Lampel, J.; Pöhler, D.; Li, A.; Xu, J.; et al. Observations of Tropospheric NO2 Using Ground Based MAX-DOAS and OMI Measurements during the Shanghai World Expo 2010. Atmos. Environ. 2015, 119, 45–58. [Google Scholar] [CrossRef]
  9. Esworthy, R. The National Ambient Air Quality Standards (NAAQS) for Particulate Matter (PM): EPA’s 2006 Revisions and Associated Issues; EPA: Washington, DC, USA, 2006; p. 31.
  10. El-Sayed, M.M.H.; Elshorbany, Y.F.; Koehler, K. On the Impact of the COVID-19 Pandemic on Air Quality in Florida. Environ. Pollut. 2021, 285, 117451. [Google Scholar] [CrossRef]
  11. Zhang, R.; Wang, Y.; Smeltzer, C.; Qu, H.; Koshak, W.; Boersma, K.F. Comparing OMI-Based and EPA AQS in Situ NO2 Trends: Towards Understanding Surface NOx Emission Changes. Atmos. Meas. Tech. 2018, 11, 3955–3967. [Google Scholar] [CrossRef] [Green Version]
  12. Berman, J.D.; Ebisu, K. Changes in U.S. Air Pollution during the COVID-19 Pandemic. Sci. Total Environ. 2020, 739, 139864. [Google Scholar] [CrossRef]
  13. Fan, C.; Li, Y.; Guang, J.; Li, Z.; Elnashar, A.; Allam, M.; de Leeuw, G. The Impact of the Control Measures during the COVID-19 Outbreak on Air Pollution in China. Remote Sens. 2020, 12, 1613. [Google Scholar] [CrossRef]
  14. Elshorbany, Y.F.; Kapper, H.C.; Ziemke, J.R.; Parr, S.A. The Status of Air Quality in the United States During the COVID-19 Pandemic: A Remote Sensing Perspective. Remote Sens. 2021, 13, 369. [Google Scholar] [CrossRef]
  15. Sicard, P.; De Marco, A.; Agathokleous, E.; Feng, Z.; Xu, X.; Paoletti, E.; Rodriguez, J.J.D.; Calatayud, V. Amplified Ozone Pollution in Cities during the COVID-19 Lockdown. Sci. Total Environ. 2020, 735, 139542. [Google Scholar] [CrossRef] [PubMed]
  16. Bekbulat, B.; Apte, J.S.; Millet, D.B.; Robinson, A.; Wells, K.C.; Marshall, J.D. PM2.5 and Ozone Air Pollution Levels Have Not Dropped Consistently Across the US Following Societal Covid Response. ISEE Conf. Abstr. 2020, 2020. [Google Scholar] [CrossRef]
  17. Chen, L.-W.A.; Chien, L.-C.; Li, Y.; Lin, G. Nonuniform Impacts of COVID-19 Lockdown on Air Quality over the United States. Sci. Total Environ. 2020, 745, 141105. [Google Scholar] [CrossRef] [PubMed]
  18. Kerimray, A.; Baimatova, N.; Ibragimova, O.P.; Bukenov, B.; Kenessov, B.; Plotitsyn, P.; Karaca, F. Assessing Air Quality Changes in Large Cities during COVID-19 Lockdowns: The Impacts of Traffic-Free Urban Conditions in Almaty, Kazakhstan. Sci. Total Environ. 2020, 730, 139179. [Google Scholar] [CrossRef]
  19. European Space Agency. TROPOMI Level 2 Nitrogen Dioxide 2021; European Space Agency: Paris, France, 2021. [Google Scholar]
  20. Sulphur Dioxide. Available online: http://www.tropomi.eu/data-products/sulphur-dioxide (accessed on 14 September 2022).
  21. Borsdorff, T.; aan de Brugh, J.; Schneider, A.; Lorente, A.; Birk, M.; Wagner, G.; Kivi, R.; Hase, F.; Feist, D.G.; Sussmann, R.; et al. Improving the TROPOMI CO Data Product: Update of the Spectroscopic Database and Destriping of Single Orbits. Atmos. Meas. Tech. 2019, 12, 5443–5455. [Google Scholar] [CrossRef] [Green Version]
  22. Level 2 Products. Available online: http://www.tropomi.eu/data-products/level-2-products (accessed on 13 September 2022).
  23. National Health Commission of the People’s Republic of China. Available online: https://www.who.int/westernpacific/about/partnerships/partners/national-health-commission-of-the-people-s-republic-of-china (accessed on 13 September 2022).
  24. Air Pollution Goes down as Europe Takes Hard Measures to Combat Coronavirus—European Environment Agency. Available online: https://www.eea.europa.eu/highlights/air-pollution-goes-down-as (accessed on 13 September 2022).
  25. Wang, S.; Yu, S.; Yan, R.; Zhang, Q.; Li, P.; Wang, L.; Liu, W.; Zheng, X. Characteristics and Origins of Air Pollutants in Wuhan, China, Based on Observations and Hybrid Receptor Models. J. Air Waste Manag. Assoc. 2017, 67, 739–753. [Google Scholar] [CrossRef] [Green Version]
  26. Wang, T.; Xue, L.; Brimblecombe, P.; Lam, Y.F.; Li, L.; Zhang, L. Ozone Pollution in China: A Review of Concentrations, Meteorological Influences, Chemical Precursors, and Effects. Sci. Total Environ. 2017, 575, 1582–1596. [Google Scholar] [CrossRef]
  27. Araúz, G.S.; Marcos, J.R.; Sanz, S.B. Snow Avalanches in Spain: The Role of Spanish State Meteorological Agency. Advers. Weather Spain 2013, 235. [Google Scholar]
  28. Pusede, S.E.; Cohen, R.C. On the Observed Response of Ozone to NOx and VOC Reactivity Reductions in San Joaquin Valley California 1995–Present. Atmos. Chem. Phys. 2012, 12, 8323–8339. [Google Scholar] [CrossRef]
  29. Li, K.; Jacob, D.J.; Liao, H.; Zhu, J.; Shah, V.; Shen, L.; Bates, K.H.; Zhang, Q.; Zhai, S. A Two-Pollutant Strategy for Improving Ozone and Particulate Air Quality in China. Nat. Geosci. 2019, 12, 906–910. [Google Scholar] [CrossRef]
  30. Wang, C.; Wang, T.; Wang, P.; Wang, W. Assessment of the Performance of TROPOMI NO2 and SO2 Data Products in the North China Plain: Comparison, Correction and Application. Remote Sens. 2022, 14, 214. [Google Scholar] [CrossRef]
  31. Wang, T.; Wang, P.; Hendrick, F.; Van Roozendael, M. Re-Examine the APEC Blue in Beijing 2014. J. Atmos. Chem. 2018, 75, 235–246. [Google Scholar] [CrossRef]
  32. Athanassiadou, M.; Baker, J.; Carruthers, D.; Collins, W.; Girnary, S.; Hassell, D.; Hort, M.; Johnson, C.; Johnson, K.; Jones, R.; et al. An Assessment of the Impact of Climate Change on Air Quality at Two UK Sites. Atmos. Environ. 2010, 44, 1877–1886. [Google Scholar] [CrossRef]
  33. Ali, G.; Abbas, S.; Qamer, F.M.; Wong, M.S.; Rasul, G.; Irteza, S.M.; Shahzad, N. Environmental impacts of shifts in energy, emissions, and urban heat island during the COVID-19 lockdown across Pakistan. J. Clean. Prod. 2021, 291, 125806. [Google Scholar] [CrossRef]
  34. Ghasempour, F.; Sekertekin, A.; Kutoglu, S.H. Google Earth Engine based spatio-temporal analysis of air pollutants before and during the first wave COVID-19 outbreak over Turkey via remote sensing. J. Clean. Prod. 2021, 319, 128599. [Google Scholar] [CrossRef] [PubMed]
  35. Miyazaki, K.; Bowman, K.W.; Sekiya, T.; Jiang, Z.; Chen, X.; Eskes, H.; Ru, M.; Zhang, Y.; Shindell, D.T. Air Quality Response in China Linked to the 2019 Novel Coronavirus (COVID-19) Mitigation; Earth and Space Science Open Archive ESSOAr: Washington, DC, USA, 2020. [Google Scholar]
Figure 1. Locations of the 16 selected cities.
Ijerph 19 17056 g001
Figure 2. Box plot of NO2 concentrations in the study periods for the years 2019, 2020, and 2021.The box represents the inter-quartile range (IQR) and the average value (i.e., the line inside). The two whiskers show (Q3 + 1.5 × IQR) or the maximum value and (Q1 − 1.5 × IQR) or the minimum value, respectively.
Ijerph 19 17056 g002
Figure 3. Temporal variation of NO2 concentrations in 16 metropolitan areas from 1 February to 1 May in 2019, 2020, and 2021 across the selected lockdown stages. The dots in red, green, and blue colors indicate the values of NO2 concentrations in 2019, 2020, and 2021, respectively. The lines and the shaded grey areas refer to the fitted curves modeled by the loess model, with its 95% confidence interval.
Ijerph 19 17056 g003
Figure 4. Box plot of the atmospheric O3 concentration in the study periods for the years 2019, 2020, and 2021. The box represents the inter-quartile range (IQR) and the average value (i.e., the line inside). The two whiskers show (Q3 + 1.5× IQR) or the maximum value and (Q1 − 1.5 × IQR) or the minimum value, respectively.
Ijerph 19 17056 g004
Figure 5. Temporal variation in O3 concentrations in 16 metropolitan areas from 1 February to 1 May in 2019, 2020, and 2021 across the selected lockdown stages. The dots in red, green, and blue colors indicate the values of O3 concentration in 2019, 2020, and 2021 respectively. The lines and the shaded grey areas refer to the fitted curves modeled by loess, with its 95% confidence interval.
Ijerph 19 17056 g005
Table 1. Population and car ownership of the 16 selected cities.
Population of Permanent Residents (Million)Possession of Private Vehicles (Million)
Wuhan12.453.67
Megacities
Beijing21.895.08
Shanghai24.873.66
Guangzhou18.742.34
Shenzhen17.632.80
Industrial cities
Harbin10.011.94
Xi’an12.953.61
Tianjin13.872.79
Dalian7.451.57
Shenyang9.072.33
Chengdu20.934.56
Major cities
Jinan11.942.51
Hangzhou9.072.28
Changchun32.051.88
Chongqing9.326.97
Nanjing12.452.16
Table 2. TROPOMI sensor Level 3 products from Google Earth Engine (GEE) Cloud Data Archive used in processing the Level 3 GEE products.
ResolutionProductBand Name (Units)
0.01 arc degreesGEE Sentinel-5P OFFL NO2tropospheric_NO2_column_number_density (mol/m2)
0.01 arc degreesGEE Sentinel-5P OFFL O3O3_column_number_density (mol/m2)
0.01 arc degreesGEE Sentinel-5P OFFL SO2SO2_column_number_density (mol/m2)
0.01 arc degreesGEE Sentinel-5P OFFL COCO_column_number_density (mol/m2)
Table 3. Summary of NO2 concentration amount (mmol/m2), temporal changes, and non-parametric Wilcoxon test results among different periods.
201920202021Change from 2019 to 2020 (%)p (2019 and 2020)p (2019 and 2021)
Wuhan0.1080.0590.105−45.1%00.781
Megacities
Beijing0.1310.0860.11−34.3%0.0010.267
Shanghai0.1950.1440.17−26.2%0.0230.335
Guangzhou0.0990.0880.125−11.2%0.2740.001
Shenzhen0.1070.1010.137−5.5%0.0820.001
mean0.1330.1050.136−21.2%
Industrial cities
Harbin0.0390.0280.048−27.3%00.055
Xi’an0.1030.0750.116−27.0%0.0030.306
Tianjin0.1890.1410.198−25.5%0.0010.465
Dalian0.080.0640.09−20.5%0.0110.429
Shenyang0.0850.0730.113−13.6%0.1470.059
Chengdu0.0490.0520.0686.0%0.9050.004
mean0.0910.0720.105−20.5%
Major cities
Jinan0.1640.1060.154−35.1%00.522
Hangzhou0.0820.0620.082−23.7%0.0880.796
Changchun0.0560.0430.073−23.3%0.0010.051
Chongqing0.040.0340.046−15.0%0.0290.04
Nanjing0.1450.1250.16−13.7%0.040.261
mean0.0970.0740.103−23.8%
Notes: p (2019 and 2020) indicates the p-value of the results of the non-parametric Wilcoxon test to evaluate the significance of the NO2 concentration differences between the same periods in 2019 and 2020, and p (2019 and 2021) indicates the p-value of the non-parametric Wilcoxon test of the NO2 concentration differences between the same periods in 2019 and 2021.
Table 4. Summary of O3 concentration amount (mmol/m2), temporal changes, and non-parametric Wilcoxon test results among different periods.
201920202021Change from 2019 to 2020 (%)p (2019 and 2020)p (2019 and 2021)
Wuhan123.801 138.316 131.620 11.7%2.56 × 10−191.17 × 10−09
Megacities
Beijing161.902 165.026 161.655 1.9%0.185 0.682
Shanghai125.348 139.559 133.376 11.3%2.98 × 10−146.68 × 10−08
Guangzhou111.315 121.632 121.801 9.3%8.20 × 10−131.15 × 10⁻¹²
Shenzhen111.000 120.832 121.443 8.9%2.01 × 10−124.72 × 10⁻¹³
Mean127.391 136.762 134.569 7.4%
Industrial cities
Harbin189.252 182.344 182.487 −3.7%0.0230.023
Xi’an133.127 146.500 137.691 10.1%6.34 × 10−150.003
Tianjin158.855 164.369 159.345 3.5%0.0200.868
Dalian164.119 168.556 163.035 2.7%0.0770.477
Shenyang174.443 173.878 172.544 −0.3%0.8070.309
Chengdu122.671 138.664 130.165 13.0%1.24 × 10−227.26 × 10⁻¹²
Mean157.078 162.385 157.545 3.4%
Major cities
Jinan146.714 156.866 149.061 6.9%8.60 × 10−70.257
Hangzhou120.615 135.060 129.740 12.0%2.08 × 10−168.73 × 10⁻¹¹
Changchun183.640 179.405 178.212 −2.3%0.2140.057
Chongqing121.532 136.601 129.294 12.4%5.22 × 10−223.51 × 10⁻¹²
Nanjing127.820 141.681 134.945 10.8%3.33 × 10−148.42 × 10⁻⁷
Mean140.064 149.923 144.251 7.0%
Notes: p (2019 and 2020) indicates the p-value of the results of the non-parametric Wilcoxon test to evaluate the significance of the O3 concentration differences between the same periods in 2019 and 2020, and p (2019 and 2021) indicates the p-value of the non-parametric Wilcoxon test of the O3 concentration differences between the same periods in 2019 and 2021.
Table 5. Summary of CO and SO2 concentration amounts (mmol/m2), temporal changes, and non-parametric Wilcoxon Test results among different periods.
COSO2
201920202021p (2019 and 2020)201920202021p (2019 and 2020)
Wuhan57.74558.04560.1340.7760.1960.1750.1580.983
Megacities
Beijing50.11048.58248.7880.5460.3630.4110.4950.422
Shanghai55.40555.65754.1690.9040.2140.2050.1950.741
Guangzhou55.87158.86156.9530.1050.0550.0070.0020.535
Shenzhen53.42956.32354.6550.1640.0610.0580.0500.002
Mean53.70454.85653.641 0.1430.1710.185
Industrial cities
Harbin43.41845.14044.1410.4130.5420.4020.3830.277
Xian44.40242.51043.9810.2290.2170.3150.2680.050
Tianjin56.87955.11955.1620.5460.3790.3460.4360.611
Dalian53.09050.70753.4860.8600.3780.3900.4570.874
Shenyang49.28349.47351.9940.2280.4880.4570.5860.771
Chengdu39.18741.07142.8080.2540.0360.1040.0240.039
Mean47.71047.33748.595 0.3400.3360.359
Other major cities
Jinan56.95854.50054.7310.1130.3210.3220.3310.389
Hangzhou53.38556.01156.6590.2150.1400.1500.1420.423
Changchun45.25447.44146.7260.5290.5780.4450.5850.328
Chongqing47.70749.50950.7680.1510.1020.1090.1010.343
Nanjing55.34658.74159.6060.0410.2110.2840.2020.537
Mean51.73053.24053.698 0.2700.2620.272
Notes: p (2019 and 2020) indicates the p-value of the results of the non-parametric Wilcoxon test to evaluate the significance of the CO and SO2 concentration differences between the same periods in 2019 and 2020.
Publisher’s Note: MDPI stays neutral with regard to jurisdictional claims in published maps and institutional affiliations.

