
Morphological Pattern of Building Clusters in Cold Regions: Evidence from Harbin

Abstract
:1. Introduction
1.1. Background
1.1.1. Analysis of Cold-Region Building Clusters
1.1.2. Pattern
1.2. Significance
- (1)
- Expanding the design theory and research methods of cold-region building clusters. An analysis of urban morphology enables us to understand the patterns and the development of cold-region building clusters. In the past, the design of architectural clusters was a black-box process that only considered the macro perspective. This design approach reveals a lack of objectivity and rationality. This study combines data collection and analysis and uses a bottom-up approach to break through the limitations of designers’ perceptions to understand the reasons for cold-region building clusters. The results provide theoretical and technical support for the design of cold-region building clusters and expand the design theory and research methods of cold-region architecture.
- (2)
- Provide a reference for the architectural design of cold-region building clusters. We quantify the correlation between cluster types, summarize the distribution of different forms of architectural clusters in urban areas, explore the correlation between the morphological patterns of architectural clusters, and analyze the urban architectural design strategies in cold regions. The results provide new insights for morphological research and the creative practical applications of cold-region architectural clusters.
1.3. Literature Review
2. Materials and Methods
2.1. Main Methods and Tools
2.2. Workflow
2.2.1. Summary of Existing Cluster Patterns
- (1)
- Point cluster pattern to protect against the cold using a dense distribution. A point is the smallest unit of spatial elements, a basic element of recording spatial information in the human cognition of nature, and a basic morpheme in the language of cold-region building cluster patterns. A point cluster is a non-contiguous set of points in space, with a distance between the points. A point cluster is an abstracted unit in the cold-region building cluster. It can be decomposed into a single point, an aggregated point pattern, a random point pattern, and an evenly distributed point pattern (Figure 1).
- (2)
- Linear pattern for cold protection according to the terrain. A line segment is another type of building cluster pattern. A river is a typical linear element in nature. Ancient settlements were built along rivers, forming a linear settlement pattern. The linear pattern has better environmental adaptability than the point cluster pattern. A linear pattern requires less land for settlement and avoids the negative space of the gable wall of the cold-region building. Linear buildings are conducive to forming spatial clusters and have high spatial levels. In terms of architectural form, a linear pattern is similar to the mountain and water elements in the environment, forming a unified picture (Figure 2).
- (3)
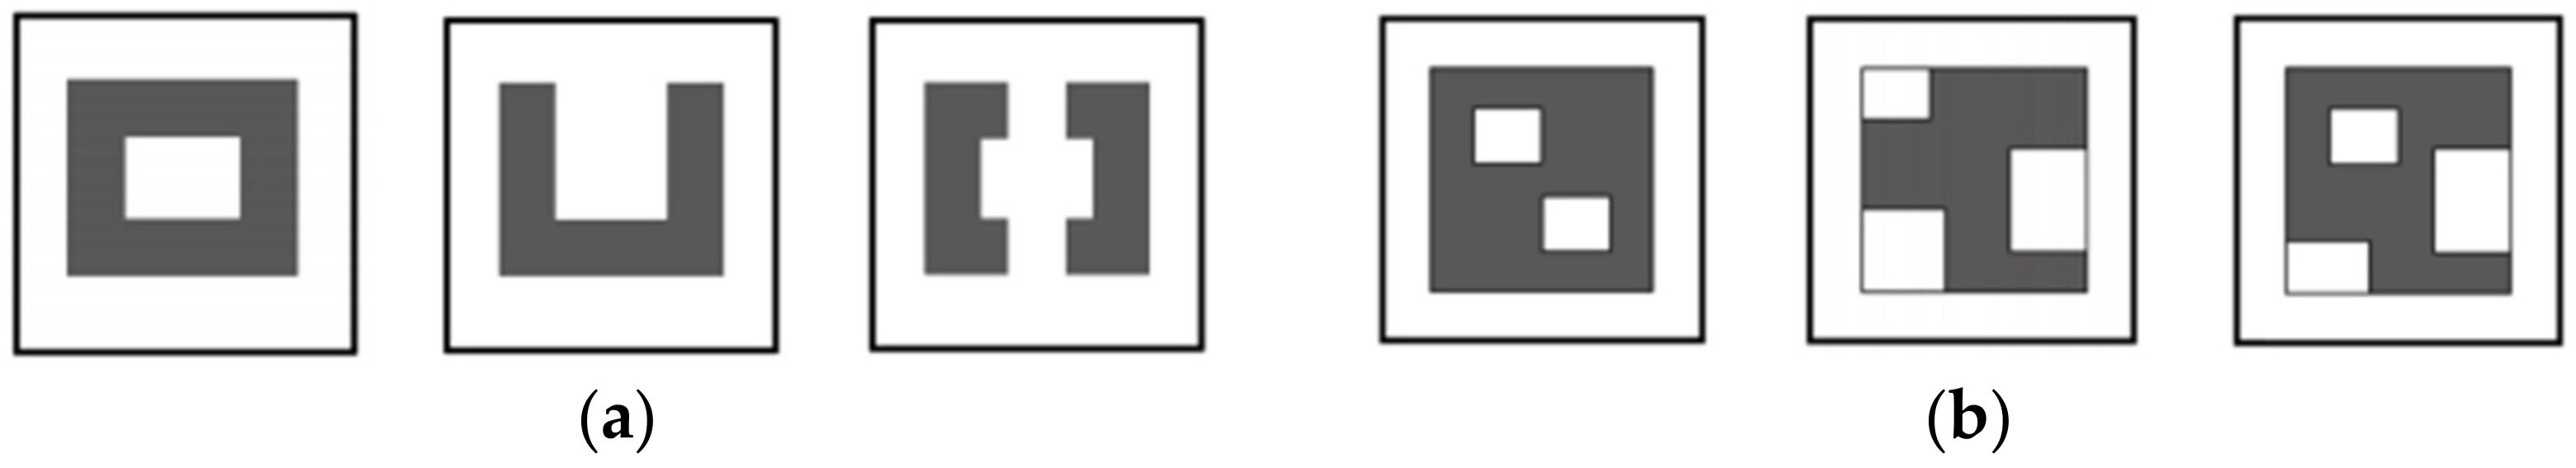
- Courtyard pattern for cold protection by enclosing a space. The courtyard pattern is a typical cold-weather construction method. An area is enclosed by buildings to form a public external space and a private internal space, isolating the living area from the urban environment. The courtyard pattern effectively keeps out the cold in cold-region building clusters, and the surrounding buildings block unfavorable elements, such as cold winds and snowstorms, creating a relatively comfortable courtyard microenvironment. The courtyard pattern has a very long history in China, dating back to the Western Zhou Dynasty. It has been widely used in northern residential buildings and has evolved into various types according to different regional climatic characteristics (Figure 3).
- (4)
- Mixed pattern: The block contains two or more of the basic patterns.
2.2.2. Acquisition of Data on Morphological Patterns of Cold-Region Building Clusters
- (1)
- Point cluster pattern: The buildings in the block exhibit a point pattern, and the ratio of the longest side to the shortest side of a single building is less than 2:1.
- (2)
- Linear pattern: The buildings in the block have a linear pattern, and the ratio of the longest side to the shortest side of a single building is more than or equal to 2:1.
- (3)
- Courtyard pattern: The buildings in the block exhibit a courtyard pattern, consisting of a fully enclosed type, semi-open courtyard type, or combined type.
- (4)
- Mixed pattern: the blocks have characteristics of two or more of the above types.
2.2.3. Clustering Analysis of Morphological Patterns of Cold-Region Building Clusters
2.2.4. Z-Score and p-Value
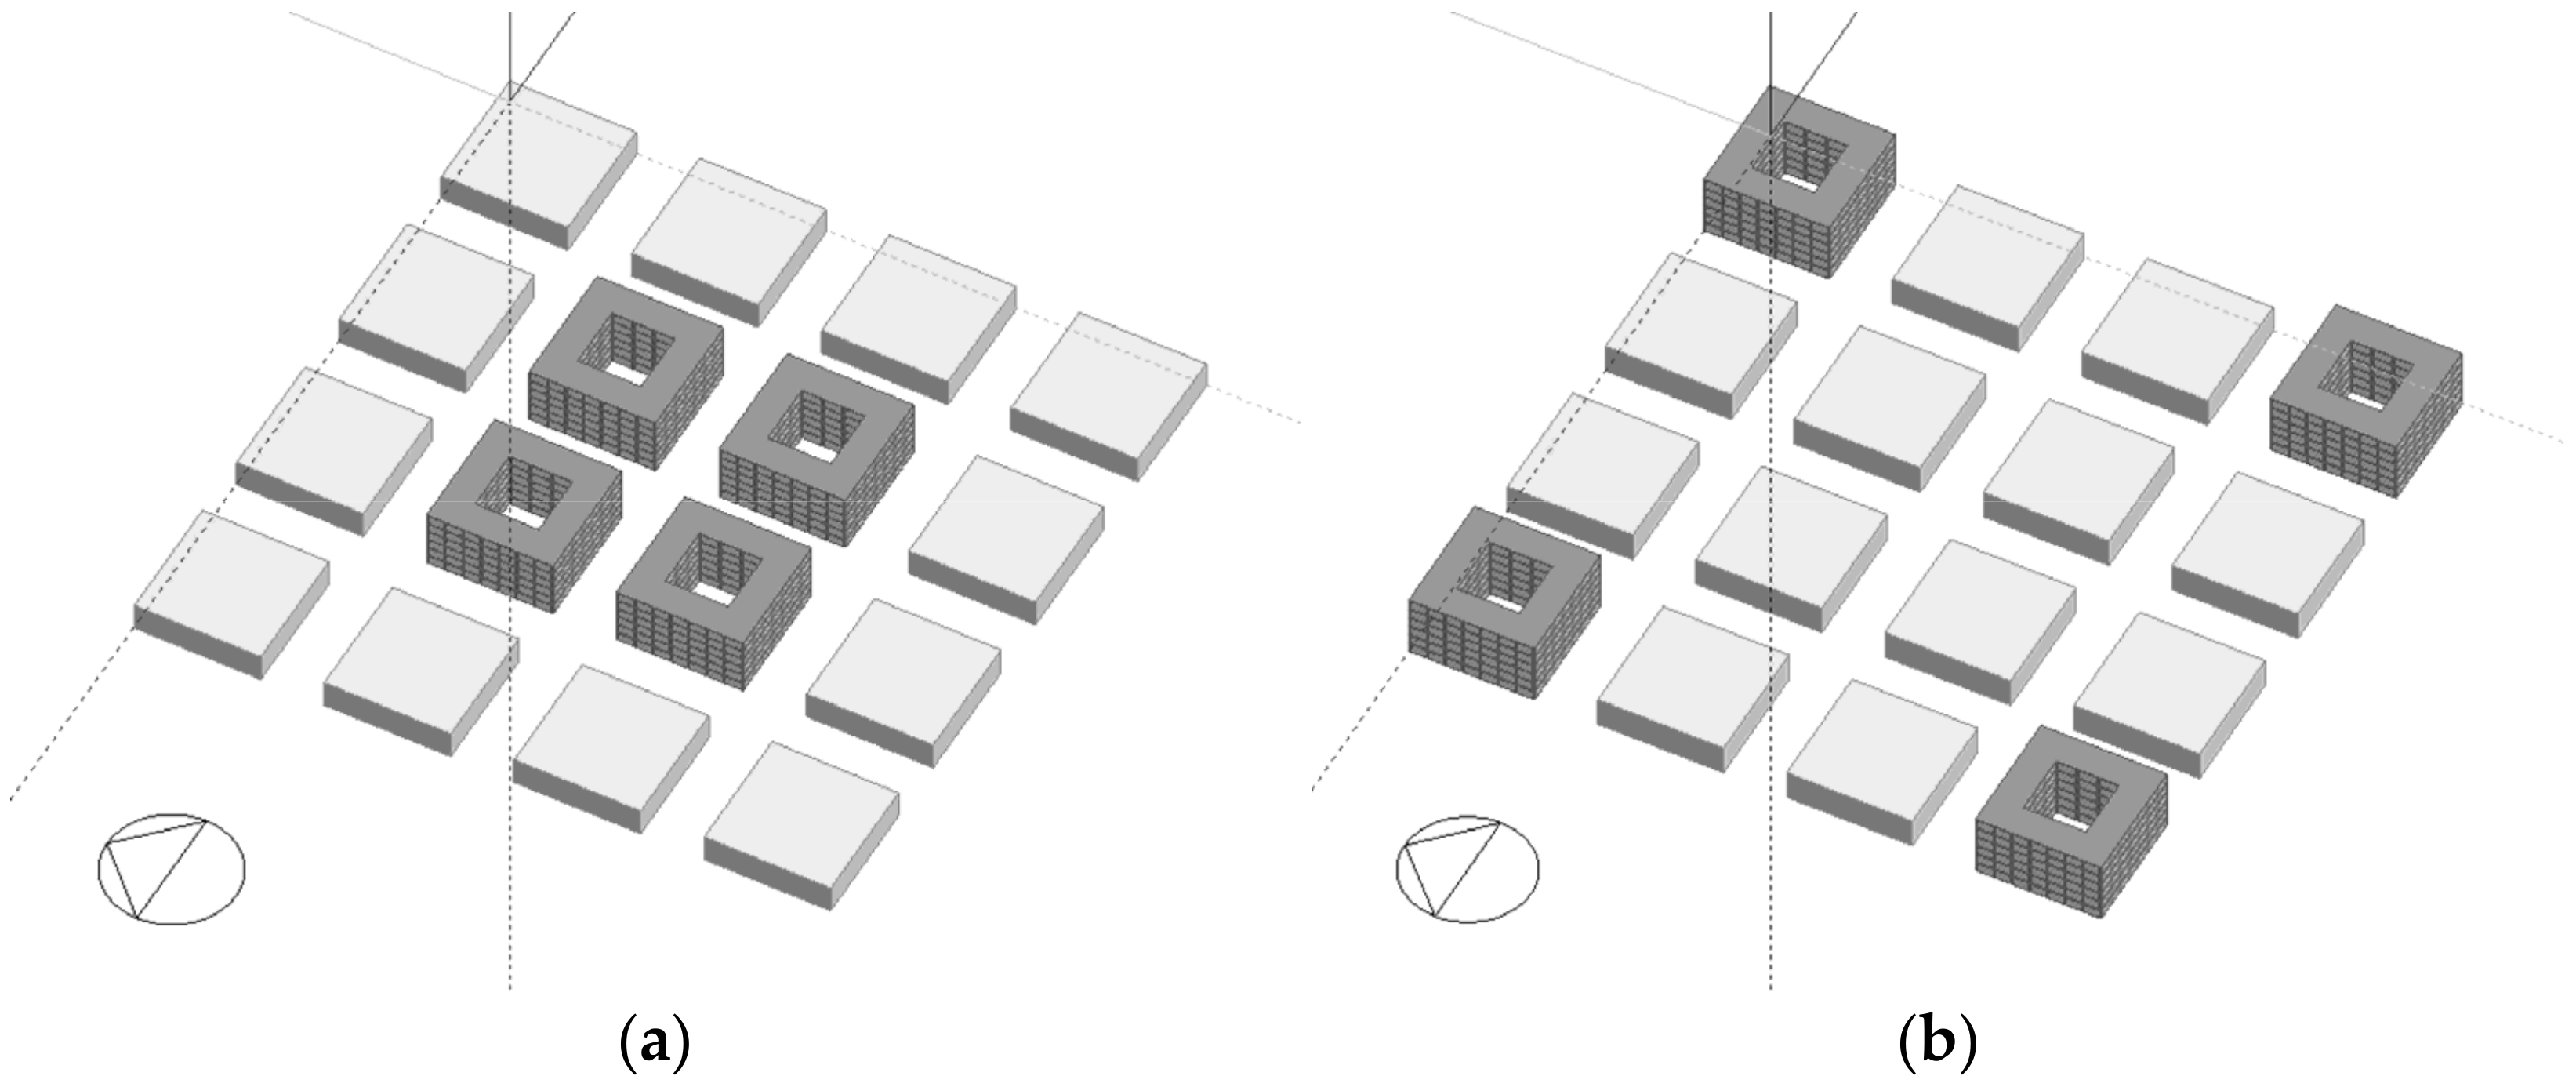
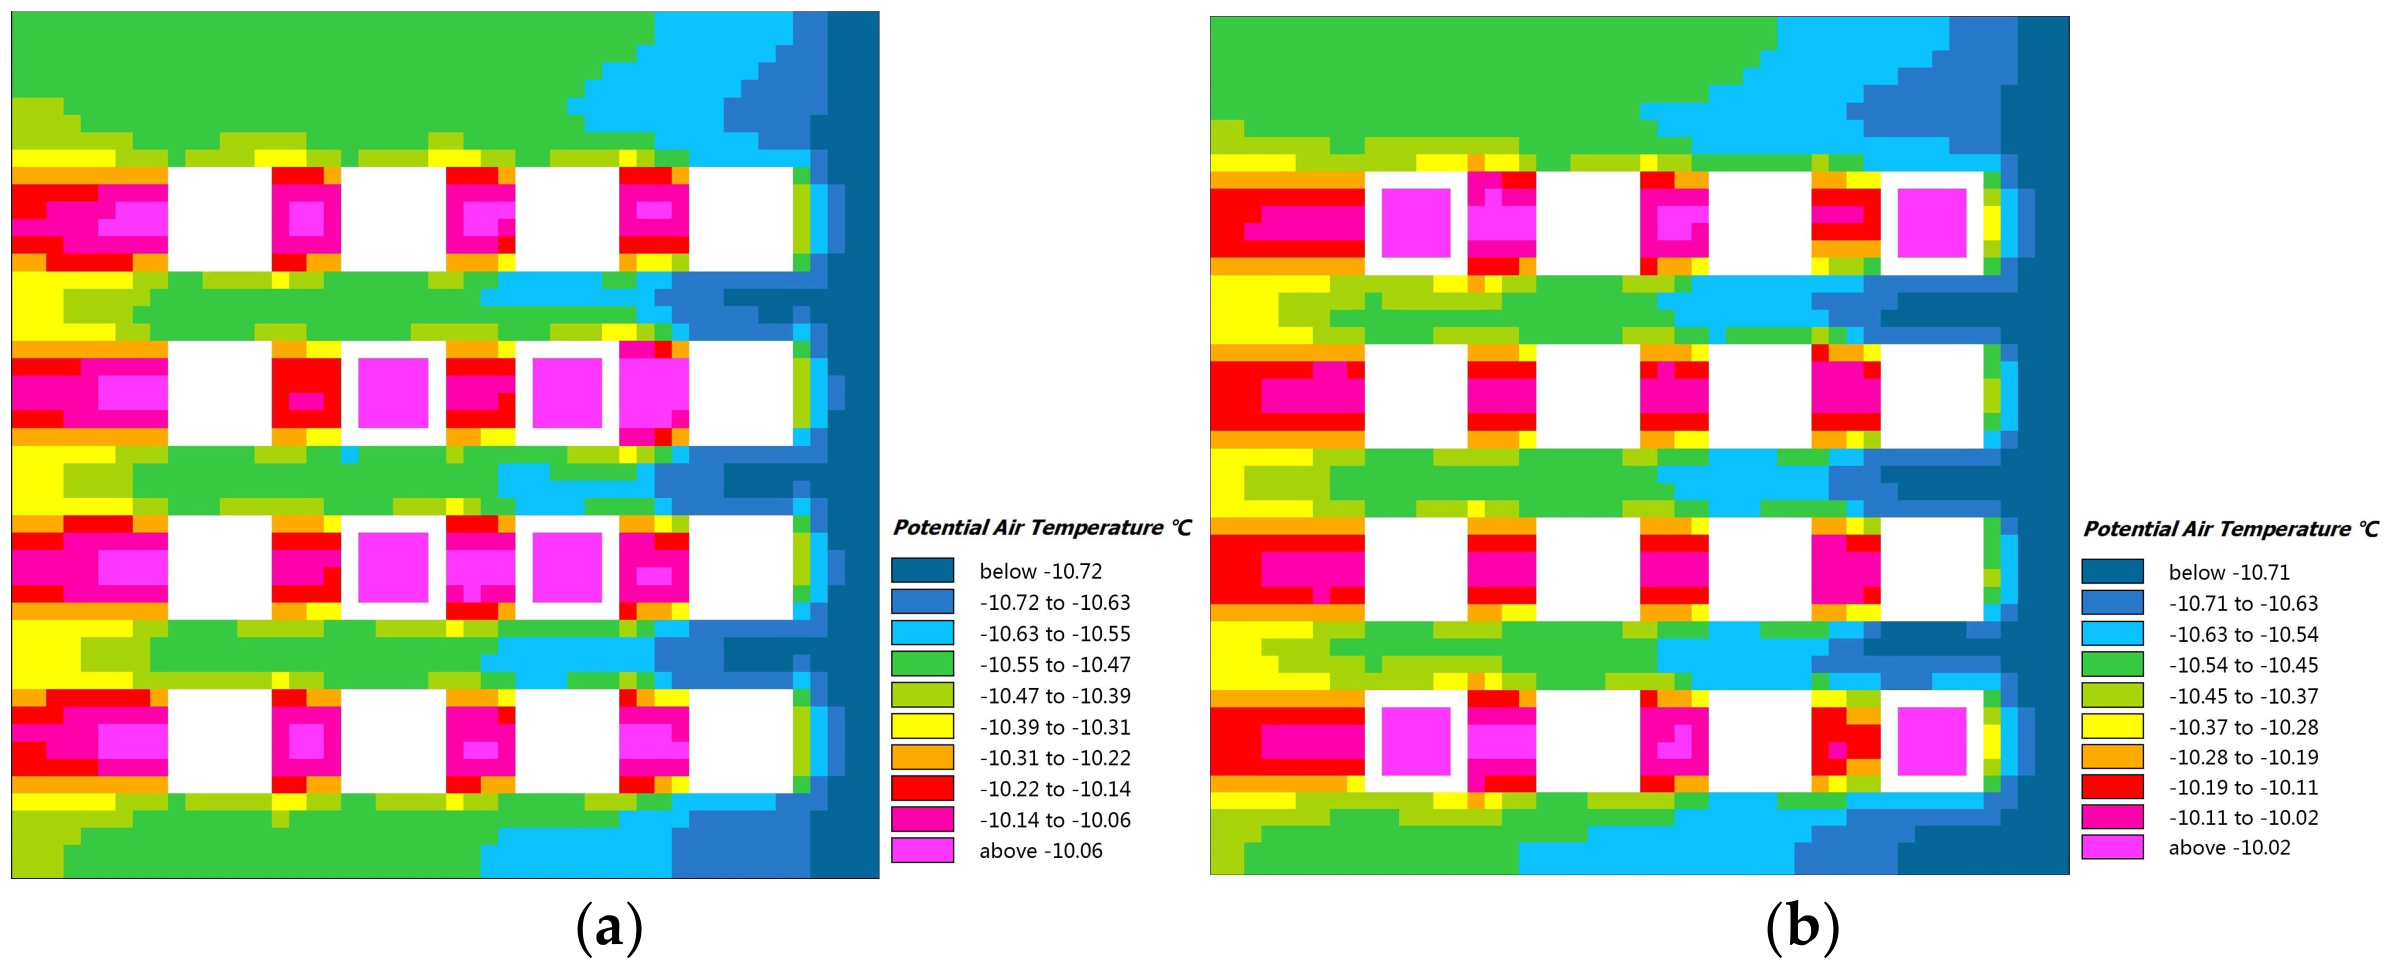
2.2.5. Simulation
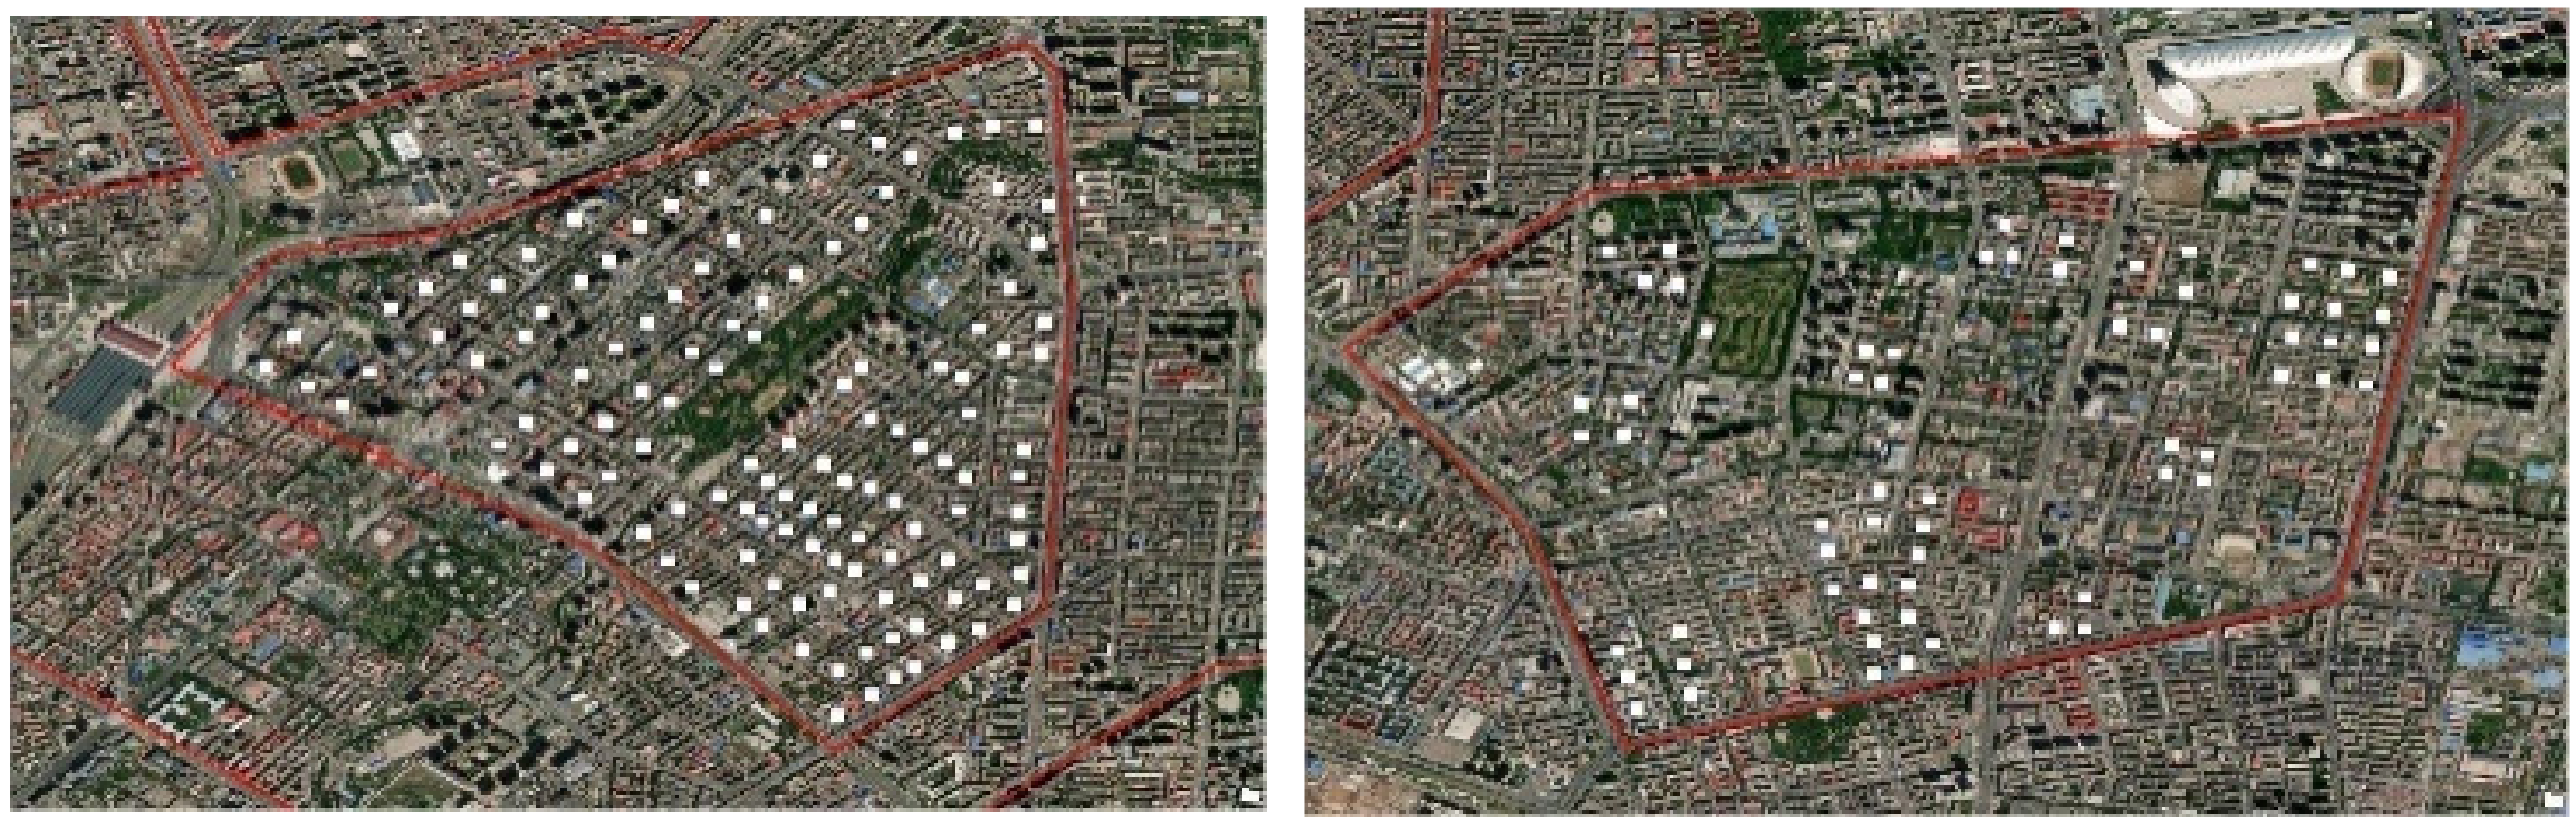
2.3. Case Study and Data Collection
3. Results and Analysis
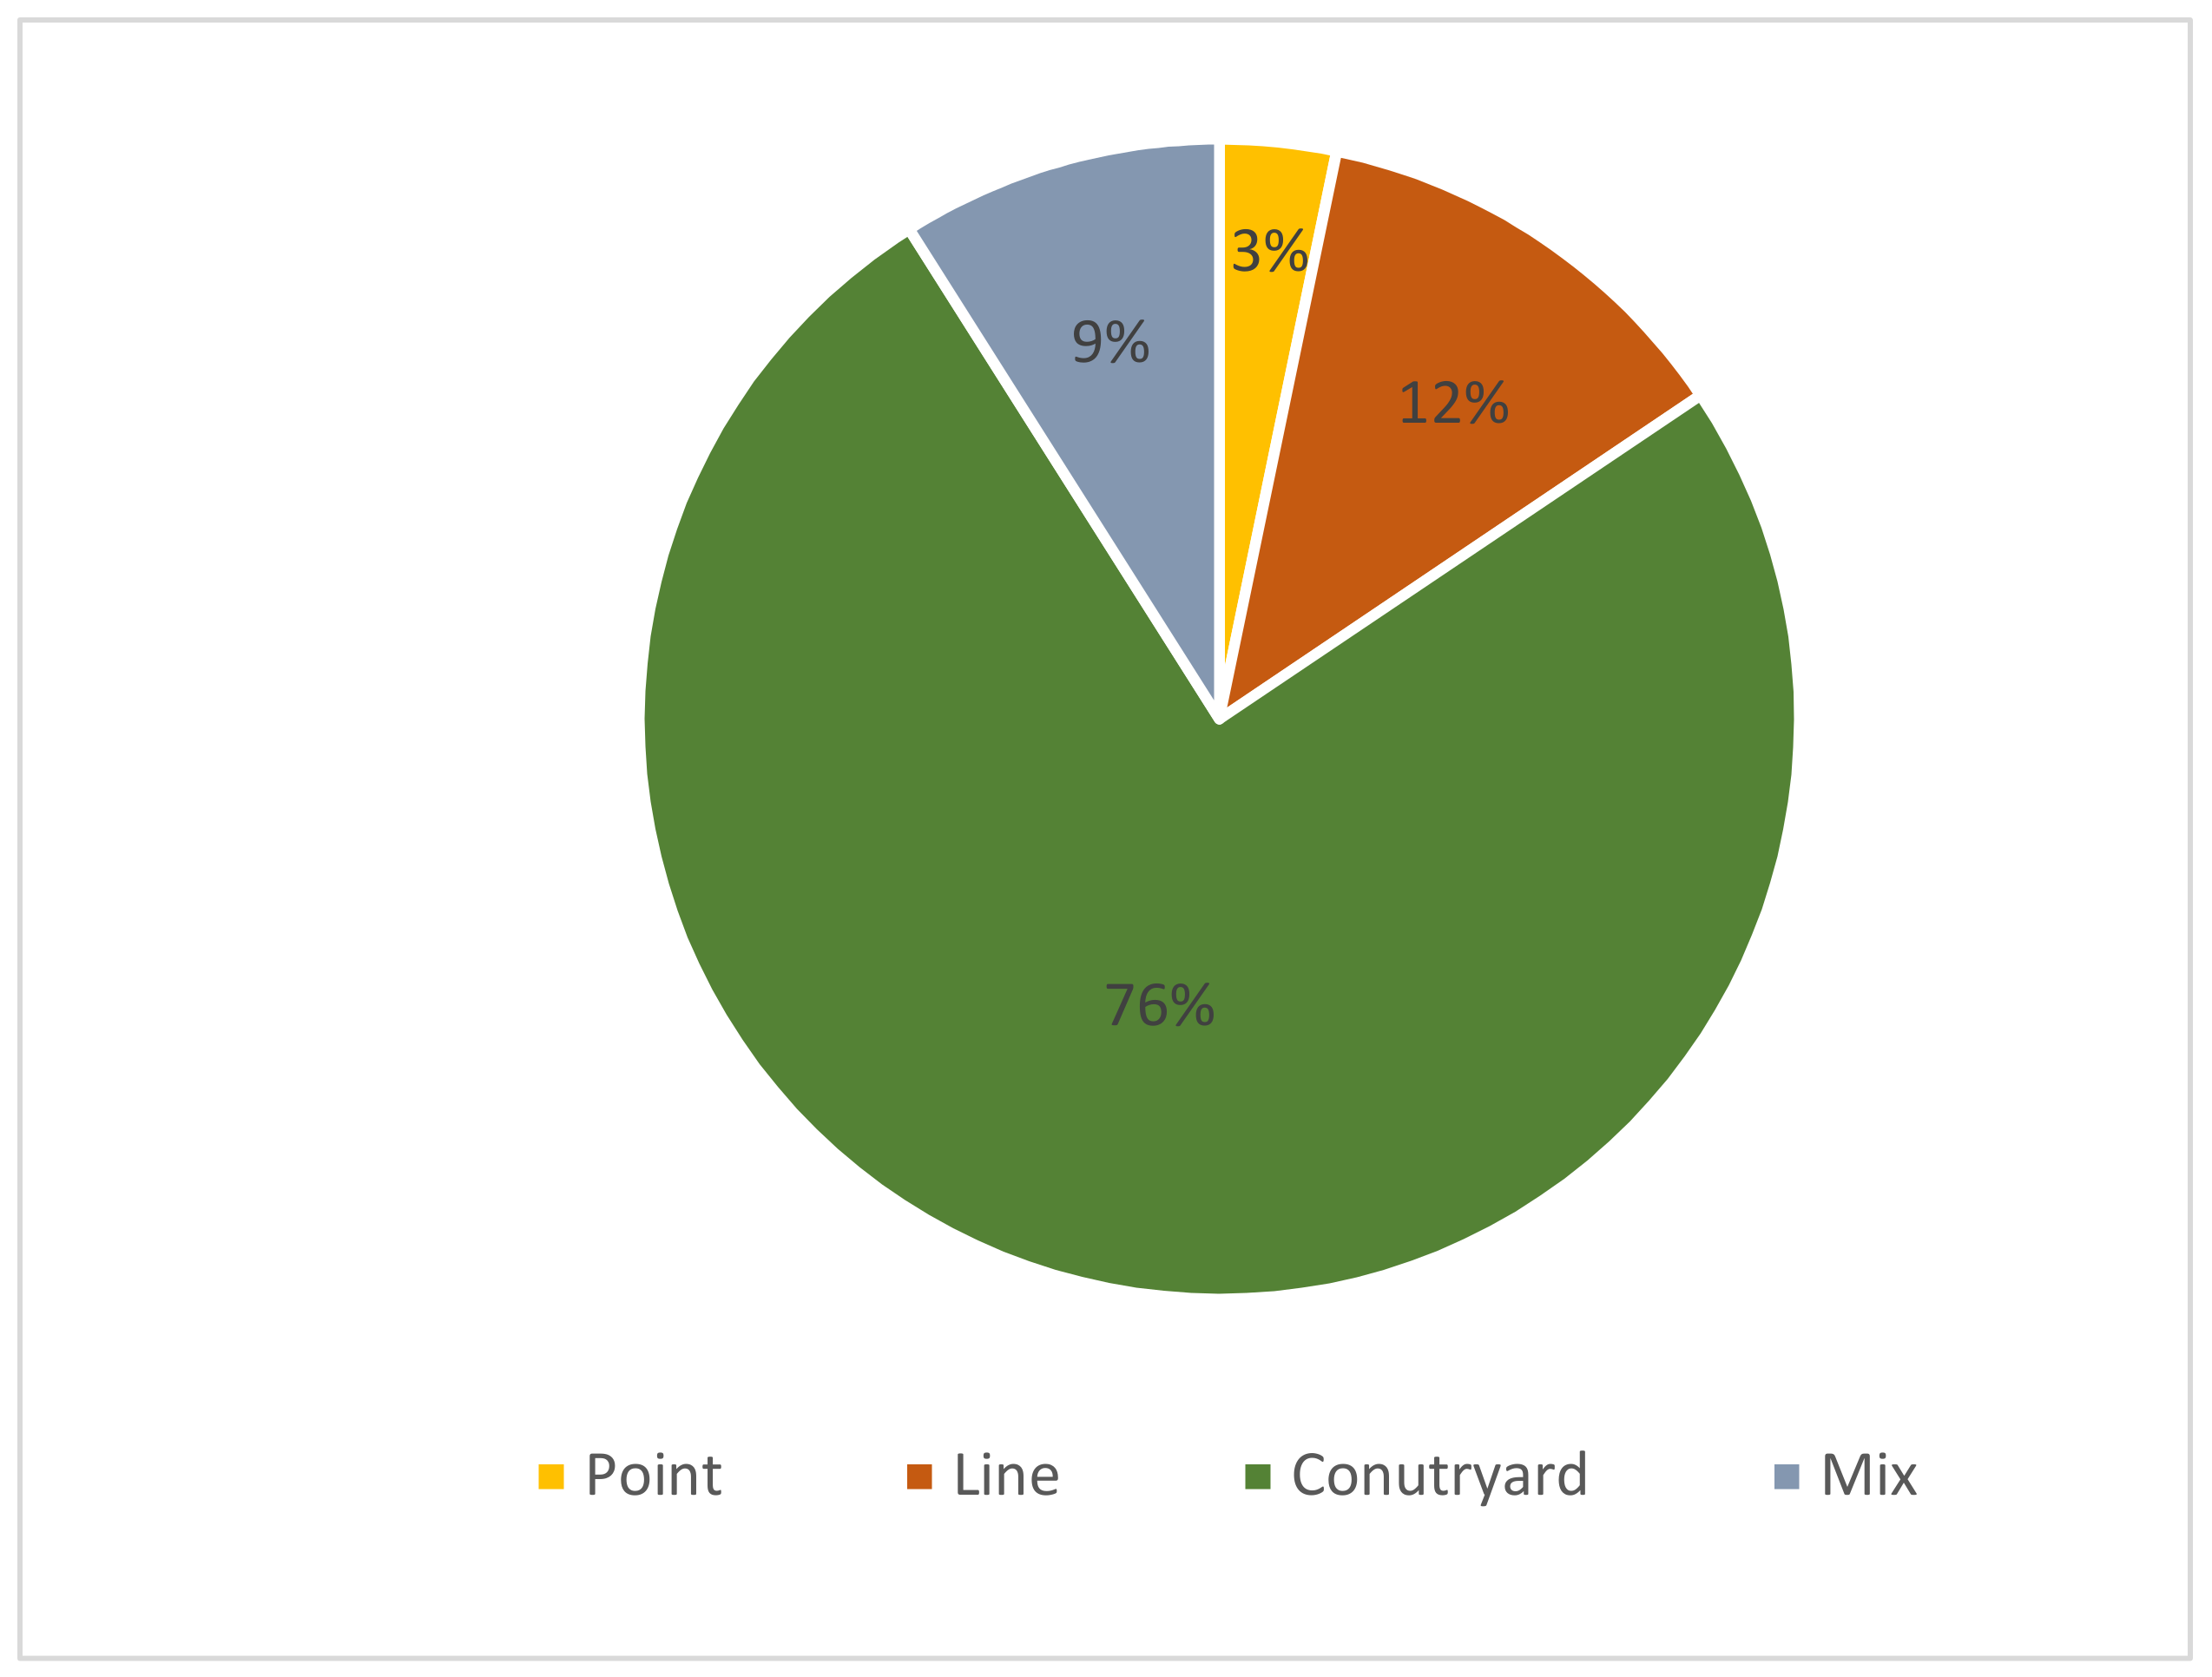
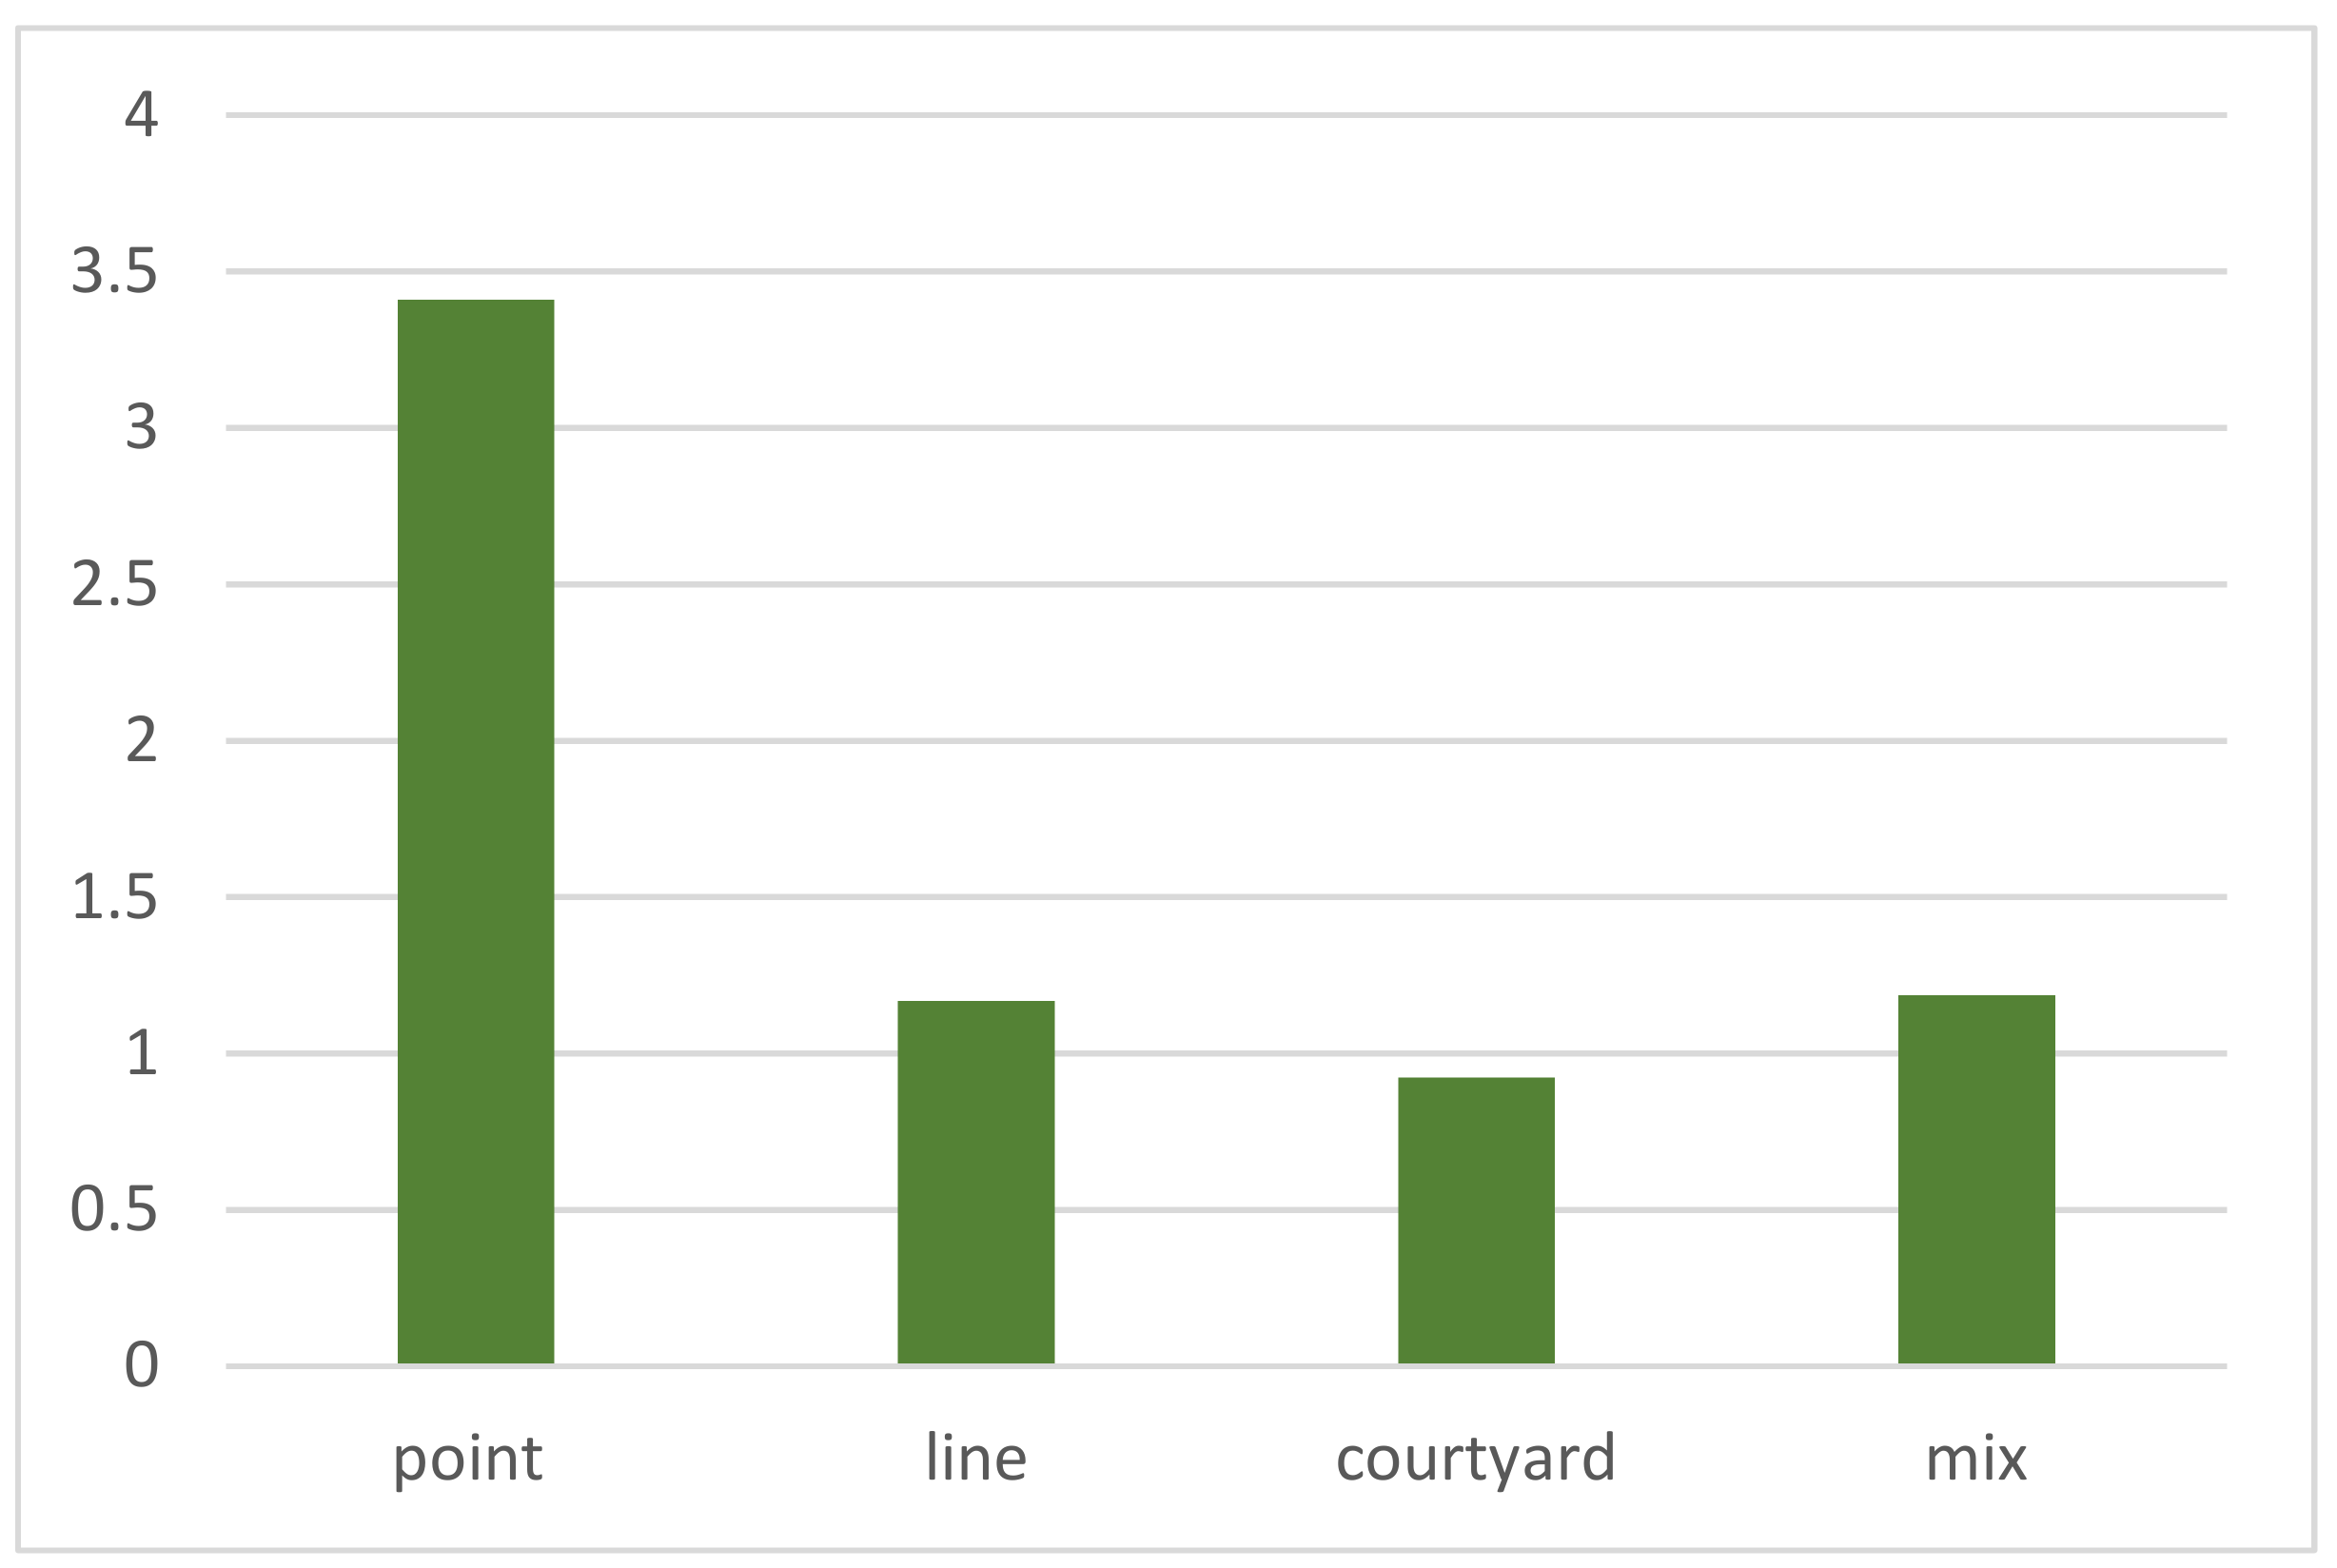
3.1. Block Model Type Analysis
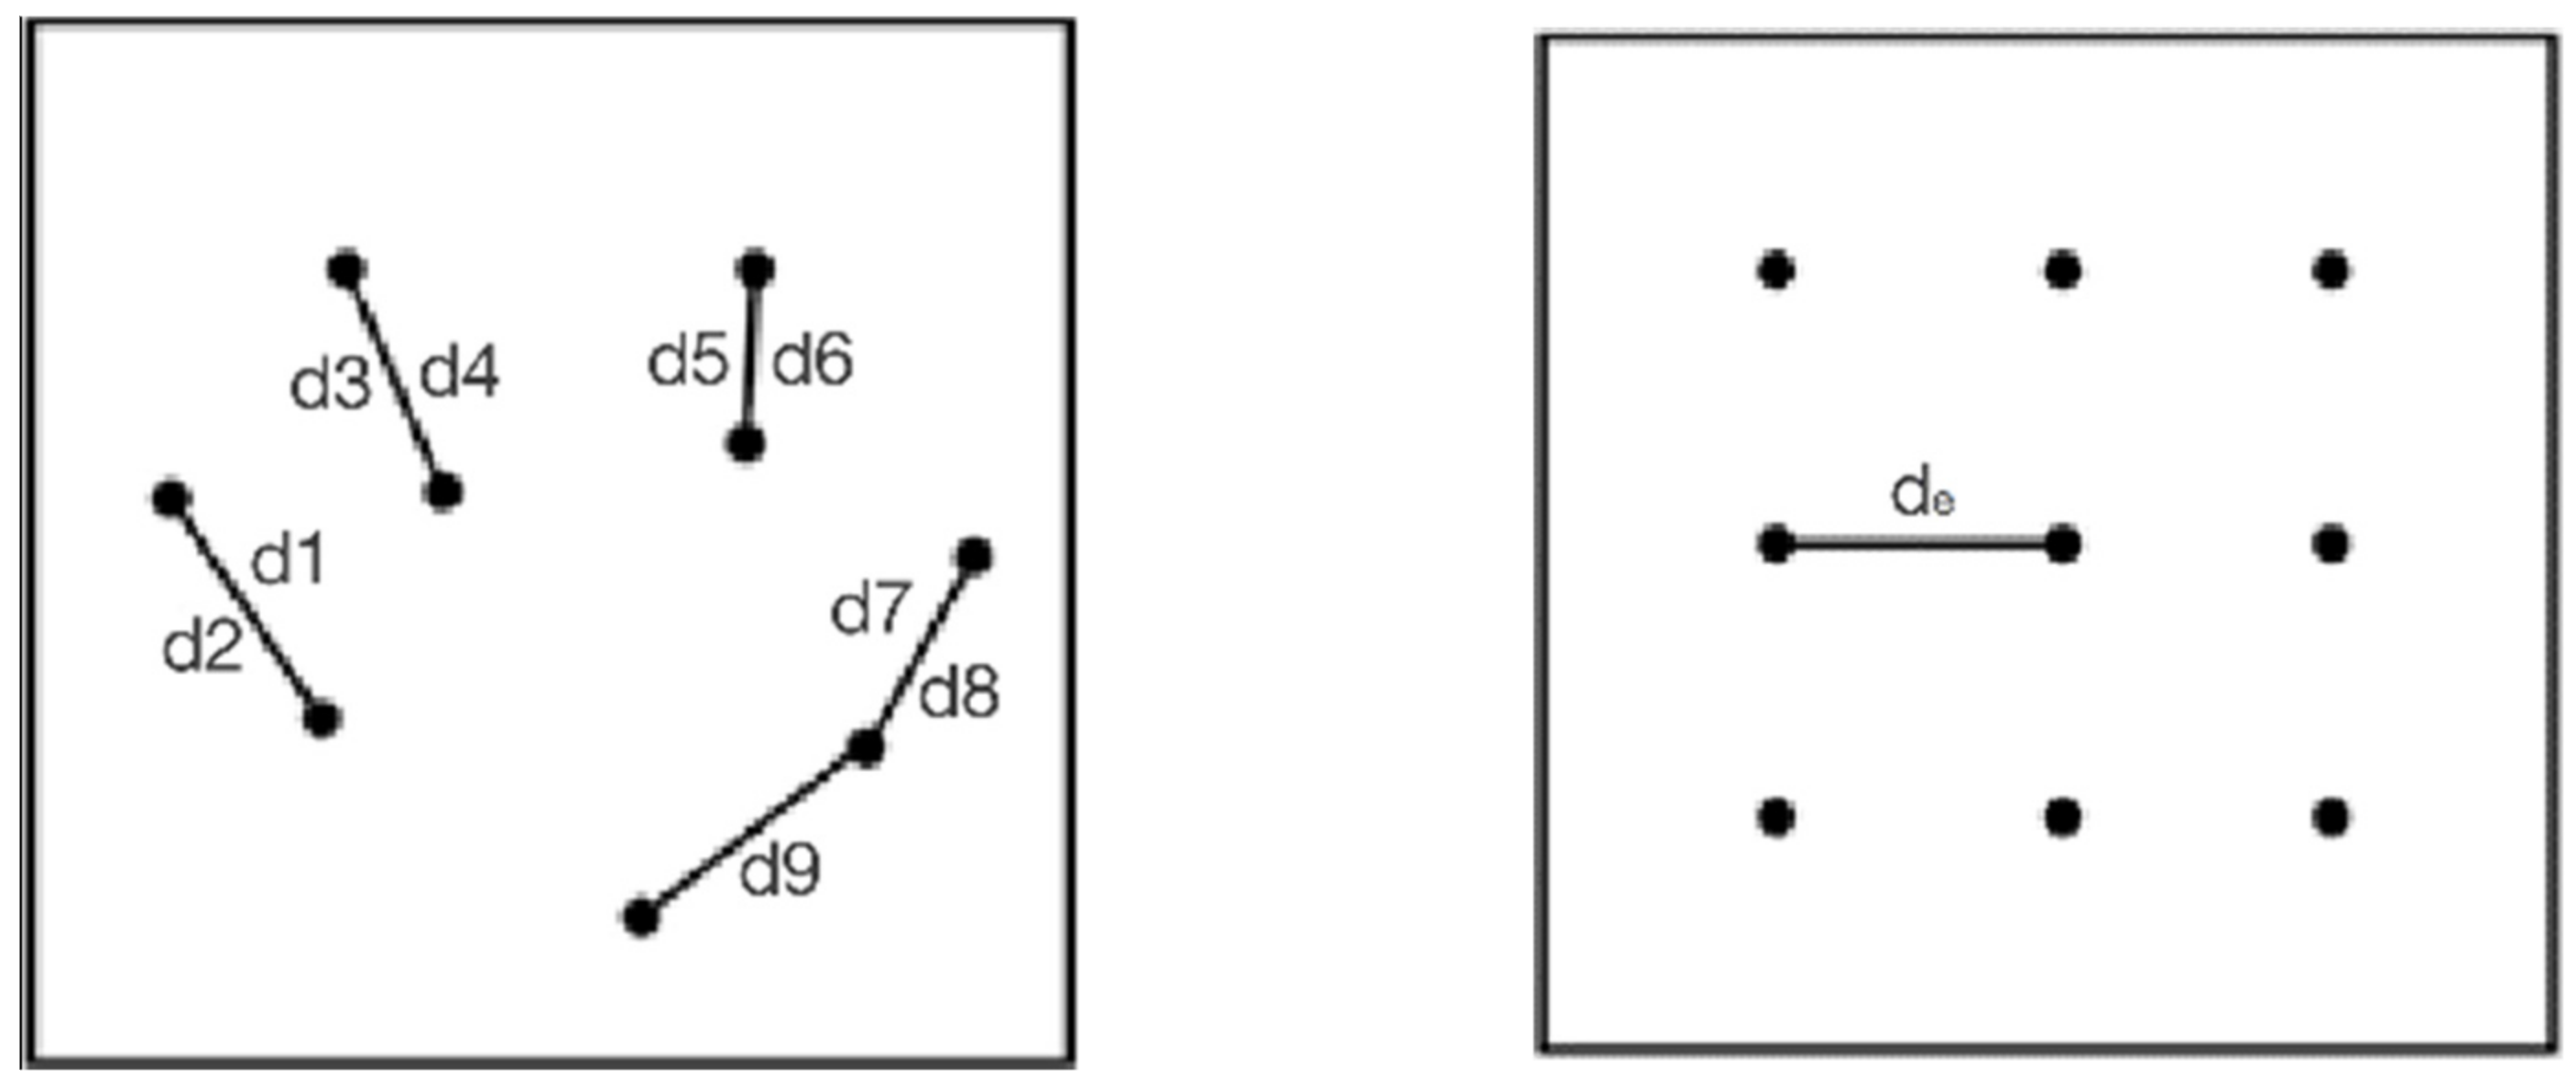
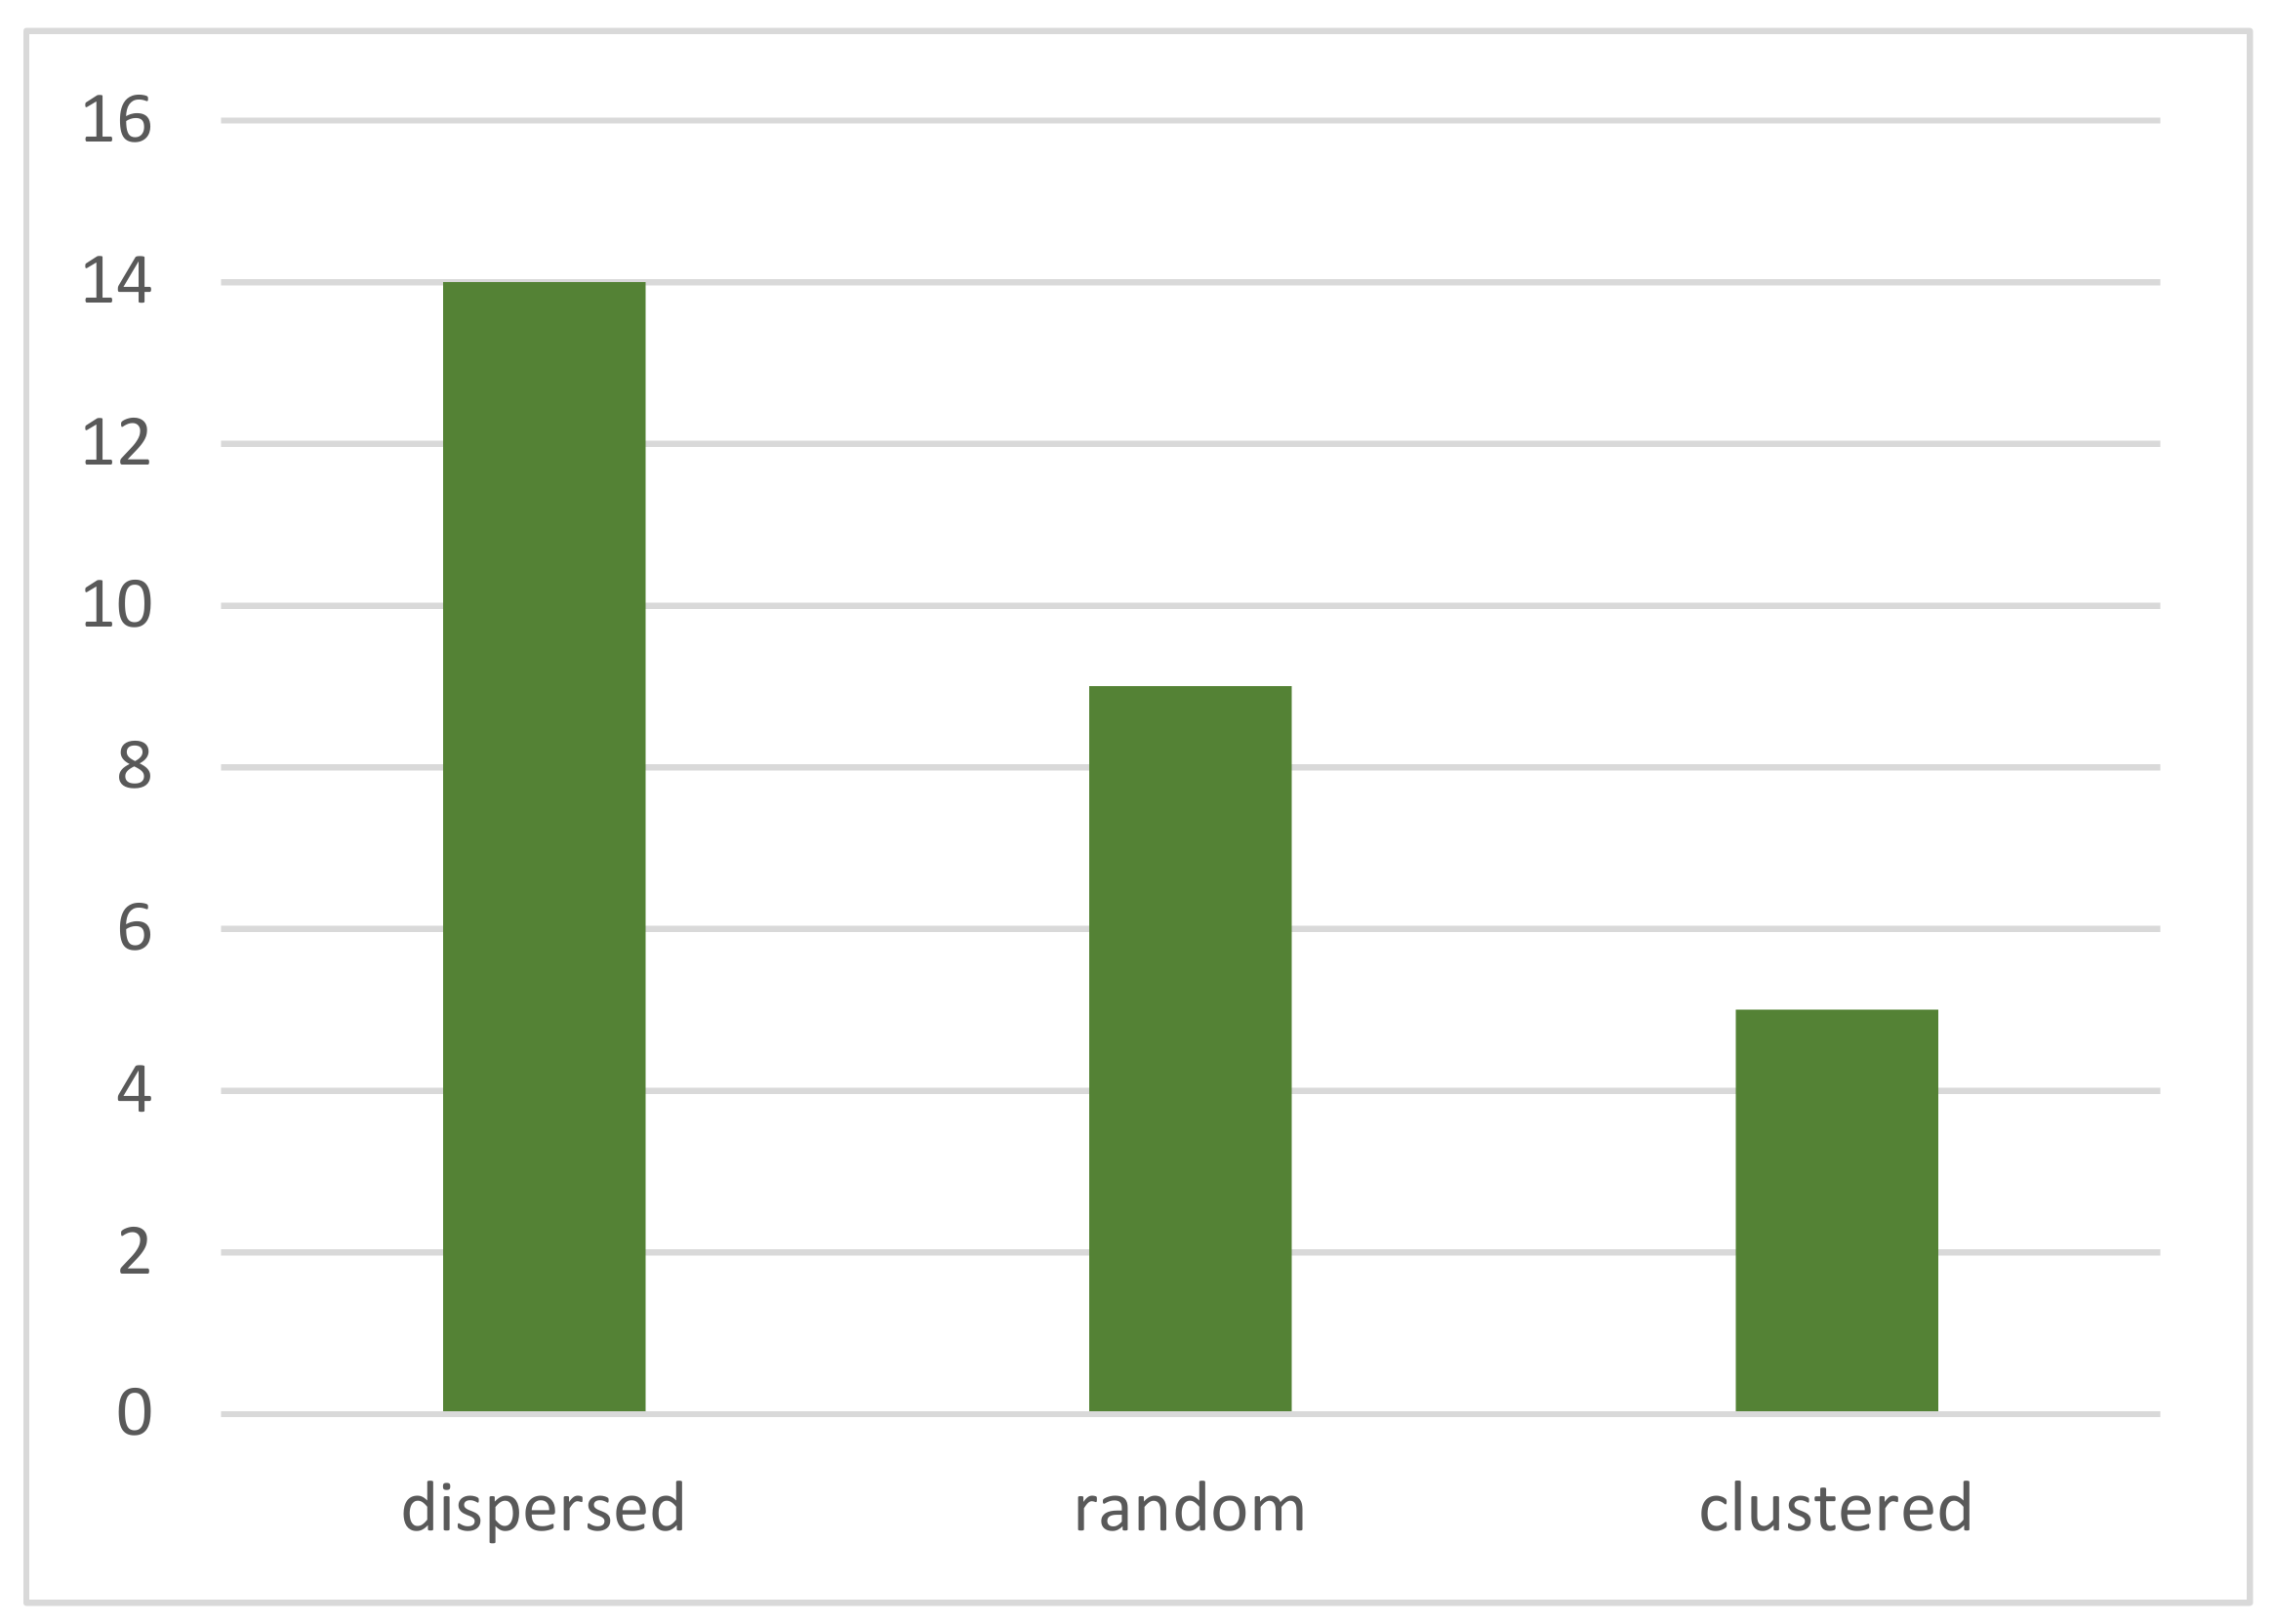
3.2. Average Nearest-Neighbor Analysis
3.3. Simulation Analysis
4. Discussion and Limitations
4.1. Clustering Characteristics of the Dominant Morphological Pattern
4.2. Inspiration and Limitations
5. Conclusions
Author Contributions
Funding
Institutional Review Board Statement
Informed Consent Statement
Data Availability Statement
Conflicts of Interest
References
- Mei, H. Cold Region Architecture; China Architecture & Building Press: Beijing, China, 2012. [Google Scholar]
- Tobler, W. A Computer Movie Simulating Urban Growth in the Detroit Region. Econ. Geogr. 1970, 46, 234–240. [Google Scholar] [CrossRef]
- Wheeler, D.C. A comparison of spatial clustering and cluster detection techniques for childhood leukemia incidence in Ohio, 1996–2003. Int. J. Health Geogr. 2007, 6, 13. [Google Scholar] [CrossRef] [PubMed] [Green Version]
- Christopher, A. The Timeless Way of Building; Oxford University Press: New York, NY, USA, 1979. [Google Scholar]
- Christopher, A. A Pattern Language; Oxford University Press: New York, NY, USA, 1977. [Google Scholar]
- IPCC. Climate Change and Land. 2019. Available online: https://www.ipcc.ch/site/assets/uploads/sites/4/2021/02/210202-IPCCJ7230-SRCCL-Complete-BOOK-HRES.pdf (accessed on 27 November 2022).
- International Seminar on Urban Form: Glossary. Available online: http://www.urbanform.org/glossary.html (accessed on 21 October 2022).
- Gregory, D.; Johnston, R.; Pratt, G.; Watts, M.J.; Whatmore, S. (Eds.) The Dictionary of Human Geography; Wiley-Blackwell: Hoboken, NJ, USA, 2009. [Google Scholar]
- Baker, S. Dominic More’s Utopia; University of Toronto Press: Toronto, Japan, 2000. [Google Scholar]
- Kohl, J.G. Der Verkehr und die Ansiedelungen der Menschen in ihrer Abhängigkeit von der Gestaltung der Erdoberfläche; Ulan Press: Leipzig, Germany, 1841. [Google Scholar]
- Burton, I. The Quantitative Revolution and Theoretical Geography. Can. Geogr. 1963, 7, 51–162. [Google Scholar] [CrossRef]
- Hillier, B.; Hanson, J. The Social Logic of Space; Cambridge University Press: London, UK, 1984. [Google Scholar]
- Demangeon, A.; Row, E.F. The British Empire: A study in colonial geography. Geogr. J. 1925, 66, 372. [Google Scholar]
- Martin, L.A.; March, L. Urban Space and Structures; Cambridge University Press: New York, NY, USA, 1972. [Google Scholar]
- Olgyay, V. Design with Climate; Princeton University Press: Princeton, NJ, USA, 1963. [Google Scholar]
- Jull, M. Toward a Northern Architecture: The Micro Canyon as Arctic Urban Prototype. J. Archit. Educ. 2016, 70, 214–222. [Google Scholar]
- Merlier, L.; Kuznik, F.; Rusaouën, G.; Salat, S. Derivation of Generic Typologies for Microscale Urban Airflow Studies. Sustain. Cities Soc. 2018, 36, 71–80. [Google Scholar] [CrossRef]
- Rode, P.; Keim, C.; Robazza, G.; Viejo, P.; Schofield, J. Cities and energy: Urban morphology and residential heat-energy demand. Environ. Plan. B-Plan. Des. 2014, 41, 138–162. [Google Scholar] [CrossRef] [Green Version]
- Leng, H.; Chen, X.; Ma, Y.; Wong, N.H.; Ming, T. Urban morphology and building heating energy consumption: Evidence from Harbin, a severe cold region city. Energy Build. 2020, 224, 110–143. [Google Scholar] [CrossRef]
- Ahmadian, E.; Sodagar, B.; Bingham, C.; Elnokaly, A.; Mills, G. Effect of urban built form and density on building energy performance in temperate climates. Energy Build. 2021, 236, 110762. [Google Scholar] [CrossRef]
- Delmastro, C.; Mutani, G.; Vicentini, G. Urban morphology and energy consumption in Italian residential buildings. In Proceedings of the International Conference on Renewable Energy Research and Applications, Palermo, Italy, 22–25 November 2015. [Google Scholar]
- Clark, P.J.; Evans, F.C. Distance to Nearest Neighbor as a Measure of Spatial Relationships in Populations. Ecology 1954, 35, 445–453. [Google Scholar] [CrossRef]
- Almohamad, H.; Knaack, A.L.; Habib, B.M. Assessing Spatial Equity and Accessibility of Public Green Spaces in Aleppo City, Syria. Forests 2018, 9, 706. [Google Scholar] [CrossRef] [Green Version]
- Ghodousi, M.; Sadeghi-Niaraki, A.; Rabiee, F.; Choi, S.M. Spatial-Temporal Analysis of Point Distribution Pattern of Schools Using Spatial Autocorrelation Indices in Bojnourd City. Sustainability 2020, 18, 7755. [Google Scholar] [CrossRef]
- Vidanapathirana, N.D. A Comparison of Spatial Clustering Assessment Methods. Master's Thesis, University of South Carolina, Columbia, SC, USA, 2021. [Google Scholar]
- Brian, B. Temporal and spatial patterns of urban sprawl and their implications on environmental planning in Mbarara Municipality. Appl. Geomat. 2016, 8, 201–216. [Google Scholar] [CrossRef]
- Altman, N. An Introduction to Kernel and Nearest-neighbor Nonparametric Regression. Am. Stat. 1992, 46, 175–185. [Google Scholar]
- Mitchell, A. The ESRI Guide to GIS Analysis, Volume 2 Spatial Measurements and Statistics; ESRI Press: Redlands, CA, USA, 2005. [Google Scholar]
- Batty, M. The New Science of Cities; The MIT Press: Cambridge, MA, USA, 2018. [Google Scholar]


| Z Score (Standard Deviation) | p-Value (Probability) | Confidence Level |
|---|---|---|
| <−1.65 or >+1.65 | <0.10 | 0.9 |
| <−1.96 or >+1.96 | <0.05 | 0.95 |
| <−2.58 or >+2.58 | <0.01 | 0.99 |
| Region | Region_1 | Region_2 | Region_3 | Region_4 | Region_5 | Region_6 | Region_7 |
|---|---|---|---|---|---|---|---|
| Satellite image |  |  |  |  |  |  |  |
| Dataset |  | 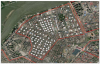 | 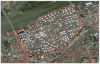 |  |  |  |  |
| Point | 1 | 5 | 3 | 3 | 3 | 6 | 10 |
| Line | 7 | 11 | 13 | 14 | 7 | 41 | 25 |
| Courtyard | 74 | 97 | 136 | 126 | 140 | 79 | 70 |
| Mix | 8 | 10 | 10 | 10 | 9 | 16 | 23 |
| Region_1 | Region_2 | Region_3 | Region_4 | Region_5 | Region_6 | Region_7 | |
|---|---|---|---|---|---|---|---|
| point cluster | dispersed | dispersed | random | Dispersed | dispersed | dispersed | random |
| ANN | 2.530677 | 1.69431 | 1.021969 | 1.302401 | 14.606506 | 1.729342 | 0.976849 |
| z-score | 5.856584 | 3.514257 | 0.111198 | 1.918713 | 45.085630 | 3.691568 | −0.153422 |
| p-value | 0 | 0.000441 | 0.911459 | 0.05502 | 0 | 0.000223 | 0.878066 |
| linear cluster | dispersed | dispersed | random | Random | dispersed | random | random |
| ANN | 1.237531 | 1.298635 | 0.951383 | 1.154374 | 1.504588 | 0.986570 | 1.034717 |
| z-score | 2.082381 | 2.137645 | −0.426214 | 1.505882 | 2.553974 | −0.170430 | 0.351436 |
| p-value | 0.037308 | 0.032546 | 0.669952 | 0.132097 | 0.010650 | 0.864672 | 0.725261 |
| courtyard cluster | clustered | dispersed | clustered | Clustered | dispersed | clustered | clustered |
| ANN | 0.903781 | 1.022213 | 0.906057 | 0.906820 | 1.114977 | 0.733709 | 0.872878 |
| z-score | −2.024818 | 0.407599 | −1.714423 | −1.672223 | 2.459217 | −4.107178 | −1.930283 |
| p-value | 0.042886 | 0.683568 | 0.086451 | 0.094480 | 0.013924 | 0.000040 | 0.053572 |
| mixed cluster | dispersed | random | random | Dispersed | dispersed | random | dispersed |
| ANN | 1.246423 | 1.124625 | 1.081049 | 1.181489 | 1.340857 | 1.152715 | 1.170588 |
| z-score | 2.054895 | 1.327442 | 1.107301 | 1.994521 | 1.956252 | 1.573301 | 1.985090 |
| p-value | 0.039889 | 0.184363 | 0.268164 | 0.046095 | 0.050435 | 0.115649 | 0.047134 |
Publisher’s Note: MDPI stays neutral with regard to jurisdictional claims in published maps and institutional affiliations. |
© 2022 by the authors. Licensee MDPI, Basel, Switzerland. This article is an open access article distributed under the terms and conditions of the Creative Commons Attribution (CC BY) license (https://creativecommons.org/licenses/by/4.0/).
Share and Cite
Pan, W.; Li, S.; Ye, Y.; Huang, Y.; Liu, H.; Liu, H.; Yu, W. Morphological Pattern of Building Clusters in Cold Regions: Evidence from Harbin. Int. J. Environ. Res. Public Health 2022, 19, 17083. https://doi.org/10.3390/ijerph192417083
Pan W, Li S, Ye Y, Huang Y, Liu H, Liu H, Yu W. Morphological Pattern of Building Clusters in Cold Regions: Evidence from Harbin. International Journal of Environmental Research and Public Health. 2022; 19(24):17083. https://doi.org/10.3390/ijerph192417083
Chicago/Turabian StylePan, Wente, Shuqi Li, Yang Ye, Yuan Huang, Haocheng Liu, Hongxing Liu, and Wenxuan Yu. 2022. "Morphological Pattern of Building Clusters in Cold Regions: Evidence from Harbin" International Journal of Environmental Research and Public Health 19, no. 24: 17083. https://doi.org/10.3390/ijerph192417083