Study on Regional Differences and Convergence of Green Development Efficiency of the Chemical Industry in the Yangtze River Economic Belt Based on Grey Water Footprint
Abstract
:1. Introduction
2. Literature Review
3. Materials and Methods
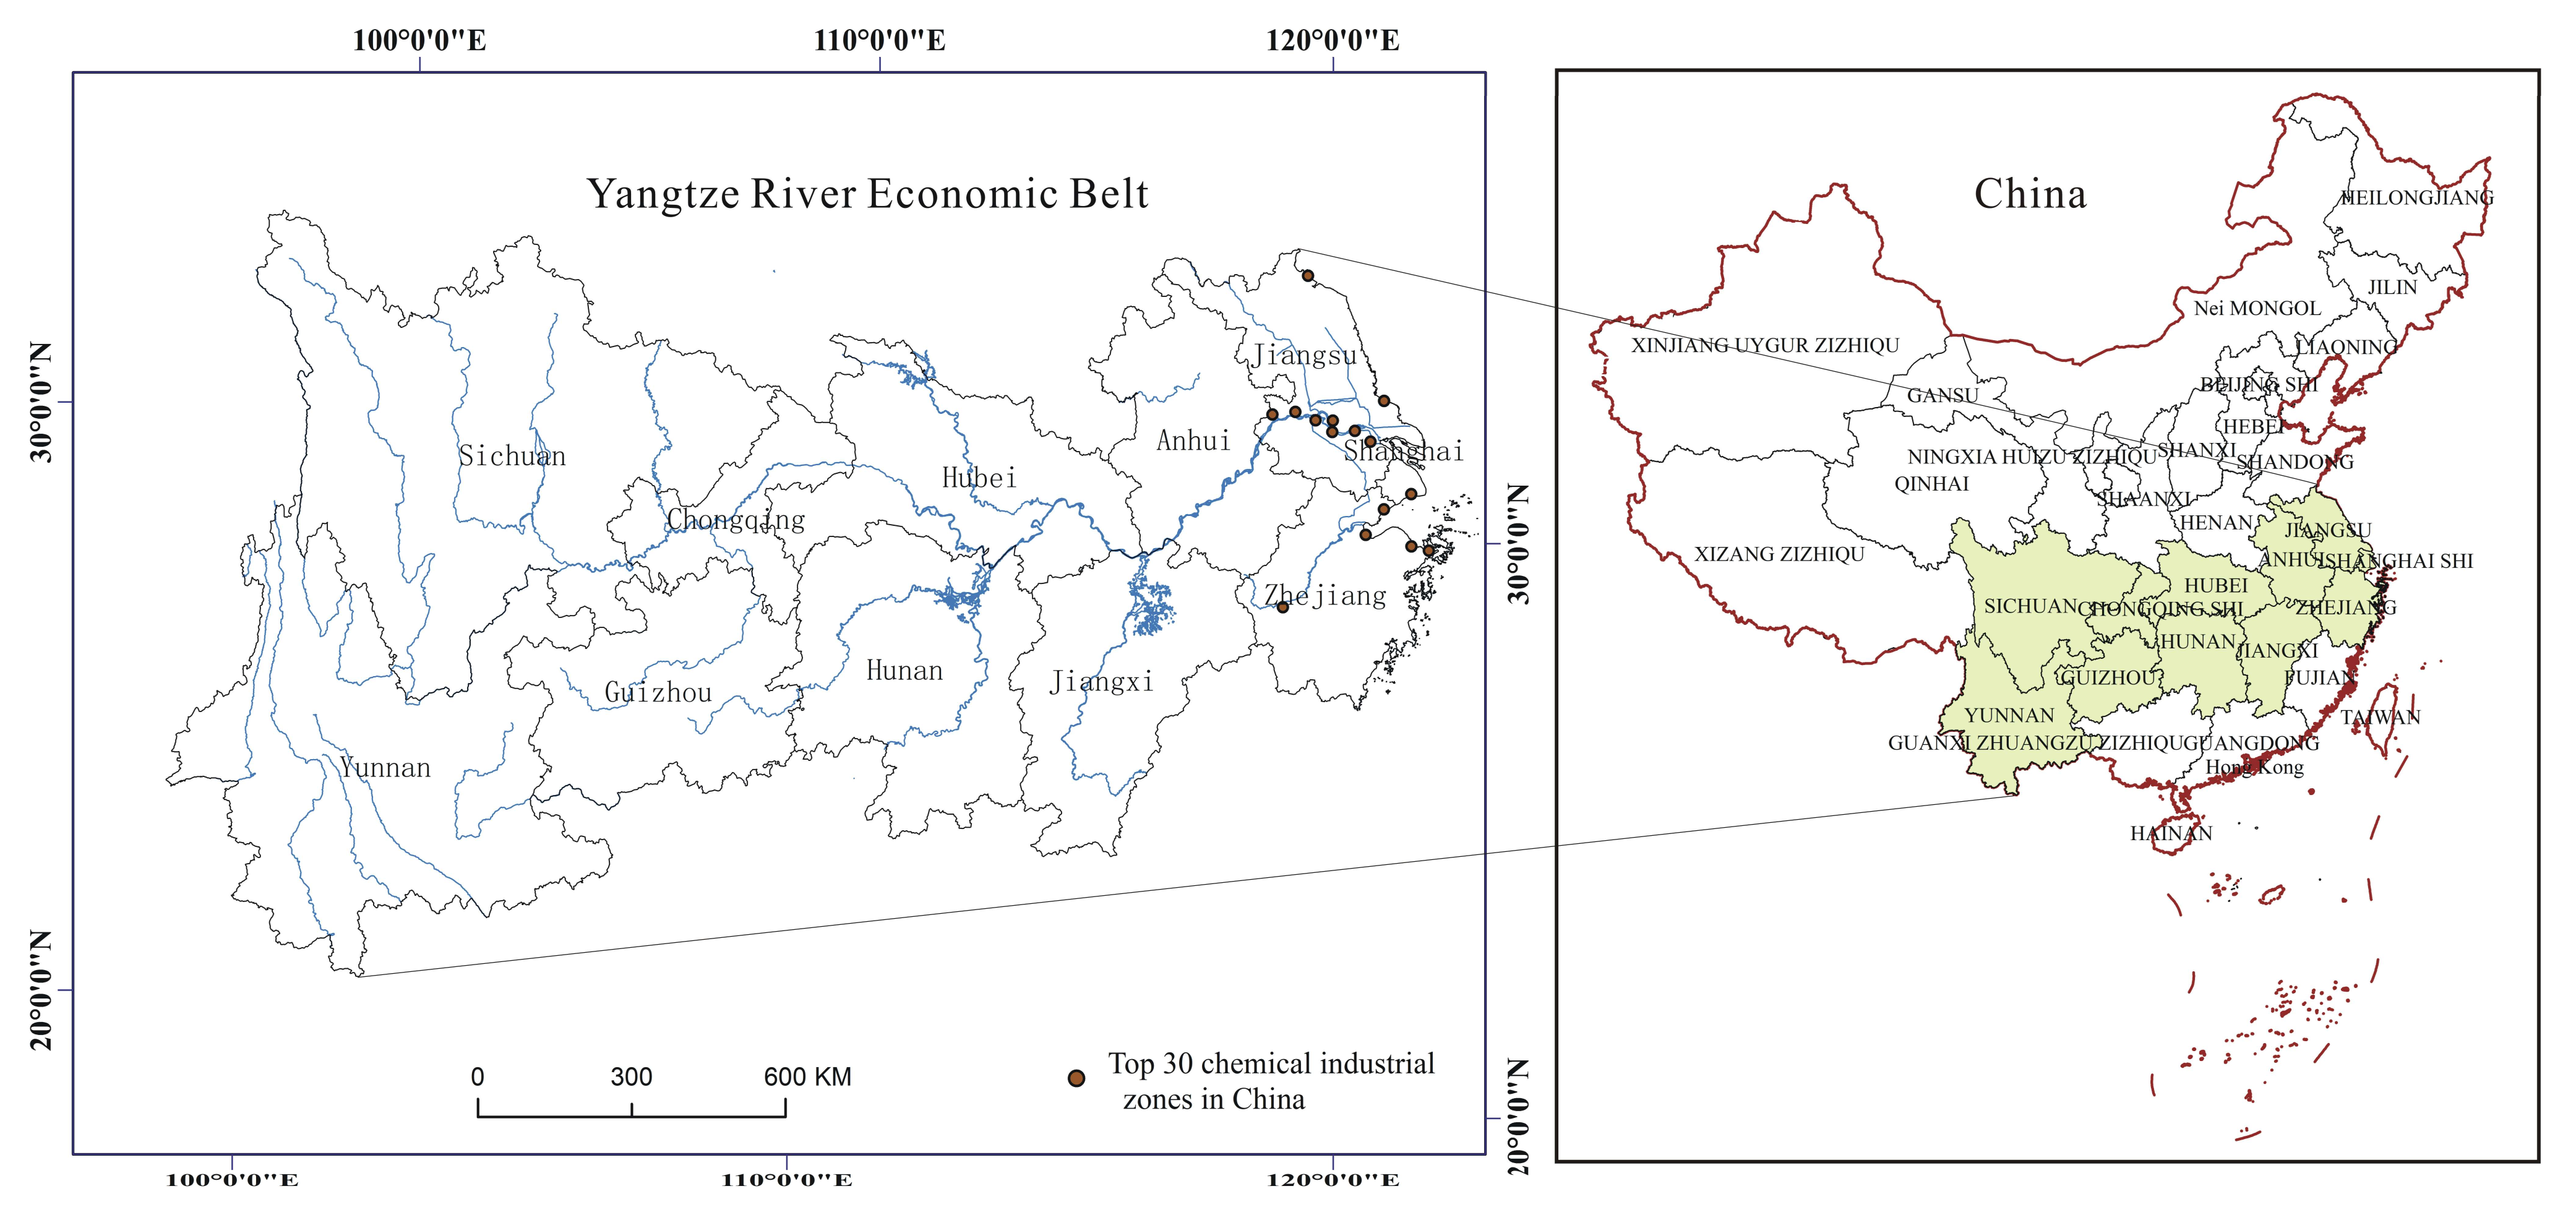
3.1. Regional Overview
3.2. Methods
3.2.1. Calculation of Grey Water Footprint of the Chemical Industry
3.2.2. Measurement Model of Green Development Efficiency of the Chemical Industry
3.2.3. Dagum Gini Coefficient and Decomposition Method
3.2.4. Convergence Model
3.3. Index Selection and Data Processing
3.3.1. Measurement Index of Green Development Efficiency of the Chemical Industry
3.3.2. Variables Affecting the Efficiency of Green Development of the Chemical Industry
4. Results
4.1. Evolution Characteristics of Grey Water Footprint of the Chemical Industry in the Yangtze River Economic Belt
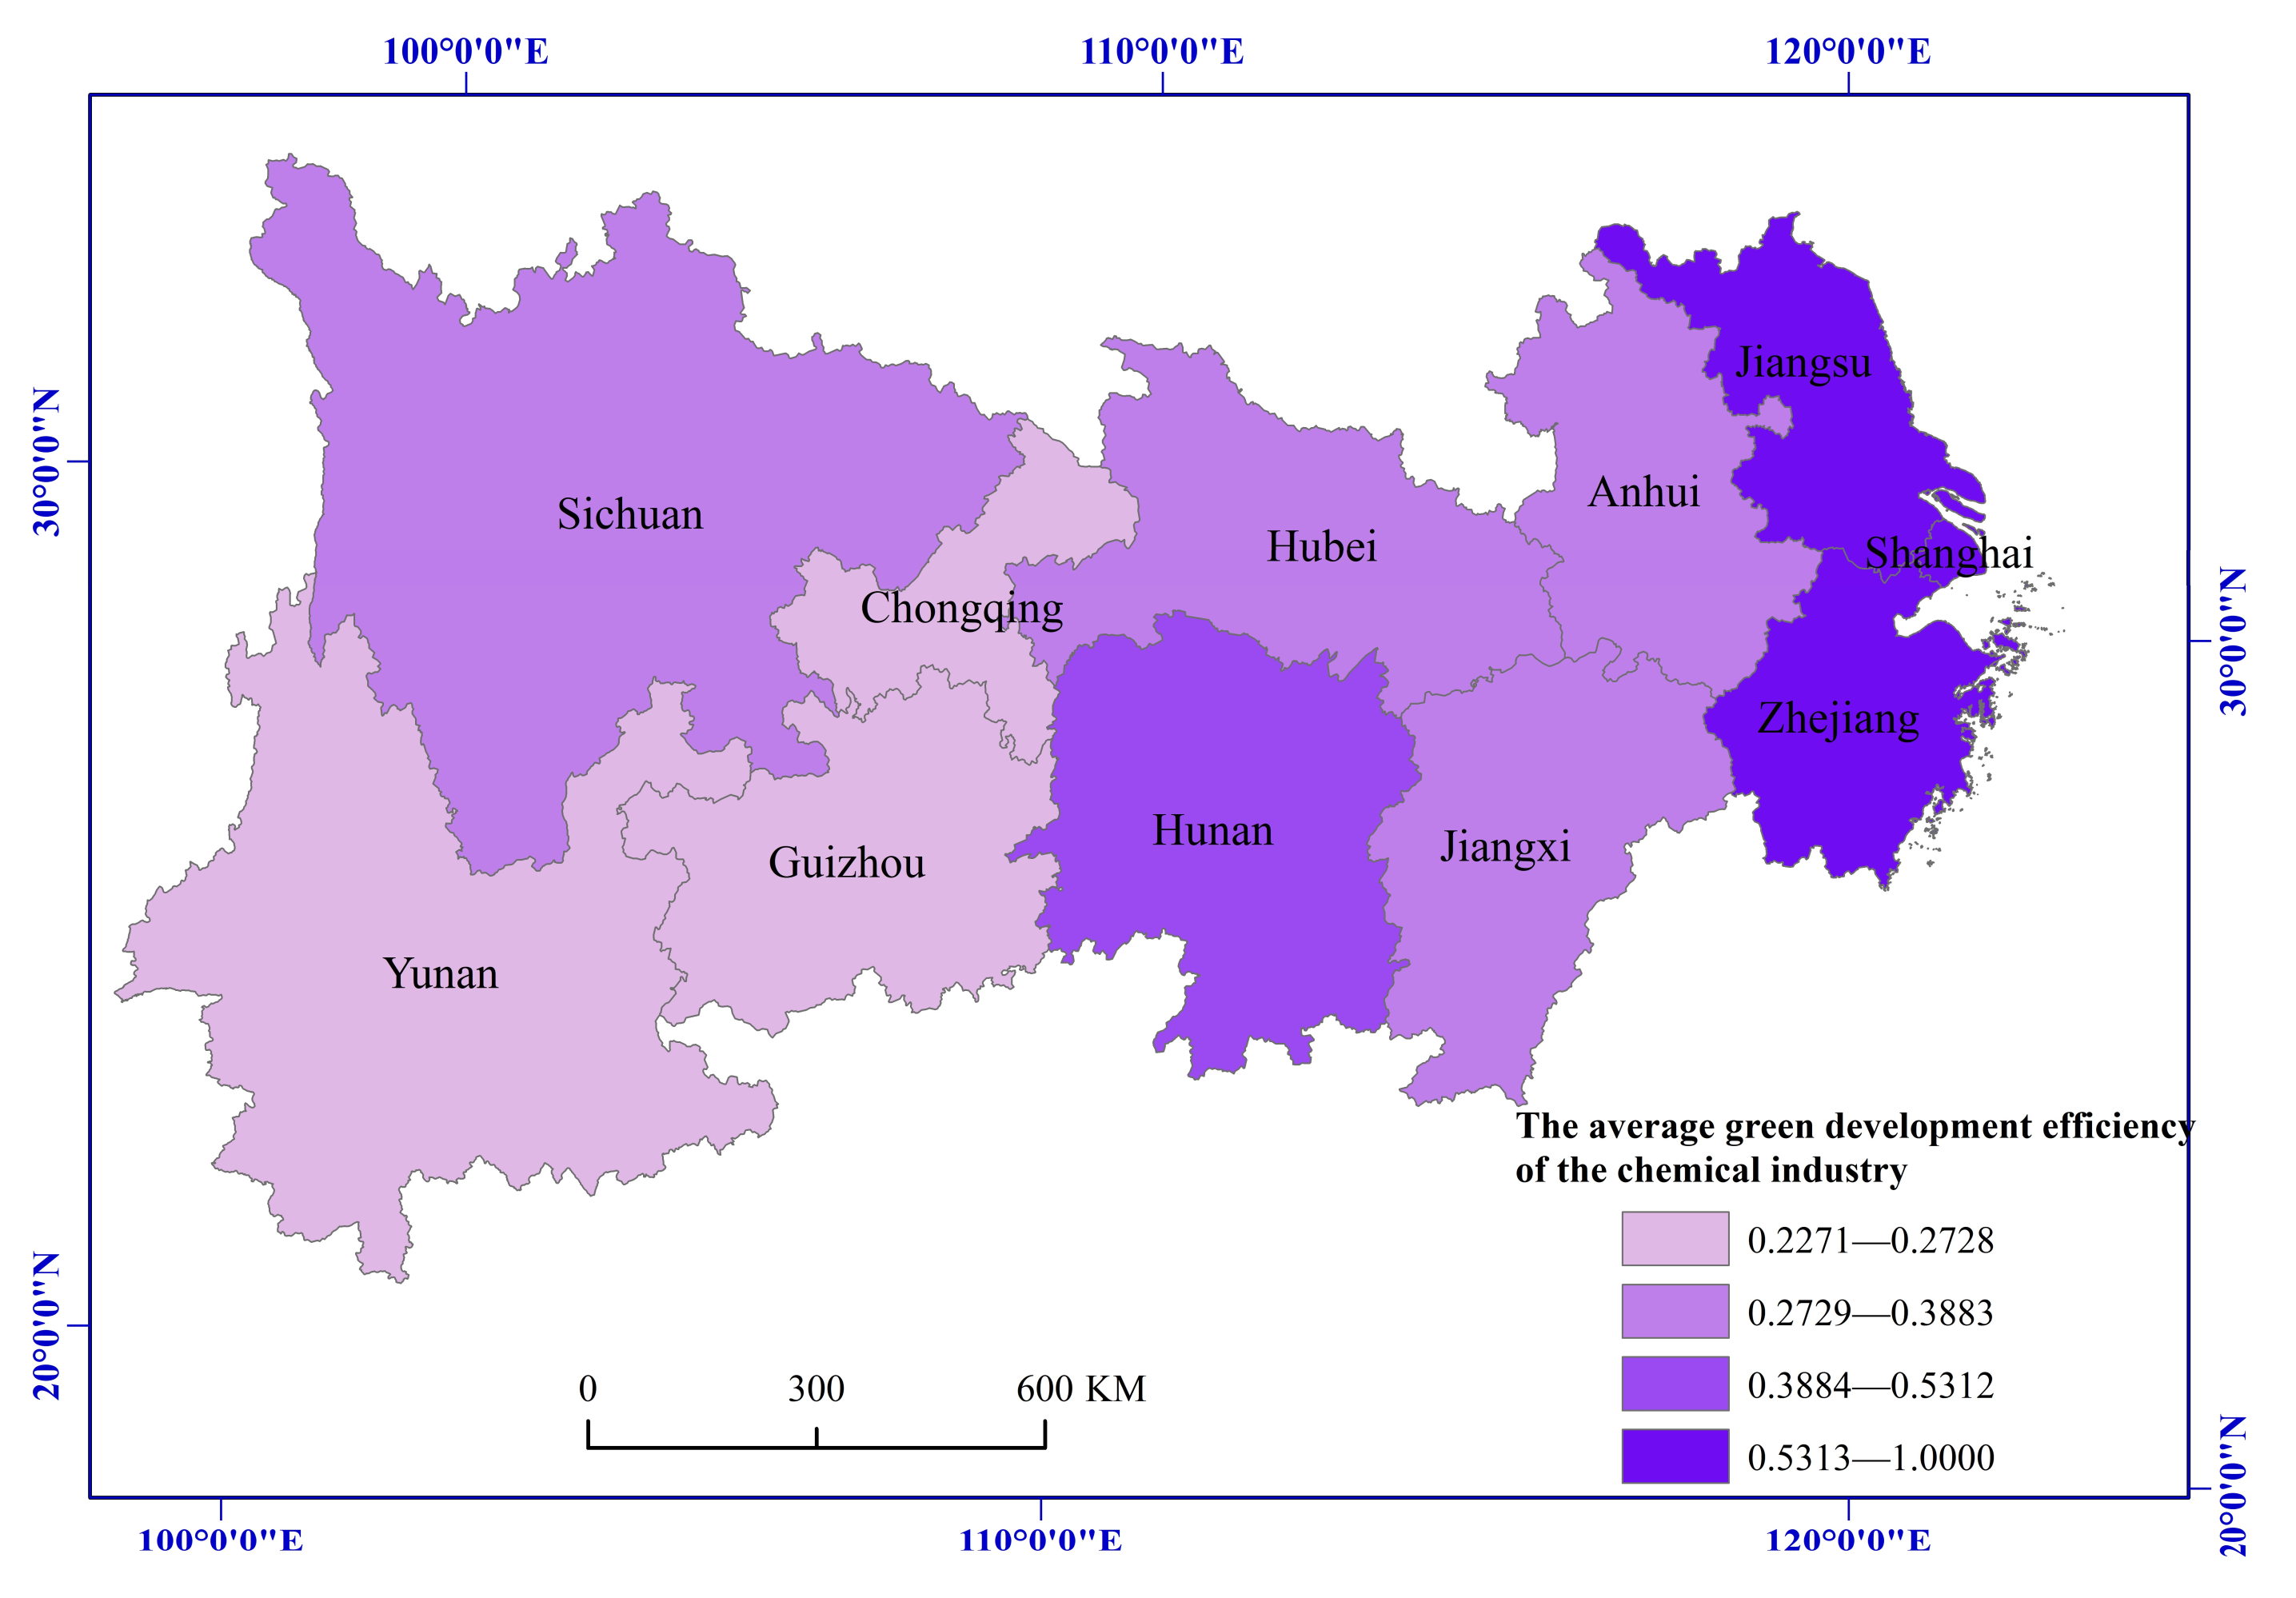
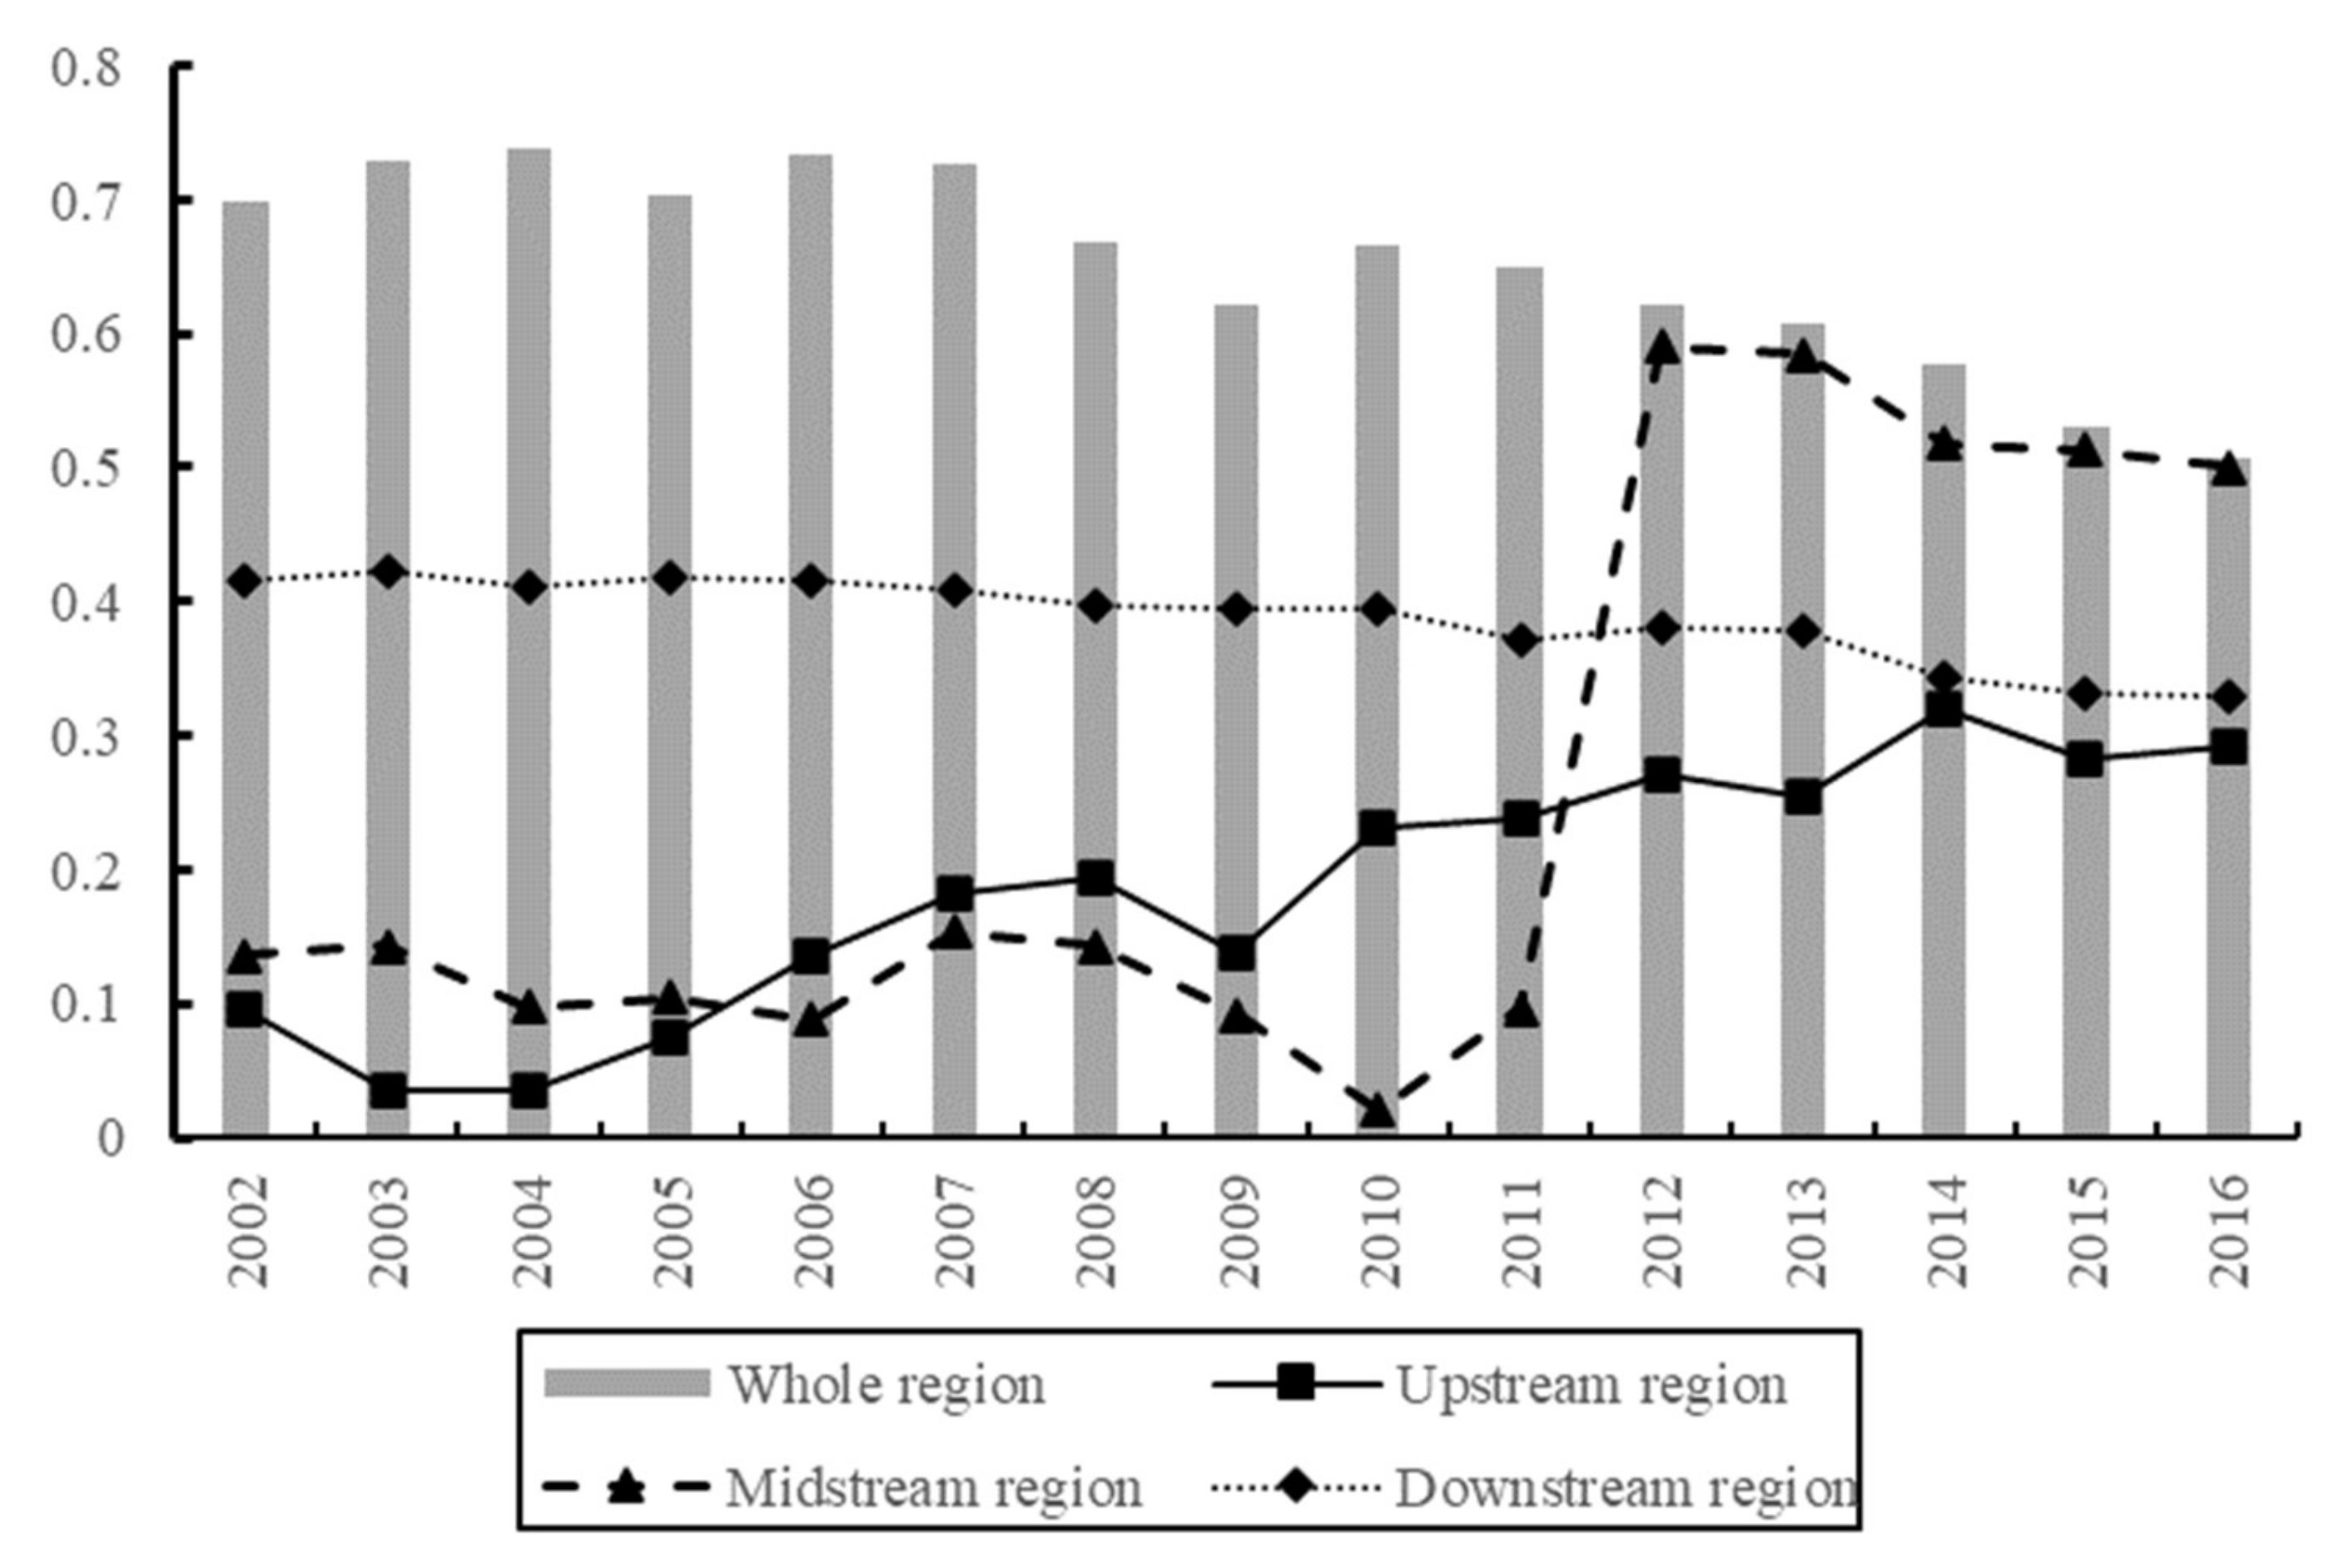
4.2. Spatial and Temporal Evolution of Green Development Efficiency of the Chemical Industry in Yangtze River Economic Belt
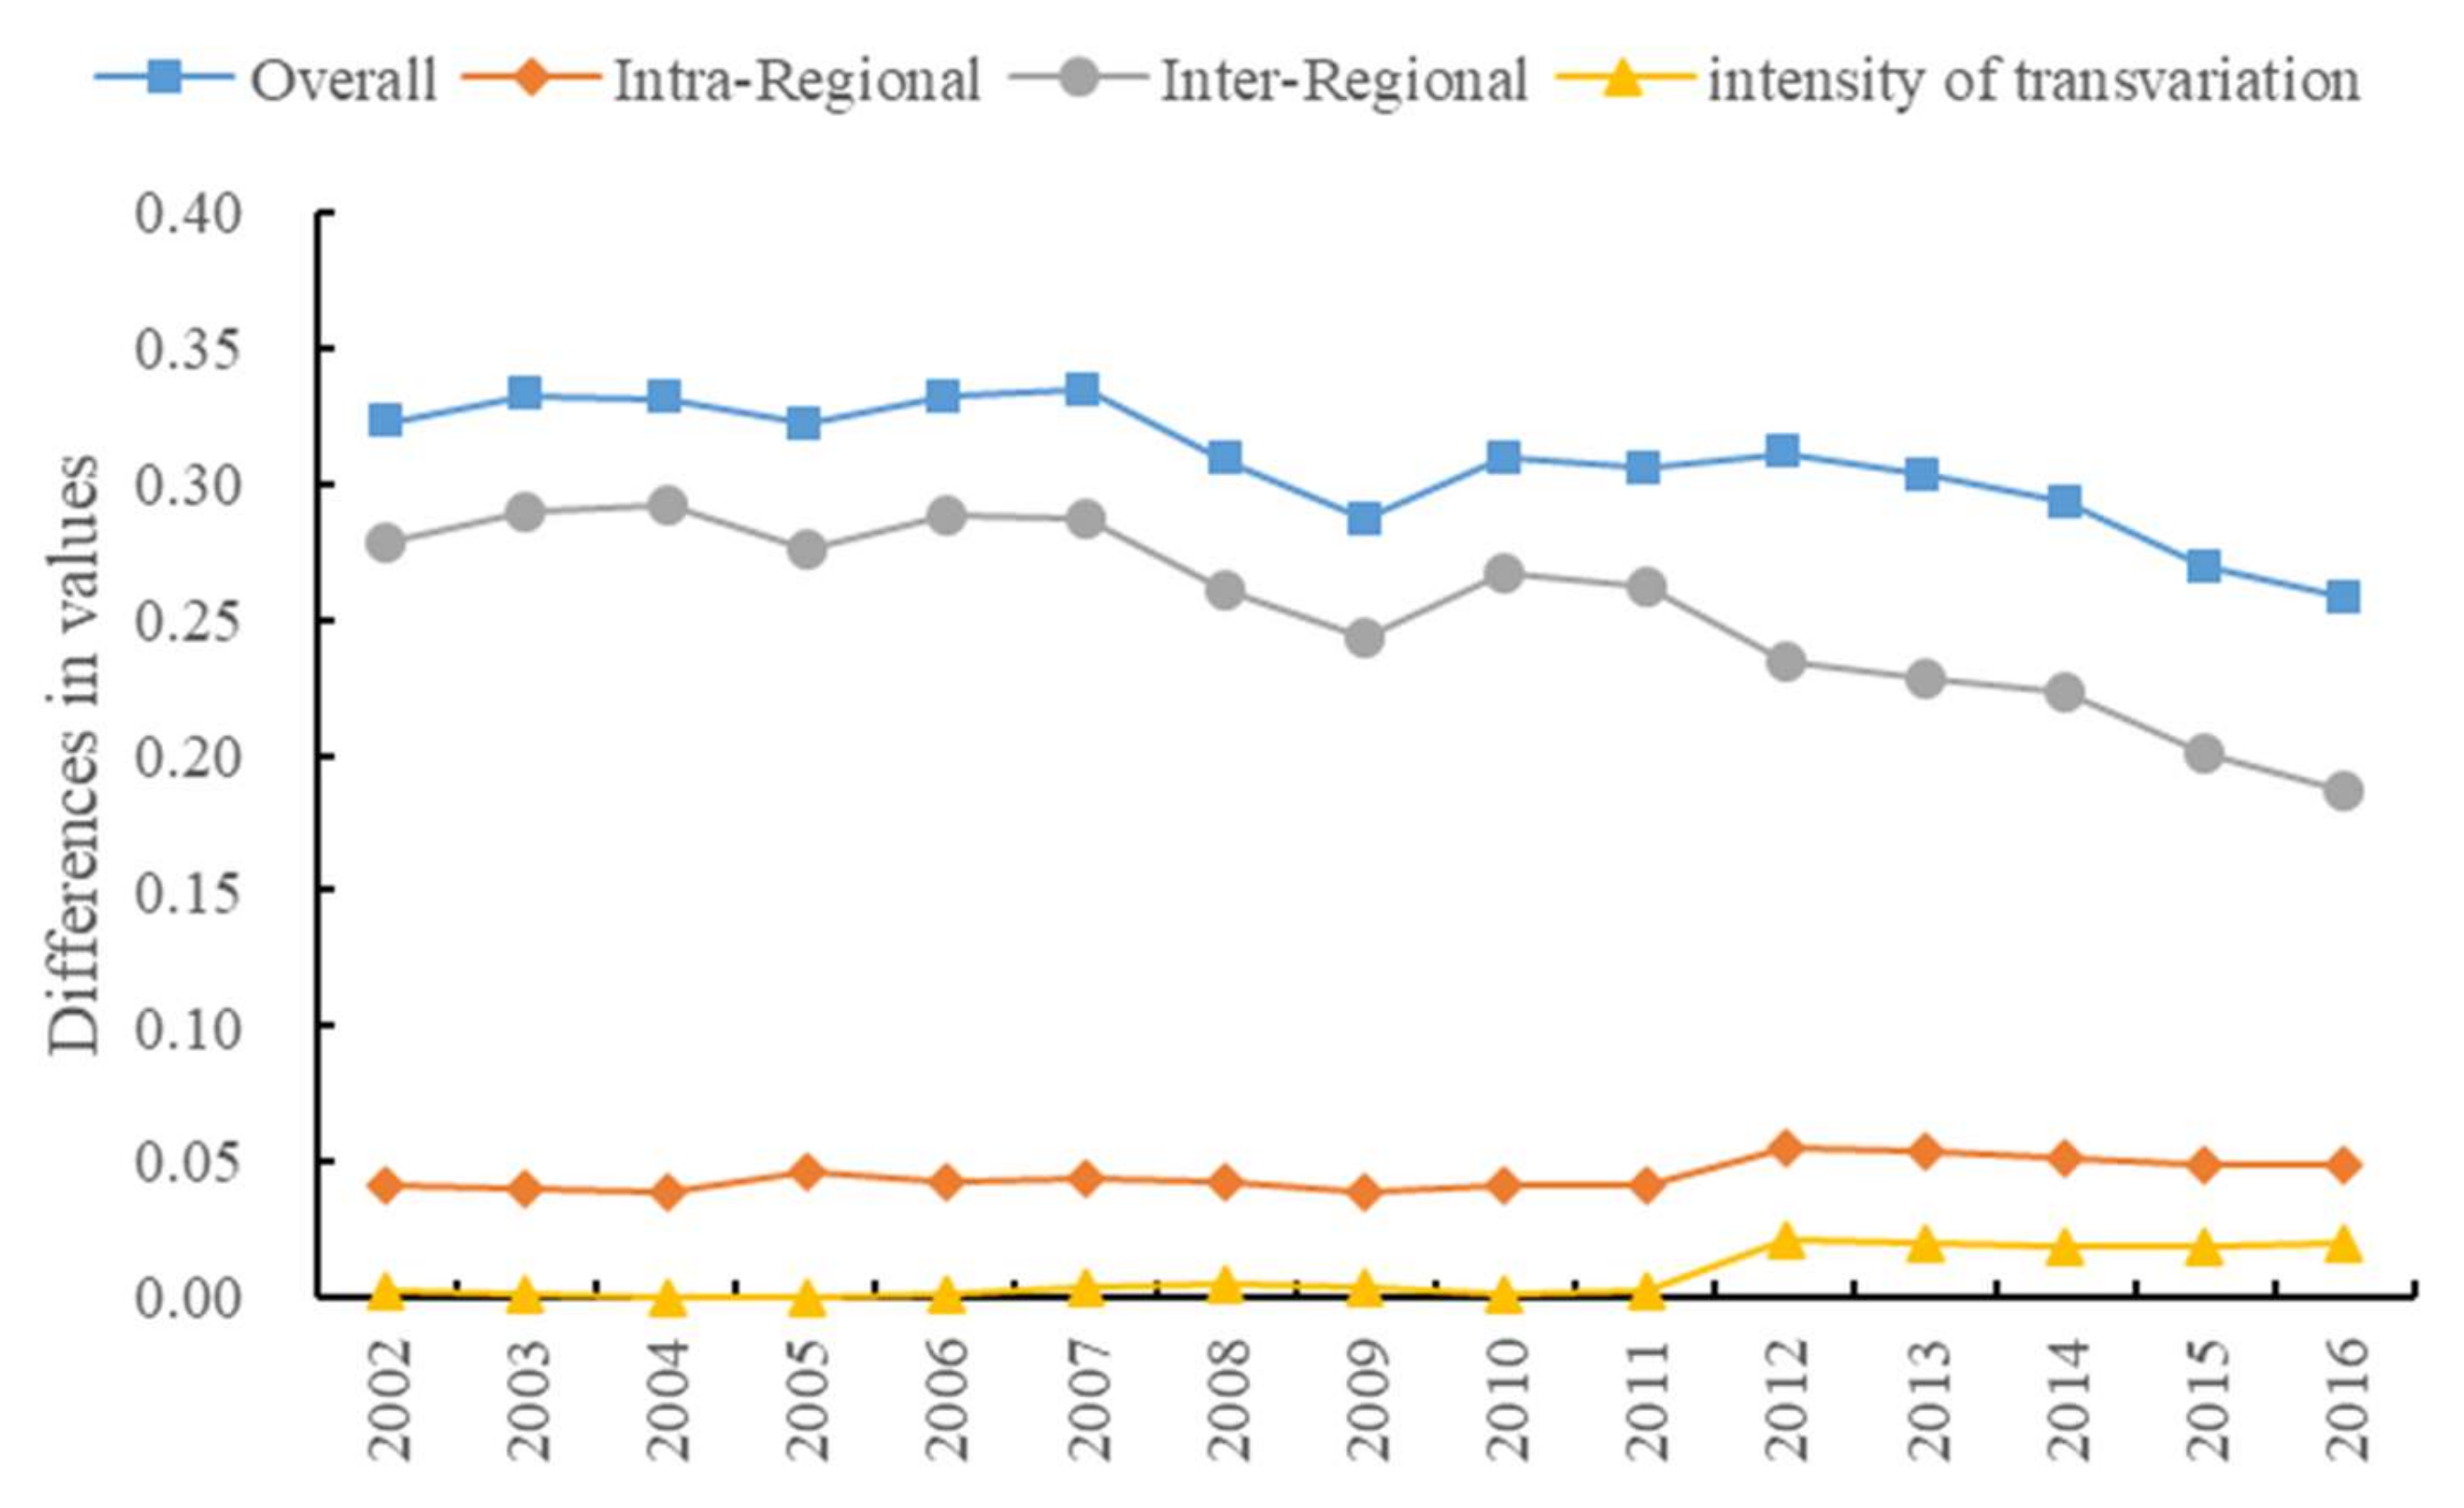
4.3. Regional Difference Analysis of Green Development Efficiency of the Chemical Industry in the Yangtze River Economic Belt
4.3.1. Overall Regional Differences
4.3.2. Intraregional Differences
4.3.3. Differences between Regions
4.3.4. Source of Difference
4.4. Regional Convergence Analysis of Green Development Efficiency of the Chemical Industry in the Yangtze River Economic Belt
4.4.1. σ-Convergence Test
4.4.2. Absolute Convergence of β
5. Discussion
6. Conclusions
Author Contributions
Funding
Institutional Review Board Statement
Informed Consent Statement
Data Availability Statement
Conflicts of Interest
References
- Li, J.; Liang, M.; Zhong, Y. Spatiotemporal pattern and problem area identification of coordinated economic and environmental development in the Yangtze River Economic Belt. Resour. Environ. Yangtze River Basin 2020, 29, 2584–2596. [Google Scholar]
- Liu, L.; Huang, G.; Wang, Z.; Chu, Z.; Li, H. Main problems, situation and Countermeasures of water ecological environment security in the Yangtze River Basin. Environ. Sci. Res. 2020, 33, 1081–1090. [Google Scholar]
- Raza, M.Y.; Lin, B.; Liu, Y. Cleaner production of Pakistan’s chemical industry: Perspectives of energy conservation and emissions reduction. J. Clean. Prod. 2021, 278, 123888. [Google Scholar] [CrossRef]
- Cefic Facts and Figures. Facts And Figures of The European Chemical Industry. Available online: http://www.cefic.org (accessed on 30 January 2020).
- Houming, Z.; Hailin, Q. Study on “Heavy chemical industry encircling the river” in the Yangtze River Economic Belt. Chinas Natl. Cond. Strength 2017, 4, 38–40. [Google Scholar]
- Zhang, Y.; Song, Y.; Zou, H. Transformation of pollution control and green development: Evidence from China’s chemical industry. J. Environ. Manag. 2020, 275, 111246. [Google Scholar] [CrossRef] [PubMed]
- Peiyang, C.; Xigang, Z. China’s regional economic differences based on different scales. J. Geogr. 2012, 67, 1085–1097. [Google Scholar]
- Lyytimaki, J.; Antikainen, R.; Hokkanen, J.; Koskela, S.; Kurppa, S.; Känkänen, R.; Seppälä, Y. Developing Key Indicators of Green Growth. Sustain. Dev. 2018, 26, 51–64. [Google Scholar] [CrossRef]
- Liu, Y.; Yuan, H.; Hu, K. Green development in China: Characteristics, laws, framework methods and evaluation applications. J. Jishou Univ. Soc. Sci. Ed. 2019, 40, 16–28. [Google Scholar]
- Gao, Y. Research on green development performance and its influencing factors of China’s eight comprehensive economic zones. Res. Quant. Econ. Technol. Econ. 2019, 36, 3–23. [Google Scholar]
- Pittman, R.W. Multilateral Productivity Comparisons with Undesirable outputs. Econ. J. 1983, 93, 883–891. [Google Scholar] [CrossRef]
- Chung, Y.H.; Färe, R.; Grosskopf, S. Productivity and undesirable Outputs: A Directional Distance Function Approach. J. Environ. Manag. 1997, 51, 229–240. [Google Scholar] [CrossRef] [Green Version]
- Tone, K. A slacks-based Measure of efficiency in Data Envelopment Analysis. Eur. J. Oper. Res. 2001, 130, 498–509. [Google Scholar] [CrossRef] [Green Version]
- Tone, K. A slacks-based Measure of Super-Efficiency in Data Envelopment Analysis. Eur. J. Oper. Res. 2002, 143, 32–41. [Google Scholar] [CrossRef] [Green Version]
- Tanzil, D.; Beloff, B.R. Assessing impacts: Overview on sustainability indicators and metrics. Environ. Qual. Manag. 2006, 15, 41–56. [Google Scholar] [CrossRef]
- Manello, A. Productivity growth, environmental regulation and win–win opportunities: The case of chemical industry in Italy and Germany. Eur. J. Oper. Res. 2017, 262, 733–743. [Google Scholar] [CrossRef]
- Jiahuey, Y.; Liu, Y.; Yu, Y. Measuring green growth performance of China’s chemical industry, Resources. Conserv. Recycl. 2019, 149, 160–167. [Google Scholar] [CrossRef]
- Honghai, S.; Yanling, X.; Yanqiu, W. Evaluation of relative ecological efficiency of petrochemical industry. Ecol. Econ. 2017, 33, 42–45. [Google Scholar]
- Yaqiong, Y. Research on Enterprise Ecological Efficiency Driven by Value; Beijing University of Chemical Technology: Beijing, China, 2018. [Google Scholar]
- Qiuqin, L.; Meng, Y.; Guangqiu, H. Research on efficiency evaluation of transformation and upgrading of coal chemical enterprises excluding environmental factors. Math. Pract. Underst. 2020, 50, 116–126. [Google Scholar]
- Hoekstra, A.Y.; Chapagain, A.K.; Aldaya, M.M.; Mekonnen, M.M. The Water Footprint Assessment Manual: Setting the Global Standard; Routledge: London, UK, 2011. [Google Scholar]
- Hoekstra, A.Y.; Mekonnen, M.M. The water footprint of humanity. Proc. Natl. Acad. Sci. USA 2011, 109, 3232–3237. [Google Scholar] [CrossRef] [Green Version]
- Caizhi, S.; Xiaodong, Y. Measurement and transfer analysis of grey water footprint of Chinese provinces and industries based on a multi-regional input-output model. Prog. Geogr. 2020, 39, 207–218. [Google Scholar]
- Shengyun, W.; Yajie, H.; Huimin, R.; Jing, L. Performance evaluation and driving effect decomposition of Provincial Ecological Welfare in China. Resour. Sci. 2020, 42, 840–855. [Google Scholar]
- Hui, Z.; Xuejun, D. Spatial pattern evolution and influencing factors of chemical industry along the Yangtze River. Geogr. Res. 2019, 38, 884–897. [Google Scholar]
- Fengqi, Z.; Ning, C. Suggestions on optimizing the layout of chemical industry in the Yangtze River Economic Belt. Environ. Prot. 2016, 44, 25–30. [Google Scholar]
- Qingjun, C.; Xiaofeng, W. Layout analysis and optimization suggestions of chemical industry in the Yangtze River Economic Belt. Chem. Ind. 2018, 36, 5–9. [Google Scholar]
- Yunbo, X.; Shengyun, W.; Chuxiong, D. Spatial differentiation and driving factors of green development efficiency of chemical industry in the Yangtze River Economic Belt. Econ. Geogr. 2021, 41, 108–117. [Google Scholar]
- Xuepeng, J.; Yaya, S.; Yanwei, S.; Danyang, W.; Hao, M.; Shengfeng, L.; Xianjin, H. Temporal and spatial pattern evolution and influencing factors of chemical industry in the Yangtze River Delta from the perspective of admission rate. Geogr. Res. 2020, 39, 1116–1127. [Google Scholar]
- Deming, Z.; Haixia, Z.; Futian, Q. Impact of chemical industry development along the river in Jiangsu on water environment and countermeasures. Reg. Res. Dev. 2006, 1, 54–57. [Google Scholar]
- Yuting, Z.; Yafei, L.; Linyan, D.; Yihan, Y.; Xiaomin, L.; Qihong, S. Environmental risks and Countermeasures of heavy chemical industry in typical basins of the Yangtze River Economic Belt. Environ. Sci. Res. 2020, 33, 1247–1253. [Google Scholar]
- Chuanqing, W.; Yunling, Y. “Hubei sample” and “Jiangsu sample” to solve the problem of “Chemical industry encircling the river”. West Forum. 2020, 30, 71–83. [Google Scholar]
- Xinling, D.; Yueyou, Z. Industrial division, environmental pollution and regional economic development—An Empirical Study Based on the heavy chemical industry in the Yangtze River Economic Belt. Econ. Longit. Latit. 2020, 37, 20–28. [Google Scholar]
- Yang, L.; Jianliang, Y.; Yuan, L. Efficiency evaluation and equilibrium characteristics of green development of China’s urban agglomeration. Econ. Geogr. 2019, 39, 110–117. [Google Scholar]
- Chuanming, L.; Huitong, W.; Xiaomin, W. Research on regional difference decomposition and convergence of Internet financial development in China’s eight urban agglomerations. Quant. Econ. Tech. Econ. Res. 2017, 34, 3–20. [Google Scholar]
- Shuai, L. Regional differences and stochastic convergence of China’s economic growth quality. Res. Quant. Econ. Tech. Econ. 2019, 36, 24–41. [Google Scholar]
- Yuanyi, H. Study on Distribution Characteristics and Driving Factors of Heavy Metal Gray Water Footprint in Industrial Wastewater in China; Beijing University of Science and Technology: Beijing, China, 2020. [Google Scholar]
- Xiang, C.; Xu, X. Study on the dynamic evolution and influencing factors of regional differences in circular economy efficiency of China’s industrial industry—An Empirical Study from papermaking and paper products industry. China Soft Sci. 2015, 1, 160–171. [Google Scholar]
- Min, S.; Kaijie, S.; Yanxia, M.; Ang, L. Calculation and analysis of grey water footprint of industries in the Yangtze River Economic Belt Based on input-output table. Resour. Ind. 2021, 23, 13–22. [Google Scholar] [CrossRef]
- Tianbo, F.; Changxin, X.; Lihua, Y.; Siyu, H.; Qing, X. Measurement and driving factors of grey water footprint efficiency in Yangtze River Basin. Sci. Total Environ. 2022, 802, 149587. [Google Scholar]
- Chen, J.; Wang, J.; Fan, Y. Study on temporal and spatial differences and influencing factors of industrial ecological efficiency in the Yangtze River Economic Belt. J. Henan Univ. Sci. Technol. Soc. Sci. Ed. 2021, 39, 39–46. [Google Scholar]
- Shaohong, C.; Gucheng, Z.Z. Measurement of green development level and temporal and spatial evolution characteristics of the Yangtze River Economic Belt. Econ. Manag. East China 2021, 35, 25–34. [Google Scholar] [CrossRef]


| Index | Variable | Variable Declaration | |
|---|---|---|---|
| Input index | Human input | Average annual number of employees in chemical industry (10,000) | |
| Capital input | Net fixed assets of chemical industry (100 million CNY) | ||
| Energy input | Total energy consumption of chemical industry (ten thousand tec) | ||
| Water input | Chemical industry water consumption (100 million m3) | ||
| Output index | Expected output | Chemical industry output value | Sales output value of chemical industry (100 million CNY) |
| Unexpected output | Water pollution | Chemical industry grey water footprint (billion m3) | |
| 2002 | 2004 | 2006 | 2008 | 2010 | 2012 | 2014 | 2016 Year | Average | |
|---|---|---|---|---|---|---|---|---|---|
| Guizhou | 0.2809 | 0.2351 | 0.2131 | 0.2176 | 0.1984 | 0.1916 | 0.1973 | 0.2612 | 0.2271 |
| Sichuan | 0.2390 | 0.2538 | 0.2836 | 0.3366 | 0.3461 | 0.3634 | 0.4109 | 0.4922 | 0.3387 |
| Yunnan | 0.2243 | 0.2401 | 0.2581 | 0.3114 | 0.2640 | 0.2395 | 0.2422 | 0.2916 | 0.2569 |
| Chongqing | 0.2508 | 0.2370 | 0.2204 | 0.2526 | 0.2517 | 0.2742 | 0.3041 | 0.3918 | 0.2728 |
| Hubei | 0.3794 | 0.3117 | 0.3173 | 0.3687 | 0.3447 | 0.4368 | 0.4817 | 0.5043 | 0.3883 |
| Hunan | 0.2938 | 0.2609 | 0.2718 | 0.3177 | 0.3363 | 1.0000 | 1.0000 | 1.0000 | 0.5312 |
| Jiangxi | 0.3132 | 0.2679 | 0.2746 | 0.2770 | 0.3506 | 0.3521 | 0.4005 | 0.4052 | 0.3273 |
| Anhui | 0.3129 | 0.3177 | 0.3099 | 0.3357 | 0.3410 | 0.3593 | 0.4124 | 0.4346 | 0.3512 |
| Jiangsu | 1.0000 | 1.0000 | 1.0000 | 1.0000 | 1.0000 | 1.0000 | 1.0000 | 1.0000 | 0.9860 |
| Shanghai | 1.0000 | 1.0000 | 1.0000 | 1.0000 | 1.0000 | 1.0000 | 1.0000 | 1.0000 | 1.0000 |
| Zhejiang | 1.0000 | 1.0000 | 1.0000 | 1.0000 | 1.0000 | 1.0000 | 1.0000 | 1.0000 | 1.0000 |
| Upstream area | 0.2488 | 0.2415 | 0.2438 | 0.2795 | 0.2650 | 0.2672 | 0.2886 | 0.3592 | 0.2739 |
| Midstream area | 0.3288 | 0.2802 | 0.2879 | 0.3211 | 0.3438 | 0.5963 | 0.6274 | 0.6365 | 0.4156 |
| Downstream area | 0.8282 | 0.8294 | 0.8275 | 0.8339 | 0.8352 | 0.8398 | 0.8531 | 0.8586 | 0.8343 |
| Whole area | 0.4813 | 0.4658 | 0.4681 | 0.4925 | 0.4939 | 0.5652 | 0.5863 | 0.6164 | 0.5163 |
| Year | Overall G | Inter Group | Between Groups | Hypervariable Density | Upstream | Midstream | Downstream | Midstream– Upstream | Downstream– Upstream | Downstream– Midstream |
|---|---|---|---|---|---|---|---|---|---|---|
| 2002 | 0.3224 | 0.0415 | 0.2786 | 0.0023 | 0.0456 | 0.0579 | 0.1556 | 0.1386 | 0.5380 | 0.4413 |
| 2003 | 0.3327 | 0.0408 | 0.2900 | 0.0019 | 0.0151 | 0.0597 | 0.1588 | 0.1264 | 0.5540 | 0.4677 |
| 2004 | 0.3312 | 0.0392 | 0.2921 | 0.0000 | 0.0153 | 0.0403 | 0.1542 | 0.0741 | 0.5490 | 0.4950 |
| 2005 | 0.3220 | 0.0463 | 0.2753 | 0.0003 | 0.0350 | 0.0419 | 0.1829 | 0.0831 | 0.5239 | 0.4621 |
| 2006 | 0.3321 | 0.0426 | 0.2885 | 0.0010 | 0.0638 | 0.0351 | 0.1564 | 0.0894 | 0.5448 | 0.4849 |
| 2007 | 0.3347 | 0.0446 | 0.2867 | 0.0034 | 0.0832 | 0.0679 | 0.1531 | 0.1058 | 0.5411 | 0.4848 |
| 2008 | 0.3089 | 0.0435 | 0.2605 | 0.0049 | 0.0930 | 0.0634 | 0.1494 | 0.1006 | 0.4980 | 0.4487 |
| 2009 | 0.2869 | 0.0389 | 0.2438 | 0.0042 | 0.0610 | 0.0405 | 0.1484 | 0.1051 | 0.4767 | 0.4070 |
| 2010 | 0.3093 | 0.0412 | 0.2672 | 0.0010 | 0.1074 | 0.0092 | 0.1479 | 0.1325 | 0.5188 | 0.4187 |
| 2011 | 0.3054 | 0.0414 | 0.2615 | 0.0025 | 0.1148 | 0.0381 | 0.1394 | 0.1211 | 0.5045 | 0.4253 |
| 2012 | 0.3110 | 0.0551 | 0.2345 | 0.0215 | 0.1287 | 0.2414 | 0.1430 | 0.3834 | 0.5178 | 0.2529 |
| 2013 | 0.3029 | 0.0541 | 0.2280 | 0.0208 | 0.1227 | 0.2369 | 0.1420 | 0.3654 | 0.5024 | 0.2503 |
| 2014 | 0.2933 | 0.0517 | 0.2228 | 0.0188 | 0.1522 | 0.2123 | 0.1291 | 0.3717 | 0.4944 | 0.2264 |
| 2015 | 0.2691 | 0.0494 | 0.2003 | 0.0194 | 0.1332 | 0.2122 | 0.1241 | 0.3174 | 0.4421 | 0.2233 |
| 2016 | 0.2577 | 0.0493 | 0.1875 | 0.0209 | 0.1380 | 0.2077 | 0.1235 | 0.2931 | 0.4160 | 0.2194 |
| Variable | Whole Region | Upstream Region | Midstream Region | Downstream Region |
|---|---|---|---|---|
| β | −0.1734 *** | −0.2545 ** | −0.1806 ** | −0.2691 |
| (−4.43) | (−3.86) | (−7.13) | (−0.92) | |
| Constant term | −0.1996 *** | −0.4009 ** | −0.2761 ** | −0.0877 |
| (−5.31) | (−4.46) | (−9.73) | (−1.31) | |
| R2 | 0.0736 | 0.3676 | 0.4548 | 0.1027 |
| Convergence rate | 0.0127% | 0.0196% | 0.0132% | - |
| Variable | Whole Region | Upstream Region | Midstream Region | Downstream Region |
|---|---|---|---|---|
| β | −0.1564 *** | −0.2476 | −0.1920 ** | −0.3976 |
| (−3.61) | (−1.25) | (−8.18) | (−1.41) | |
| Environmental regulation | −37.6551 ** | −11.4104 * | −51.8642 | −30.9161 |
| (−3.04) | (−2.43) | (−1.00) | (−1.01) | |
| Industrial structure | 0.3754 | −0.4512 | 1.5735 | 0.3231 |
| (1.53) | (−1.93) | (1.02) | (2.01) | |
| Foreign capital intensity | 0.8206 | 7.6279 ** | −5.4985 | 0.9576 |
| (1.26) | (4.49) | (−0.65) | (2.04) | |
| Science and technology | 1.7491 ** | 6.4771 | 2.5444 | 1.8611 |
| (2.89) | (1.08) | (0.99) | (1.30) | |
| Constant term | −0.3230 *** | −0.3667 | −0.6851 | −0.3956 |
| (−3.72) | (−1.79) | (−1.44) | (−2.28) | |
| R2 | 0.0250 | 0.0854 | 0.1260 | 0.0748 |
| Convergence rate | 0.0113% | - | 0.0142% | - |
Publisher’s Note: MDPI stays neutral with regard to jurisdictional claims in published maps and institutional affiliations. |
© 2022 by the authors. Licensee MDPI, Basel, Switzerland. This article is an open access article distributed under the terms and conditions of the Creative Commons Attribution (CC BY) license (https://creativecommons.org/licenses/by/4.0/).
Share and Cite
Xiang, Y.; Shao, W.; Wang, S.; Zhang, Y.; Zhang, Y. Study on Regional Differences and Convergence of Green Development Efficiency of the Chemical Industry in the Yangtze River Economic Belt Based on Grey Water Footprint. Int. J. Environ. Res. Public Health 2022, 19, 1703. https://doi.org/10.3390/ijerph19031703
Xiang Y, Shao W, Wang S, Zhang Y, Zhang Y. Study on Regional Differences and Convergence of Green Development Efficiency of the Chemical Industry in the Yangtze River Economic Belt Based on Grey Water Footprint. International Journal of Environmental Research and Public Health. 2022; 19(3):1703. https://doi.org/10.3390/ijerph19031703
Chicago/Turabian StyleXiang, Yunbo, Wen Shao, Shengyun Wang, Yong Zhang, and Yaxin Zhang. 2022. "Study on Regional Differences and Convergence of Green Development Efficiency of the Chemical Industry in the Yangtze River Economic Belt Based on Grey Water Footprint" International Journal of Environmental Research and Public Health 19, no. 3: 1703. https://doi.org/10.3390/ijerph19031703
APA StyleXiang, Y., Shao, W., Wang, S., Zhang, Y., & Zhang, Y. (2022). Study on Regional Differences and Convergence of Green Development Efficiency of the Chemical Industry in the Yangtze River Economic Belt Based on Grey Water Footprint. International Journal of Environmental Research and Public Health, 19(3), 1703. https://doi.org/10.3390/ijerph19031703


