
222Rn and 226Ra Concentrations in Spring Water and Their Dose Assessment Due to Ingestion Intake

 , ,
, ,  ,
,  , , , and
Abstract
:1. Introduction
2. Materials and Methods
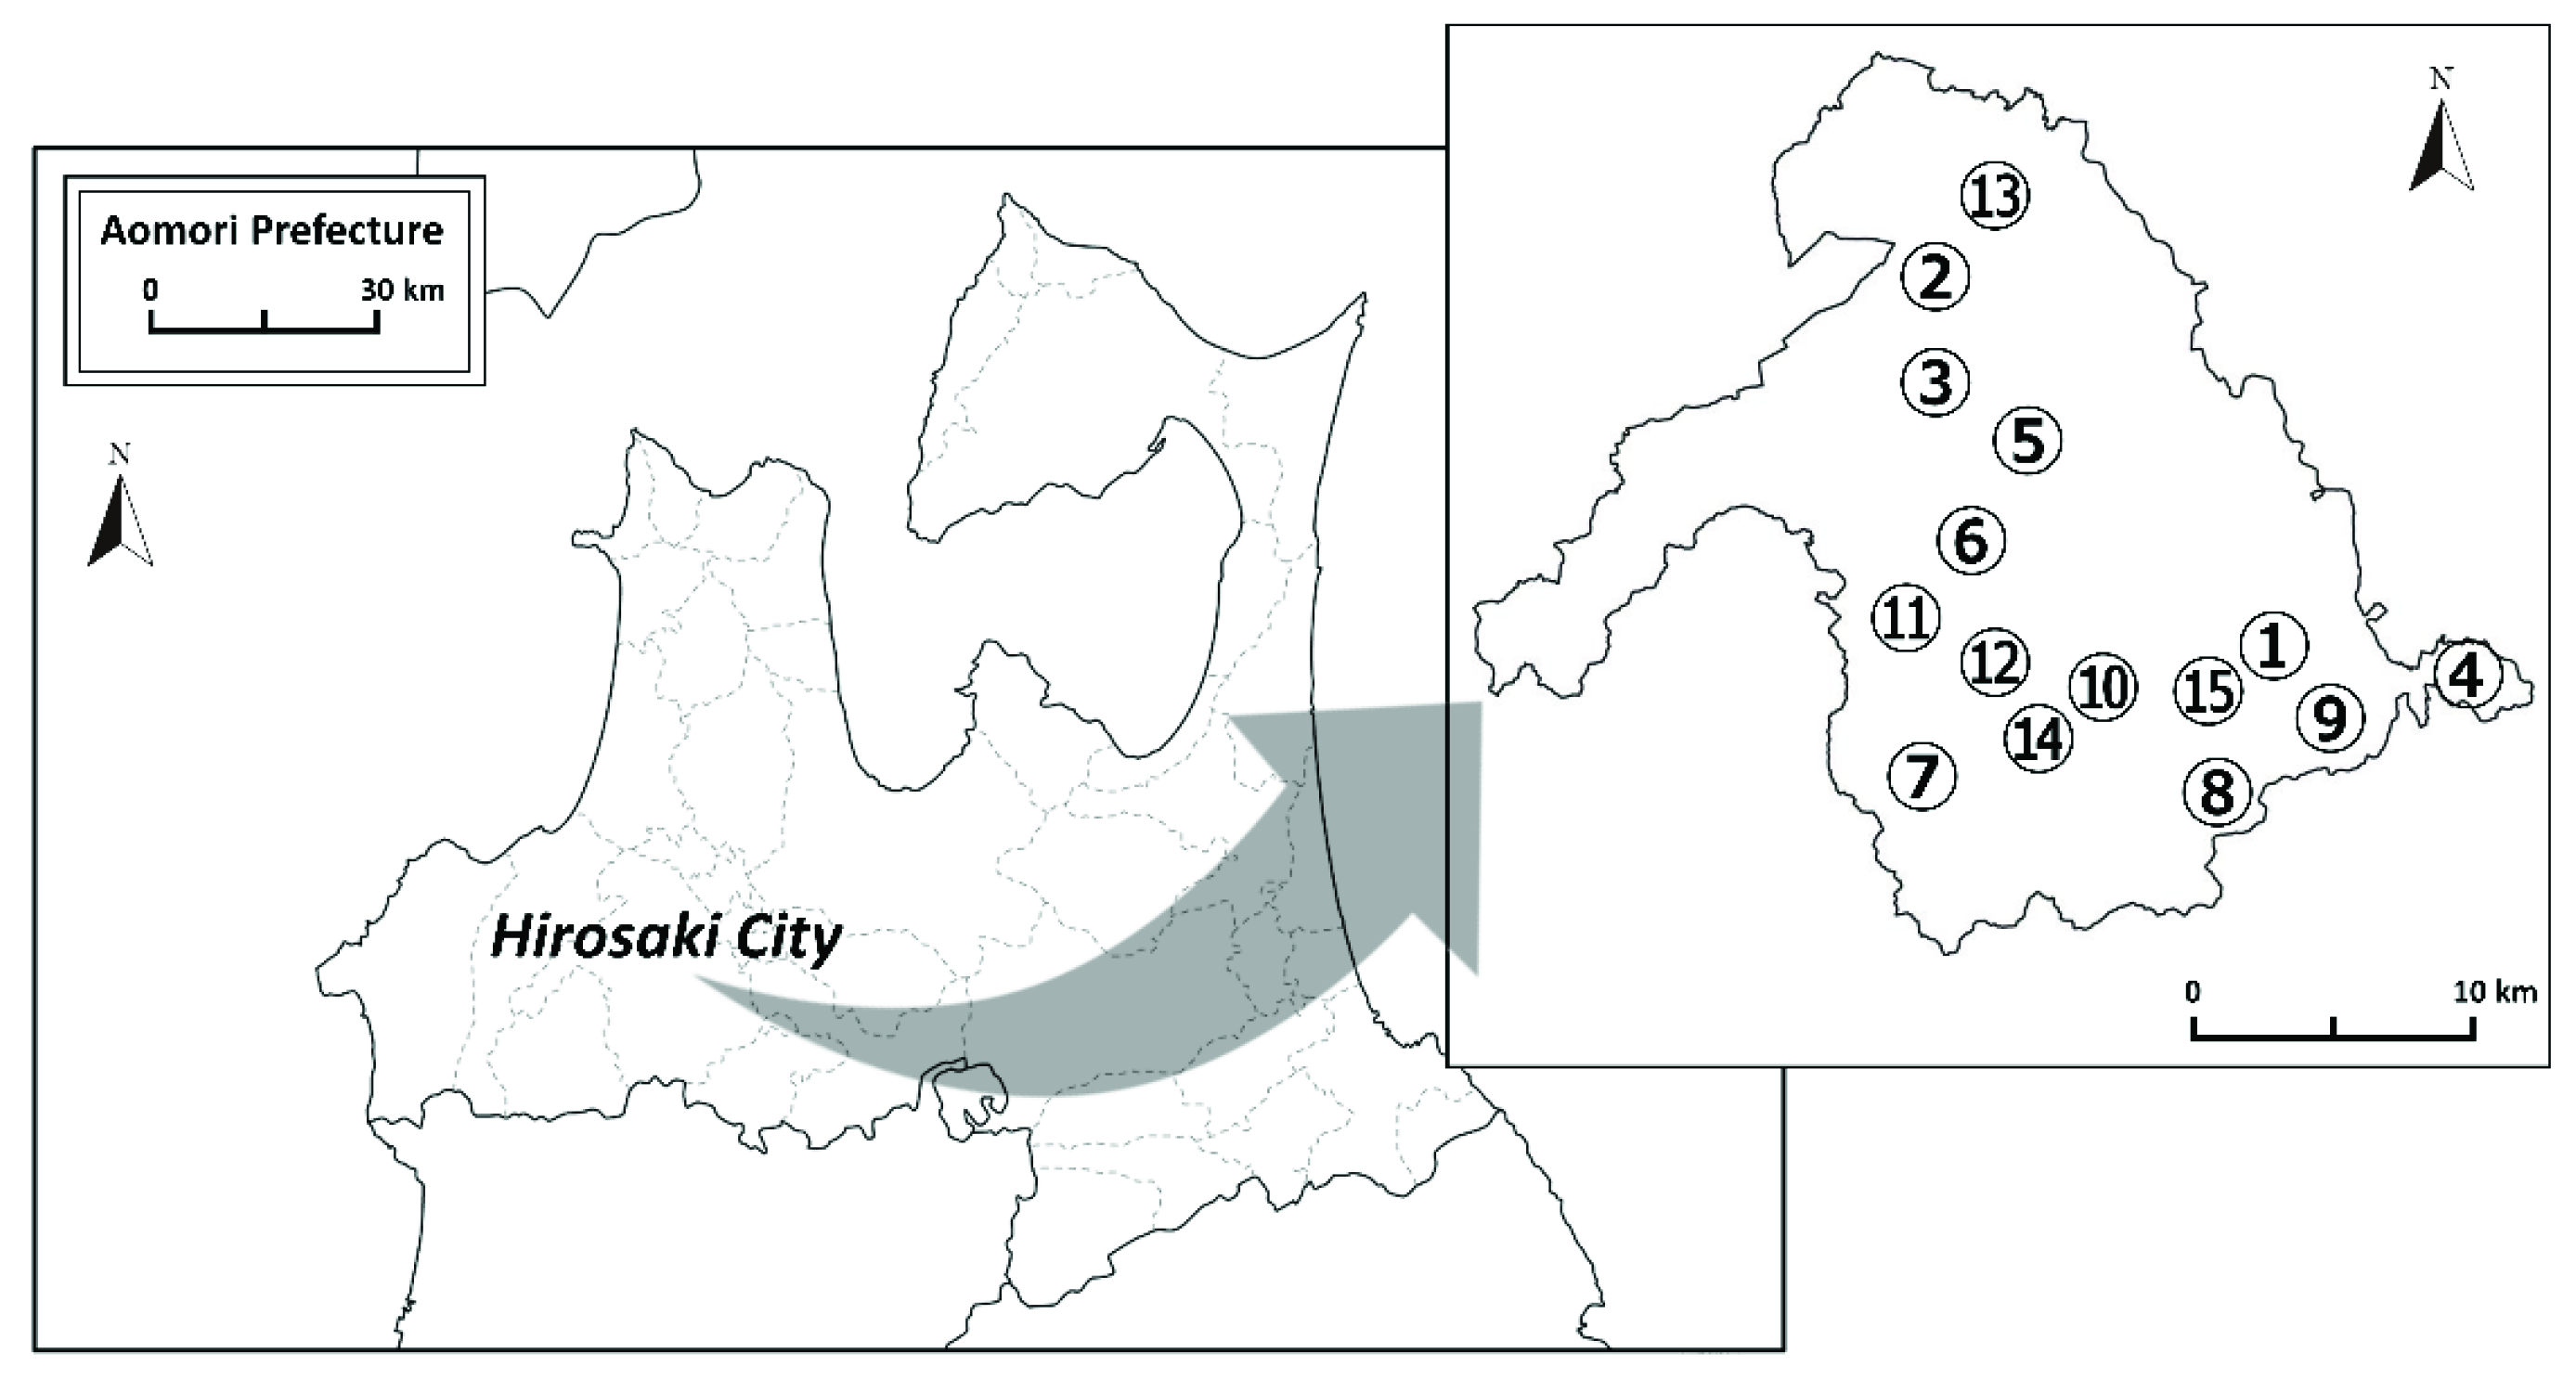
2.1. Water Sampling
2.2. 222Rn in Water Measurement
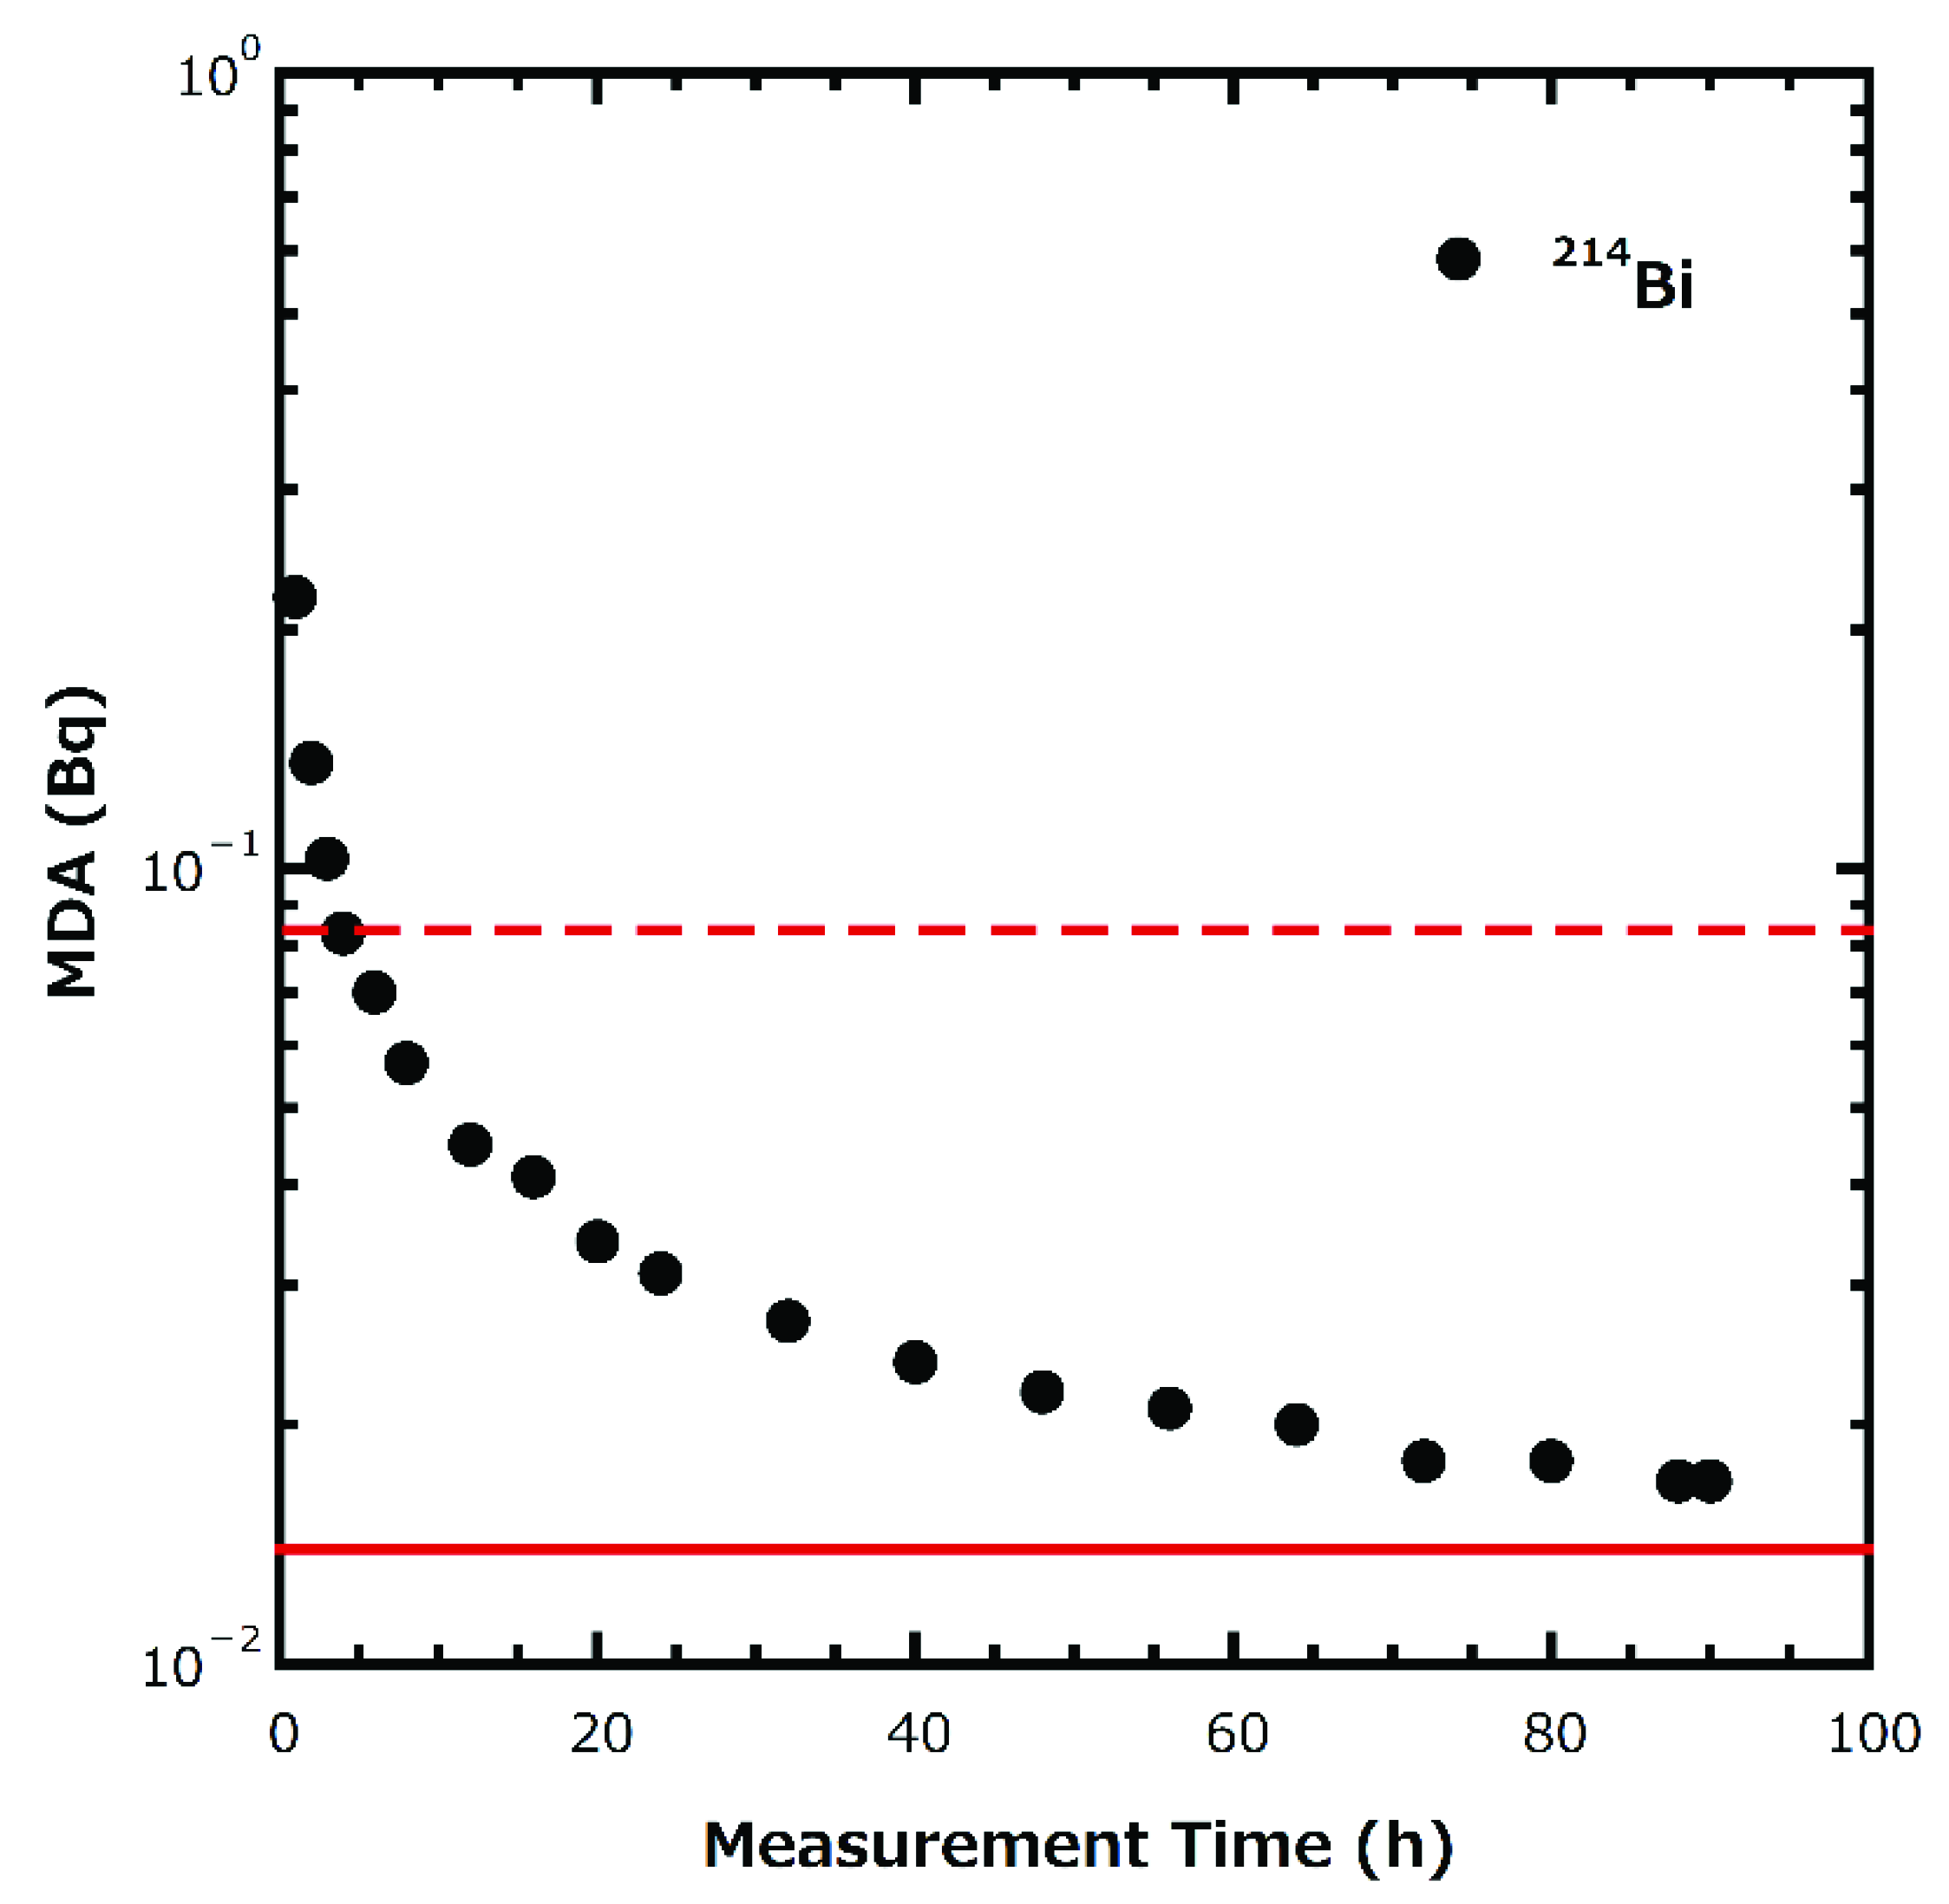
2.3. 226Ra in Water Measurement
2.4. Dose Assessment
3. Results
3.1. Water Quality and Radioactive Concentration of Sampling Water
3.2. Dose Assessment Due to Ingestion
4. Discussion
5. Conclusions
Author Contributions
Funding
Institutional Review Board Statement
Informed Consent Statement
Data Availability Statement
Conflicts of Interest
References
- World Health Organization (WHO). WHO Handbook on Indoor Radon; WHO Press: Geneva, Switzerland, 2009; pp. 1–94. [Google Scholar]
- Tomita, J. Radium isotopes in saline groundwaters. J. Hot Spring Sci. 2014, 64, 252–266, (In Japanese with English abstract). [Google Scholar]
- Narazaki, Y. The feature and distribution of radon concentration in groundwater in Fukuoka Prefecture. Radioisotopes 2005, 54, 407–415. (In Japanese) [Google Scholar] [CrossRef]
- Trautmannsheimer, M.; Schindlmeier, W.; Hübel, K. Radon exposure levels of the staff in the drinking water supply facilities in Bavaria, Germany. Int. Congr. Ser. 2002, 1225, 81–86. [Google Scholar] [CrossRef]
- Abdallah, S.M.; Habib, R.R.; Nuwayhid, R.Y.; Chatila, M.; Katul, G. Radon measurements in well and spring water in Lebanon. Radiat. Meas. 2007, 42, 298–303. [Google Scholar] [CrossRef]
- Le, C.H.; Huynh, N.P.T.; Nguyen, V.T.; Le, Q.B. Radon and radium concentrations in drinkable water supplies of the Thu Duc region in Ho Chi Minh City, Vietnam. Appl. Radiat. Isot. 2015, 105, 219–224. [Google Scholar] [CrossRef] [PubMed]
- Fonollosa, E.; Peñalver, A.; Borrull, F.; Aguilar, C. Radon in spring waters in the south of Catalonia. J. Environ. Radioact. 2016, 151, 275–281. [Google Scholar] [CrossRef]
- Hosoda, M.; Nugraha, E.D.; Akata, N.; Yamada, R.; Tamakuma, Y.; Sasaki, M.; Kelleher, K.; Yoshinaga, S.; Suzuki, T.; Rattanapongs, C.P.; et al. A unique high natural background radiation area–Dose assessment and perspectives. Sci. Total Environ. 2021, 750, 142346. [Google Scholar] [CrossRef] [PubMed]
- List of Classifications. Available online: https://monographs.iarc.who.int/list-of-classifications (accessed on 5 December 2021).
- Environmental Protection Agency. National Primary Drinking Water Regulations. Radionuclides; Proposed Rule; In Federal Register; Federal Information Center: New Orleans, LA, USA, 1991; Volume 56, p. 33051. [Google Scholar]
- National Research Council (NRC). Risk Assessment of Radon in Drinking Water; National Academies Press (US): Washington, DC, USA, 1999; p. 76. [Google Scholar]
- Japanese Society of Health Physics (JHPS) Planning Committee. Japanese Society of Health Physics Task Group Report Series; Japanese Society of Health Physics: Tokyo, Japan, 2004; Volume 2, pp. 1–113. (In Japanese) [Google Scholar]
- World Health Organization (WHO). Guidelines for Drinking-Water Quality, 4th ed.; World Health Organization: Geneva, Switzerland, 2017; pp. 1–541. [Google Scholar]
- The Council of the European Union. Council of the European Union. Council Directive 2013/51/Euratom of 22 October 2013 Laying Down Requirements for the Protection of the Health of the General Public with Regard to Radioactive Substances in Water Intended for Human Consumption. In Official Journal of the European Union; Publication Office of the European Union: Luxembourg, 2013; Volume 56, pp. 12–21. [Google Scholar]
- Environmental Protection Agency. National Primary Drinking Water Regulations. Radionuclides; Notice of Data Availability; Proposed Rule; In Federal Register; Federal Information Center: New Orleans, LA, USA, 2000; Volume 65, pp. 21583–21584. [Google Scholar]
- Yasuoka, Y.; Shinogi, M. Determination of radon concentrations in natural water in the Rokko area (Japan) and evaluation of its effective dose. Radioisotopes 2000, 49, 551–557. [Google Scholar] [CrossRef]
- Tomita, J.; Zhang, J.; Yamamoto, M. Radium isotopes (226Ra and 228Ra) in Na–Cl type groundwaters from Tohoku District (Aomori, Akita and Yamagata Prefectures) in Japan. J. Environ. Radioact. 2014, 137, 204–212. [Google Scholar] [CrossRef]
- Nemoto, N.; Ujiie, Y. Geology of Aomori Prefecture. In Daichi; Takano, K., Shouji, A., Eds.; Tohoku Geotechnical Consultants Association: Miyagi, Japan, 2009; pp. 52–68, (In Japanese). Available online: https://tohoku-geo.ne.jp/information/daichi/img/50a/52.pdf (accessed on 18 January 2022).
- Kogawa, K. Chapter 1 Nature of Tsugaru. In A New Version of History of Hirosaki City (Shinpen Hirosaki-Shishi); Editorial board of “A new version of history of Hirosaki City”, Ed.; Hirosaki City Office: Aomori, Japan, 2001; pp. 111–147, (In Japanese). Available online: https://trc-adeac.trc.co.jp/WJ11D0/WJJS05U/0220205100/0220205100100000?dtl=all (accessed on 19 January 2022).
- Seamless Digital Geological Map of Japan V2 (Geological Survey of Japan, National Institute of Advanced Industrial Science and Technology). Available online: https://gbank.gsj.jp/seamless/index_en.html (accessed on 19 January 2022).
- “Meisui-100-sen” (100 Best Waters) Certified by the Ministry of the Environment in 1985. (In Japanese). Available online: https://water-pub.env.go.jp/water-pub/mizu-site/meisui/data/index.asp?info=4 (accessed on 4 December 2021).
- Tanaka, R.; Araki, S.; Yasuoka, Y.; Mukai, T.; Ohnuma, S.; Ishikawa, T.; Fukuhori, N.; Sanada, T. A simplified method for improved determination of radon concentration in environmental water samples. Radioisotopes 2013, 62, 423–438. [Google Scholar] [CrossRef] [Green Version]
- Yasuoka, Y.; Ishii, T.; Kataoka, Y.; Kubo, T.; Suda, H.; Tokonami, S.; Ishikawa, T.; Shinogi, M. Determination of radon concentration in water using liquid scintillation counter. Radioisotopes 2004, 53, 123–131. [Google Scholar] [CrossRef]
- Yasuoka, Y.; Ishikawa, T.; Fukuhori, N.; Tokonami, S. Comparison of simplified liquid scintillation counter (Triathler) with conventional liquid scintillation counter in the measurement of radon concentration in water. J. Hot Spring Sci. 2009, 59, 11–21. [Google Scholar]
- Kelleher, K.; Wong, J.; León-Vintró, L.; Currivan, L. International Rn-222 in drinking water interlaboratory comparison. Appl. Radiat. Isot. 2017, 126, 270–272. [Google Scholar] [CrossRef] [PubMed]
- Hosoda, M.; Kelleher, K.; Murray, M.; McGinnity, P.; Hanley, O.; Wong, J.; Currivan, L. Generation and migration of 222Rn in BaSO4 precipitate samples and implications for their analysis for 226Ra by gamma spectrometry. Radiat. Environ. Med. 2016, 5, 22–28. [Google Scholar]
- United Nation Scientific Committee on the Effects of Atomic Radiation (UNSCEAR). UNSCEAR 2000 Report to the General Assembly, with Scientific Annexes; United Nations: New York, NY, USA, 2000; Volume I. [Google Scholar]
- Kinahan, A.; Hosoda, M.; Kelleher, K.; Tsujiguchi, T.; Akata, N.; Tokonami, S.; Currivan, L.; León Vintró, L. Assessment of radiation dose from the consumption of bottled drinking water in Japan. Int. J. Environ. Res. Public Health 2020, 17, 4992. [Google Scholar] [CrossRef]
- International Commission on Radiological Protection (ICRP). Occupational Intakes of Radionuclides: Part 3. ICRP Publication 137. Ann. ICRP 2017, 46, 1–487. [Google Scholar] [CrossRef]
- Ishii, T.; Horiuchi, K. Radon in natural water. In Radon in Environment; Shimo, M., Tsujimoto, T., Eds.; Electron Science Institute: Osaka, Japan, 1992; pp. 160–166. (In Japanese) [Google Scholar]
- Tokuyama, H.; Igarashi, S. Radon concentration in drinking water in Wakasa Area, Fukui Prefecture. In Proceedings of the Scientific Meeting on "Radon in Natural Waters"; Fukui, M., Horiuchi, K., Eds.; Research Reactor Institute, Kyoto University: Kyoto, Japan, 1997; pp. 15–20. (In Japanese). [Google Scholar]
- Furuta, S. Radon in water sample around Ningyo Toge Area. In Proceedings of the Scientific Meeting on "Radon in Natural Waters"; Fukui, M., Horiuchi, K., Eds.; Research Reactor Institute, Kyoto University: Kyoto, Japan, 1997; pp. 37–42. (In Japanese). [Google Scholar]
- Onishchenko, A.; Zhukovsky, M.; Veselinovic, N.; Zunic, Z.S. Radium-226 concentration in spring water sampled in high radon regions. Appl. Radiat. Isot. 2010, 68, 825–827. [Google Scholar] [CrossRef]
- Beyermann, M.; Bünger, T.; Schmidt, K.; Obrikat, D. Occurrence of natural radioactivity in public water supplies in Germany: 238U, 234U, 235U, 228Ra, 226Ra, 222Rn, 210Pb, 210Po and gross α activity concentrations. Radiat. Prot. Dosim. 2010, 141, 72–81. [Google Scholar] [CrossRef] [Green Version]
- Wu, Y.-Y.; Ma, Y.-Z.; Cui, H.-X.; Liu, J.-X.; Sun, Y.-R.; Shang, B.; Su, X. Radon Concentrations in Drinking Water in Beijing City, China and Contribution to Radiation Dose. Int. J. Environ. Res. Public Health 2014, 11, 11121–11131. [Google Scholar] [CrossRef] [Green Version]
- Kanda, Y. Investigation of the freely available easy-to-use software ‘EZR’ for medical statistics. Bone Marrow Transplant. 2013, 48, 452–458. [Google Scholar] [CrossRef] [Green Version]
- United Nation Scientific Committee on the Effects of Atomic Radiation (UNSCEAR). UNSCEAR 1977 Report to the General Assembly, with Annexes; United Nations: New York, NY, USA, 1977. [Google Scholar]
- Plant, J.A.; Saunders, A.D. The radioactive earth. Radiat. Prot. Dosim. 1996, 68, 25–36. [Google Scholar] [CrossRef]
- Furukawa, M.; Shingaki, R. Terrestrial gamma radiation dose rate in Japan estimated before the 2011 Great East Japan Earthquake. Radiat. Emerg. Med. 2012, 1, 11–16. [Google Scholar]
- Minato, S. Revision of a Database on Terrestrial γ-Ray Dose Rates, Radiation Earth Science Laboratory Special Contribution Series SCS-0110; Radiation Earth Science Laboratory: Nagoya, Japan, 2015. (In Japanese) [Google Scholar]
- Omori, Y.; Hosoda, M.; Takahashi, F.; Sanada, T.; Hirao, S.; Ono, K.; Furukawa, M. Japanese population dose from natural radiation. J. Radiol. Prot. 2020, 40, R99–R140. [Google Scholar] [CrossRef]
- Vinson, D.S.; Tagma, T.; Bouchaou, L.; Dwyer, G.S.; Warner, N.R.; Vengosh, A. Occurrence and mobilization of radium in fresh to saline coastal groundwater inferred from geochemical and isotopic tracers (Sr, S, O, H, Ra, Rn). Appl. Geochemistry. 2013, 38, 161–175. [Google Scholar] [CrossRef]
- Tricca, A.; Porcelli, D.; Wasserburg, G.J. Factors controlling the groundwater transport of U, Th, Ra, and Rn. Proc. Indian Acad. Sci. (Earth Planet. Sci.). 2000, 109, 95–108. [Google Scholar] [CrossRef] [Green Version]
- Krishnaswami, S.; Bhushan, R.; Baskaran, M. Radium isotopes and 222Rn in shallow brines, Kharaghoda (India). Chem. Geo. 1991, 87, 125–136. [Google Scholar] [CrossRef]
- Vengosh, A.; Coyte, R.M.; Podgorski, J.; Johnson, T.M. A critical review on the occurrence and distribution of the uranium- and thorium-decay nuclides and their effect on the quality of groundwater. Sci. Total Environ. 2022, 808, 151914. [Google Scholar] [CrossRef]
- Miklyaev, P.S.; Petrova, T.B.; Shchitov, D.V.; Sidyakin, P.A.; Murzabekov, M.A.; Marennyy, A.M.; Nefedov, N.A.; Sapozhnikov, Y.A. The results of long-term simultaneous measurements of radon exhalation rate, radon concentrations in soil gas and groundwater in the fault zone. App. Radiat. Isot. 2021, 167, 109460. [Google Scholar] [CrossRef]
- Sukanya, S.; Noble, J.; Joseph, S. Factors controlling the distribution of radon (222Rn) in groundwater of a tropical mountainous river basin in southwest India. Chemosphere. 2021, 263, 128096. [Google Scholar] [CrossRef]
- Somogyi, G.; Lénárt, L. Time-integrated radon measurements in spring and well waters by track technique. Int. J. Radiat. Appl. Instrum. Part D 1986, 12, 731–734. [Google Scholar] [CrossRef]
- Ono, M.; Shimada, J.; Ichikawa, T.; Tokunaga, T. Evaluation of groundwater discharge in Lake Ezu, Kumamoto, based on radon in water. Japanese J. Limnnology 2011, 72, 193–210, (In Japanese with English abstract). [Google Scholar] [CrossRef]
- Hanya, T.; Ogura, N. Survey of water quality (Suishitsuchousa-hou), 3rd ed.; Maruzen: Tokyo, Japan, 1995; pp. 1–335. (In Japanese) [Google Scholar]

| Site No. | Basement Geology | Sampling Date |
|---|---|---|
| 1 | Alluvium | 4 August 2016 |
| 2 | Dacite–Andesite Lava (after the Pliocene) | 17 August 2016 |
| 3 | Dacite–Andesite Lava (after the Pliocene) | 18 August 2016 |
| 4 | Alluvium | 21 August 2016 |
| 5 | Dacite–Andesite Lava (after the Pliocene) | 22 August 2016 |
| 6 | Dacite–Andesite Lava (after the Pliocene) | 25 August 2016 |
| 7 | Andesite Lava/Pyroclastic Rock (middle-upper Miocene) | 29 August 2016 |
| 8 | Terrace deposit | 5 September 2016 |
| 9 | Alluvium | 7 September 2016 |
| 10 | Terrace Deposit | 8 September 2016 |
| 11 | Pyroclastic Rock (after middle Pleistocene) | 15 September 2016 |
| 12 | Pyroclastic Rock (after middle Pleistocene) | 16 September 2016 |
| 13 | Pyroclastic Rock (after middle Pleistocene) | 19 September 2016 |
| 14 | Andesite Lava/Pyroclastic Rock (middle-upper Miocene) | 26 September 2016 |
| 15 | Alluvium | 17 June 2016–21 June 2017 |
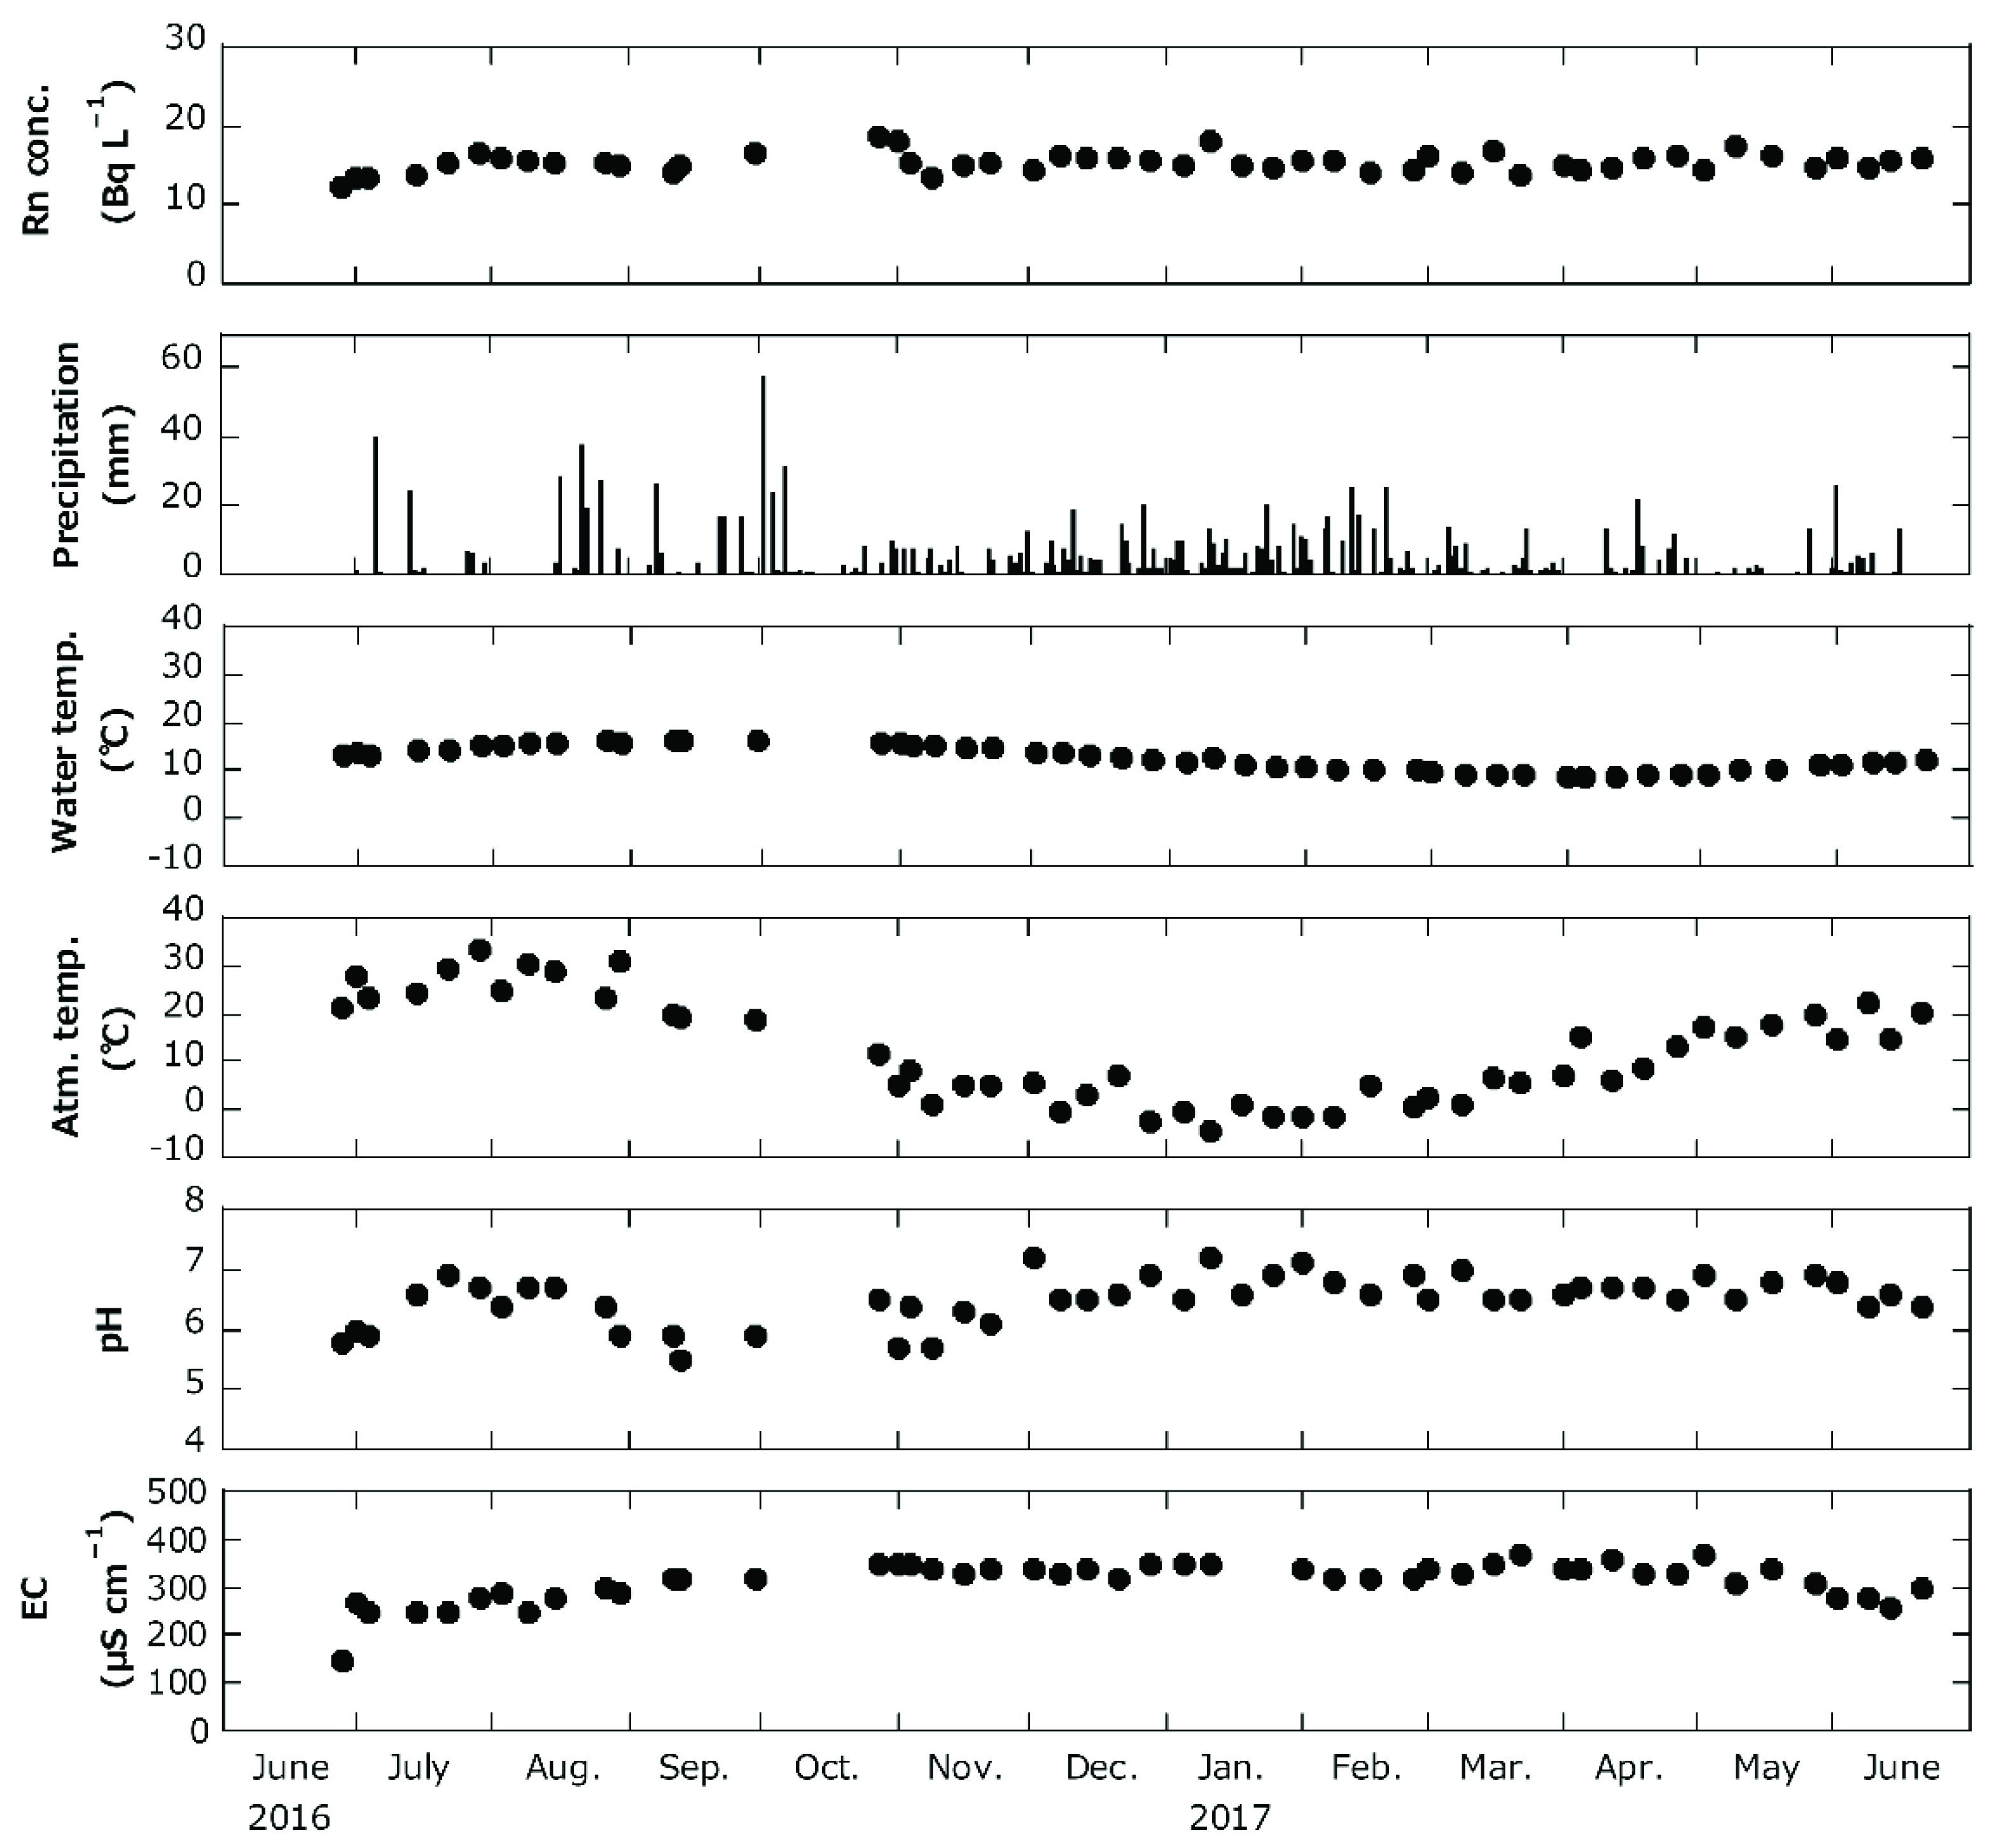
| Site No. | pH | EC (μS cm−1) | Water Temp. (°C) | Atm. Temp. (°C) | 222Rn Conc. a (Bq L−1) | 226Ra Conc. b (Bq L−1) |
|---|---|---|---|---|---|---|
| 1 | 6.5 | 250 | 15.2 | 27.5 | 16.5 ± 1.0 | <MDC (0.0096) |
| 2 | 7.2 | 153 | 14.7 | 14.7 | 6.7 ± 0.2 | <MDC (0.0080) |
| 3 | 6.4 | 86 | 19.7 | 24.9 | 13.9 ± 0.9 | 0.0098 ± 0.0031 |
| 4 | 6.2 | 111 | 21.7 | 25.7 | 11.5 ± 0.7 | <MDC (0.012) |
| 5 | 6.7 | 89 | 7.4 | 22.5 | 5.3 ± 0.5 | <MDC (0.0089) |
| 6 | 6.5 | 100 | 6.9 | 24.4 | 6.3 ± 1.0 | <MDC (0.0085) |
| 7 | 5.7 | 220 | 12.5 | 28.0 | 16.6 ± 0.6 | <MDC (0.0099) |
| 8 | 6.6 | 119 | 9.9 | 22.1 | 11.0 ± 0.8 | <MDC (0.0099) |
| 9 | 6.6 | 68 | 9.7 | 20.9 | 26.7 ± 1.1 | 0.0093 ± 0.0030 |
| 10 | 6.1 | 185 | 11.3 | 20.1 | 8.0 ± 0.7 | <MDC (0.0095) |
| 11 | 5.8 | 140 | 10.3 | 22.1 | 18.8 ± 0.8 | 0.022 ± 0.0071 |
| 12 | 6.2 | 198 | 9.7 | 20.6 | 18.6 ± 1.2 | <MDC (0.0097) |
| 13 | 5.9 | 164 | 9.9 | 17.8 | 7.9 ± 0.3 | <MDC (0.0082) |
| 14 | 6.2 | 240 | 10.2 | 19.1 | 7.7 ± 1.0 | <MDC (0.0096) |
| 15 c | 5.5–7.2 | 147–370 | 8.8–16.5 | −4.3–33.4 | 12.2–18.6 (15.3 ± 1.2) | <MDC (0.019) d |
| Site No. | The Annual Effective Dose (μSv) | ||
|---|---|---|---|
| 222Rn | 226Ra | Total | |
| 1 | 8 ± 0.5 | <1 | <10 |
| 2 | 3 ± 0.1 | <1 | <5 |
| 3 | 7 ± 0.5 | 1 ± 0.3 | 8 ± 1 |
| 4 | 6 ± 0.4 | <2 | <7 |
| 5 | 3 ± 0.2 | <1 | <4 |
| 6 | 3 ± 0.5 | <1 | <4 |
| 7 | 8 ± 0.3 | <1 | <10 |
| 8 | 6 ± 0.4 | <1 | <7 |
| 9 | 13 ± 0.5 | 1 ± 0.3 | 14 ± 1 |
| 10 | 4 ± 0.3 | <1 | <5 |
| 11 | 9 ± 0.4 | 2 ± 0.7 | 12 ± 1 |
| 12 | 9 ± 0.6 | <1 | <11 |
| 13 | 4 ± 0.2 | <1 | <5 |
| 14 | 4 ± 0.5 | <1 | <5 |
| 15 | 8 ± 0.005 | <2 | <10 |
| Country | Location | Description | 222Rn Conc. (Bq L−1) | Ref. |
|---|---|---|---|---|
| Japan | 35 sites of “Meisui-100-sen” | Spring water | 0.24–98.91 Ave. = 12.98 | [30] |
| Wakasa area, Fukui | Tap water | 1.2–104 Median = 11.2 | [31] | |
| Rokko area, Hyogo | Well water | 2.6–78.6 | [16] | |
| Ningyo-Toge area, Okayama and Tottori | Tap/well/spring water | 0.1–230 | [32] | |
| Russia | Ural | Drinking water | 57–92 | [33] |
| Serbia | Niska Banja | Drinking water | 430 ± 46 | [33] |
| Spain | Catalonia | Groundwater | 1.4–104.9 | [7] |
| Germany | – | Drinking water | <1.3–1800 | [34] |
| China | Beijing | Public water | <0.268–29.00 | [35] |
| Well water | 1.45–49.00 | [35] | ||
| Japan | Hirosaki, Aomori | Spring water | 5.3–26.7 Ave. ± SD = 12.7 ± 6.1 | This study |
Publisher’s Note: MDPI stays neutral with regard to jurisdictional claims in published maps and institutional affiliations. |
© 2022 by the authors. Licensee MDPI, Basel, Switzerland. This article is an open access article distributed under the terms and conditions of the Creative Commons Attribution (CC BY) license (https://creativecommons.org/licenses/by/4.0/).
Share and Cite
Yamada, R.; Hosoda, M.; Tabe, T.; Tamakuma, Y.; Suzuki, T.; Kelleher, K.; Tsujiguchi, T.; Tateyama, Y.; Nugraha, E.D.; Okano, A.; et al. 222Rn and 226Ra Concentrations in Spring Water and Their Dose Assessment Due to Ingestion Intake. Int. J. Environ. Res. Public Health 2022, 19, 1758. https://doi.org/10.3390/ijerph19031758
Yamada R, Hosoda M, Tabe T, Tamakuma Y, Suzuki T, Kelleher K, Tsujiguchi T, Tateyama Y, Nugraha ED, Okano A, et al. 222Rn and 226Ra Concentrations in Spring Water and Their Dose Assessment Due to Ingestion Intake. International Journal of Environmental Research and Public Health. 2022; 19(3):1758. https://doi.org/10.3390/ijerph19031758
Chicago/Turabian StyleYamada, Ryohei, Masahiro Hosoda, Tomomi Tabe, Yuki Tamakuma, Takahito Suzuki, Kevin Kelleher, Takakiyo Tsujiguchi, Yoshiki Tateyama, Eka Djatnika Nugraha, Anna Okano, and et al. 2022. "222Rn and 226Ra Concentrations in Spring Water and Their Dose Assessment Due to Ingestion Intake" International Journal of Environmental Research and Public Health 19, no. 3: 1758. https://doi.org/10.3390/ijerph19031758