Article

222Rn and 226Ra Concentrations in Spring Water and Their Dose Assessment Due to Ingestion Intake

1
Graduate School of Health Sciences, Hirosaki University, 66-1 Honcho, Hirosaki, Aomori 036-8564, Japan
2
Institute of Radiation Emergency Medicine, Hirosaki University, Hirosaki, Aomori 036-8564, Japan
3
School of Health Sciences, Hirosaki University, Hirosaki, Aomori 036-8564, Japan
4
Office of Radiation Protection and Environmental Monitoring, Environmental Protection Agency, Clonskeagh Square, D14 H424 Dublin, Ireland
5
National Institute of Radiological Sciences, National Institutes for Quantum Science and Technology, 4-9-1 Anagawa, Inage, Chiba 263-0024, Japan
6
Radioisotope Research Center, Kobe Pharmaceutical University, Kobe, Hyogo 658–8558, Japan
7
Department of Radiological Technology, Faculty of Health Sciences, Hokkaido University of Science, Sapporo 006-8585, Japan
*
Author to whom correspondence should be addressed.
Present address: Fuji Electric Co., Ltd., 1 Fujimachi, Hino, Tokyo 191-8502, Japan.
Int. J. Environ. Res. Public Health 2022, 19(3), 1758; https://doi.org/10.3390/ijerph19031758
Submission received: 24 December 2021 / Revised: 25 January 2022 / Accepted: 2 February 2022 / Published: 3 February 2022
(This article belongs to the Special Issue Environmental Radioactivity Monitoring and Measurements: Radon)

Abstract

:
222Rn and 226Ra concentrations of less than a few to several thousands of Bq L1 have been observed in several underground bodies of water around the world. Although regulations for these concentrations in water have been implemented internationally, there are currently no regulations in place in Japan. However, concentrations that exceed these internationally recognized regulatory values have also been observed in Japan. In this study, concentrations in spring water in the northern part of Japan were measured and the effective dose from intake of the water was evaluated. 222Rn concentrations were measured using a liquid scintillation counter, and 226Ra concentrations were measured using a high purity germanium detector after chemical preparation. The measured 222Rn concentrations (=12.7 ± 6.1 Bq L−1) and 226Ra concentrations (<0.019–0.022 Bq L−1) did not exceed the reference values set by international and European/American organizations. A conservative estimate of the annual effective ingestion dose of 8 μSv for 222Rn and 226Ra obtained in this study is much smaller than the estimated overall annual effective dose of 2.2 mSv from natural radiation to the Japanese population. However, this dosage accounts for 8% of the WHO individual dosing criteria of 0.1 mSv/year for drinking water.

1. Introduction

It is well known that 222Rn, a decay product of 226Ra, is the second leading cause of lung cancer after tobacco smoking [1]. Since 226Ra and 222Rn are water soluble, groundwaters may contain 226Ra and 222Rn. The sources of 226Ra to the groundwater-phase result from the decay of dissolved 230Th, the dissolution of 226Ra-containing rocks, α-recoil associated with the α-decay of 230Th located in mineral surface layers, and the desorption reaction of 226Ra at the rock–water boundary [2]. The main source of 222Rn in water is due to α-recoil associated with the α-decay of 226Ra in the aquifer and dissolution of 222Rn generated in rocks [3]. In fact, 222Rn and 226Ra concentrations of less than a few to several thousands of Bq L−1 have been observed in several underground bodies of water around the world [4,5,6,7,8]. When these underground waters are used as drinking water, exposure due to ingestion is considered. In addition, if these waters are for domestic use, exposure from inhalation is also considered due to 222Rn released from the water into indoor air. Moreover, 226Ra is designated as a carcinogen (Group 1) in the International Agency for Research on Cancer classification [9], and its dose coefficient for the intake by the International Commission on Radiological Protection is relatively higher than that of other radionuclides. It is, therefore, important to measure 222Rn concentrations and 226Ra concentrations in underground water in the context of radiation protection of the public.
Under these circumstances, the United States Environment Protection Agency (USEPA) has established a regulatory value for 222Rn concentration in water. The first regulatory value (i.e., maximum contaminant level (MCL)) was proposed in 1991, and the value was 11 Bq L−1 [10]. The USEPA then conducted a further study in conjunction with the National Academy of Sciences, and as a result, the National Research Council (NRC) published a book entitled Risk Assessment of Radon in Drinking Water [11] in 1999. This study proposed 148 Bq L−1 as an Alternative MCL (AMCL), and this value is now used along with the MCL [12]. In addition, both the World Health Organization (WHO) recommend a guidance level [13] and European Union (EU) [14] recommend a parametric value of 100 Bq L−1 for 222Rn concentrations in drinking water. The USEPA [15] proposes 0.185 Bq L−1 as the MCL for 226Ra, whereas the WHO [13] recommends 1 Bq L−1 as the guidance level for 226Ra.
Thus, although regulations for 222Rn concentration and 226Ra concentrations in water have been implemented internationally, there are no regulations in place in Japan. However, 222Rn and 226Ra concentrations that exceed the international levels outlined above have also been observed in Japan [3,16,17]. It is, therefore, important to measure these concentrations in underground water, especially if it is used as drinking water, and estimate the effective dose for intake. However, only a limited number of these evaluations have been conducted in the past. In addition, the accumulation of measurement data may lead to the introduction of regulations in Japan in the future. In this study, 222Rn and 226Ra concentrations of spring water in Hirosaki City, where radioactivity in drinking water and dose assessment has not yet been carried out, was measured, and the effective dose from ingestion of the water was evaluated. There are about 20 sites where spring water can be collected in Hirosaki City, and although the chemistry of some spring waters is evaluated by administrative organizations, no analysis of radioactivity or evaluation of the effective dose due to ingestion has been conducted.

2. Materials and Methods

2.1. Water Sampling

Spring water samples were collected at 15 locations in Hirosaki City, Aomori Prefecture (Figure 1). Hirosaki City (40°28′ N–40°45′ N, 140°09′ E–140°36′ E) is located in the southwestern part of Aomori Prefecture, which is located in the northern part of Honshu Island in the Japanese archipelago. The 15 sampling sites were selected from the spring waters that are known drinking water supplies and where sampling was possible. The basement geology of the sampling sites is shown in Table 1 [18]. According to Nemoto and Ujiie [18], the bedrock in Aomori Prefecture that includes the sampling sites are mainly composed of Jurassic accretionary complex and plutonic rocks of Cretaceous, which is penetrated Jurassic accretionary complex. This bedrock is covered in parts by a Neogene system and is also covered by sediments of post-Pleistocene and volcanic products. The aquifers at the sampling sites are located in Neogene Pliocene to Quaternary Pleistocene strata [19]. The basement geology and stratigraphic succession of Hirosaki City are described and shown in detail in the reports of Nemoto and Ujiie [18], Kogawa [19], and the National Institute of Advanced Industrial Science and Technology [20].
In this study, spring water samples were collected in 100 mL containers for 222Rn measurement, and approximately 10 L was collected in polyethylene containers for 226Ra measurement. One 100 mL and one 10 L sample from each of the sites were collected between August 2016 and September 2016. At Site No. 15, which is selected as one of “Meisui-100-sen” (100 best bodies of water) by the Ministry of the Environment, Japan [21], additional spring water samples were collected in 100 mL containers once a week from June 2016 to June 2017 to observe whether there existed any seasonal variation of radon concentrations. In addition, the pH, electric conductivity (EC), water temperature of the spring water samples, and atmospheric temperatures were measured. The pH, EC, and temperatures were measured using a pH meter (AS-711, HORIBA, Kyoto, Japan), an EC meter (B-771, HORIBA, Kyoto, Japan), and a thermometer (CT-220, CUSTOM Corporation, Tokyo, Japan), respectively. Moreover, the collected spring water was measured directly for gamma rays using a p-type high purity germanium (HPGe) detector (GEM30P4-70, ORTEC, Oak Ridge, USA), in order to confirm whether 134Cs and 137Cs, which was released as a result of the nuclear accident at the Fukushima Daiichi Nuclear Power Station (FDNPS), was observed.

2.2. 222Rn in Water Measurement

A total of 10 mL of sample was placed in a 20 mL glass vial containing a 10 mL liquid scintillator (High-Efficiency Mineral Oil Scintillator, PerkinElmer, Inc., Waltham, USA). The vial was shaken for 30 s and measured using a portable liquid scintillation counter (Triathler LSC, HIDEX, Turku, Finland) for 60 min at Hirosaki University, after leaving it for more than 4 h in a light-shielded area. Three samples were prepared for 222Rn analysis for each of the spring water sampling locations. 222Rn concentrations, C Rn (Bq L−1), were evaluated using the following equation [22]:
C Rn = A 0 B 0 × exp 0.693 × t e T × 1 f × 1 V × C F
where A 0 is the integral counting rate of the sample (cps), B 0 is the integral counting rate of the background sample (cps), t e is the elapsed period from sampling (days), T is the half-life of 222Rn (=3.824 days), f is the sensitivity of the Triathler based on the previous report (=4.5 cps Bq−1) [22], V is the sampling volume (=10−2 L), and C F is calibration factor of the Triathler. A 0 and B 0 were calculated by the integral counting method [22,23,24], which is a method to evaluate the 222Rn concentration based on the integral counting rates of three-channel windows (50–1000 ch, 75–1000 ch, and 100–1000 ch). C F was evaluated by an interlaboratory intercomparison. For proper evaluation of 222Rn concentrations in water, an intercomparison was carried out between Hirosaki University and the Office of Radiation Protection and Environmental Monitoring, Environmental Protection Agency, Ireland (EPA-ORM). EPA–ORM is a radon-in-water measurement technique accredited to ISO 17025:2005 [25]. The water chosen for the intercomparison was a private domestic groundwater supply located in the southeast of Ireland, with a 222Rn concentration of approximately 750 Bq L−1, and five samples were prepared and measured. The arithmetic mean (± uncertainty (k = 1)) of the radon in water measurements analyzed by EPA–ORM was 765 ± 24 Bq L−1, and arithmetic mean (± uncertainty (k = 1)) for the measurements by Hirosaki University was 748 ± 8 Bq L−1. Therefore, the calibration factor was evaluated to be 1.02 ± 0.03 (uncertainty; k = 1), and this value was used as the C F in Equation (1).

2.3. 226Ra in Water Measurement

The chemical preparation of spring water samples was carried out according to an EPA–ORM test procedure, which is a barium sulfate (BaSO4) coprecipitation method and summarized by Hosoda et al. [26]. In this study, the sampling volume was 4 L. The precipitate was collected on a glass microfiber filter (Whatman GF/C 47 mmφ, Cytiva, Tokyo, Japan). The precipitate on the filter was dried overnight to prepare the sample for measurement. A sample was prepared for each spring water sample. The yield of barium was calculated by the gravimetric method according to Hosoda et al. [26].
The filter sample was placed with the precipitate side down in the measuring container. This measurement sample was sealed and stored for more than 30 days in order to establish radioactive equilibrium between 226Ra and its decay products. After preservation, gamma rays from samples were measured using a p-type HPGe detector (GEM-40190, ORTEC, Oak Ridge, USA), which was calibrated by a commercially available mixed activity gamma standard source (MX033U8PP, Japan Radioisotope Association, Tokyo, Japan). The measurement time was set as 80,000 s. The 226Ra activity was determined from the activity of 214Bi (609 keV).

2.4. Dose Assessment

The annual effective dose for 222Rn and 226Ra was estimated from the following equation, assuming that the spring water is consumed daily as drinking water [27,28]:
D = C i × W × K W
where D is the annual effective dose due to ingestion (μSv), C i is the radioactive concentration (Bq L−1), W is the annual consumption (L), K W is the dose coefficient (μSv Bq−1) of 222Rn or 226Ra (6.9 × 10⁻⁴ μSv Bq−1 for 222Rn and 1.3 × 10⁻¹ μSv Bq−1 for 226Ra [29]). According to the WHO [13], the annual ingested volume of drinking water is assumed to be 730 L y−1, which is equivalent to the standard WHO drinking water consumption rate of 2 L day−1. In this study, this value was used as the annual consumption, W , in Equation (2), which is similar to other previous studies [6,7].

3. Results

3.1. Water Quality and Radioactive Concentration of Sampling Water

The results of measuring pH, EC, water temperatures of spring water samples, the atmospheric temperature, 222Rn concentrations, and 226Ra concentrations for the 15 sampling sites are shown in Table 2. The 222Rn concentrations were in the range of 5.3–26.7 Bq L−1 with an arithmetic mean (± standard deviation (SD)) of 12.7 ± 6.1 Bq L−1. Although 226Ra concentrations were below the minimum detectable concentrations (MDCs) at many sites (12 of the 15 sites),values were observed at the other three sites, which ranged from 0.0093 to 0.022 Bq L−1. It should be noted that no radioactive cesium due to the FDNPS accident was observed from the gamma-ray measurements of the samples.
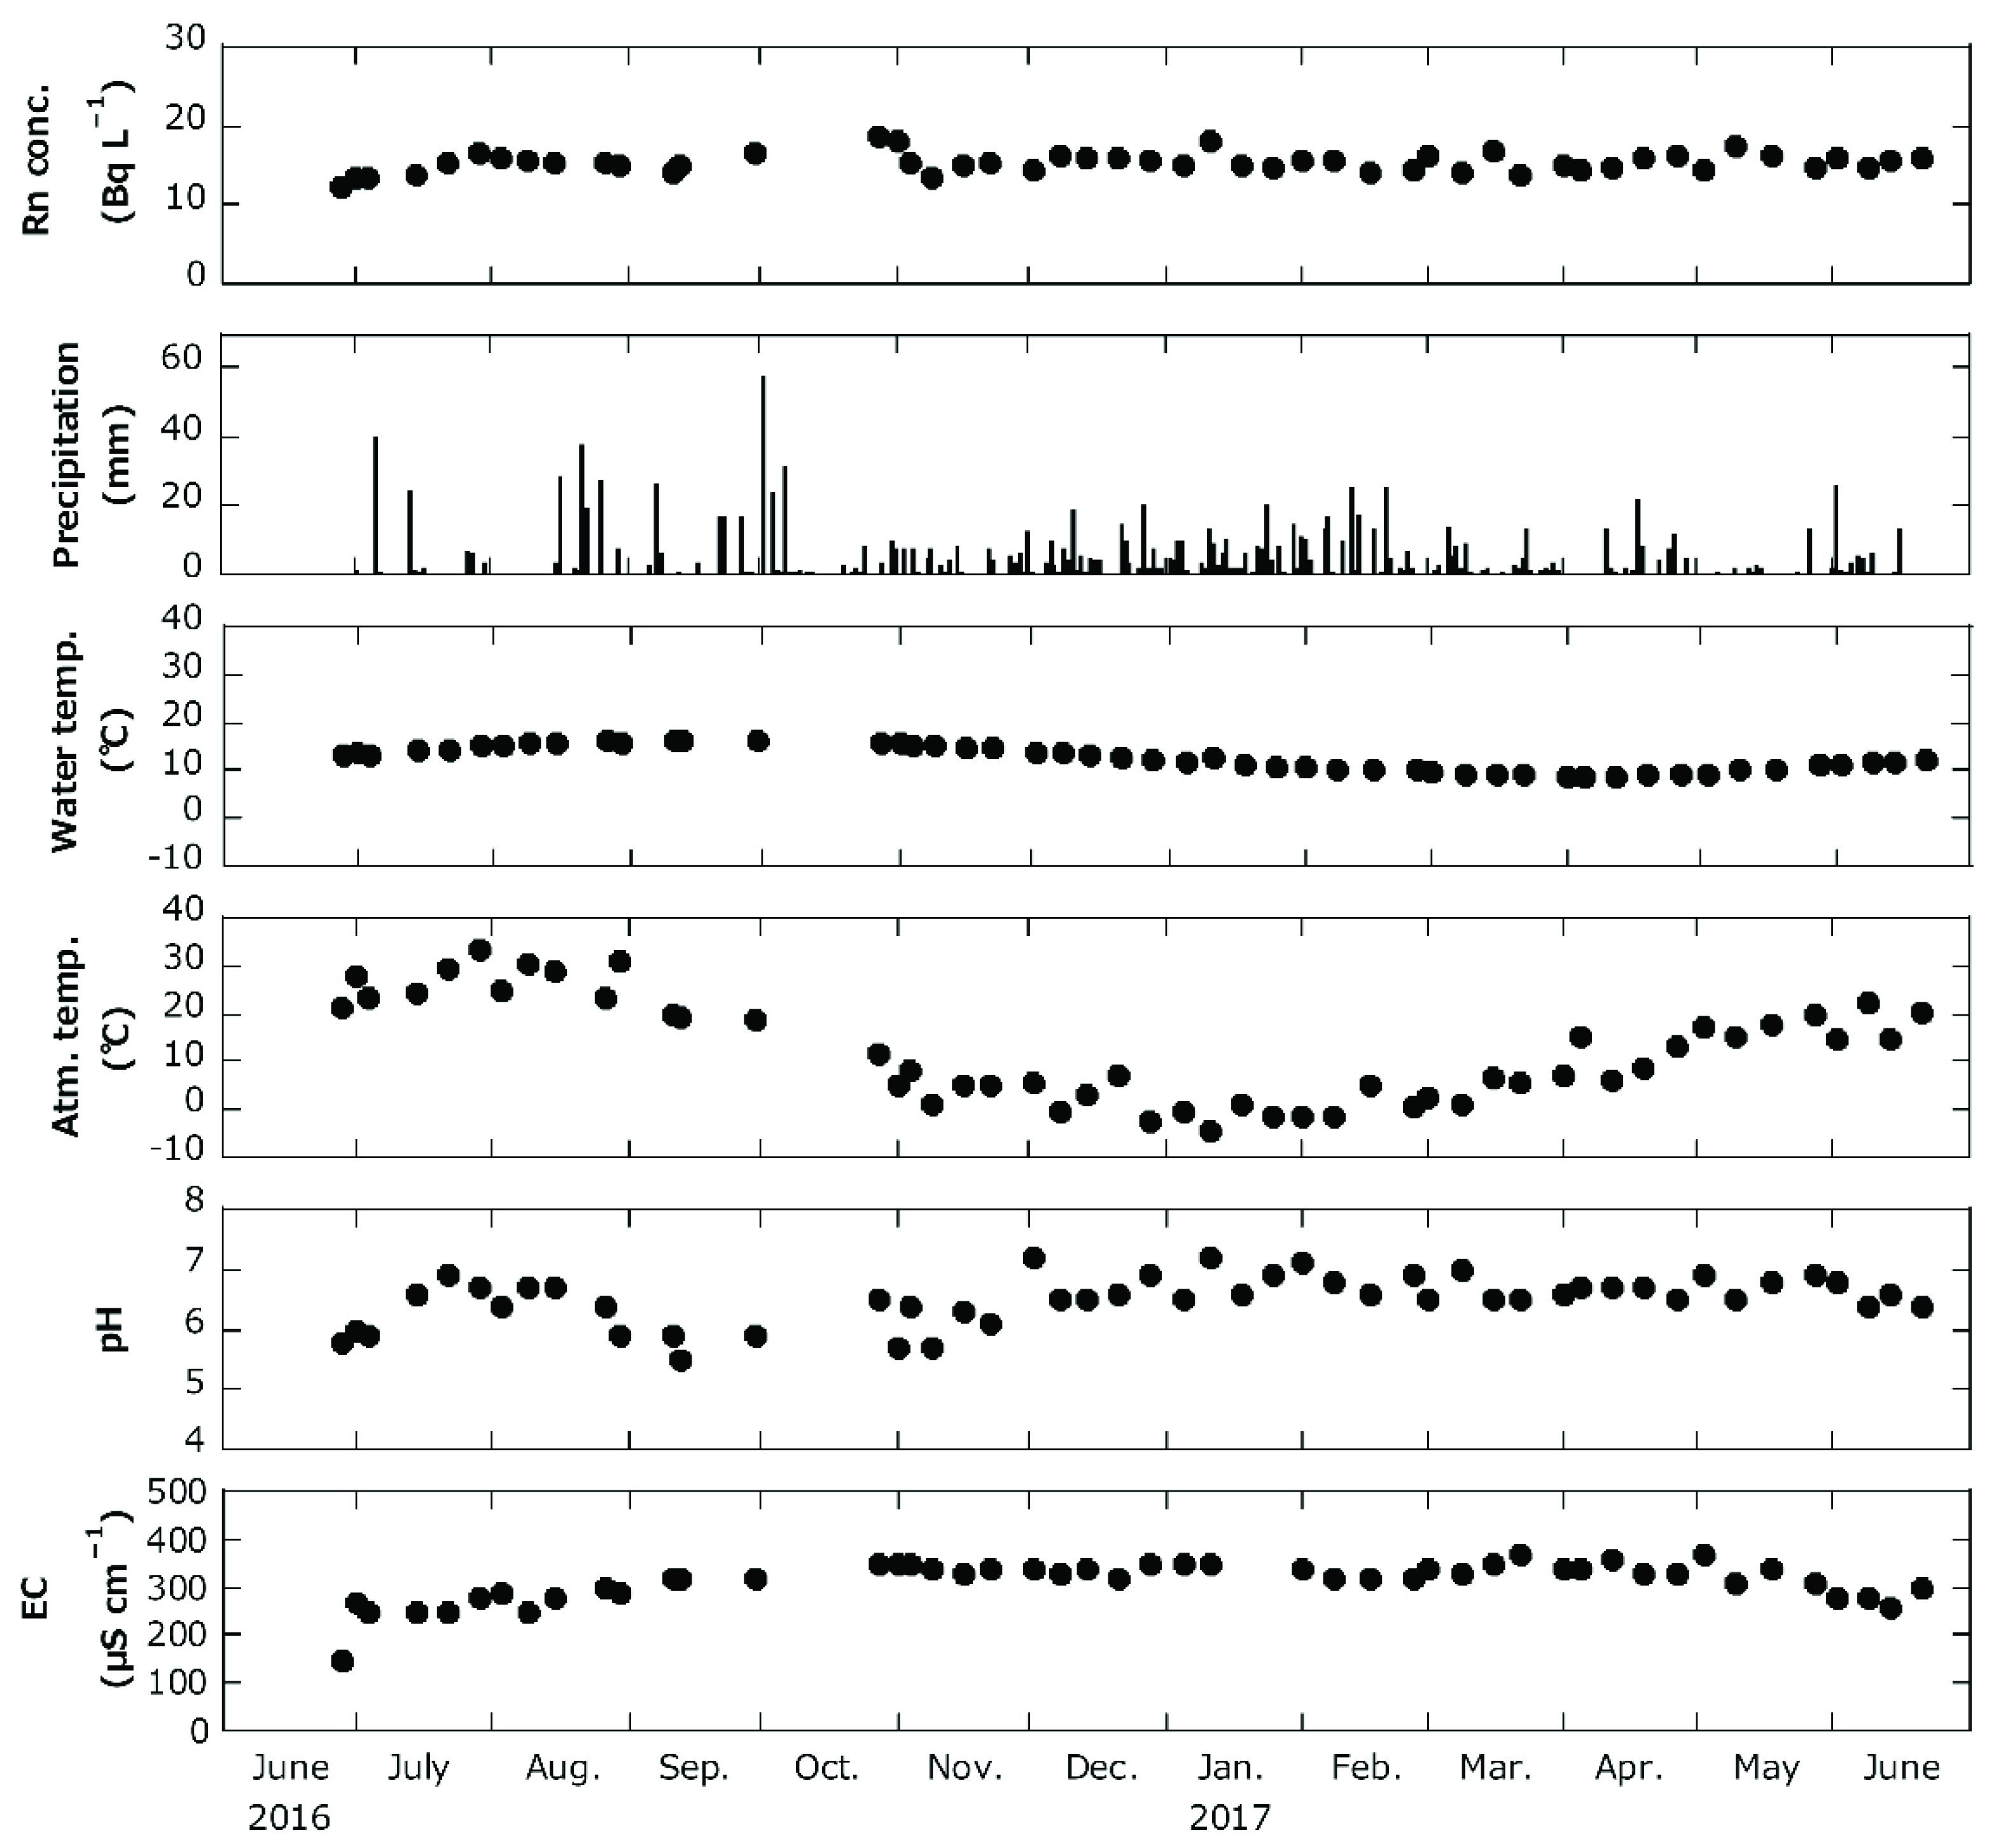
The results of the periodic measurements of pH, EC, water temperatures of spring water samples, atmospheric temperature, and 222Rn concentration at Site No. 15 are shown in Figure 2. The range of variation for each parameter is shown in Table 2.

3.2. Dose Assessment Due to Ingestion

Table 3 shows the annual effective ingestion dose for 222Rn and 226Ra estimated using Equation (2), assuming that the spring water is consumed daily as drinking water (=730 L y−1). The annual effective ingestion dose for 222Rn fluctuated in the range of 3–13 μSv with an arithmetic mean (± SD) of 6 ± 3 μSv. For 226Ra the dose fluctuated in the range of <1–2 μSv. The annual effective ingestion dose for 222Rn and 226Ra fluctuated in the range of <4–14 μSv. If the 226Ra concentrations below the MDC level are considered to be the same concentrations as MDCs, the arithmetic mean of the annual effective ingestion dose is 8 μSv.

4. Discussion

The average of 222Rn concentrations in the 15 sampling sites and the results of those in water obtained elsewhere in Japan and around the world are shown in Table 4. The results of 222Rn concentrations in this study were in good agreement with the measurement results of the 35 sites of the “Meisui-100-sen” (100 best bodies of water) reported by Ishii [30]. In addition, the measured 222Rn concentrations did not exceed the AMCL of USEPA (=148 Bq L−1) or the levels indicated by the WHO and EU (=100 Bq L−1), as reported in some previous studies [5,31,32,33,34]. On the other hand, there were seven sampling sites that exceeded the MCL of USEPA (=11 Bq L−1). Therefore, if Japan introduces regulations on 222Rn concentrations in water, it will be necessary to carefully consider the regulatory values.
In order to investigate the relationship between the basement geology (Table 1) and 222Rn concentrations, 222Rn concentrations were classified based on the basement geology around the water sampling sites, and statistical processing was performed using EZR [36]. As a result of Shapiro–Wilk tests, normality was observed (p = 0.800) in 222Rn concentration in spring water for each basement geology. Therefore, although a one-way analysis of variance was performed, no significant difference was found for all basement geologies. It is well known that granitic rocks have high contents of natural radionuclides [37,38], and it has been reported that absorbed dose rates [39,40,41] and 222Rn concentrations in water [7] are elevated at sites where the basement geology is granite. According to Nemoto and Ujiie [18], however, the plutonic rocks consisting of granite were not included in the basement geology around the water sampling sites in this study. Therefore, it is considered that the difference in classified 222Rn concentrations could not be significantly confirmed.
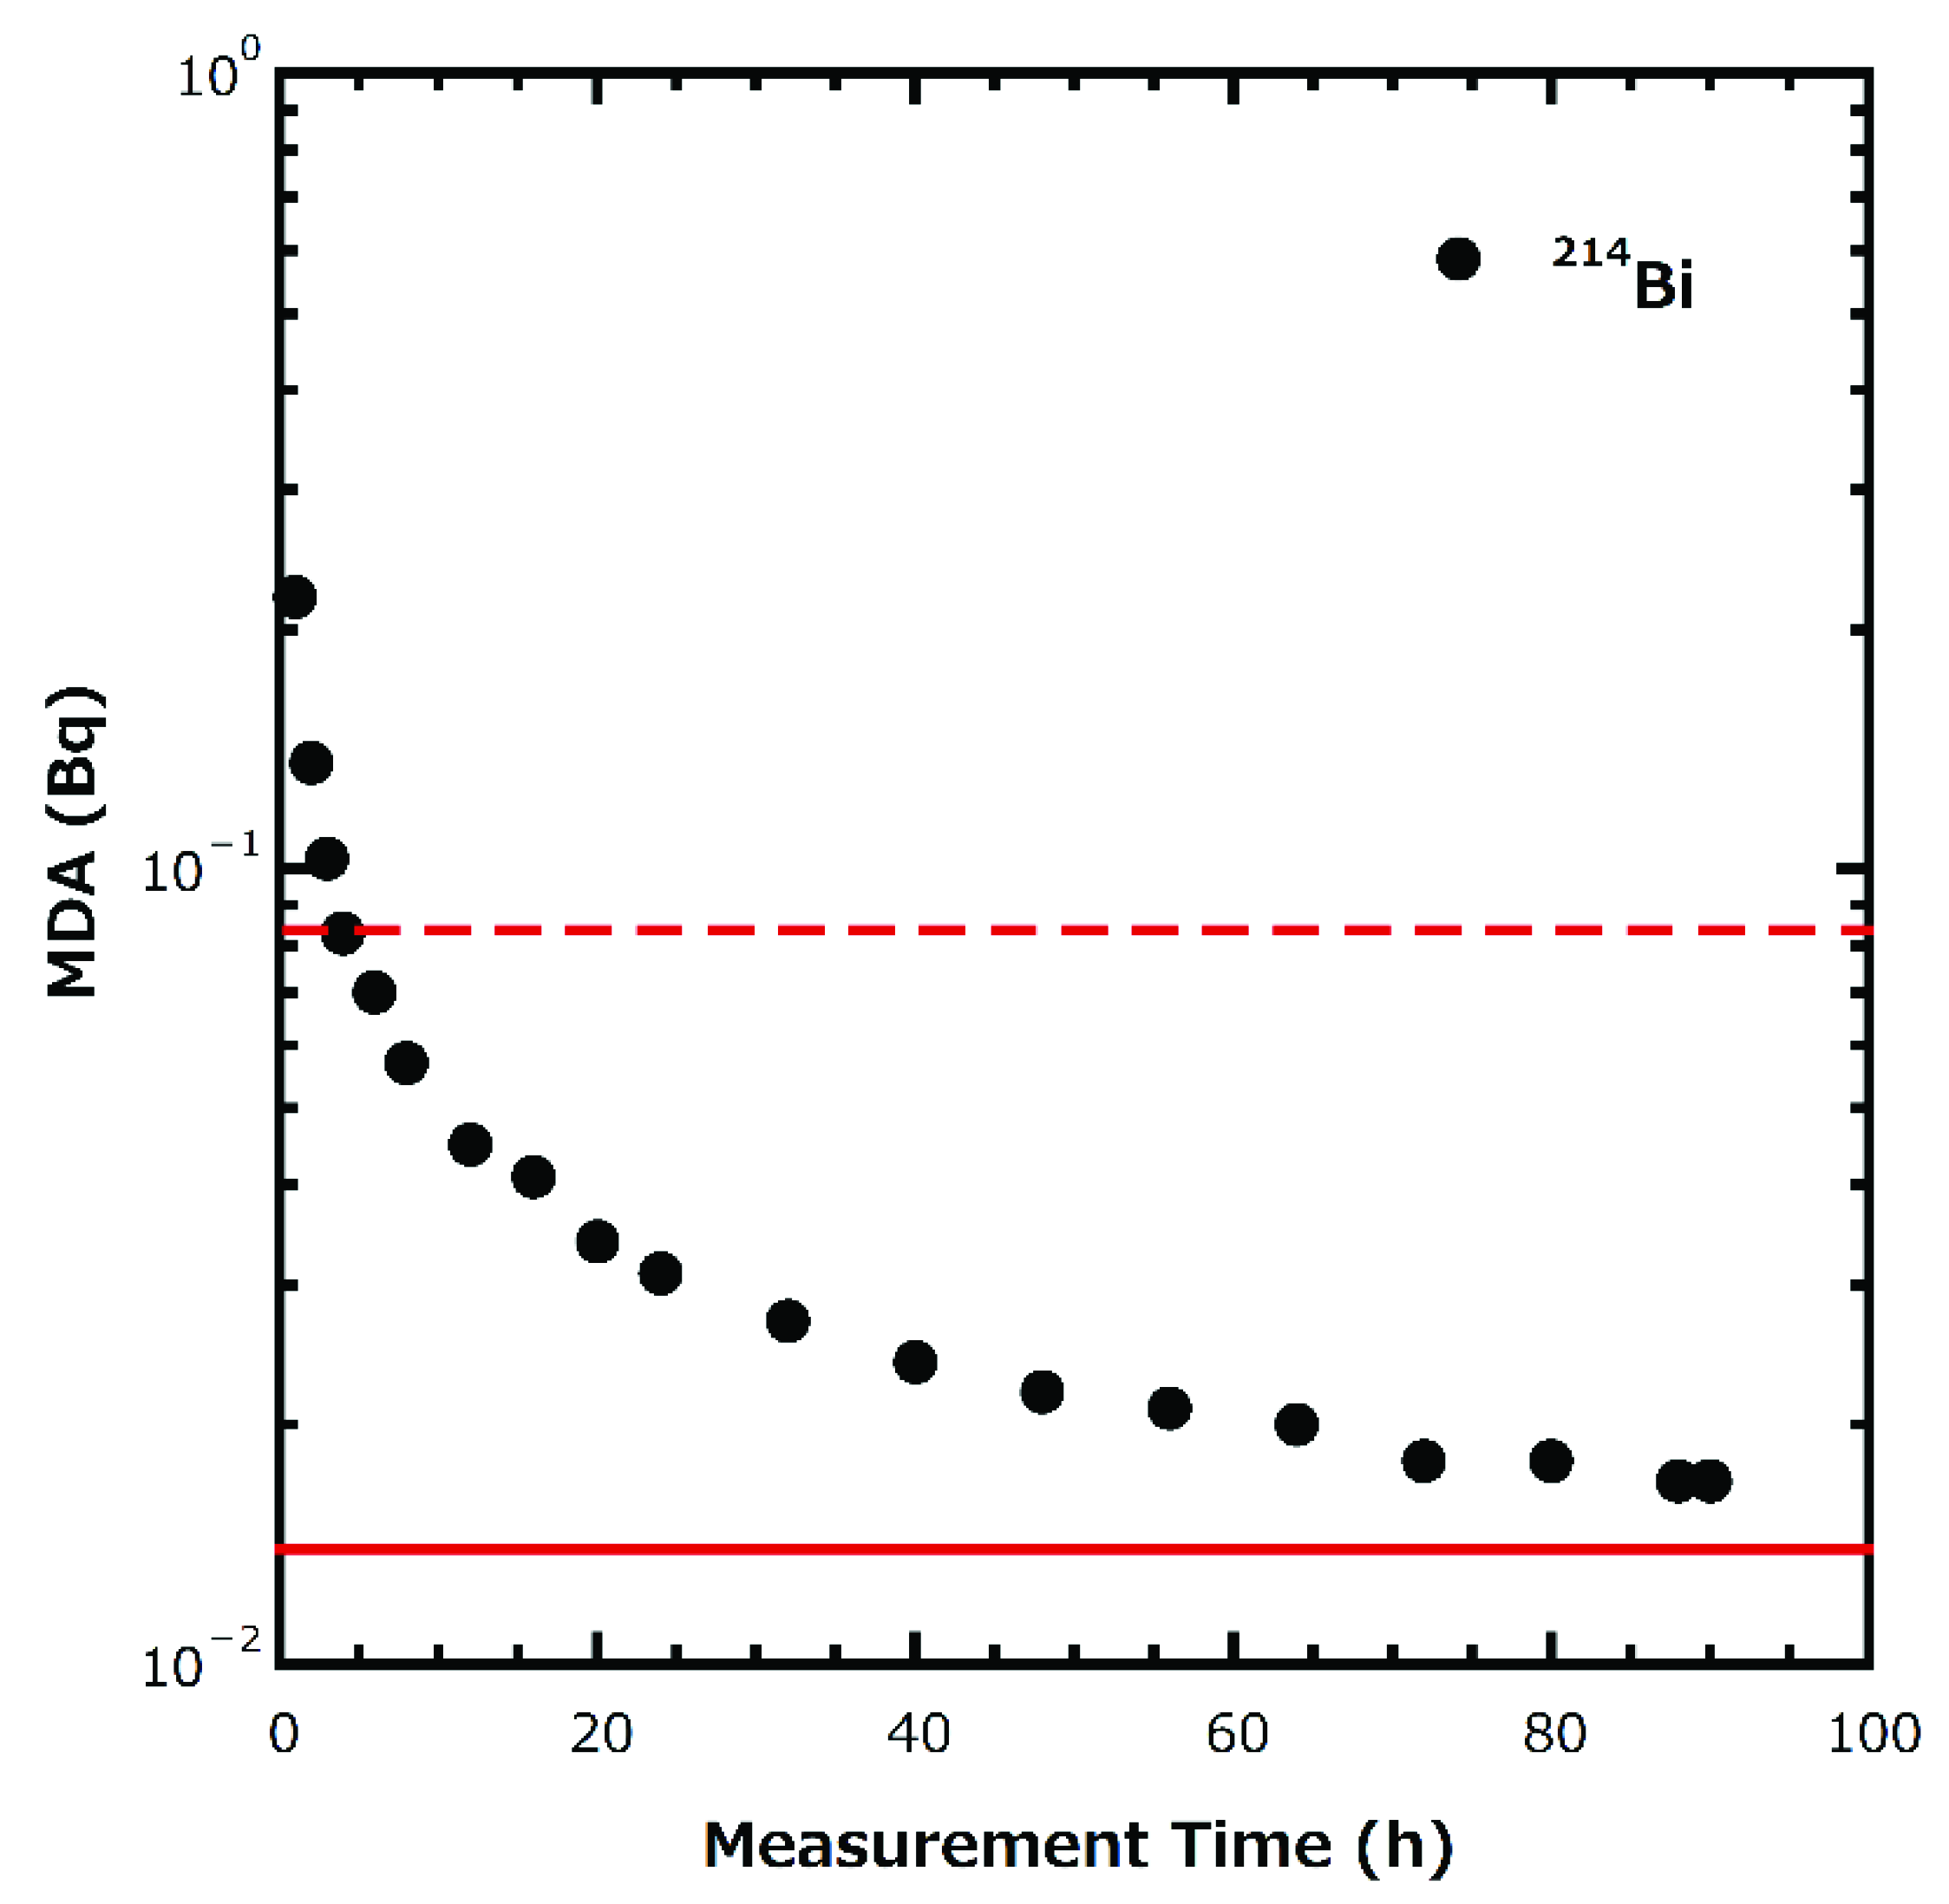
Although 226Ra concentrations were less than MDC at 12 sites, no concentration above the MCL of USEPA (=0.185 Bq L−1) or the guidance level of the WHO (= 1 Bq L−1) were identified at the remaining three sites where detectable values were observed. Further investigation was conducted on the MDC and an examination of the amounts of sampling volume and measurement time would be required for the future detection of 226Ra concentrations using this method was made. Figure 3 shows the results of minimum detectable activity (MDA) of 214Bi for long-term (maximum 90 h) gamma-ray measurement of a 24 L water sample containing 0.0035 Bq L−1 of 226Ra using the same chemical preparation as in this study. As shown in Figure 3, when the sampling volume was 24 L, 214Bi could be sufficiency quantified within 24 h of measurement. However, if the sampling volume is 4 L, a measurable activity concentration will not be achieved, even after 90 h of measurement (Figure 3). Therefore, it is necessary to increase the sampling volume in order to reliably determine 226Ra at the sampling sites in this study. In this case, extending the measurement time will have little influence on the limits of detection.
The 222Rn concentrations in spring water in this study were several orders of magnitudes higher than that of 226Ra, which has also been observed in previous studies [7,33,42]. Therefore, the source of 222Rn in water is not a result of the decay of dissolved 226Ra. In addition, according to Tricca et al. [43], weathering of rocks is not a significant source of 222Rn since this requires a high weathering rate. Some previous studies have reported that the occurrence of 222Rn is primarily controlled by α-recoil of 222Rn from the rock balanced by its decay [43,44,45]. Since it has recently been reported that grain size, distribution of Uranium in the rocks, and geological factors (e.g., faults and fracturing) of the aquifer are also important for the generation of 222Rn in water [45,46,47], obtaining this information would lead to a more detailed discussion of the sources of 222Rn in this study. Furthermore, it is also important to measure the chemical composition of the rock and water, as 226Ra can be removed by adsorption reactions such as ion exchange at the rock–water boundary and coprecipitation reactions resulting in deposition of sulfate, etc. [2].
The results of periodic measurement at Site No. 15 (Figure 2) indicate no significant seasonal variation in 222Rn concentration throughout the year, although some previous studies [48,49] have reported seasonal variations in 222Rn concentration in water. The atmospheric temperature at the sampling site fluctuated over time (Ave. ± SD = 12.3 ± 10.6 °C with a coefficient of variation (CV) of 86%); however, no significant change in water temperature was observed (Ave. ± SD = 12.6 ± 2.6 °C with a CV of 20%). According to Kogawa [19], since the depth of aquifers in Hirosaki City are tens of meters to ~200 m, the water temperature was considered to be less affected by large atmospheric temperature fluctuations. In addition, although there were periods of high precipitation, the 222Rn concentration in the water remained almost constant without any dilution. Moreover, there is no seasonal variation in water quality at the spring water because EC had an arithmetic mean (±SD) of 314.5 ± 41.4 μS cm−1 with a CV of 13%, and pH was 6.5 ± 0.4 with a CV of 6%. EC increases with increasing water temperature, which is reported by Hanya and Ogura [50]. Therefore, as changes in water temperature were small, the changes in EC were also considered to be small. However, the scope of this study is limited by the measurements made (outlined in Table 2) and as a result of the lack of detailed information on the depths of the spring water sources as well as their geological and chemical compositions. Obtaining these details in the future may provide additional information. In particular, measuring chemical composition such as ion concentrations and total dissolved solids, which are known to influence the behavior of 226Ra [2,17], the parent nuclide of 222Rn, in water could provide a better indication of the behavior of these radionuclides in groundwater sources.
The conservative annual effective ingestion dose for 222Rn and 226Ra obtained in this study of 8 μSv is significantly smaller than the estimated overall annual effective dose of 2.2 mSv from natural radiation (=2.2 mSv) to the Japanese population [41]. The WHO has adopted a pragmatic and conservative approach with an individual dose criterion of 0.1 mSv for the annual consumption of drinking water, regardless of the origin of radionuclides [13]. The evaluated annual effective dose accounts for 8% of this WHO criterion. It is, therefore, important to carefully investigate other radionuclides as well in the future.

5. Conclusions

This article described the results of measurements of 222Rn and 226Ra concentrations in spring water, in Hirosaki City, Aomori Prefecture, located in the northern part of Honshu Island in the Japanese archipelago. Spring water samples were collected from August 2016 to September 2016, at 15 locations that are known drinking water supplies and where sampling was possible. In addition, at one of these sites (Site No. 15), spring water samples were collected once a week from June 2016 to June 2017, to observe the seasonal variation of radon concentration. Results indicate that the measured 222Rn concentrations (=12.7 ± 6.1 Bq L−1) and 226Ra concentrations (<0.019–0.022 Bq L−1) did not exceed the reference values of other international organizations. In addition, the results of periodic measurements at Site No. 15 demonstrated no seasonal variation in 222Rn concentrations throughout the year. Finally, the conservative annual effective ingestion dose for 222Rn and 226Ra obtained in this study (8 μSv) is smaller than the Japanese population dose arising from natural radiation. However, this dosage accounts for 8% of the World Health Organization’s individual dosing criterion of 0.1 mSv. Therefore, the authors suggest that the contribution from other radionuclides be evaluated as well in the future.

Author Contributions

Conceptualization, R.Y., M.H. and S.T.; methodology, R.Y., M.H. and S.T.; validation, R.Y., M.H. and H.T.; formal analysis, R.Y., M.H., T.T. (Tomomi Tabe) and Y.N.; investigation, R.Y., M.H., T.T. (Tomomi Tabe), Y.T. (Yuki Tamakuma), T.S. (Takahito Suzuki), K.K., T.T. (Takakiyo Tsujiguchi), Y.T. (Yoshiki Tateyama), E.D.N., A.O., Y.N., C.K., H.T., K.I., N.A. and T.S. (Tetsuya Sanada); resources, M.H. and S.T.; data curation, R.Y., M.H., T.T. (Tomomi Tabe) and Y.N.; writing—original draft preparation, R.Y.; writing—review and editing, R.Y., M.H., K.K., H.T., K.I., Y.Y., N.A., T.S. (Tetsuya Sanada) and S.T.; visualization, R.Y., M.H. and T.T. (Tomomi Tabe); supervision, M.H., Y.Y. and S.T.; project administration, M.H. and S.T.; funding acquisition, M.H. and S.T. All authors have read and agreed to the published version of the manuscript.

Funding

This research was funded by the Japan Society for the Promotion of Science KAKENHI, Grant Number 15K08766, and the Hirosaki University Institutional Research Grant.

Institutional Review Board Statement

Not applicable.

Informed Consent Statement

Not applicable.

Data Availability Statement

Not applicable.

Conflicts of Interest

The authors declare no conflict of interest.

References

  1. World Health Organization (WHO). WHO Handbook on Indoor Radon; WHO Press: Geneva, Switzerland, 2009; pp. 1–94. [Google Scholar]
  2. Tomita, J. Radium isotopes in saline groundwaters. J. Hot Spring Sci. 2014, 64, 252–266, (In Japanese with English abstract). [Google Scholar]
  3. Narazaki, Y. The feature and distribution of radon concentration in groundwater in Fukuoka Prefecture. Radioisotopes 2005, 54, 407–415. (In Japanese) [Google Scholar] [CrossRef]
  4. Trautmannsheimer, M.; Schindlmeier, W.; Hübel, K. Radon exposure levels of the staff in the drinking water supply facilities in Bavaria, Germany. Int. Congr. Ser. 2002, 1225, 81–86. [Google Scholar] [CrossRef]
  5. Abdallah, S.M.; Habib, R.R.; Nuwayhid, R.Y.; Chatila, M.; Katul, G. Radon measurements in well and spring water in Lebanon. Radiat. Meas. 2007, 42, 298–303. [Google Scholar] [CrossRef]
  6. Le, C.H.; Huynh, N.P.T.; Nguyen, V.T.; Le, Q.B. Radon and radium concentrations in drinkable water supplies of the Thu Duc region in Ho Chi Minh City, Vietnam. Appl. Radiat. Isot. 2015, 105, 219–224. [Google Scholar] [CrossRef] [PubMed]
  7. Fonollosa, E.; Peñalver, A.; Borrull, F.; Aguilar, C. Radon in spring waters in the south of Catalonia. J. Environ. Radioact. 2016, 151, 275–281. [Google Scholar] [CrossRef]
  8. Hosoda, M.; Nugraha, E.D.; Akata, N.; Yamada, R.; Tamakuma, Y.; Sasaki, M.; Kelleher, K.; Yoshinaga, S.; Suzuki, T.; Rattanapongs, C.P.; et al. A unique high natural background radiation area–Dose assessment and perspectives. Sci. Total Environ. 2021, 750, 142346. [Google Scholar] [CrossRef] [PubMed]
  9. List of Classifications. Available online: https://monographs.iarc.who.int/list-of-classifications (accessed on 5 December 2021).
  10. Environmental Protection Agency. National Primary Drinking Water Regulations. Radionuclides; Proposed Rule; In Federal Register; Federal Information Center: New Orleans, LA, USA, 1991; Volume 56, p. 33051. [Google Scholar]
  11. National Research Council (NRC). Risk Assessment of Radon in Drinking Water; National Academies Press (US): Washington, DC, USA, 1999; p. 76. [Google Scholar]
  12. Japanese Society of Health Physics (JHPS) Planning Committee. Japanese Society of Health Physics Task Group Report Series; Japanese Society of Health Physics: Tokyo, Japan, 2004; Volume 2, pp. 1–113. (In Japanese) [Google Scholar]
  13. World Health Organization (WHO). Guidelines for Drinking-Water Quality, 4th ed.; World Health Organization: Geneva, Switzerland, 2017; pp. 1–541. [Google Scholar]
  14. The Council of the European Union. Council of the European Union. Council Directive 2013/51/Euratom of 22 October 2013 Laying Down Requirements for the Protection of the Health of the General Public with Regard to Radioactive Substances in Water Intended for Human Consumption. In Official Journal of the European Union; Publication Office of the European Union: Luxembourg, 2013; Volume 56, pp. 12–21. [Google Scholar]
  15. Environmental Protection Agency. National Primary Drinking Water Regulations. Radionuclides; Notice of Data Availability; Proposed Rule; In Federal Register; Federal Information Center: New Orleans, LA, USA, 2000; Volume 65, pp. 21583–21584. [Google Scholar]
  16. Yasuoka, Y.; Shinogi, M. Determination of radon concentrations in natural water in the Rokko area (Japan) and evaluation of its effective dose. Radioisotopes 2000, 49, 551–557. [Google Scholar] [CrossRef]
  17. Tomita, J.; Zhang, J.; Yamamoto, M. Radium isotopes (226Ra and 228Ra) in Na–Cl type groundwaters from Tohoku District (Aomori, Akita and Yamagata Prefectures) in Japan. J. Environ. Radioact. 2014, 137, 204–212. [Google Scholar] [CrossRef]
  18. Nemoto, N.; Ujiie, Y. Geology of Aomori Prefecture. In Daichi; Takano, K., Shouji, A., Eds.; Tohoku Geotechnical Consultants Association: Miyagi, Japan, 2009; pp. 52–68, (In Japanese). Available online: https://tohoku-geo.ne.jp/information/daichi/img/50a/52.pdf (accessed on 18 January 2022).
  19. Kogawa, K. Chapter 1 Nature of Tsugaru. In A New Version of History of Hirosaki City (Shinpen Hirosaki-Shishi); Editorial board of “A new version of history of Hirosaki City”, Ed.; Hirosaki City Office: Aomori, Japan, 2001; pp. 111–147, (In Japanese). Available online: https://trc-adeac.trc.co.jp/WJ11D0/WJJS05U/0220205100/0220205100100000?dtl=all (accessed on 19 January 2022).
  20. Seamless Digital Geological Map of Japan V2 (Geological Survey of Japan, National Institute of Advanced Industrial Science and Technology). Available online: https://gbank.gsj.jp/seamless/index_en.html (accessed on 19 January 2022).
  21. “Meisui-100-sen” (100 Best Waters) Certified by the Ministry of the Environment in 1985. (In Japanese). Available online: https://water-pub.env.go.jp/water-pub/mizu-site/meisui/data/index.asp?info=4 (accessed on 4 December 2021).
  22. Tanaka, R.; Araki, S.; Yasuoka, Y.; Mukai, T.; Ohnuma, S.; Ishikawa, T.; Fukuhori, N.; Sanada, T. A simplified method for improved determination of radon concentration in environmental water samples. Radioisotopes 2013, 62, 423–438. [Google Scholar] [CrossRef] [Green Version]
  23. Yasuoka, Y.; Ishii, T.; Kataoka, Y.; Kubo, T.; Suda, H.; Tokonami, S.; Ishikawa, T.; Shinogi, M. Determination of radon concentration in water using liquid scintillation counter. Radioisotopes 2004, 53, 123–131. [Google Scholar] [CrossRef]
  24. Yasuoka, Y.; Ishikawa, T.; Fukuhori, N.; Tokonami, S. Comparison of simplified liquid scintillation counter (Triathler) with conventional liquid scintillation counter in the measurement of radon concentration in water. J. Hot Spring Sci. 2009, 59, 11–21. [Google Scholar]
  25. Kelleher, K.; Wong, J.; León-Vintró, L.; Currivan, L. International Rn-222 in drinking water interlaboratory comparison. Appl. Radiat. Isot. 2017, 126, 270–272. [Google Scholar] [CrossRef] [PubMed]
  26. Hosoda, M.; Kelleher, K.; Murray, M.; McGinnity, P.; Hanley, O.; Wong, J.; Currivan, L. Generation and migration of 222Rn in BaSO4 precipitate samples and implications for their analysis for 226Ra by gamma spectrometry. Radiat. Environ. Med. 2016, 5, 22–28. [Google Scholar]
  27. United Nation Scientific Committee on the Effects of Atomic Radiation (UNSCEAR). UNSCEAR 2000 Report to the General Assembly, with Scientific Annexes; United Nations: New York, NY, USA, 2000; Volume I. [Google Scholar]
  28. Kinahan, A.; Hosoda, M.; Kelleher, K.; Tsujiguchi, T.; Akata, N.; Tokonami, S.; Currivan, L.; León Vintró, L. Assessment of radiation dose from the consumption of bottled drinking water in Japan. Int. J. Environ. Res. Public Health 2020, 17, 4992. [Google Scholar] [CrossRef]
  29. International Commission on Radiological Protection (ICRP). Occupational Intakes of Radionuclides: Part 3. ICRP Publication 137. Ann. ICRP 2017, 46, 1–487. [Google Scholar] [CrossRef]
  30. Ishii, T.; Horiuchi, K. Radon in natural water. In Radon in Environment; Shimo, M., Tsujimoto, T., Eds.; Electron Science Institute: Osaka, Japan, 1992; pp. 160–166. (In Japanese) [Google Scholar]
  31. Tokuyama, H.; Igarashi, S. Radon concentration in drinking water in Wakasa Area, Fukui Prefecture. In Proceedings of the Scientific Meeting on "Radon in Natural Waters"; Fukui, M., Horiuchi, K., Eds.; Research Reactor Institute, Kyoto University: Kyoto, Japan, 1997; pp. 15–20. (In Japanese). [Google Scholar]
  32. Furuta, S. Radon in water sample around Ningyo Toge Area. In Proceedings of the Scientific Meeting on "Radon in Natural Waters"; Fukui, M., Horiuchi, K., Eds.; Research Reactor Institute, Kyoto University: Kyoto, Japan, 1997; pp. 37–42. (In Japanese). [Google Scholar]
  33. Onishchenko, A.; Zhukovsky, M.; Veselinovic, N.; Zunic, Z.S. Radium-226 concentration in spring water sampled in high radon regions. Appl. Radiat. Isot. 2010, 68, 825–827. [Google Scholar] [CrossRef]
  34. Beyermann, M.; Bünger, T.; Schmidt, K.; Obrikat, D. Occurrence of natural radioactivity in public water supplies in Germany: 238U, 234U, 235U, 228Ra, 226Ra, 222Rn, 210Pb, 210Po and gross α activity concentrations. Radiat. Prot. Dosim. 2010, 141, 72–81. [Google Scholar] [CrossRef] [Green Version]
  35. Wu, Y.-Y.; Ma, Y.-Z.; Cui, H.-X.; Liu, J.-X.; Sun, Y.-R.; Shang, B.; Su, X. Radon Concentrations in Drinking Water in Beijing City, China and Contribution to Radiation Dose. Int. J. Environ. Res. Public Health 2014, 11, 11121–11131. [Google Scholar] [CrossRef] [Green Version]
  36. Kanda, Y. Investigation of the freely available easy-to-use software ‘EZR’ for medical statistics. Bone Marrow Transplant. 2013, 48, 452–458. [Google Scholar] [CrossRef] [Green Version]
  37. United Nation Scientific Committee on the Effects of Atomic Radiation (UNSCEAR). UNSCEAR 1977 Report to the General Assembly, with Annexes; United Nations: New York, NY, USA, 1977. [Google Scholar]
  38. Plant, J.A.; Saunders, A.D. The radioactive earth. Radiat. Prot. Dosim. 1996, 68, 25–36. [Google Scholar] [CrossRef]
  39. Furukawa, M.; Shingaki, R. Terrestrial gamma radiation dose rate in Japan estimated before the 2011 Great East Japan Earthquake. Radiat. Emerg. Med. 2012, 1, 11–16. [Google Scholar]
  40. Minato, S. Revision of a Database on Terrestrial γ-Ray Dose Rates, Radiation Earth Science Laboratory Special Contribution Series SCS-0110; Radiation Earth Science Laboratory: Nagoya, Japan, 2015. (In Japanese) [Google Scholar]
  41. Omori, Y.; Hosoda, M.; Takahashi, F.; Sanada, T.; Hirao, S.; Ono, K.; Furukawa, M. Japanese population dose from natural radiation. J. Radiol. Prot. 2020, 40, R99–R140. [Google Scholar] [CrossRef]
  42. Vinson, D.S.; Tagma, T.; Bouchaou, L.; Dwyer, G.S.; Warner, N.R.; Vengosh, A. Occurrence and mobilization of radium in fresh to saline coastal groundwater inferred from geochemical and isotopic tracers (Sr, S, O, H, Ra, Rn). Appl. Geochemistry. 2013, 38, 161–175. [Google Scholar] [CrossRef]
  43. Tricca, A.; Porcelli, D.; Wasserburg, G.J. Factors controlling the groundwater transport of U, Th, Ra, and Rn. Proc. Indian Acad. Sci. (Earth Planet. Sci.). 2000, 109, 95–108. [Google Scholar] [CrossRef] [Green Version]
  44. Krishnaswami, S.; Bhushan, R.; Baskaran, M. Radium isotopes and 222Rn in shallow brines, Kharaghoda (India). Chem. Geo. 1991, 87, 125–136. [Google Scholar] [CrossRef]
  45. Vengosh, A.; Coyte, R.M.; Podgorski, J.; Johnson, T.M. A critical review on the occurrence and distribution of the uranium- and thorium-decay nuclides and their effect on the quality of groundwater. Sci. Total Environ. 2022, 808, 151914. [Google Scholar] [CrossRef]
  46. Miklyaev, P.S.; Petrova, T.B.; Shchitov, D.V.; Sidyakin, P.A.; Murzabekov, M.A.; Marennyy, A.M.; Nefedov, N.A.; Sapozhnikov, Y.A. The results of long-term simultaneous measurements of radon exhalation rate, radon concentrations in soil gas and groundwater in the fault zone. App. Radiat. Isot. 2021, 167, 109460. [Google Scholar] [CrossRef]
  47. Sukanya, S.; Noble, J.; Joseph, S. Factors controlling the distribution of radon (222Rn) in groundwater of a tropical mountainous river basin in southwest India. Chemosphere. 2021, 263, 128096. [Google Scholar] [CrossRef]
  48. Somogyi, G.; Lénárt, L. Time-integrated radon measurements in spring and well waters by track technique. Int. J. Radiat. Appl. Instrum. Part D 1986, 12, 731–734. [Google Scholar] [CrossRef]
  49. Ono, M.; Shimada, J.; Ichikawa, T.; Tokunaga, T. Evaluation of groundwater discharge in Lake Ezu, Kumamoto, based on radon in water. Japanese J. Limnnology 2011, 72, 193–210, (In Japanese with English abstract). [Google Scholar] [CrossRef]
  50. Hanya, T.; Ogura, N. Survey of water quality (Suishitsuchousa-hou), 3rd ed.; Maruzen: Tokyo, Japan, 1995; pp. 1–335. (In Japanese) [Google Scholar]
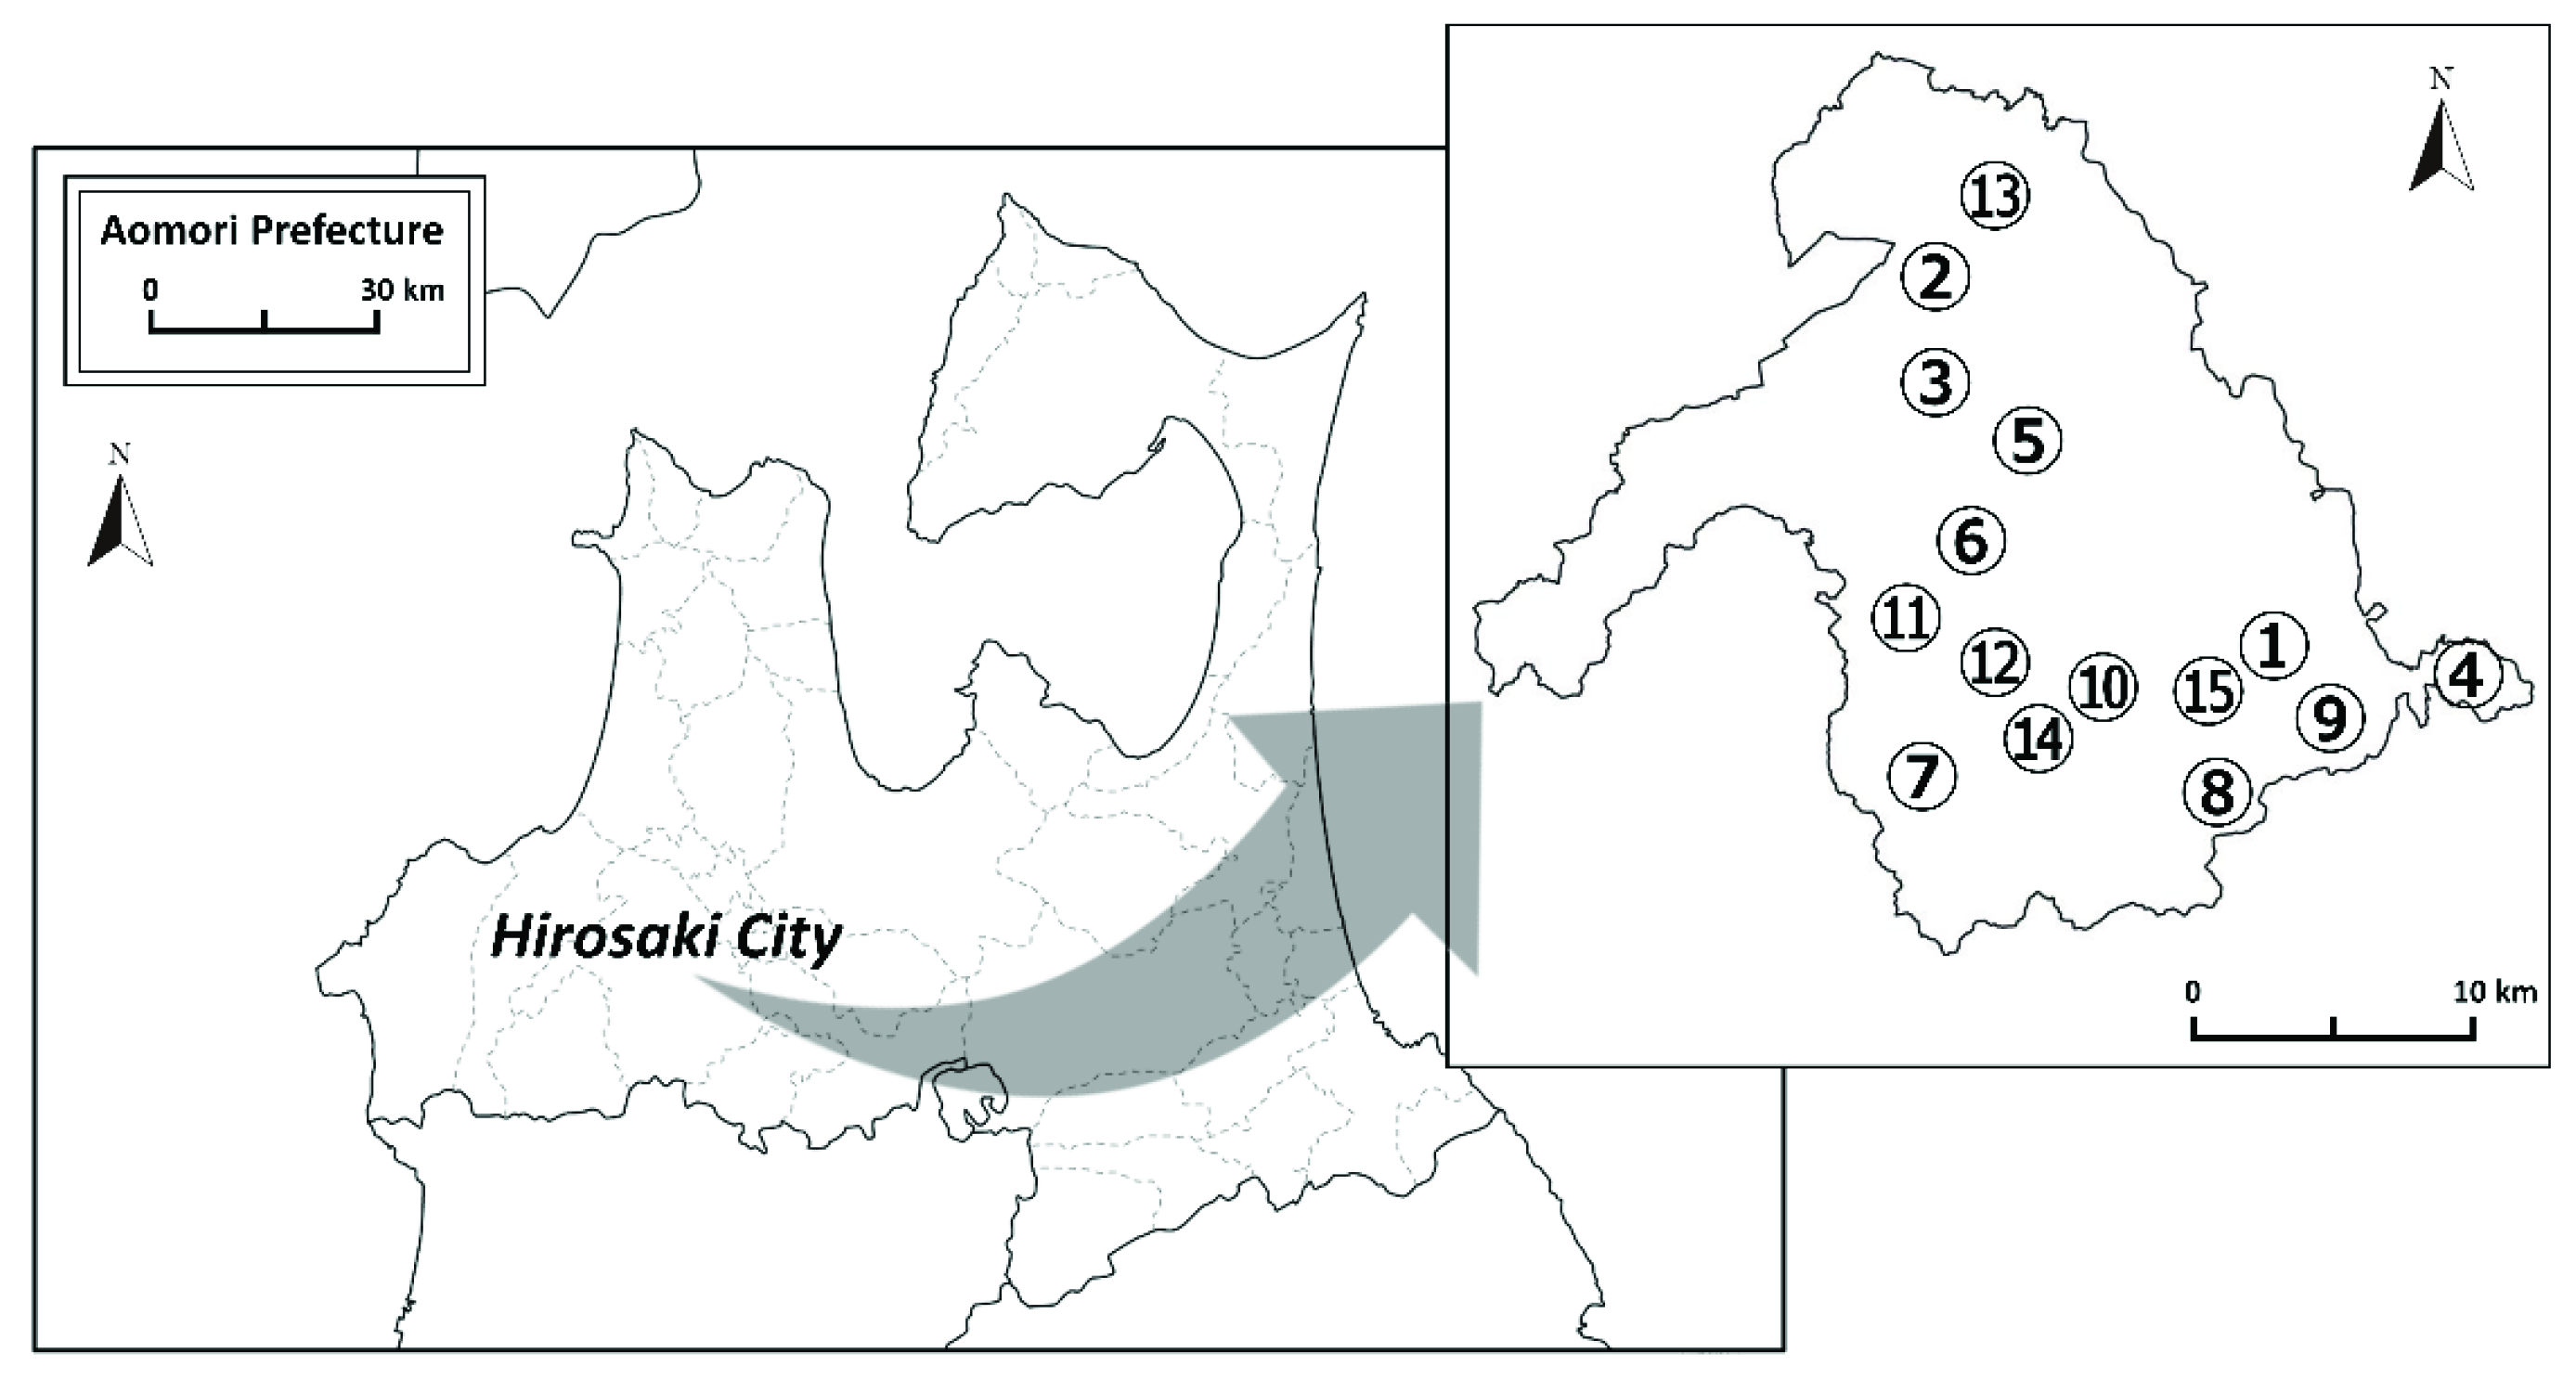
Figure 1. Locations of the sampling sites in Hirosaki City, Aomori Prefecture.
Ijerph 19 01758 g001
Figure 2. Periodic measurement results at Site No. 15.
Ijerph 19 01758 g002
Figure 3. Relationship between measurement time and MDA. The red dashed line in the figure shows the radioactivity of the sample (=0.084 Bq L−1) when the sampling volume was 24 L, and the red line shows the radioactivity of the sample (=0.014 Bq L−1) when the sampling volume was 4 L. The measurement time in this study was 80,000 s (=22.2 h).
Ijerph 19 01758 g003
Table 1. The basement geology and sampling dates of the 15 sampling sites.
Site No.Basement GeologySampling Date
1Alluvium4 August 2016
2Dacite–Andesite Lava (after the Pliocene)17 August 2016
3Dacite–Andesite Lava (after the Pliocene)18 August 2016
4Alluvium21 August 2016
5Dacite–Andesite Lava (after the Pliocene)22 August 2016
6Dacite–Andesite Lava (after the Pliocene)25 August 2016
7Andesite Lava/Pyroclastic Rock (middle-upper Miocene)29 August 2016
8Terrace deposit5 September 2016
9Alluvium7 September 2016
10Terrace Deposit8 September 2016
11Pyroclastic Rock (after middle Pleistocene)15 September 2016
12Pyroclastic Rock (after middle Pleistocene)16 September 2016
13Pyroclastic Rock (after middle Pleistocene)19 September 2016
14Andesite Lava/Pyroclastic Rock (middle-upper Miocene)26 September 2016
15Alluvium17 June 2016–21 June 2017
Table 2. Measurement results in the 15 sampling sites.
Site No.pHEC
(μS cm1)
Water Temp.
(°C)
Atm. Temp.
(°C)
222Rn Conc. a
(Bq L−1)
226Ra Conc. b
(Bq L−1)
16.525015.227.516.5 ± 1.0<MDC (0.0096)
27.215314.714.76.7 ± 0.2<MDC (0.0080)
36.48619.724.913.9 ± 0.90.0098 ± 0.0031
46.211121.725.711.5 ± 0.7<MDC (0.012)
56.7897.422.55.3 ± 0.5<MDC (0.0089)
66.51006.924.46.3 ± 1.0<MDC (0.0085)
75.722012.528.016.6 ± 0.6<MDC (0.0099)
86.61199.922.111.0 ± 0.8<MDC (0.0099)
96.6689.720.926.7 ± 1.10.0093 ± 0.0030
106.118511.320.18.0 ± 0.7<MDC (0.0095)
115.814010.322.118.8 ± 0.80.022 ± 0.0071
126.21989.720.618.6 ± 1.2<MDC (0.0097)
135.91649.917.87.9 ± 0.3<MDC (0.0082)
146.224010.219.17.7 ± 1.0<MDC (0.0096)
15 c5.5–7.2147–3708.8–16.5−4.3–33.412.2–18.6
(15.3 ± 1.2)
<MDC (0.019) d
a Measured values and uncertainties (k = 1) are indicated (Site No. 1–14). In Site No. 15, the range during the measurement period is indicated, and the arithmetic mean and SD are indicated in parentheses. b Measured values and uncertainties (k = 1) or MDCs are indicated. c The data quantity for measurement items’ expected 226Ra concentration is 50. 226Ra concentration is the result from a sample (sampling date: 10 September 2016). d This MDC, which is about twice as high as MDCs at other sites, results from its relatively low yield (=47%).
Table 3. The annual effective ingestion dose for 222Rn and 226Ra.
Site No.The Annual Effective Dose (μSv)
222Rn226RaTotal
18 ± 0.5<1<10
23 ± 0.1<1<5
37 ± 0.51 ± 0.38 ± 1
46 ± 0.4<2<7
53 ± 0.2<1<4
63 ± 0.5<1<4
78 ± 0.3<1<10
86 ± 0.4<1<7
913 ± 0.51 ± 0.314 ± 1
104 ± 0.3<1<5
119 ± 0.42 ± 0.712 ± 1
129 ± 0.6<1<11
134 ± 0.2<1<5
144 ± 0.5<1<5
158 ± 0.005<2<10
Table 4. A comparison of 222Rn concentrations in drinking water.
CountryLocationDescription222Rn Conc.
(Bq L−1)
Ref.
Japan35 sites of
“Meisui-100-sen”
Spring water0.24–98.91
Ave. = 12.98
[30]
Wakasa area, FukuiTap water1.2–104
Median = 11.2
[31]
Rokko area, HyogoWell water2.6–78.6[16]
Ningyo-Toge area, Okayama and TottoriTap/well/spring water0.1–230[32]
RussiaUralDrinking water57–92[33]
SerbiaNiska BanjaDrinking water430 ± 46[33]
SpainCataloniaGroundwater1.4–104.9[7]
GermanyDrinking water<1.3–1800[34]
ChinaBeijingPublic water<0.268–29.00[35]
Well water1.45–49.00[35]
JapanHirosaki, AomoriSpring water5.3–26.7
Ave. ± SD = 12.7 ± 6.1
This study
Publisher’s Note: MDPI stays neutral with regard to jurisdictional claims in published maps and institutional affiliations.