Article

Carbon Isotopic Evidence for Gas Hydrate Release and Its Significance on Seasonal Wetland Methane Emission in the Muli Permafrost of the Qinghai-Tibet Plateau

1
The Key Laboratory of Unconventional Oil & Gas Geology, China Geological Survey, Beijing 100083, China
2
School of Environmental Studies, China University of Geosciences, Wuhan 430074, China
3
Oil and Gas Survey, China Geological Survey, Beijing 100083, China
*
Author to whom correspondence should be addressed.
Int. J. Environ. Res. Public Health 2022, 19(4), 2437; https://doi.org/10.3390/ijerph19042437
Submission received: 12 January 2022 / Revised: 12 February 2022 / Accepted: 16 February 2022 / Published: 20 February 2022
(This article belongs to the Section Environmental Science and Engineering)

Abstract

:
In order to determine the significant role of gas hydrate in seasonal wetland methane emission at the drilling-affected permafrost, the carbon isotopic monthly field monitoring of methane (CH4), as well as carbon dioxide (CO2), emitted from near-surface soil and a gas hydrate drilling well (DK-8) was conducted in the Muli permafrost of the Qinghai-Tibet Plateau. The methane source effused from the well DK-8 was calculated as −25.9 ± 1.4‰ and −26.5 ± 0.5‰, respectively, by the Keeling and Miller Tans plots, with the carbon isotope fractionation (εC) between CO2 and CH4 from −25.3‰ to −32.1‰. The carbon isotopic signatures are indicative of thermogenic origin associated with gas hydrate dissociation. The near-surface soil-emitted methane has δ13CCH4 values between −52.0 ± 1.2‰ and −43.2 ± 1.8‰ with the heaviest in December and the lightest in July. Further, the εC values of near-surface soil-emitted gases were between 28.6‰ and 47.9‰, significantly correlated with the δ13CCH4 values. The linear correlation between εC and δ13CCH4 values indicated binary end-member of microbial and thermogenic sources control the seasonal variation of wetland methane emission. The thermogenically derived methane was identified as the dominant methane source in autumn and winter, compared with the increasing contribution of microbially derived methane in spring and summer. The finding provides reliable evidence for gas hydrate release on the seasonal wetland methane emission in the Muli permafrost affected by drilling activities. The combined application of εC and δ13CCH4 to distinguish thermogenic from biogenic methane is well established and powerful in complex environments, which can provide an improved constraint on source apportionment for wetland emitted methane in the permafrost of the Qinghai-Tibet Plateau.

1. Introduction

Methane (CH4) is an important greenhouse gas that provides the second-largest contribution to historical global warming, with stronger climate warming potential than carbon dioxide (CO2) [1]. Global atmospheric methane concentrations have increased rapidly since 2007 at a renewed growth rate of 6.9 ± 2.7 ppb yr−1 [2]. Wetland methane emissions, the largest natural source in the global CH4 budget, play an emerging role in driving 21st-century climate change [3]. The carbon pools in permafrost regions are large reservoirs susceptible to climate change and can drive positive feedback to climate warming [4,5,6,7,8]. Methane emission in the thawing permafrost is key to the greenhouse gas budget on climate-relevant timescales [9]. Therefore, the wetland methane emission process strongly associated with wetland carbon cycling in permafrost regions is of great significance to understanding climate feedback and mitigating global warming.
The Qinghai-Tibet Plateau is the largest high-altitude permafrost region on Earth, with a wetland area covering approximately 130,000 km2 [10]. In addition, substantial amounts of soil organic carbon [11,12,13] and thermogenic hydrocarbons in gas hydrates [14,15,16] are stored in the Qinghai-Tibet Plateau. Compared with conventional peat wetlands, the alpine wetlands emission of the Qinghai-Tibet Plateau is unique and complex under global climate warming [17], which is highly sensitive to temperature change [18,19,20], thawing of permafrost [21,22,23], and the destabilization of gas hydrates [24,25,26]. As a result, the average atmospheric methane content in the Waliguan of the Qinghai-Tibet Plateau was reported as 1931 ± 3 ppb in 2019 [27] higher than the global average content (1877 ± 2 ppb), with an annual increasing rate of 7.7 ppb during the past ten years [27] compared to the global annual increasing rate of 7.3 ppb. Source identification of wetland methane emission is an important issue for understanding the processes and mechanisms of wetland methane emission and carbon cycling in the Qinghai-Tibet Plateau.
Previous studies asserted that the source of wetland methane emission above the Muli gas hydrate reservoir in the Qilian Mountain permafrost could be hydrocarbon gases released by subterranean gas hydrates [14,26,28]. However, whether dissociation of gas hydrate when the p-T condition changes caused by natural process or anthropogenic activities has a significant impact on the wetland methane emission has not been fully constrained. The methane derived from gas hydrate release can effuse towards the near-surface soil through micro-seepage [29] and may have an impact on the surface carbon circulation system, forming a new source of methane emission from wetland soils in permafrost regions. Recent research of 42 monitoring sites over an area of 3 km2 in the Muli permafrost [30] reported some δ13CCH4 values of free gas in the near-surface soil were between −48.0‰ and −42.2‰, which indicated methane of thermogenic origin. The relationship between the emission by soils and effusion from gas hydrates was determined through correlation analyses of soil-adsorbed hydrocarbons [30,31]. Nevertheless, it still lacks direct and sufficient evidence for the effect of methane from gas hydrate dissociation on soil methane emission.
The distinct δ13CCH4 signatures are frequently used as a useful constraint to distinguish between thermogenic and biogenic methane sources. The thermogenic methane is generally enriched in 13C compared with biogenic methane that has δ13CCH4 values more negative than −50‰ and up to −100‰ [32]. However, situations, such as the mixing of different natural gases or where extreme substrate depletion and CH4 consumption by oxidation, could produce ambiguous methane isotope signals [32,33]. The carbon isotope separation (εC) between CH4 and CO2 (defined by εC≈δ13CCO213CCH4) can remain consistent [32] despite large variations in the actual δ13CCH4 values and indicative of the particular methanogenic pathway. Accordingly, the combination of δ13CCH4 with εC values may reliably identify methane sources in complex environments.
The grid-monitoring results of near-surface soil samples at the gas hydrate reservoir region in the Muli permafrost [31] showed the intensive drilling site (DK-1,2,3,7,8,9, 12–13) was a unique area where the soil-emitted methane has lower δ13CCH4 (−65‰ to −80‰) in May whereas relatively higher δ13CCH4 (−54‰ to −40‰) in August and higher δ13CCH4 (−38‰ to −26‰) in October. Therefore, we conducted a twelve-month field monitoring of stable carbon isotopic compositions of CO2 and CH4 in the free gas of the near-surface soil at the above intensive drilling site in the Muli permafrost in 2017. The hydrocarbon gases emitted from one of the drilling wells (DK-8) were also monitored at the same time to determine their stable carbon isotopic signatures. This study is aimed to provide new evidence for gas hydrate release as a significant source of wetland methane emission in the Muli permafrost, to reveal the effect of gas hydrate release on wetland methane seasonal emission, and further, to imply the influence of anthropogenic activities, such as drilling, on wetland methane emission in the permafrost of the Qinghai-Tibet Plateau.

2. Materials and Methods
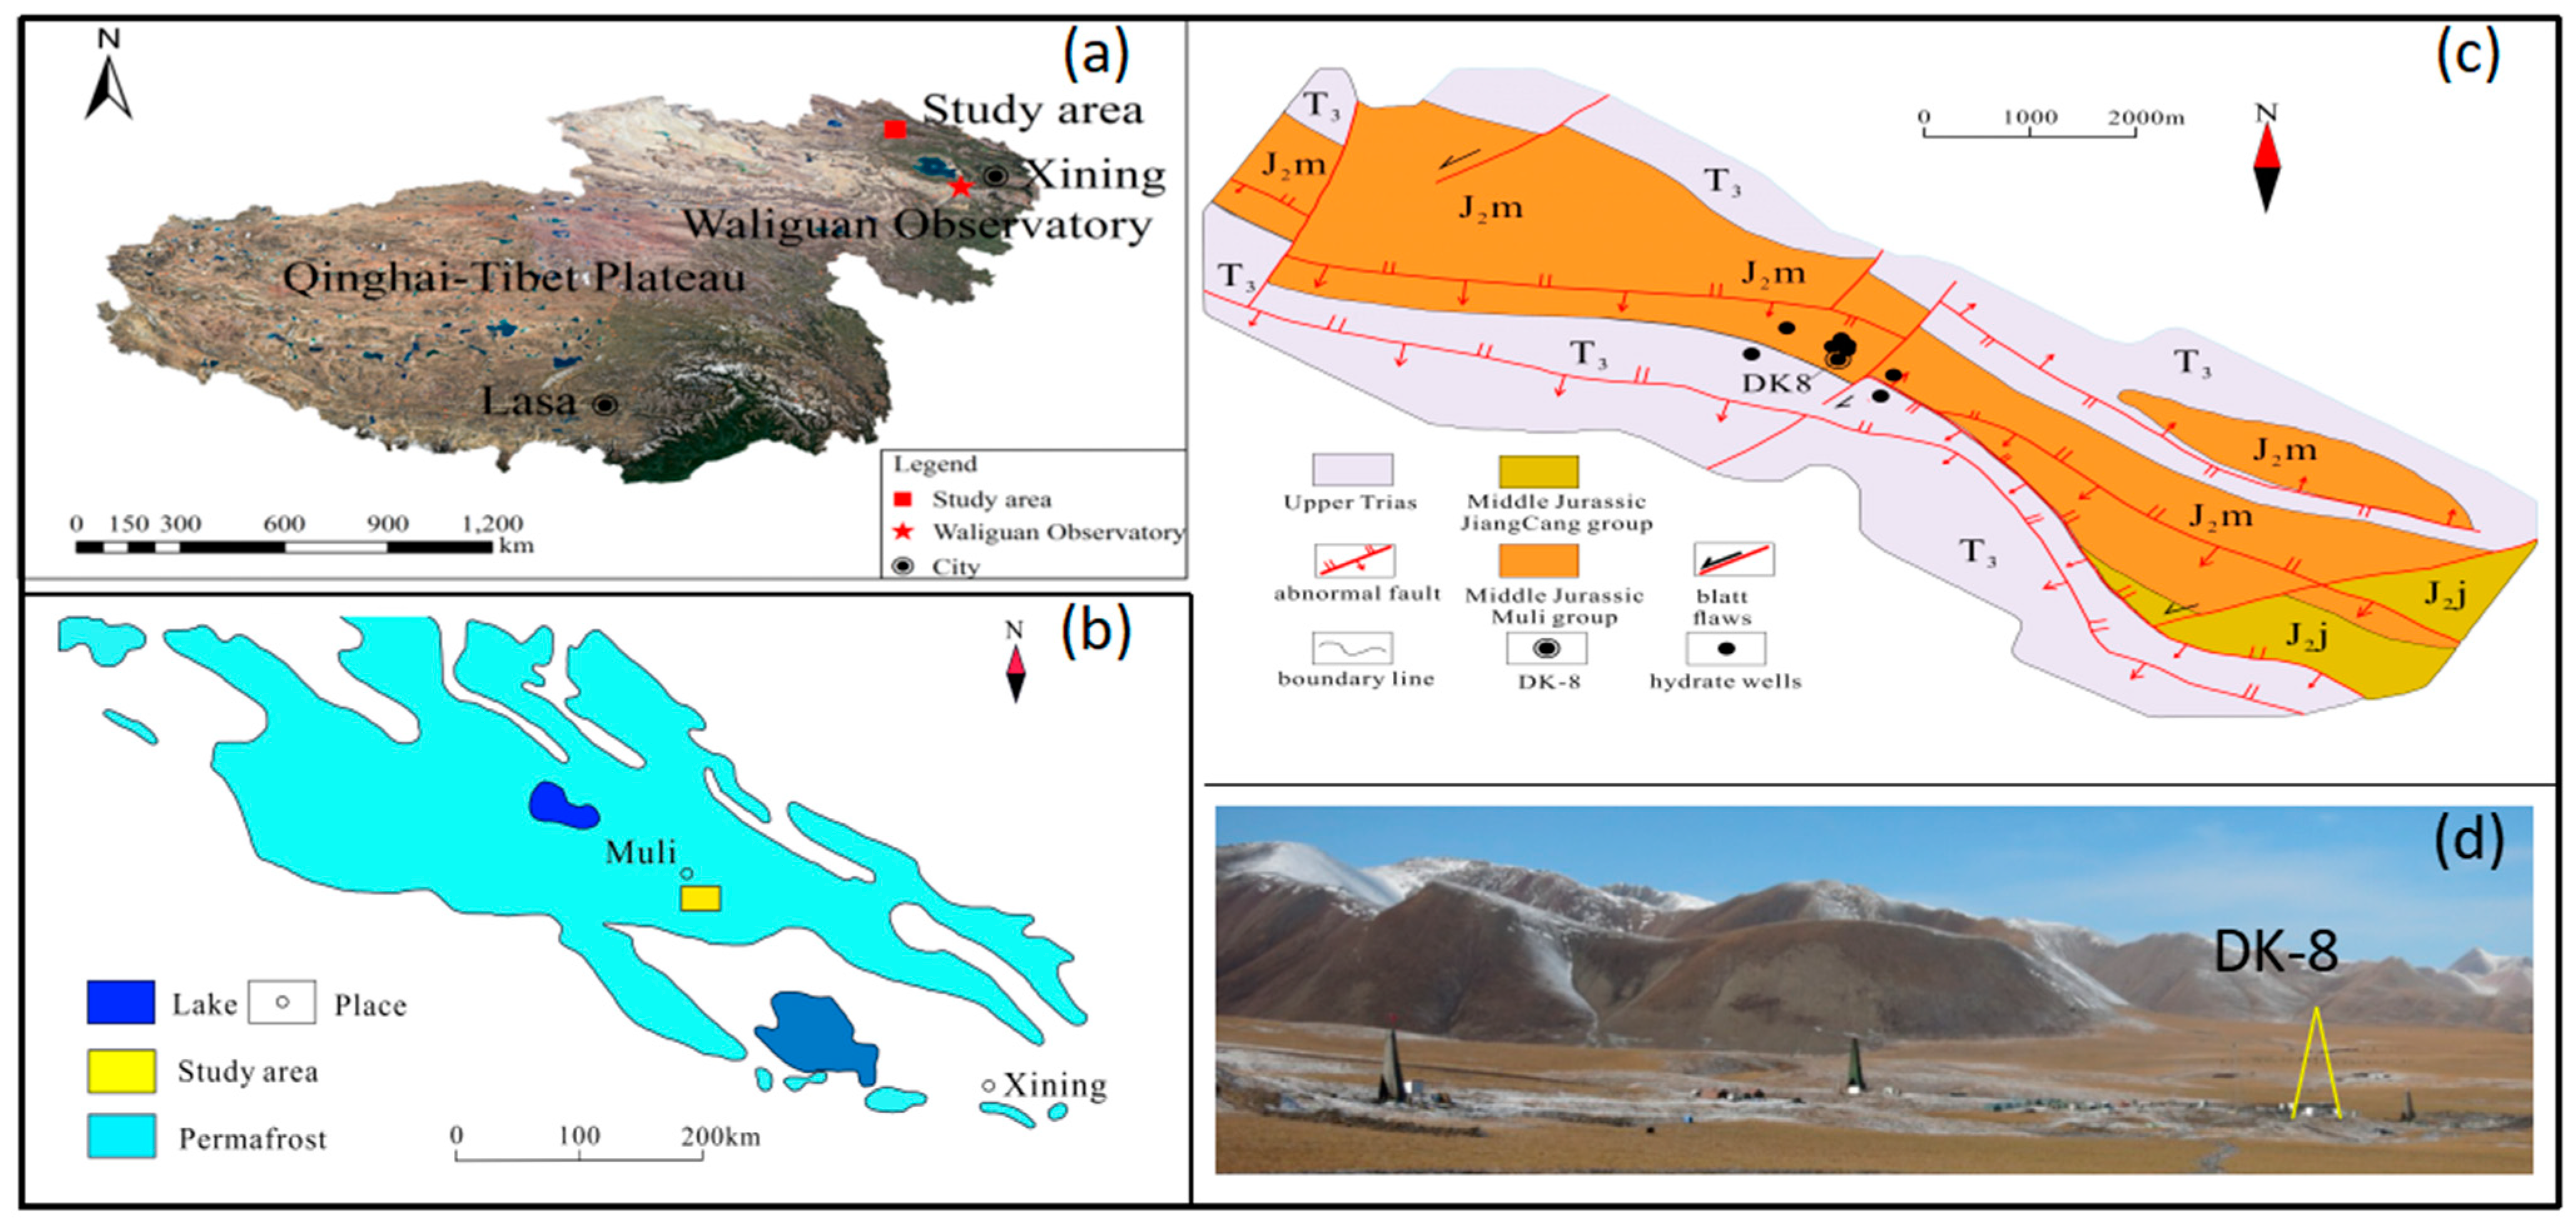
2.1. Study Area

The study area is located in the Muli permafrost of the Qilian Mountains in the northeastern margin of the Qinghai-Tibet Plateau (Figure 1a,b), with an altitude of approximately 4000–4300 m and an annual average temperature of −5.1 °C. The wetland ecosystem is dominated by alpine meadow, which is influenced by permafrost freezing and thawing driven by seasonal temperature variation. The alpine-typed permafrost covers an area of 1 × 10⁵ km2 in the Qilian Mountains, with a thickness regionally ranging from 60 to 95 m and an active layer of 1.5–2.0 m [34].
The study area is tectonically situated in the western Middle Qilian block formed during the Caledonian Movement (513–386 Ma), adjacent to the South Qilian structural zone [35], and it is also situated in the Muli depression of the south Qilian basin. The exposed strata are Quaternary, Middle Jurassic, and overturned Triassic, which thrust onto the Middle Jurassic. Large NW–SE trending thrust faults developed in the study area (Figure 1c). These thrusts or fractures may serve as paths for gas to migrate upwards from the deep layers, and some of the fractures may serve as temporary gas hydrate-bearing reservoirs [36].
Gas hydrate exploration and scientific drilling work have been performed in permafrost regions in the Qilian Mountains since 2000 [37,38]. A large amount of gas was released when the gas hydrate-bearing cores were extracted under air-tight conditions. Raman spectroscopy identified CH4 as the primary hydrate-forming gas, with secondary components of C2H6, C3H8, and CO2 [14]. The geological and geochemical field exploration work indicated the existence of natural gas hydrate in the target area [36,37,38,39]. The gas hydrate is a structure II gas hydrate, mainly stored in siltstone and mudstone of the Middle Jurassic Jiangcang Formation, and secondly, sandstone is unstable and discontinuous in distribution. The occurrence of gas hydrates is closely related to faults, and the burial depth is generally 133–396 m [40].

2.2. Field Monitoring Method

The monthly dynamic monitoring of methane in the free gas from the hydrate gas drilling well DK-8 and near-surface soil was conducted simultaneously in situ from January to December in 2017 in the study area. The monitoring frequency is once or twice a month.
The DK-8 well with a diameter of 16.8 cm was drilled to a depth of approximately 400 m, with the presence of gas hydrate and its associated anomalies mainly within intervals of 150–300 mbs (meter below surface), shown in Figure 2a. The core lithology is mainly composed of sandstone, siltstone, mudstone, and oily shale. The base of the permafrost is around 110 m, revealed by drilling, coexisting with underground ice around 70 mbs. The DK-8 was twice tested for exploring gas hydrates in 2011 and 2016, respectively. During the monitoring period, the mouth of the DK-8 was sealed, and the headspace gas can be only derived from the gas emission of the 150–300 mbs layers.
The free gas from the near-surface soil was monitored using a detachable cylindrical soil respiration chamber that was 14.5 cm in diameter and 53.5 cm in height (Figure 2b). The cylindrical chamber was embedded in a pre-excavated hole with a depth of 30 cm near the well DK-8. After sealing the chamber in the hole, the whole system was circulated with the surrounding soil only through the several sieve holes in the chamber wall 10–30 cm blew the ground. Disturbance from the mixing of air and soil gas through the soil surface was assumed to be negligible because of the fine texture and compact nature of the soil and gas-tight measurement chamber.

2.3. Measurements and Data Processing

The sampling ports from the well DK-8 and the soil chamber were connected, respectively, to different gas inlets of a portable Picarro isotope analyzer (G2201-i; Cavity Ring-Down Spectroscopy, Picarro, USA). On all sampling occasions, the contents (ppm) and carbon isotope composition (δ13C, ‰ vs. PDB) of CH4 together with CO2 were simultaneously measured in situ using the Picarro G2201-i isotope analyzer. The Picarro G2201-i was checked regularly against working standards, and adjustments were made before each field monitoring. The working standards used were a CH4 standard gas of 2 ppm and 10 ppm with the δ13C gradients of 0‰, −20‰, −40‰, and −65‰, and used CO2 standard gas of 300 ppm and 600 ppm with the δ13C gradient of 0‰, −10‰, −20‰, and −30‰, respectively. These standard gases were calibrated by the National Institute of Metrology, China.
The readings were collected under a high-accuracy CH4-CO2 compound mode at intervals of 5 min for a total duration of at least 4 h per monitoring. The performance drift of the instrument was checked during the continuous determination for 24 h. The content precision (5min, 1σ) is 5 ppb (+0.05% of reading) for CH4 and 200 ppb (+0.05% of reading) for CO2, with the guaranteed δ13C precision (5min, 1σ) <1.0‰ for CH4 and <0.2‰ for CO2. Moreover, the instrument itself has a temperature control function with an accuracy of 0.5%. The measurement can only be started when the temperature of the instrument chamber reaches 45 ℃, thus avoiding the interference of ambient temperature change.
The two gas inlets were alternately switched and measured in succession for each sampling and measurement. To avoid physical fluctuations caused by switching gas inlets, only the measured data during the intermediate 3-min stationary period were taken as valid data to calculate. All valid readings of the total duration per monitoring are calculated as mean ± standard error and presented as the final result for each measurement. The calculated measurements of CH4 and CO2 content, δ13CCH4 and δ13CCO2, as well as the calculated carbon isotope fractionation εC between CO2 and CH4C = δ13CCO2 − δ13CCH4) for the free gas of the DK-8 hydrate gas drilling well and the active soil layer are shown in Table 1.

3. Results

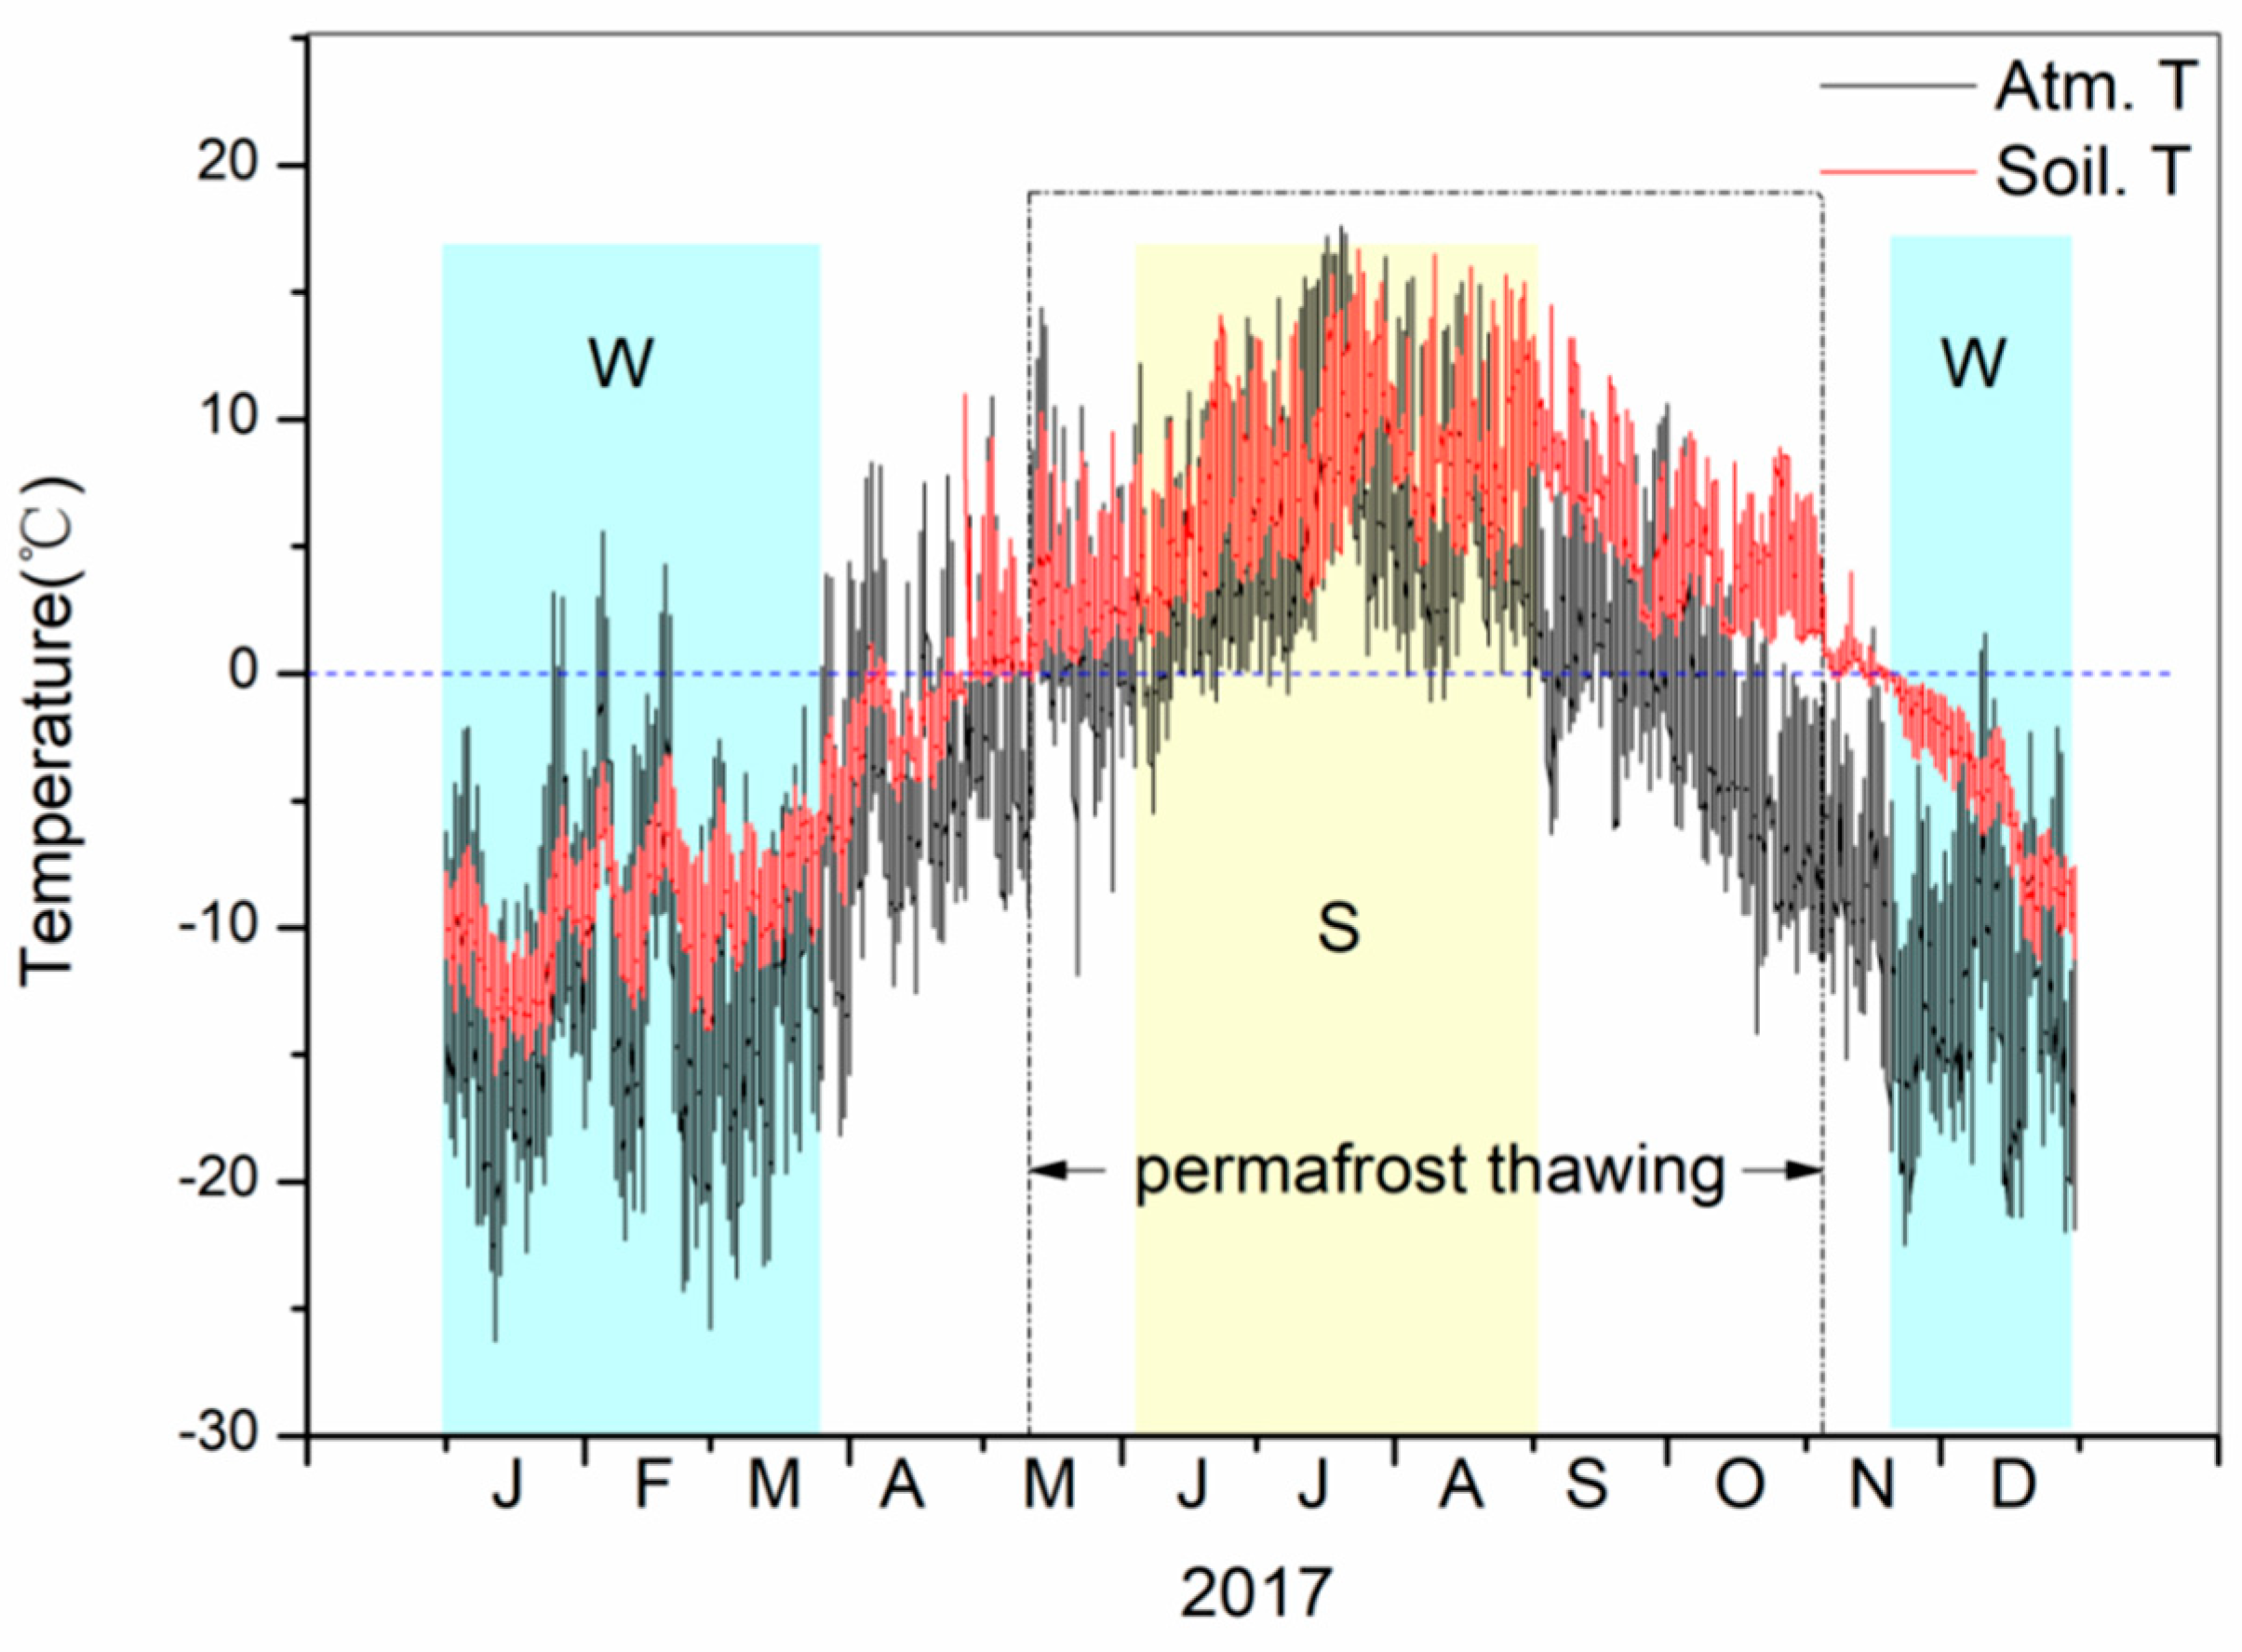
3.1. Monthly Temperature Variation of the Soil upper Active Layer

The monthly temperature variation of the soil’s upper active layer, as well as the low-level air, at the gas hydrate drilling area in the Muli permafrost is shown in Figure 3, based on the average daily monitoring data in 2017. The soil temperature varied with the atmospheric temperature in a range of −16–16 °C, lower than that of the atmospheric temperature (−25–18 °C). The soil temperature was observed above 0 °C first in early April and was always greater than 0 °C between May and October, which is the main period of permafrost thawing. The frozen period characterized by the soil temperature lower than 0 °C was from November to next April.

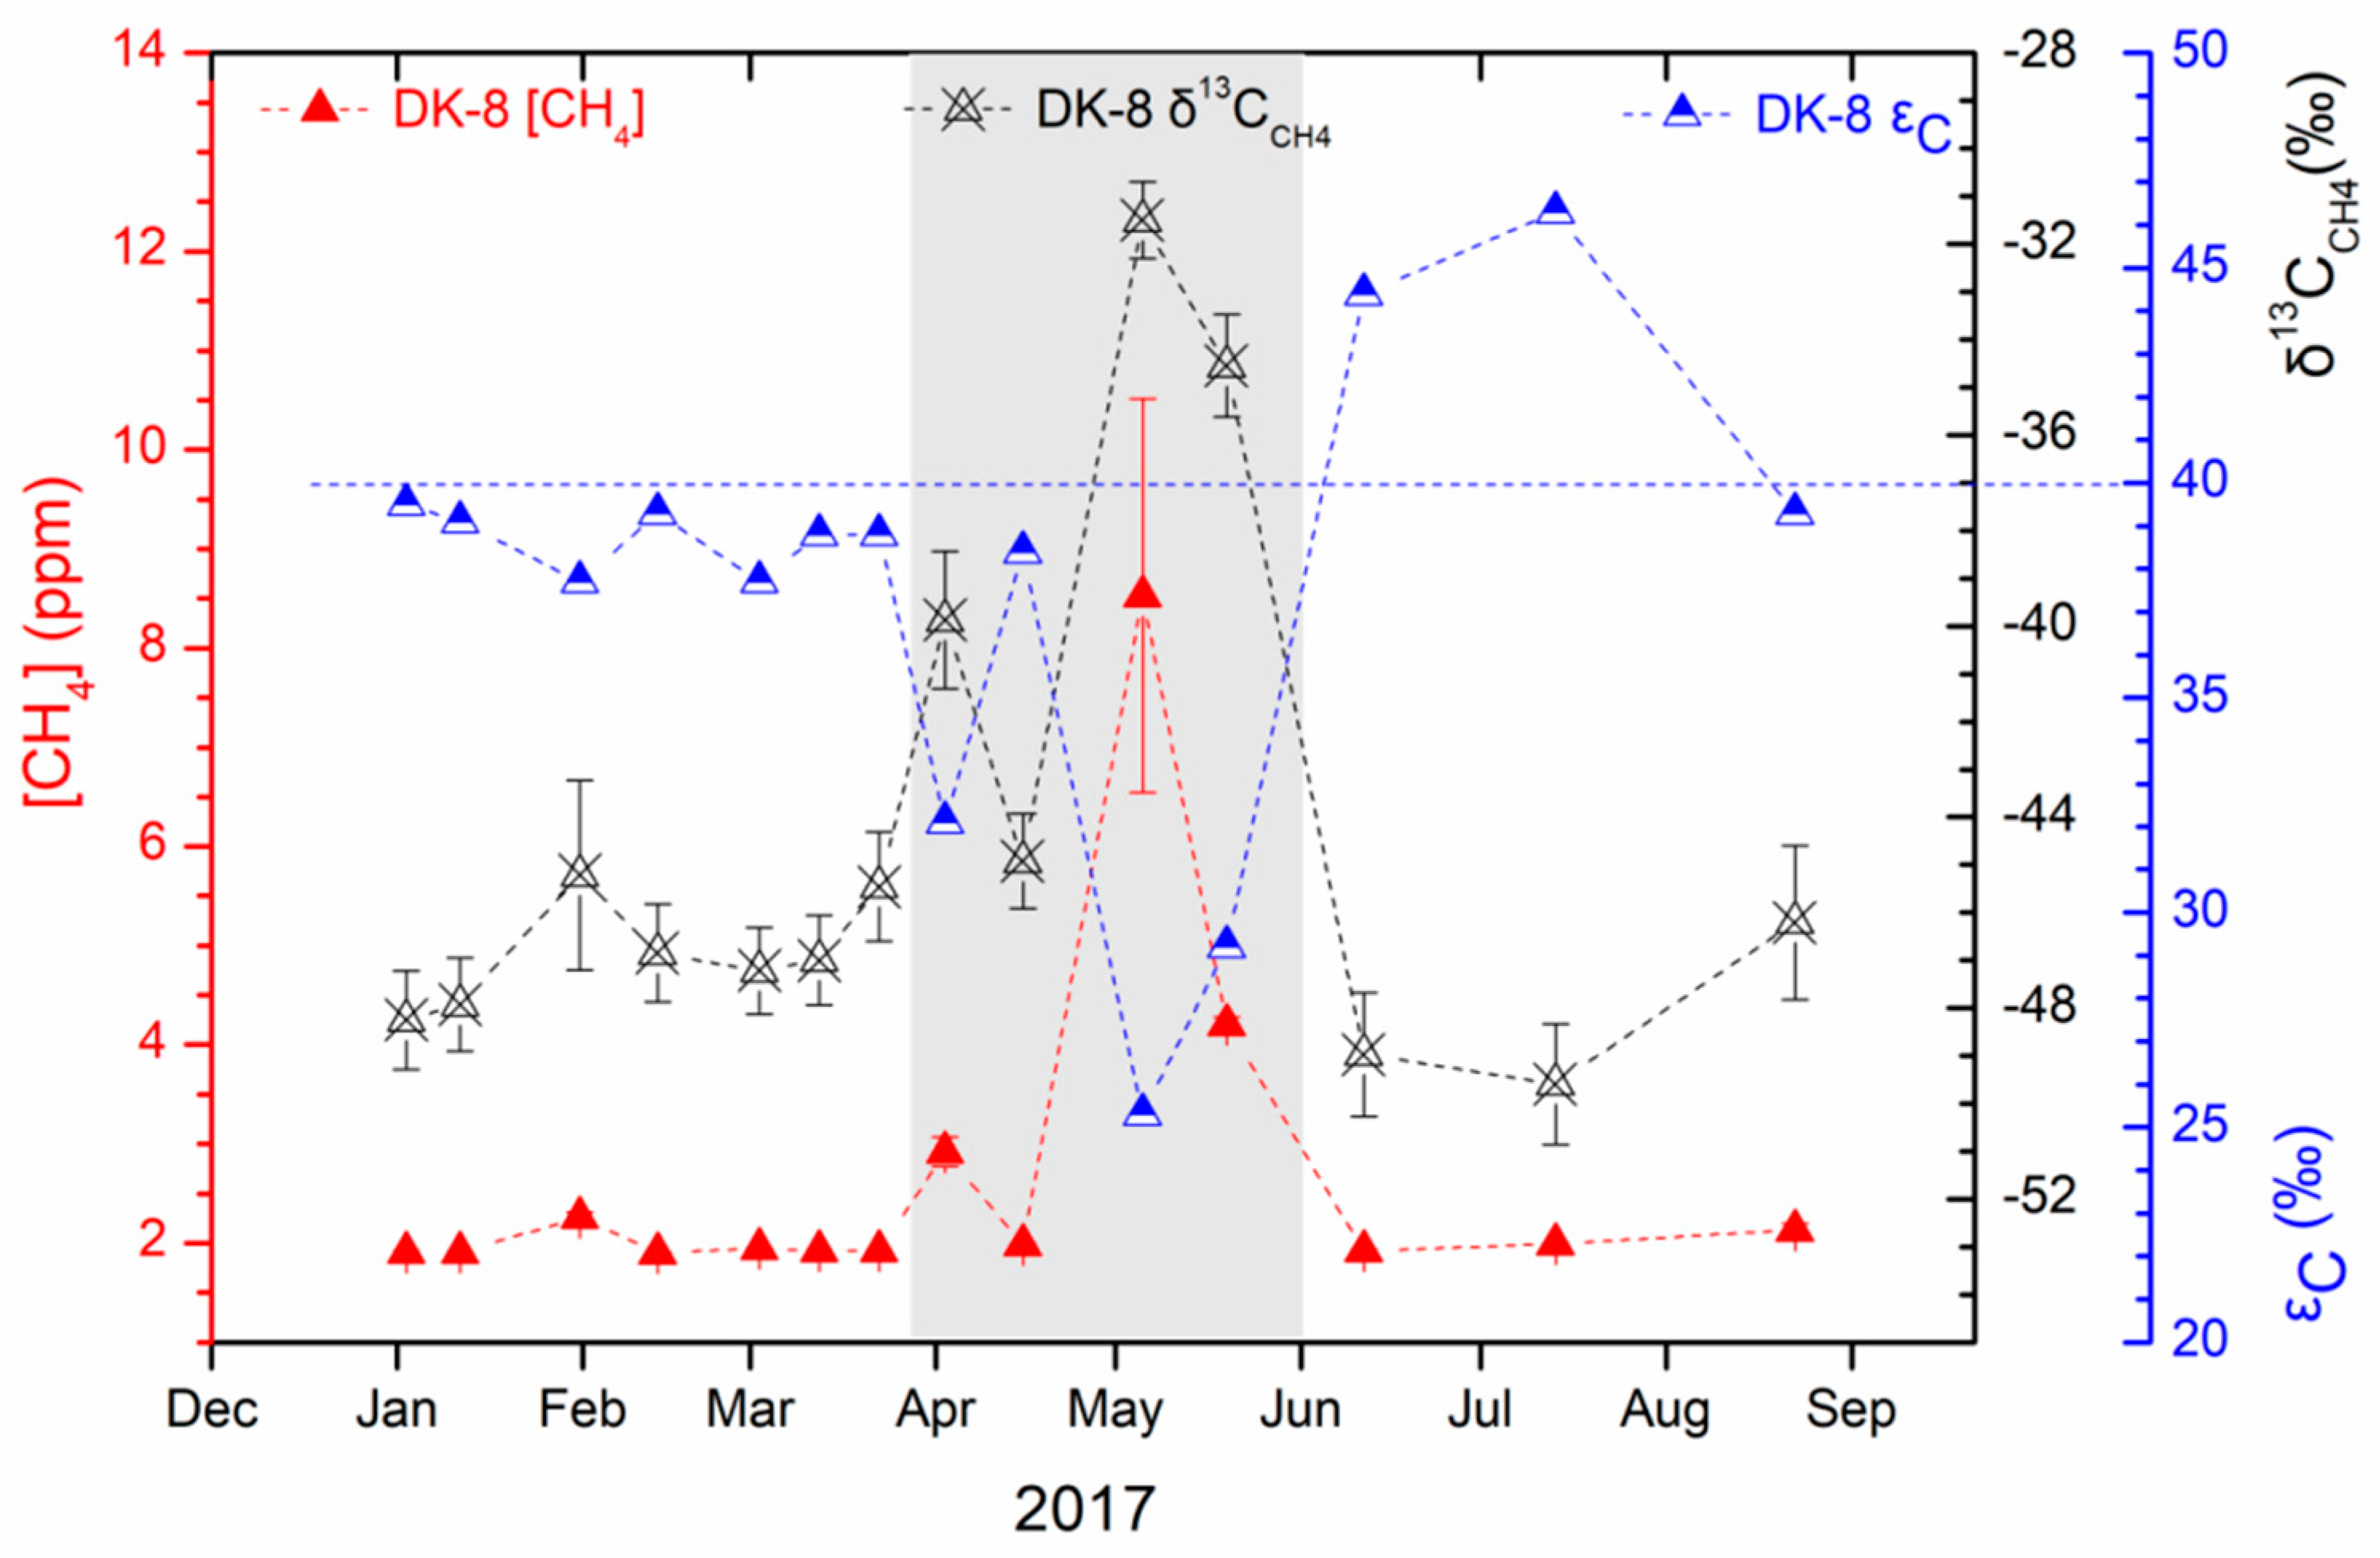
3.2. Methane Content and Carbon Isotopic Compositions Derived from the Drilling Well DK-8

The monthly variation in content and carbon isotopic composition of methane derived from the hydrate drilling well DK-8 during the period from January to August in 2017 is shown in Figure 4. The measured methane contents showed a large variation from 1.904 ± 0.001 to 8.530 ± 1.983 ppm. The methane was constant at a low concentration of 1.967 ± 0.130 ppm from January to March and of 2.015 ± 0.108 ppm from June to August, whereas it significantly increased to 2.920 ppm in early April and soared to 8.530 ppm in early May and 4.201 ppm in late May. The measured δ13CCH4 values varied between −49.6‰ and −34.6‰, parallel with methane contents (Figure 4). Overall, the higher CH4 content had less negative δ13CCH4, while lower CH4 content had more negative δ13CCH4. Specifically, for the higher content of CH4, the δ13CCH4 values were −39.9‰ in early April, −31.5‰ in early May, and −34.6‰ in late May, compared with −47.1 ± 1.5‰ for the steady low content of CH4. The carbon isotope fractionation (εC) between CO2 and CH4 varied between 25.3‰ and 46.3‰, with the highest in July and the lowest in May. The εC values are negatively correlated with the δ13CCH4 values with a Pearson’s r of −0.94997.

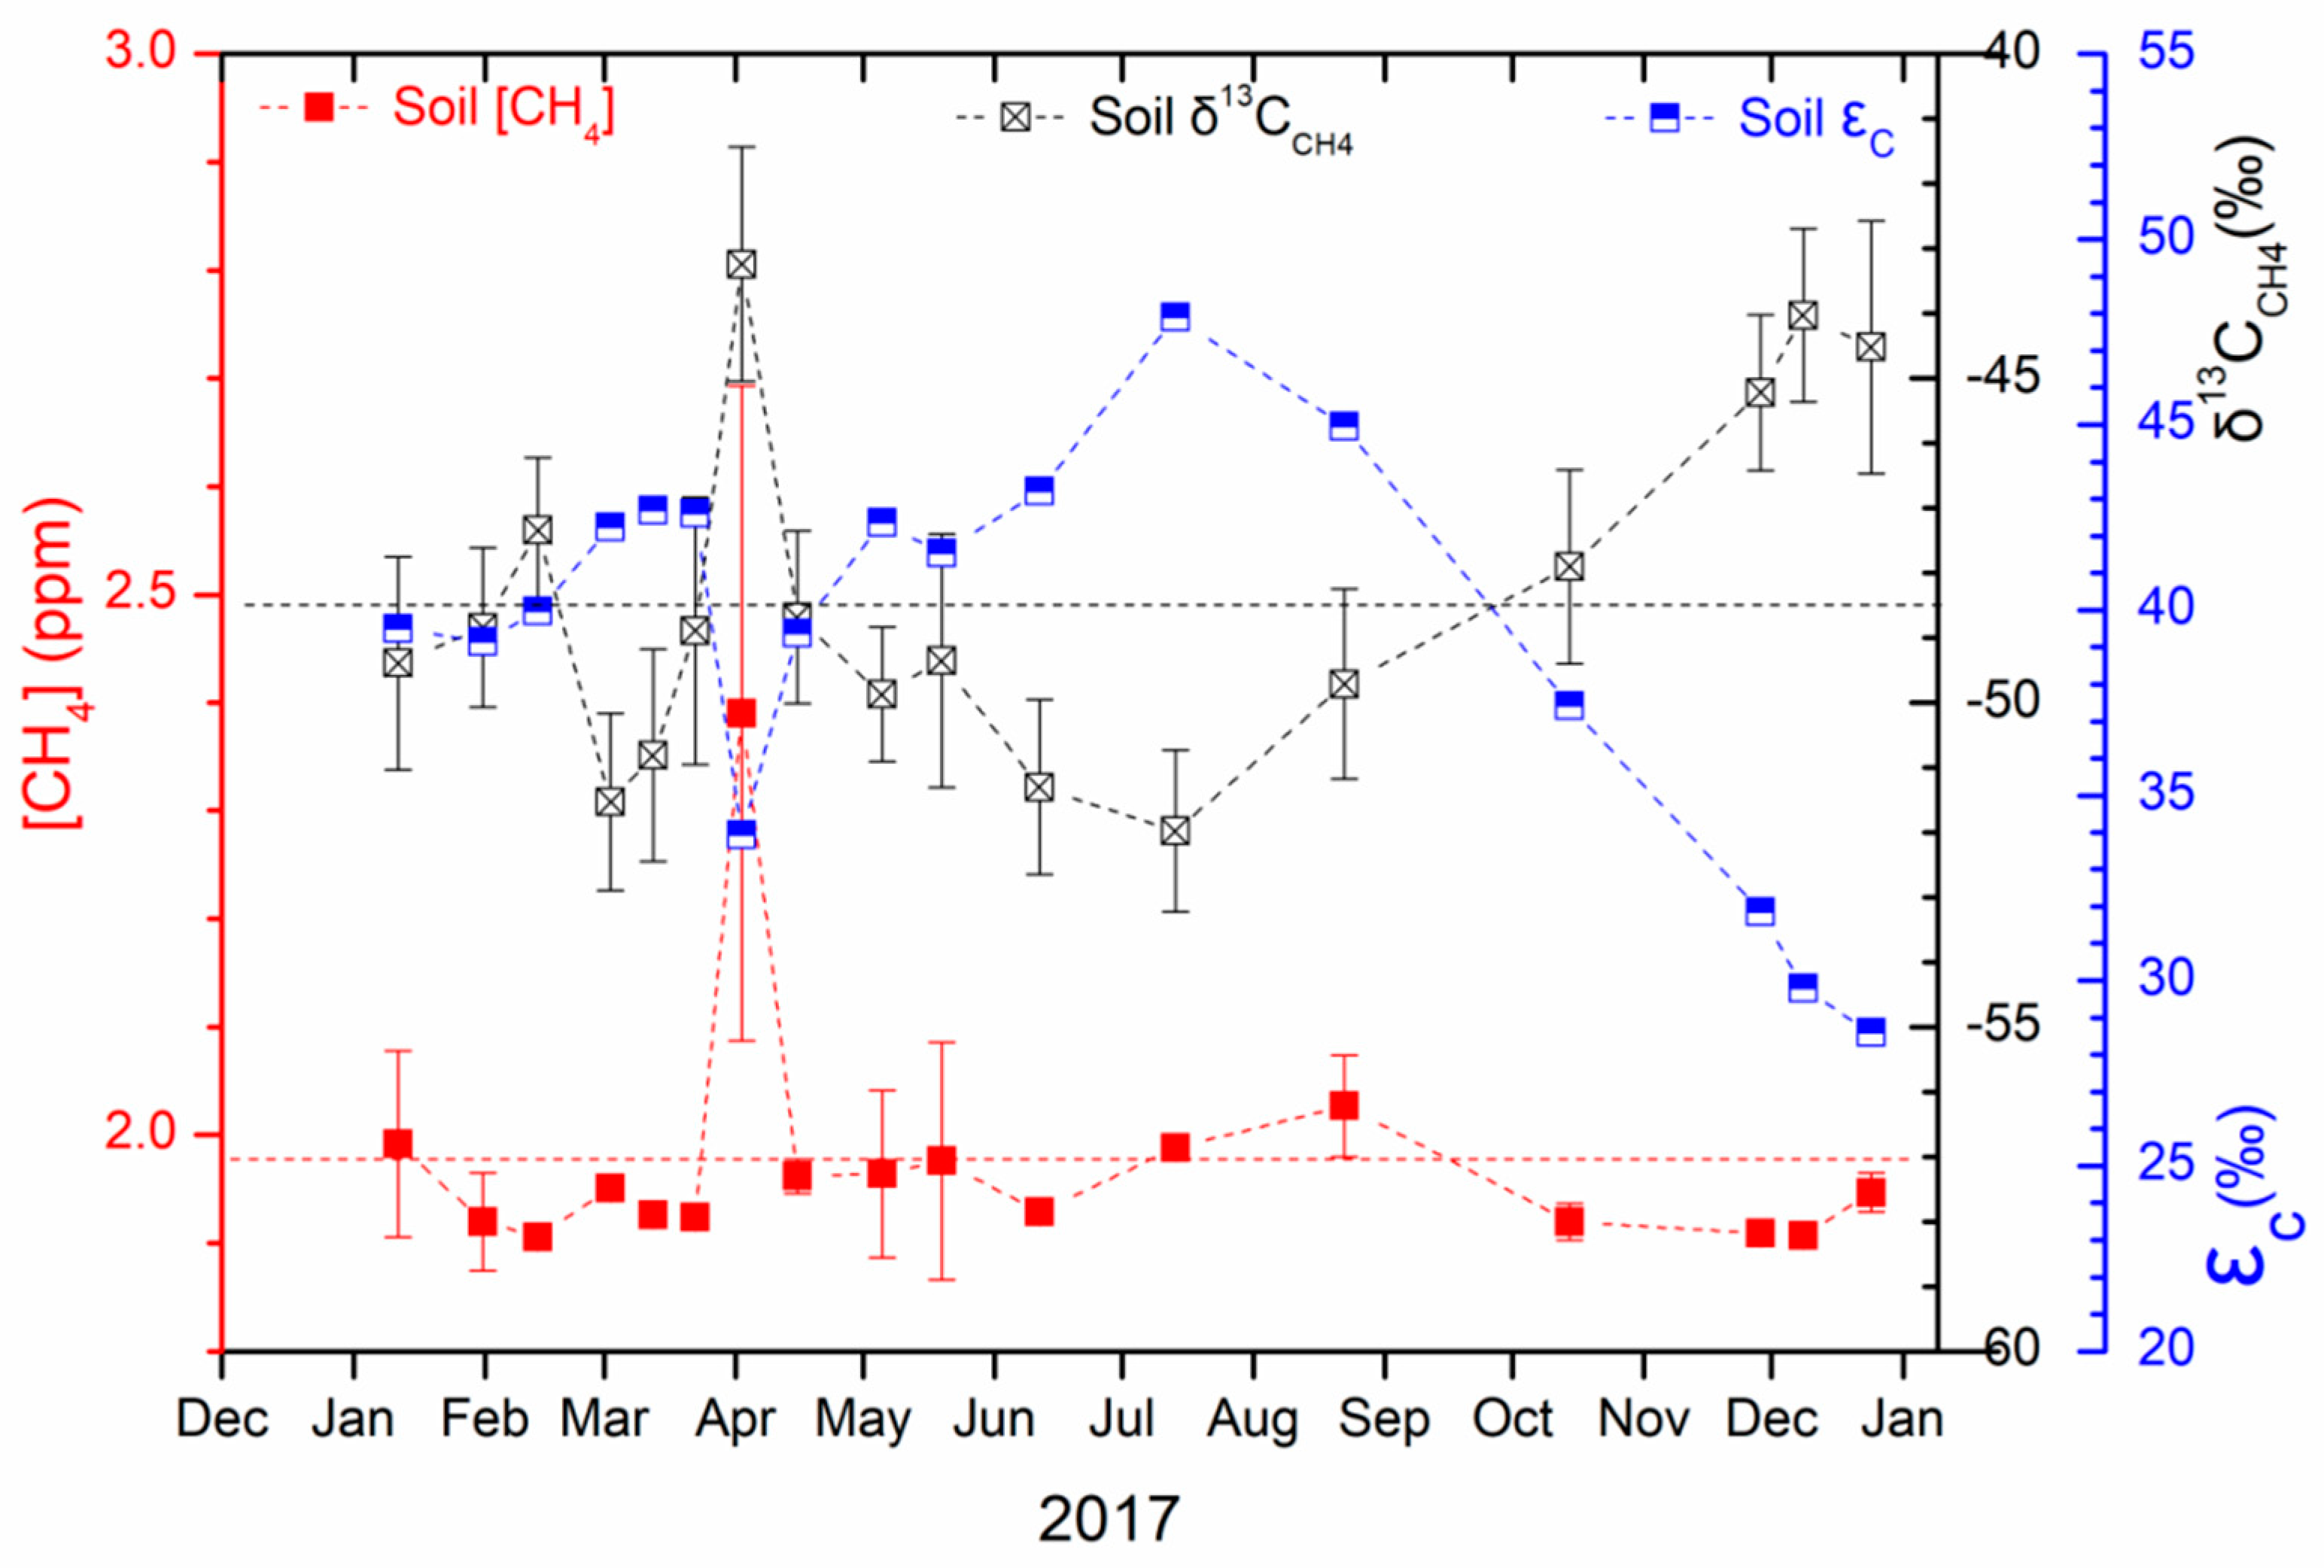
3.3. Methane Content and Carbon Isotopic Compositions of Free Gas from the Upper of Soil Active Layer

The CH4 content of the soil chamber varied from 1.906 ± 0.003 to 2.390 ± 0.303 ppm in 2017, with an average of 1.973 ± 0.113 ppm. Their δ13CCH4 values, representing that of the upper soil active layer, ranged between −52.0 ± 1.2‰ and −43.2 ± 1.8‰ with an average of −48.4 ± 2.7‰. The δ13CCH4 values measured in March–August (−50.2 ± 1.1‰) were lower than those measured in October–February (−46.7 ± 2.1‰). Particularly, the CH4 with soaring content (2.390 ± 0.303 ppm) in early April had significantly higher δ13CCH4 values (−43.2 ± 1.8‰) than that in other months (Figure 5), suggesting a significant increase of the methane source that has more positive δ13CCH4. The carbon isotope fractionation (εC) between CO2 and CH4 ranged between 28.6‰ and 47.9‰, with the highest in July and the lowest in December. The significant increasing and decreasing trend of the εC values were observed in the periods from April to July and from July to December, respectively. The εC values were negatively correlated with the δ13CCH4 values with a Pearson’s r of −0.9115.

4. Discussion

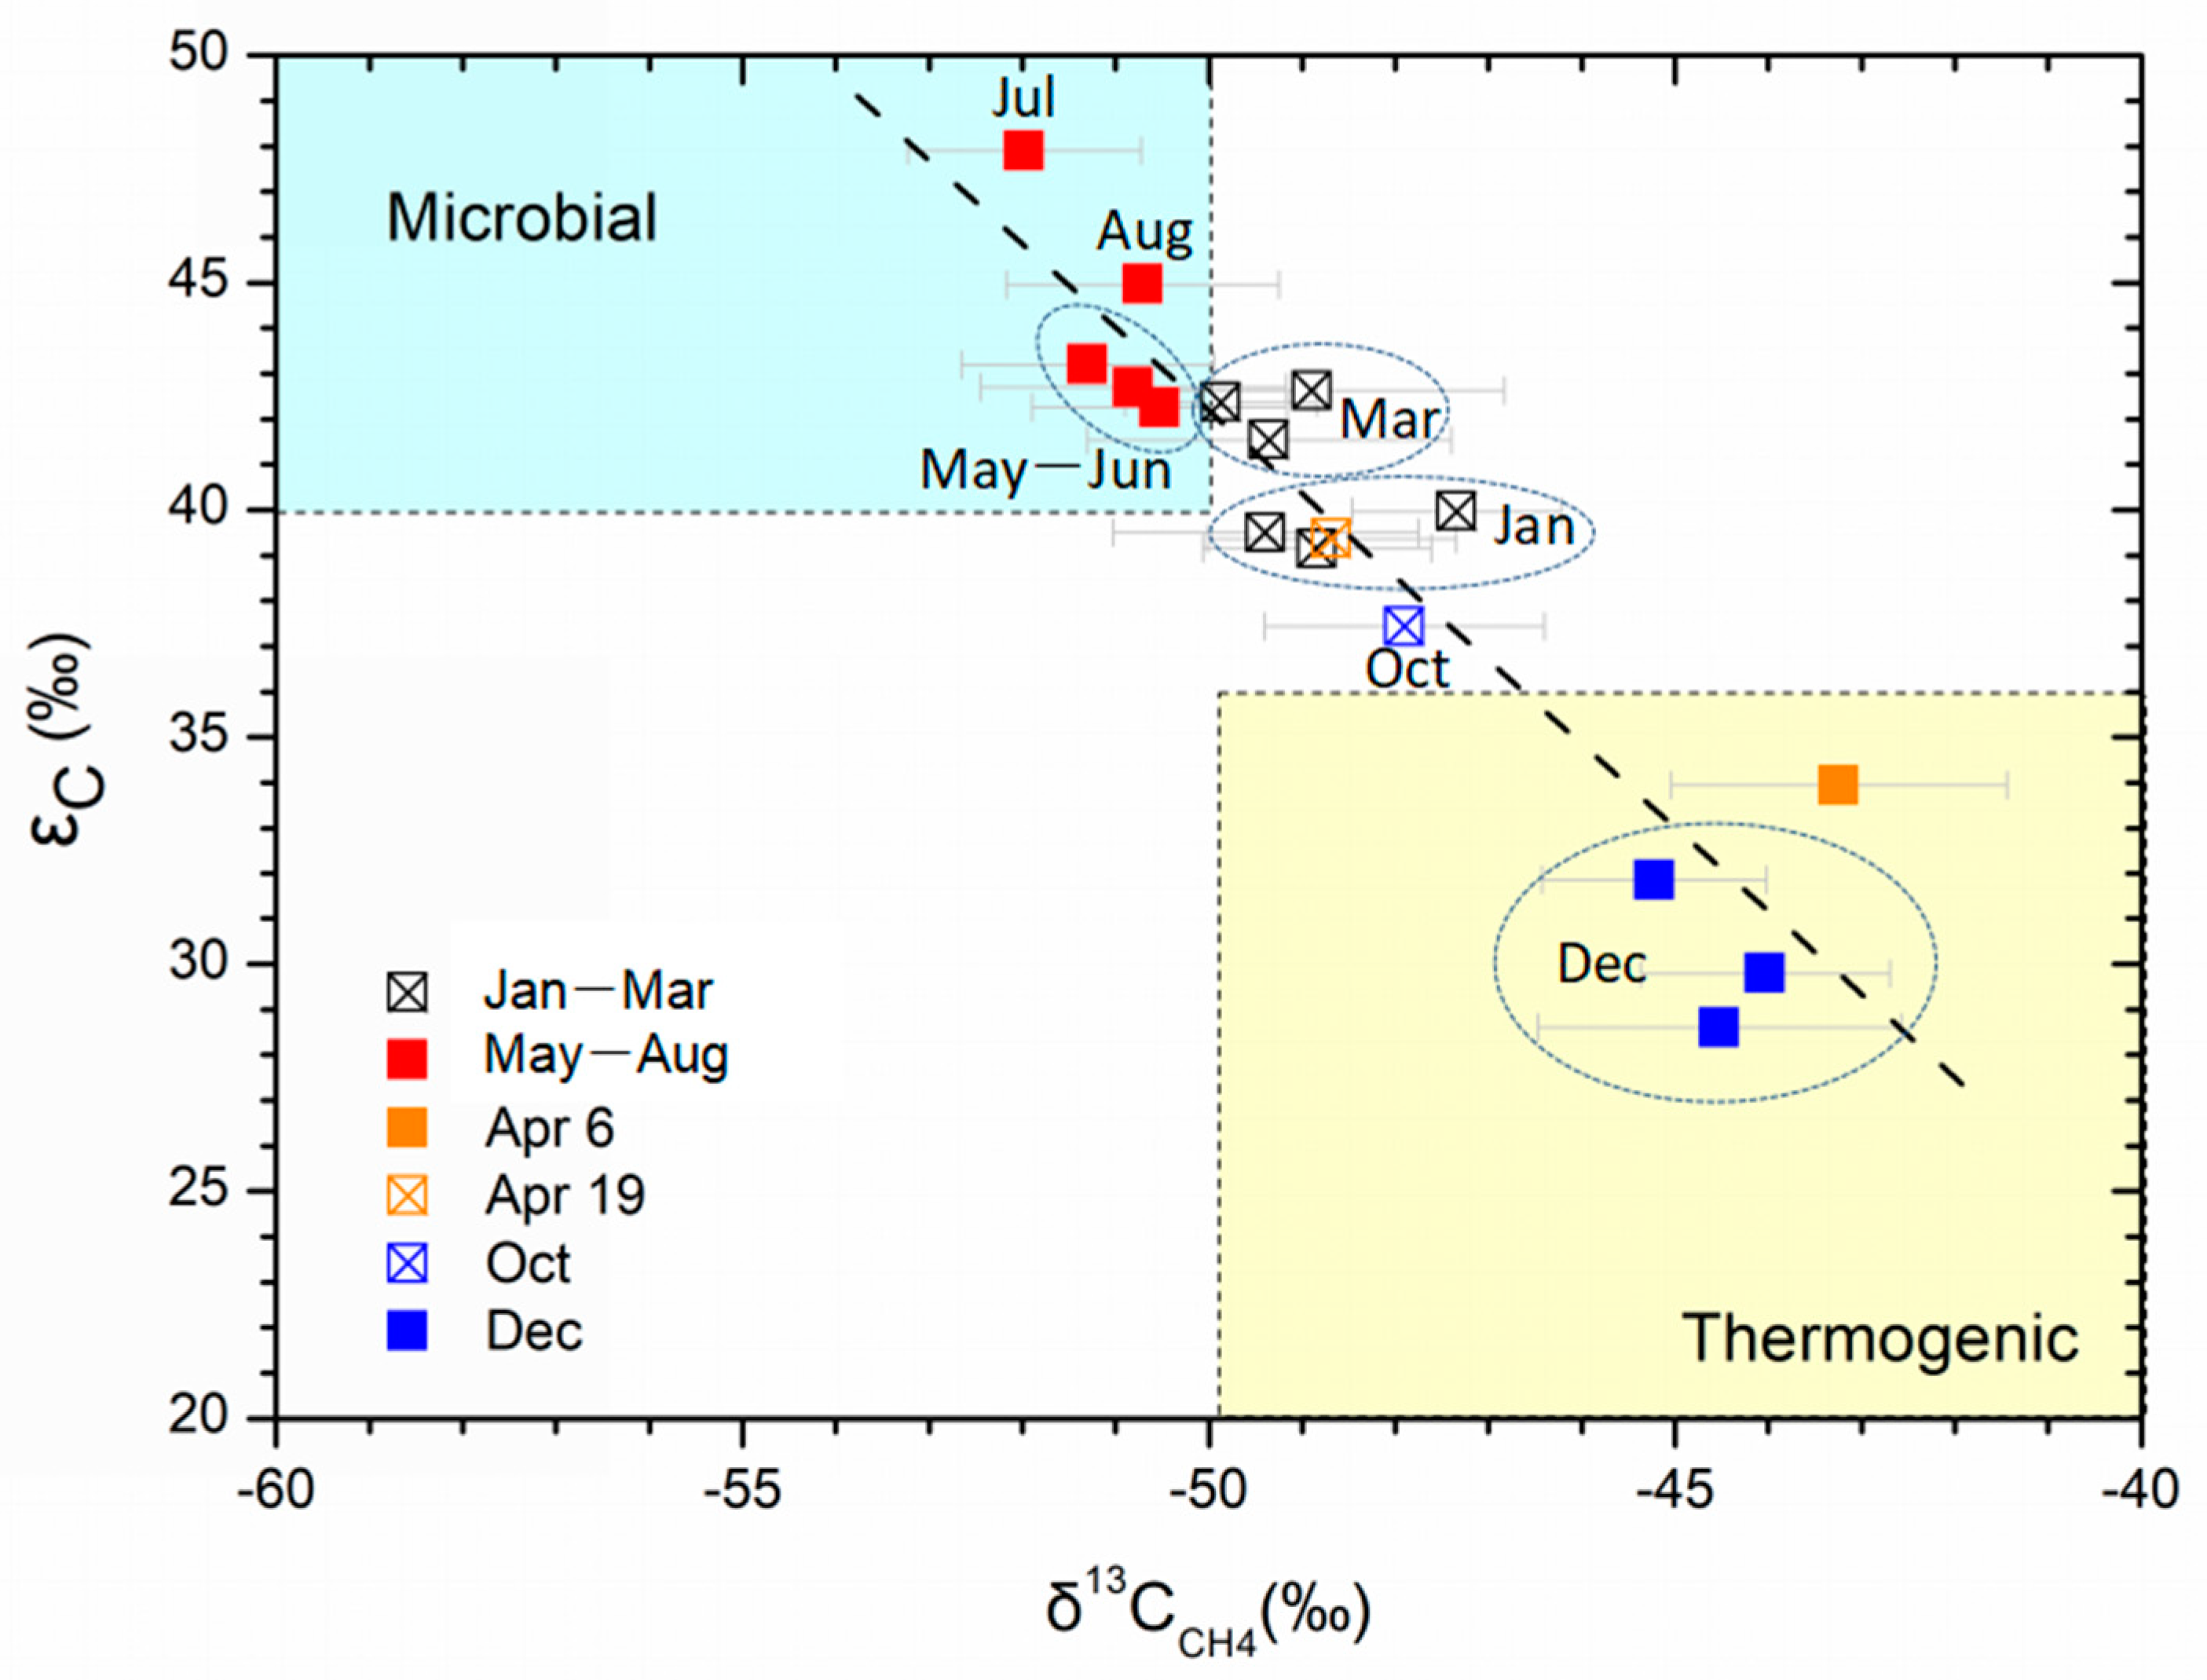
4.1. Carbon Isotopic Signatures for Methane Derived from Gas Hydrate Dissociation

We used Keeling and Miller Tans plots [41,42,43] to explore the potential source isotopic signature of fresh CH4 and CO2 escaping from the drilling well DK-8. The source isotopic signature for CH4s) was calculated as the intercept value (−25.9 ± 1.4‰) of the regression associated with the Keeling plot (Figure 6a) and as the slop value (−26.5 ± 0.5‰) of the regression associated with the Miller Tans plot (Figure 6b), respectively. There was no clear distinction in identified δs values between the two methods. The less negative δ13CCH4 values are typical of thermogenically-derived methane sources enriched in 13C (−50‰ to −20‰, [32]). The isotopic signature of the CH4 source for the well DK-8 is also consistent with δ13CCH4 values (−17.7‰ to −34.7‰) of headspace gases from gas-hydrate-bearing DK-8 drill cores at depths of 184–291m [36]. Gases from the gas hydrate samples in the Muli permafrost were mainly thermogenic, either of coal-derived or oil-derived origin, discerned by the combined plots of δ13C1-C1/(C2 + C3) [30,40,44,45,46], δ13C113C213C3 [47,48], and δ13C1-δD1 [44]. However, the Pearson’s correlation coefficients between δ13CCO2 and 1/[CO2] and between δ13CCO2*[CO2] and CO2 content were low (r = 0.1768 and r = −0.5690, p > 0.05, respectively). Thus, the traditional “Keeling plot” or “Miller Tans plots” two end-member mixing model cannot estimate the fresh CO2 source. The CO2 contents (422.0 ± 37.7 ppm) were considerably greater than the CH4 contents (1.98 ± 0.11 ppm), suggesting the importance of some other mechanisms of CO2 production. Therefore, besides the hydrate-forming gas, the CO2 source is not specified in this study, which may come from the deep depth or from soil organic decomposition.
The increasing CH4 content of well DK-8 in April–May was observed with less negative δ13CCH4 values than −40‰ (Figure 4), indicating a substantial proportion of releasing CH4 from gas hydrate dissociation. The CH4 from gas hydrate dissociation in the permafrost layer at a depth of 150−305 m can diffuse into well DK-8 and be trapped and accumulated in the ice of the well during upward diffusion when the soil temperature is lower than 0 °C. The occurring of a considerable increase of CH4 content of the well DK-8 coincides with the initial melting of the ice of the well in early April when the soil temperature first raises above 0 °C. The peak of the CH4 content also coincides with the complete melting process in early May when the soil temperature is always above 0 °C.
The carbon isotope fractionation (εC) between CO2 and CH4 can be indicative of the particular methanogenic pathway [32]. The εC values of gas hydrates in the Muli permafrost are calculated based on the reported δ13C data of gas components (CH4 and CO2) of the drilled gas hydrate samples summarized by Dai et al. [48]. The εC values are characterized by 21.5–35.8‰, with an average of 29.8‰ (Figure 7), associated with the average δ13CCH4 and δ13CCO2 of −45.3 ± 5.8‰ and −13.2 ± 7.3‰. The calculated εC values of gases from well DK-8 that correspond to more CH4 content and higher δ13CCH4 were 25.3–32.1‰, which is consistent with the thermogenic gas hydrate dissociation. This consistency shows no to little carbon isotopic fractionation during upward transport through the drilling wells. Moreover, the εC values of gas hydrates are distinctly lower than those associated with microbial methanogenesis predominantly by carbonate reduction (εC from 49‰ to over 100‰, [32]) or by fermentation of methylated substrates (εC typically between 40‰ and 55‰, [32]) and distinctly higher than those associated with microbial methane oxidation (εC generally less than 10‰, [32]). Therefore, the εC of 20–36‰ can be a carbon isotopic signature of thermogenic gas hydrate. The lower εC values associated with the δ13CCH4 higher than −40‰ further suggest considerable contribution from gas hydrate in April–May. The higher εC values (44.4–46.3‰) associated with lower δ13CCH4 (~−49‰) indicate an increasing contribution of a microbial source in June–July due to the elevated temperatures.

4.2. Sources of Seasonal Wetland Methane Emission Affected by Gas Hydrate Drilling

The flux and area-weighted mean global source signature from wetlands is −62‰ [49], which is similar to the mean microbial signature of 61.5 ± 0.6‰ [50]. The source signature map resolves a latitudinal difference of ~10‰ between northern high-latitude (mean 67.8‰) and tropical (mean 56.7‰) wetlands [49]. However, the annual average of δ13CCH4 in the study area is −48.4 ± 2.7‰, significantly more enriched than the global source isotopic signature. The soil-emitted δ13CCH4 in summer (−51.3 ± 0.9‰) of the study area is similar to that in two bogs (−53.0 ± 5.5‰ and −55.3 ± 5.5‰) separated by >1000 km over the Qinghai-Tibetan Plateau [51], but distinctly different from that of the northern European wetlands (−71 ± 1‰) [52]. In particular, more enriched δ13CCH4 of the soil-emitted methane was observed in December than in July–August, reflecting highly variable seasonal wetland methane sources. Compared with wetlands away from gas hydrate in the Qinghai-Tibetan Plateau, there was no significant difference of soil-emitted δ13CCH4 between summer (from −60.6‰ to −54.6‰) and winter (−65.5‰ to −55.8‰) [53].
The gases of thermogenic gas hydrates samples in the Muli permafrost of the Qilian Mountains had distinctive δ13CCH4 values heavier than −50‰ and εC values lower at 20–36‰ from the microbially-derived methane with δ13CCH4 lighter than −50‰ and εC values more than 40‰. Therefore, the isotope signatures of δ13CCH4 combined with εC can be adequate to reliably distinguish microbially or thermogenically derived methane. The two dominated microbial and thermogenic sources controlling seasonal variation of the wetland methane emission in the study area are indicated by linear correlation of binary mixing in the diagram of εC versus δ13CCH4 (Figure 8). The samples collected in spring and summer plotted in the microbial zone indicated the soil-emitted CH4 being dominated by fermentation of methylated substrates (δ13CCH4= −50‰ to −60‰, εC = 40–60‰, [32]). Further, the samples in autumn and winter are plotted beyond the microbial zone and along the fitting line into the thermogenic zone, indicating an increasing contribution of thermogenic gas hydrates. A response of soil methane emission to the CH4 effusion peak out of well DK-8 occurred on April 6 and can be observed by the CH4 surge (2390 ppm), less negative δ13CCH4 (−43.2‰), and lower εC (33.9‰) during the same period. The soil-emitted CH4 on April 6 plotted in the thermogenic zone (Figure 8) suggests the accumulated thermogenic gas hydrate dissociation in the ice of drilling wells is an important source of soil-emitted methane.
The combined effects of both microbially and thermogenically derived methane control the seasonal variation of wetland methane emission. This finding further suggests gas hydrate dissociation affected by drilling activities is an important source of methane emission from wetlands in the Muli permafrost. During spring and summer, microbes are the dominant source of soil-emitted methane, although the thermogenic methane emission from subterranean gas hydrates can be accelerated through new channels resulting from permafrost thawing. The increase in temperature accompanied by permafrost thawing promoted an exponential boost in the scale of microbial communities and activity [54,55,56] during the transition from spring to summer, which results in increasing methane produced by methanogenic microbes from May to July. However, with an increase in temperature to a certain extent, the upper limit of the environmental carrying capacity of methanogenic microbial communities is reached [57], which leads to a lower contribution of microbial methane in August than in July.
During the transition from late summer to autumn, microbial activities become weaker as the temperature decreases and the consequential reduction in methane production by methanogens. As a result, the methane contribution from the microbial source decreased, and that from the thermogenic source relatively increased in October. During winter, significant decreases occur on the scale of microbial communities and microbial activity [58], especially at temperatures below −10 °C. This leads to a substantial reduction in the amount of methane produced by methanogens. Thus, the contribution of the thermogenically derived methane relatively increased. The carbon isotope compositions of δ13CCH4 and εC of wetland emission consistently reflected the dynamic variation of relative contributions of microbial and thermogenic methane during autumn and winter. In addition, as the average daily temperature falls below zero, freezing occurs in the permafrost, which leads to the decreased effusion of methane from subterranean gas hydrates. The dominance of thermogenically derived methane in December is shown in Figure 8, suggesting that the subterranean gas hydrates dissociation may seep through faults or drainage systems or drilled-through permafrost layers upward into the wetland.

5. Conclusions

The twelve-month systematic field monitoring of methane sources at a typical gas hydrate drilling site in the Muli permafrost of the Qilian Mountains provided carbon isotopic evidence that thermogenic gas hydrate dissociation is an important source of wetland methane emission affected by drilling activities. The combined application of carbon isotope fractionation (εC) between CH4 and CO2 and carbon isotopic composition of methane (δ13CCH4) to distinguish thermogenic from microbial methane is well established and appears to be useful in complex environments. The carbon isotopic signatures for methane derived from gas hydrate dissociation determined by the gas hydrate drilling DK-8 is distinctly characterized by heavier δ13CCH4 of −26.5 ± 0.5‰ and lower εC of −25.3‰ to −32.1‰. The seasonal variation of methane sources of near-surface soil fluxes at the drilling site confirmed the significance of methane emission from the thermogenic gas hydrates on local permafrost wetland methane emission, especially in autumn and winter. The effect of gas hydrate dissociation on methane emission of the permafrost wetland may become more significant with the further exploration of gas hydrate resources. The effect of gas hydrate on regional wetland methane emission in the Muli permafrost requires more research to fully understand, which will allow for exploration of the mechanisms of soil methane emissions in the permafrost wetlands of the Qinghai-Tibet Plateau as the global climate warms.

Author Contributions

X.L., interpreted the data and wrote the paper and acquired funding; S.P., conceived and designed the research; J.X. performed data analysis and figure drawing; Y.Z., performed fieldwork supervision and funding acquisition; S.Z., R.X., and C.L. performed field investigation and monitoring. All authors have read and agreed to the published version of the manuscript.

Funding

This study was financially supported by the open fund project of the Key Laboratory of Unconventional Oil & Gas Geology, China Geological Survey (CGS) (No. DD2019137-YQ19JJ02), and the National geological survey project of China (No. DD20190102).

Institutional Review Board Statement

This article does not contain studies with human participant or animals performed by any of the authors.

Informed Consent Statement

Not applicable.

Data Availability Statement

The data generated or analyzed during this study were included in this manuscript.

Acknowledgments

We are grateful to the Muli Field Scientific Observation and Research Station for Gas Hydrate, CGS, for the convenience and help during field work.

Conflicts of Interest

The authors declare no conflict of interest.

References

  1. Shindell, D.T.; Faluvegi, G.; Koch, D.M.; Schmidt, G.A.; Unger, N.; Bauer, S.E. Improved Attribution of Climate Forcing to Emissions. Science 2009, 326, 716–718. [Google Scholar] [CrossRef] [PubMed] [Green Version]
  2. Dalsøren, S.B.; Myhre, C.L.; Myhre, G.; Gomez-Pelaez, A.J.; Søvde, O.A.; Isaksen, I.S.A.; Weiss, R.F.; Harth, C.M. Atmospheric methane evolution the last 40 years. Atmospheric Chem. Phys. 2016, 16, 3099–3126. [Google Scholar] [CrossRef] [Green Version]
  3. Zhang, Z.; Zimmermann, N.E.; Stenke, A.; Li, X.; Hodson, E.L.; Zhu, G.; Huang, C.; Poulter, B. Emerging role of wetland methane emissions in driving 21st century climate change. Proc. Natl. Acad. Sci. USA 2017, 114, 9647–9652. [Google Scholar] [CrossRef] [PubMed] [Green Version]
  4. Zimov, S.A.; Schuur, E.A.G.; Chapin, F.S. Permafrost and the Global Carbon Budget. Science 2006, 312, 1612–1613. [Google Scholar] [CrossRef]
  5. Zimov, S.A.; Davydov, S.P.; Zimova, G.M.; Davydova, A.I.; Schuur, E.A.G.; Dutta, K.; Chapin, F.S., III. Permafrost carbon: Stock and decomposability of a globally significant carbon pool. Geophys. Res. Lett. 2006, 33, L20502. [Google Scholar] [CrossRef] [Green Version]
  6. Schuur, E.A.G.; Bockheim, J.; Canadell, J.G.; Euskirchen, E.; Field, C.B.; Goryachkin, S.V.; Hagemann, S.; Kuhry, P.; LaFleur, P.M.; Lee, H.; et al. Vulnerability of Permafrost Carbon to Climate Change: Implications for the Global Carbon Cycle. Bioscience 2008, 58, 701–714. [Google Scholar] [CrossRef]
  7. DeConto, R.M.; Galeotti, S.; Pagani, M.; Tracy, D.; Schaefer, K.; Zhang, T.; Pollard, D.; Beerling, D.J. Past extreme warming events linked to massive carbon release from thawing permafrost. Nature 2012, 484, 87–91. [Google Scholar] [CrossRef]
  8. Schuur, E.A.G.; McGuire, A.D.; Schädel, C.; Grosse, G.; Harden, J.W.; Hayes, D.J.; Hugelius, G.; Koven, C.D.; Kuhry, P.; Lawrence, D.M.; et al. Climate change and the permafrost carbon feedback. Nature 2015, 520, 171–179. [Google Scholar] [CrossRef]
  9. Knoblauch, C.; Beer, C.; Liebner, S.; Grigoriev, M.N.; Pfeiffer, E.-M. Methane production as key to the greenhouse gas budget of thawing permafrost. Nat. Clim. Chang. 2018, 8, 309–312. [Google Scholar] [CrossRef] [Green Version]
  10. Zhao, Z.; Zhang, Y.; Liu, L.; Liu, F.; Zhang, H. Recent changes in wetlands on the Tibetan Plateau: A review. J. Geogr. Sci. 2015, 25, 879–896. [Google Scholar] [CrossRef] [Green Version]
  11. Mu, C.; Zhang, T.; Wu, Q.; Peng, X.; Cao, B.; Zhang, X.; Cao, B.; Cheng, G. Editorial: Organic carbon pools in permafrost regions on the Qinghai–Xizang (Tibetan) Plateau. Cryosphere 2015, 9, 479–486. [Google Scholar] [CrossRef] [Green Version]
  12. Ding, J.; Chen, L.; Ji, C.; Hugelius, G.; Li, Y.; Liu, L.; Qin, S.; Zhang, B.; Yang, G.; Li, F.; et al. Decadal soil carbon accumulation across Tibetan permafrost regions. Nat. Geosci. 2017, 10, 420–424. [Google Scholar] [CrossRef] [Green Version]
  13. Mu, C.; Abbott, B.W.; Norris, A.J.; Mu, M.; Fan, C.; Chen, X.; Jia, L.; Yang, R.; Zhang, T.; Wang, K.; et al. The status and stability of permafrost carbon on the Tibetan Plateau. Earth-Sci. Rev. 2020, 211, 103433. [Google Scholar] [CrossRef]
  14. Lu, Z.Q.; Zhu, Y.H.; Zhang, Y.Q.; Wen, H.; Li, Y.H.; Liu, C.L. Gas hydrate occurrences in the Qilian Mountain permafrost, Qinghai Province, China. Cold Reg. Sci. Technol. 2011, 66, 93–104. [Google Scholar] [CrossRef]
  15. Song, Y.; Yang, L.; Zhao, J.; Liu, W.; Yang, M.; Li, Y.; Liu, Y.; Li, Q. The status of natural gas hydrate research in China: A review. Renew. Sustain. Energy Rev. 2014, 31, 778–791. [Google Scholar] [CrossRef]
  16. Wang, X.; Pan, L.; Lau, H.C.; Zhang, M.; Li, L.; Zhou, Q. Reservoir volume of gas hydrate stability zones in permafrost regions of China. Appl. Energy 2018, 225, 486–500. [Google Scholar] [CrossRef]
  17. O’Connor, F.M.; Boucher, O.; Gedney, N.; Jones, C.D.; Folberth, G.A.; Coppell, R.; Friedlingstein, P.; Collins, W.J.; Chappellaz, J.; Ridley, J.; et al. Possible role of wetlands, permafrost, and methane hydrates in the methane cycle under future climate change: A review. Rev. Geophys. 2010, 48, RG4005. [Google Scholar] [CrossRef]
  18. Cui, M.; Ma, A.; Qi, H.; Zhuang, X.; Zhuang, G.; Zhao, G. Warmer temperature accelerates methane emissions from the Zoige wetland on the Tibetan Plateau without changing methanogenic community composition. Sci. Rep. 2015, 5, 11616. [Google Scholar] [CrossRef] [Green Version]
  19. Dean, J.F.; Middelburg, J.J.; Röckmann, T.; Aerts, R.; Blauw, L.G.; Egger, M.; Jetten, M.S.M.; de Jong, A.E.E.; Meisel, O.H.; Rasigraf, O.; et al. Methane Feedbacks to the Global Climate System in a Warmer World. Rev. Geophys. 2018, 56, 207–250. [Google Scholar] [CrossRef]
  20. Yu, L.; Wang, H.; Wang, Y.; Zhang, Z.; Chen, L.; Liang, N.; He, J.-S. Temporal variation in soil respiration and its sensitivity to temperature along a hydrological gradient in an alpine wetland of the Tibetan Plateau. Agric. For. Meteorol. 2020, 282–283, 107854. [Google Scholar] [CrossRef]
  21. Kuhn, M.; Lundin, E.J.; Giesler, R.; Johansson, M.; Karlsson, J. Emissions from thaw ponds largely offset the carbon sink of northern permafrost wetlands. Sci. Rep. 2018, 8, 9535. [Google Scholar] [CrossRef] [PubMed]
  22. Mu, C.; Li, L.; Wu, X.; Zhang, F.; Jia, L.; Zhao, Q.; Zhang, T. Greenhouse gas released from the deep permafrost in the northern Qinghai-Tibetan Plateau. Sci. Rep. 2018, 8, 4205. [Google Scholar] [CrossRef]
  23. Song, C.; Xu, X.; Sun, X.; Tian, H.; Sun, L.; Miao, Y.; Wang, X.; Guo, Y. Large methane emission upon spring thaw from natural wetlands in the northern permafrost region. Environ. Res. Lett. 2012, 7, 34009. [Google Scholar] [CrossRef] [Green Version]
  24. Mestdagh, T.; Poort, J.; De Batist, M. The sensitivity of gas hydrate reservoirs to climate change: Perspectives from a new combined model for permafrost-related and marine settings. Earth-Sci. Rev. 2017, 169, 104–131. [Google Scholar] [CrossRef] [Green Version]
  25. Maslin, M.; Owen, M.; Betts, R.; Day, S.; Jones, T.D.; Ridgwell, A. Gas hydrates: Past and future geohazard? Philos. Trans. R. Soc. London. Ser. A Math. Phys. Eng. Sci. 2010, 368, 2369–2393. [Google Scholar] [CrossRef]
  26. Wang, P.K.; Zhu, Y.H.; Lu, Z.Q.; Huang, X.; Pang, S.J.; Zhang, S. Gas hydrate stability zone migration occurred in the Qilian mountain permafrost, Qinghai, Northwest China: Evidences from pyrite morphology and pyrite sulfur isotope. Cold Reg. Sci. Technol. 2014, 98, 8–17. [Google Scholar] [CrossRef]
  27. China Meteorological Administration. China Greenhouse Gas Bulletin: The State of Greenhouse Gases in the Atmosphere Based on China and Global Observations until 2019. 2020; Volume 9, pp. 1–5. Available online: http://www.cma.gov.cn/root7/auto13139/ (accessed on 15 February 2022). (in Chinese)
  28. Luo, M.; Huang, H.; Zhang, P.; Wu, Q.; Chen, D. Origins of gas discharging from the Qiangtang Basin in the northern Qinghai–Tibet Plateau, China: Evidence from gas compositions, helium, and carbon isotopes. J. Geochem. Explor. 2014, 146, 119–126. [Google Scholar] [CrossRef]
  29. Sun, Z.J.; Yang, Z.B.; Mei, H.; Qin, A.H.; Zhang, F.G.; Zhou, Y.L.; Zhang, S.Y.; Mei, B.W. Geochemical characteristics of the shallow soil above the Muli gas hydrate reservoir in the permafrost region of the Qilian Mountains, China. J. Geochem. Explor. 2014, 139, 160–169. [Google Scholar] [CrossRef]
  30. Zhang, S.Y.; Zhang, F.G.; Shi, Z.M.; Qin, A.H.; Wang, H.Y.; Sun, Z.J.; Yang, Z.B.; Zhu, Y.H.; Pang, S.J.; Wang, P.K. Sources of seasonal wetland methane emissions in permafrost regions of the Qinghai-Tibet Plateau. Sci. Rep. 2020, 10, 7520. [Google Scholar] [CrossRef]
  31. Zhang, S.Y.; Yang, F.; Zhang, F.G.; Shi, Z.M.; Yang, Z.B.; Zhou, Y.L.; Wang, H.Y. Study on methane emission and isotopic characteristics of wetland in permafrost area of Qinghai Tibet Plateau. Mod. Geol. 2018, 32, 1089–1096. [Google Scholar] [CrossRef]
  32. Whiticar, M.J. Carbon and hydrogen isotope systematics of bacterial formation and oxidation of methane. Chem. Geol. 1999, 161, 291–314. [Google Scholar] [CrossRef]
  33. Barker, J.F.; Fritz, P. Carbon isotope fractionation during microbial methane oxidation. Nature 1981, 293, 289–291. [Google Scholar] [CrossRef]
  34. Zhou, Y.; Guo, D.; Qiu, G.; Cheng, G.; Li, S. Geocryology in China; Science Press: Beijing, China, 2000. (in Chinese) [Google Scholar]
  35. Wen, H.J.; Shao, L.Y.; Li, Y.H.; Lu, J.; Zhang, S.L.; Wang, W.L.; Huang, M. Structural outline and stratigraphic framework of Juhugeng mining area in Muli Coalfield, Tianjun County, Qinghai Province. Geol. Bulletin. 2011, 30, 1823–1828. [Google Scholar] [CrossRef]
  36. Lu, Z.Q.; Rao, Z.; He, J.X.; Zhu, Y.H.; Zhang, Y.Q.; Liu, H.; Wang, T.; Xue, X.H. Geochemistry of drill core headspace gases and its significance in gas hydrate drilling in Qilian Mountain permafrost. J. Asian Earth Sci. 2015, 98, 126–140. [Google Scholar] [CrossRef]
  37. Wang, P.K.; Zhu, Y.H.; Lu, Z.Q.; Guo, X.W. Lithology and distribution characteristics of gas hydrate in permafrost area of Qi-lian Mountain. Geol. Bulletin. 2011, 30, 1839–1850. [Google Scholar]
  38. Li, B.; Sun, Y.H.; Guo, W.; Shan, X.L.; Wang, P.K.; Pang, S.J.; Jia, R.; Zhang, G.B. The mechanism and verification analysis of permafrost-associated gas hydrate formation in the Qilian Mountain, Northwest China. Mar. Pet. Geol. 2017, 86, 787–797. [Google Scholar] [CrossRef]
  39. Zhu, Y.H.; Zhang, Y.Q.; Wen, H.J.; Lu, Z.Q.; Jia, Z.Y.; Li, Y.H.; Li, Q.H.; Liu, C.L.; Wang, P.K.; Guo, X.W. Gas Hydrates in the Qilian Mountain Permafrost, Qinghai, Northwest China. Acta Geol. Sin. 2010, 84, 1–10. [Google Scholar] [CrossRef]
  40. Lu, Z.; Zhu, Y.; Zhang, Y.; Wen, H.; Li, Y.; Jia, Z.; Wang, P.; Li, Q. Study on genesis of gases from gas hydrate in the Qilian Mountain Permafrost, Qinghai. Geoscience 2010, 24, 581–588. [Google Scholar] [CrossRef]
  41. Keeling, C.D. The concentration and isotopic abundances of atmospheric carbon dioxide in rural areas. Geochim. Cosmochim. Acta 1958, 13, 322–334. [Google Scholar] [CrossRef]
  42. Miller, J.B.; Tans, P.P. Calculating isotopic fractionation from atmospheric measurements at various scales. Tellus B Chem. Phys. Meteorol. 2003, 55, 207–214. [Google Scholar] [CrossRef]
  43. Campeau, A.; Wallin, M.B.; Giesler, R.; Löfgren, S.; Mörth, C.-M.; Schiff, S.; Venkiteswaran, J.J.; Bishop, K. Multiple sources and sinks of dissolved inorganic carbon across Swedish streams, refocusing the lens of stable C isotopes. Sci. Rep. 2017, 7, 9158. [Google Scholar] [CrossRef] [PubMed]
  44. Liu, C.; He, X.; Meng, Q.; Ye, Y.; Zhu, Y.; Lu, Z. Carbon and hydrogen isotopic compositions characteristics of the released gas from natural gas hydrates in the Qilian Mountain Permafrost. Rock Miner. Anal. 2012, 31, 489–494. [Google Scholar] [CrossRef]
  45. Liu, C.L.; Meng, Q.G.; He, X.L.; Li, C.F.; Ye, Y.G.; Lu, Z.Q.; Zhu, Y.H.; Li, Y.H.; Liang, J.Q. Comparison of the characteristics for natural gas hydrate recovered from marine and terrestrial areas in China. J. Geochem. Explor. 2015, 152, 67–74. [Google Scholar] [CrossRef]
  46. Cheng, B.; Xu, J.B.; Lu, Z.Q.; Li, Y.H.; Wang, W.C.; Yang, S.; Liu, H.; Wang, T.; Liao, Z.W. Hydrocarbon source for oil and gas indication associated with gas hydrate and its significance in the Qilian Mountain permafrost, Qinghai, Northwest China. Mar. Pet. Geol. 2018, 89, 202–215. [Google Scholar] [CrossRef]
  47. Dai, J.X.; Ni, Y.; Huang, S.; Liao, F.; Yu, C.; Gong, D.; Wu, W. Significant function of coal-derived gas study for natural gas industry development in China. Nat. Gas Geosci. 2014, 25, 1–22. [Google Scholar] [CrossRef]
  48. Dai, J.X.; NI, Y.Y.; Huang, S.P.; Peng, W.L.; Han, W.X.; Gong, D.Y.; Wei, W. Genetic types of gas hydrates in China. Pet. Explor. Dev. 2017, 44, 887–898. [Google Scholar] [CrossRef]
  49. Ganesan, A.L.; Stell, A.C.; Gedney, N.; Comyn-Platt, E.; Hayman, G.; Rigby, M.; Poulter, B.; Hornibrook, E.R.C. Spatially Resolved Isotopic Source Signatures of Wetland Methane Emissions. Geophys. Res. Lett. 2018, 45, 3737–3745. [Google Scholar] [CrossRef]
  50. Schwietzke, S.; Sherwood, O.; Bruhwiler, L.M.P.; Miller, J.; Etiope, G.; Dlugokencky, E.J.; Michel, S.E.; Arling, S.S.J.B.M.V.A.; Vaughn, B.H.; White, J.; et al. Upward revision of global fossil fuel methane emissions based on isotope database. Nature 2016, 538, 88–91. [Google Scholar] [CrossRef]
  51. Kato, T.; Yamada, K.; Tang, Y.H.; Yoshida, N.; Wada, E. Carbon isotopic signature reveals the geographical trend in methane consumption and production pathways in alpine ecosystems over the Qinghai–Tibetan Plateau. Isot. Environ. Health Stud. 2017, 53, 597–609. [Google Scholar] [CrossRef]
  52. Fisher, R.E.; France, J.L.; Lowry, D.; Lanoisellé, M.; Brownlow, R.; Pyle, J.A.; Cain, M.; Warwick, N.; Skiba, U.M.; Drewer, J.; et al. Measurement of the 13 C isotopic signature of methane emissions from northern European wetlands. Glob. Biogeochem. Cycles 2017, 31, 605–623. [Google Scholar] [CrossRef] [Green Version]
  53. Kato, T.; Yamada, K.; Tang, Y.H.; Yoshida, N.; Wada, E. Stable carbon isotopic evidence of methane consumption and production in three alpine ecosystems on the Qinghai–Tibetan Plateau. Atmos. Environ. 2013, 77, 338–347. [Google Scholar] [CrossRef]
  54. Ji, M.K.; Kong, W.D.; Liang, C.; Zhou, T.Q.; Jia, H.Z.; Dong, X.B. Permafrost thawing exhibits a greater influence on bacterial richness and community structure than permafrost age in Arctic permafrost soils. Cryosphere 2020, 14, 3907–3916. [Google Scholar] [CrossRef]
  55. Mackelprang, R.; Waldrop, M.P.; DeAngelis, K.M.; David, M.M.; Chavarria, K.L.; Blazewicz, S.J.; Rubin, E.M.; Jansson, J.K. Metagenomic analysis of a permafrost microbial community reveals a rapid response to thaw. Nature 2011, 480, 120–368. [Google Scholar] [CrossRef] [Green Version]
  56. Chen, Y.L.; Liu, F.T.; Kang, L.Y.; Zhang, D.Y.; Kou, D.; Mao, C.; Qin, S.Q.; Zhang, Q.W.; Yang, Y.H. Large-scale evidence for microbial response and associated carbon release after permafrost thaw. Glob. Chang. Biol. 2021, 27, 3218–3229. [Google Scholar] [CrossRef] [PubMed]
  57. Gruen, D.S.; Wang, D.; Könneke, M.; Begüm, D.T.; Stewart, L.C.; Goldhammer, T.; Holden, J.F.; Hinrichs, K.-U.; Ono, S. Experimental investigation on the controls of clumped isotopologue and hydrogen isotope ratios in microbial methane. Geochim. Cosmochim. Acta 2018, 237, 339–356. [Google Scholar] [CrossRef]
  58. McCalley, C.K.; Woodcroft, B.; Hodgkins, S.B.; Wehr, R.; Kim, E.-H.; Mondav, R.; Crill, P.; Chanton, J.P.; Rich, V.I.; Tyson, G.; et al. Methane dynamics regulated by microbial community response to permafrost thaw. Nature 2014, 514, 478–481. [Google Scholar] [CrossRef] [Green Version]
Figure 1. (a) Location of the study area in the Qinghai-Tibet Plateau, (b) permafrost distribution in the Qilian Mountains, (c) geological map showing the faults and the gas hydrate drilling wells, and (d) landscapes near the well DK-8.
Ijerph 19 02437 g001
Figure 2. Field monitoring method, (a) gas hydrate drilling well DK-8, (b) near-surface soil-free gas monitored by the designed cylindrical soil respiration chamber.
Ijerph 19 02437 g002
Figure 3. Daily temperature curves of low-level air and soil active layer in the Muli permafrost of the Qilian Mountains from January to December in 2017.
Ijerph 19 02437 g003
Figure 4. Content and stable carbon isotopic composition (δ13CCH4) of methane and carbon isotope separation (εC) between CH4 and CO2 effused from the gas hydrate drilling well DK-8.
Ijerph 19 02437 g004
Figure 5. Content and stable carbon isotopic composition of methane (δ13CCH4) and carbon isotope fractionation (εC) between CO2 and CH4 in the free gas of the soil active layer.
Ijerph 19 02437 g005
Figure 6. Qualitative assessment of source CH4 isotopic composition. (a) Keeling plot showing the relationship between δ13CCH4 and the inverse of CH4 content with the intercept of the regression as δs. (b) Miller-Tans plot showing the relationship between δ13CCH4c* [CH4] content and the slope of the regression as δs.
Ijerph 19 02437 g006
Figure 7. The boxplot of the calculated εC values of gas hydrates in the Muli permafrost.
Ijerph 19 02437 g007
Figure 8. Carbon isotopic composition of wetland methane emission showing the seasonal variation of soil-emitted methane source derived from microbial and thermogenic origins.
Ijerph 19 02437 g008
Table 1. Methane content and carbon isotopic compositions of methane and carbon dioxide in the gas effused from the DK8 hydrate gas drilling well and in the free gas of the soil active layer.
Sampling Date[CH4]
(ppm)
δ13CCH4
(‰ vs. PDB)
[CO2]
(ppm)
δ13CCO2
(‰ vs. PDB)
εC (=δ13CCO2 − δ13CCH4)
(‰ vs. PDB)
DK8 well gas
2017/1/61.908 ± 0.018−48.3 ± 1.0413.6 ± 1.3−8.8 ± 0.339.5
2017/1/151.909 ± 0.001−47.9 ± 1.0415.9 ± 5.4 −8.9 ± 0.339.1
2017/2/42.259 ± 0.058−45.2 ± 2.0331.4 ± 9.8 −7.5 ± 0.637.7
2017/2/171.904 ± 0.001−46.9 ± 1.0435.8 ± 26.5 −7.5 ± 1.039.3
2017/3/61.944 ± 0.006−47.2 ± 0.9463.6 ± 8.3 −9.5 ± 0.537.7
2017/3/161.921 ± 0.005−47.0 ± 0.9434.2 ± 14.6 −8.2 ± 0.738.8
2017/3/261.923 ± 0.004−45.5 ± 1.1462.7 ± 6.9 −6.6 ± 1.238.8
2017/4/62.920 ± 0.148−39.9 ± 1.4337.9 ± 10.0 −7.7 ± 0.632.1
2017/4/191.983 ± 0.007−44.9 ± 1.0455.1 ± 14.0 −6.5 ± 1.038.4
2017/5/98.530 ± 1.983−31.5 ± 0.8302.6 ± 22.2 −6.2 ± 0.925.3
2017/5/234.201 ± 0.078−34.6 ± 1.1325.9 ± 1.5 −5.4 ± 1.229.2
2017/6/151.920 ± 0.022−49.0 ± 1.3405.6 ± 0.8 −4.6 ± 1.244.4
2017/7/171.993 ± 0.007−49.6 ± 1.3429.6 ± 2.4 −3.3 ± 0.346.3
2017/8/262.132 ± 0.069−46.2 ± 1.6395.0 ± 5.5 −6.9 ± 0.939.3
Free gas of the active soil layer (10–30 cm depth)
2017/1/151.992 ± 0.086−49.4 ± 1.6437.9 ± 6.0 −9.9 ± 0.439.5
2017/2/41.920 ± 0.045−48.8 ± 1.2471.3 ± 36.0 −9.7 ± 2.839.2
2017/2/171.906 ± 0.003−47.3 ± 1.2435.4 ± 23.6 −7.4 ± 0.940.0
2017/3/61.951 ± 0.006−50.5 ± 1.4464.2 ± 8.0 −9.3 ± 0.441.3
2017/3/161.926 ± 0.005−50.8 ± 1.6436.3 ± 14.5 −8.1 ± 0.642.7
2017/3/261.924 ± 0.069−48.9 ± 2.1466.9 ± 8.2 −6.3 ± 1.342.6
2017/4/62.390 ± 0.303−43.2 ± 1.8474.6 ± 21.9 −9.3 ± 0.733.9
2017/4/191.962 ± 0.016−48.7 ± 1.3445.8 ± 23.0 −9.3 ± 0.439.4
2017/5/91.964 ± 0.077−49.9 ± 1.0426.5 ± 14.0 −7.5 ± 0.842.4
2017/5/231.976 ± 0.110−49.4 ± 2.0407.6 ± 1.8 −7.8 ± 0.941.5
2017/6/151.929 ± 0.012−51.3 ± 1.4438.4 ± 12.0 −8.1 ± 0.943.2
2017/7/171.988 ± 0.005−52.0 ± 1.2503.5 ± 4.1 −4.1 ± 0.347.9
2017/8/262.027 ± 0.047−50.7 ± 1.5441.8 ± 28.6 −4.8 ± 0.846.0
2017/10/181.920 ± 0.017−47.9 ± 1.5425.3 ± 20.7 −10.5 ± 1.537.4
2017/12/21.909 ± 0.001−45.2 ± 1.2778.7 ± 49.8 −13.4 ± 1.031.9
2017/12/121.907 ± 0.004−44.0 ± 1.3663.2 ± 12.4 −14.2 ± 1.329.8
2017/12/281.947 ± 0.018−44.5 ± 1.9576.4 ± 10.5 −15.9 ± 2.128.6
Publisher’s Note: MDPI stays neutral with regard to jurisdictional claims in published maps and institutional affiliations.

