
Modeling COVID-19 Outbreaks in Long-Term Care Facilities Using an Agent-Based Modeling and Simulation Approach

 ,
,  ,
,  , and
, and
Abstract
:1. Introduction
2. Background
3. Materials and Methods
3.1. Disease Simulation Model
3.2. Contact Matrix
4. Results
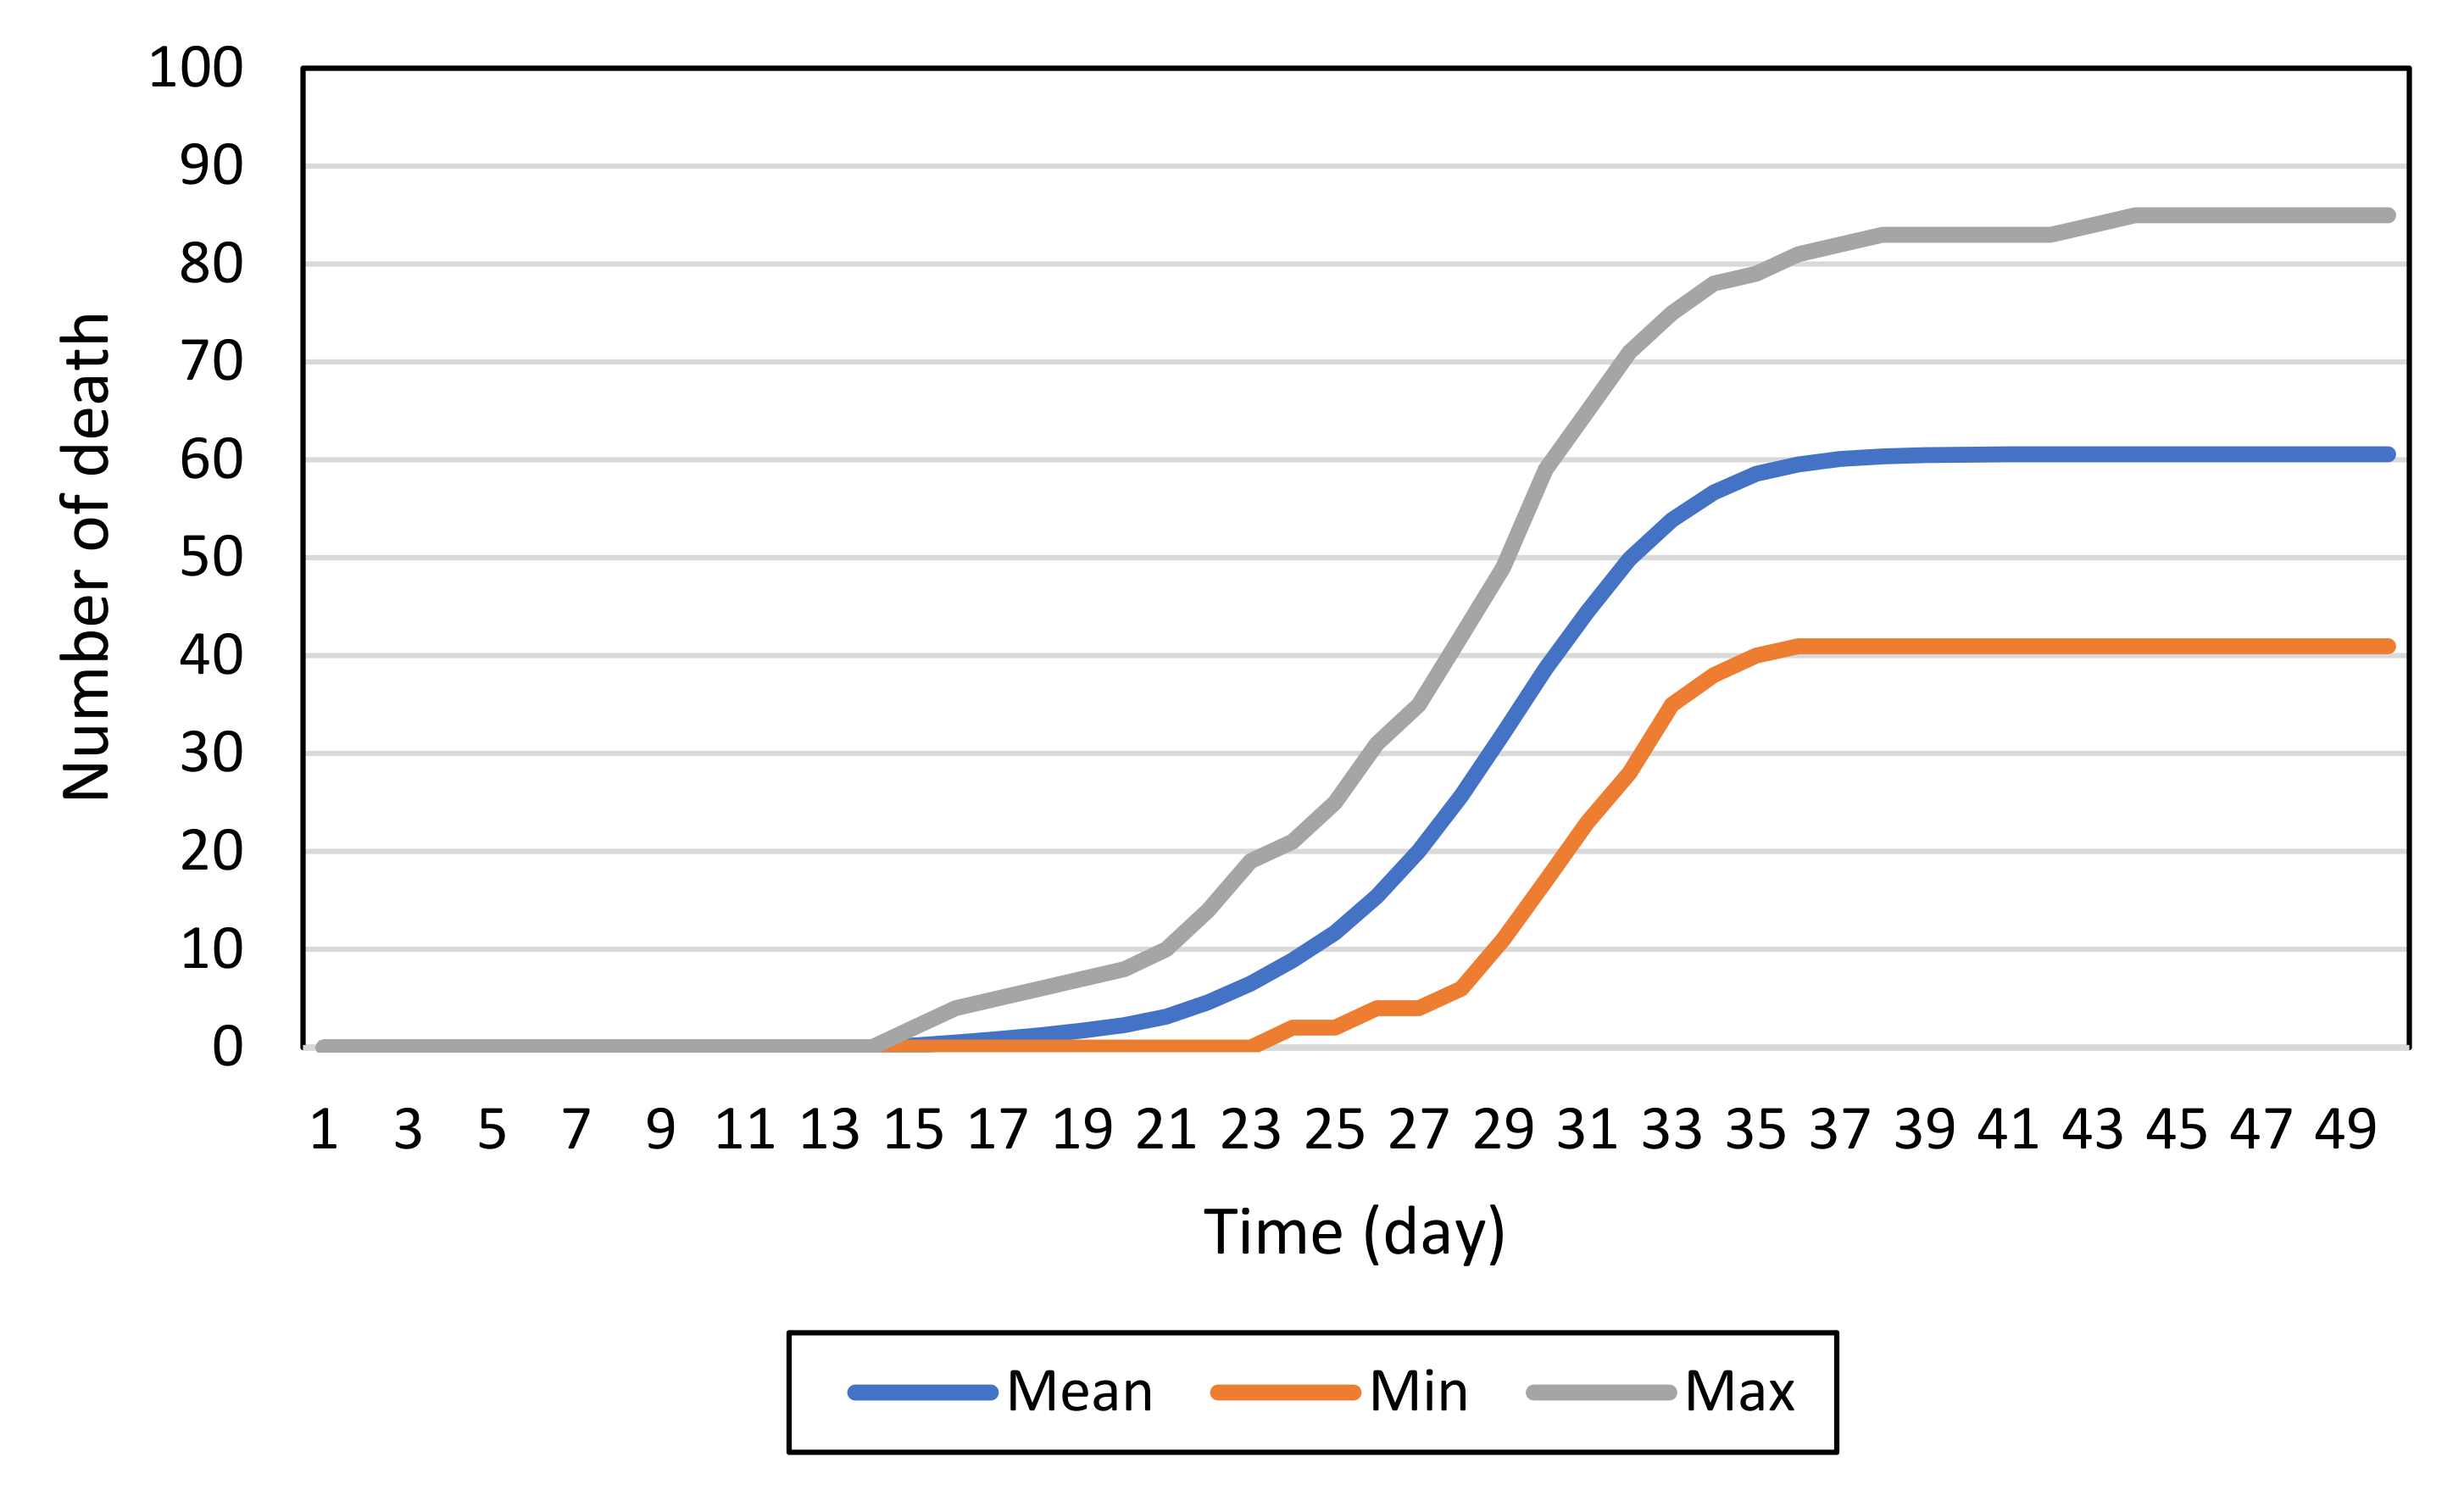
4.1. Baseline Model
4.2. Impacts of Infection Control Measures
4.2.1. PPE Effectiveness
4.2.2. Random Testing
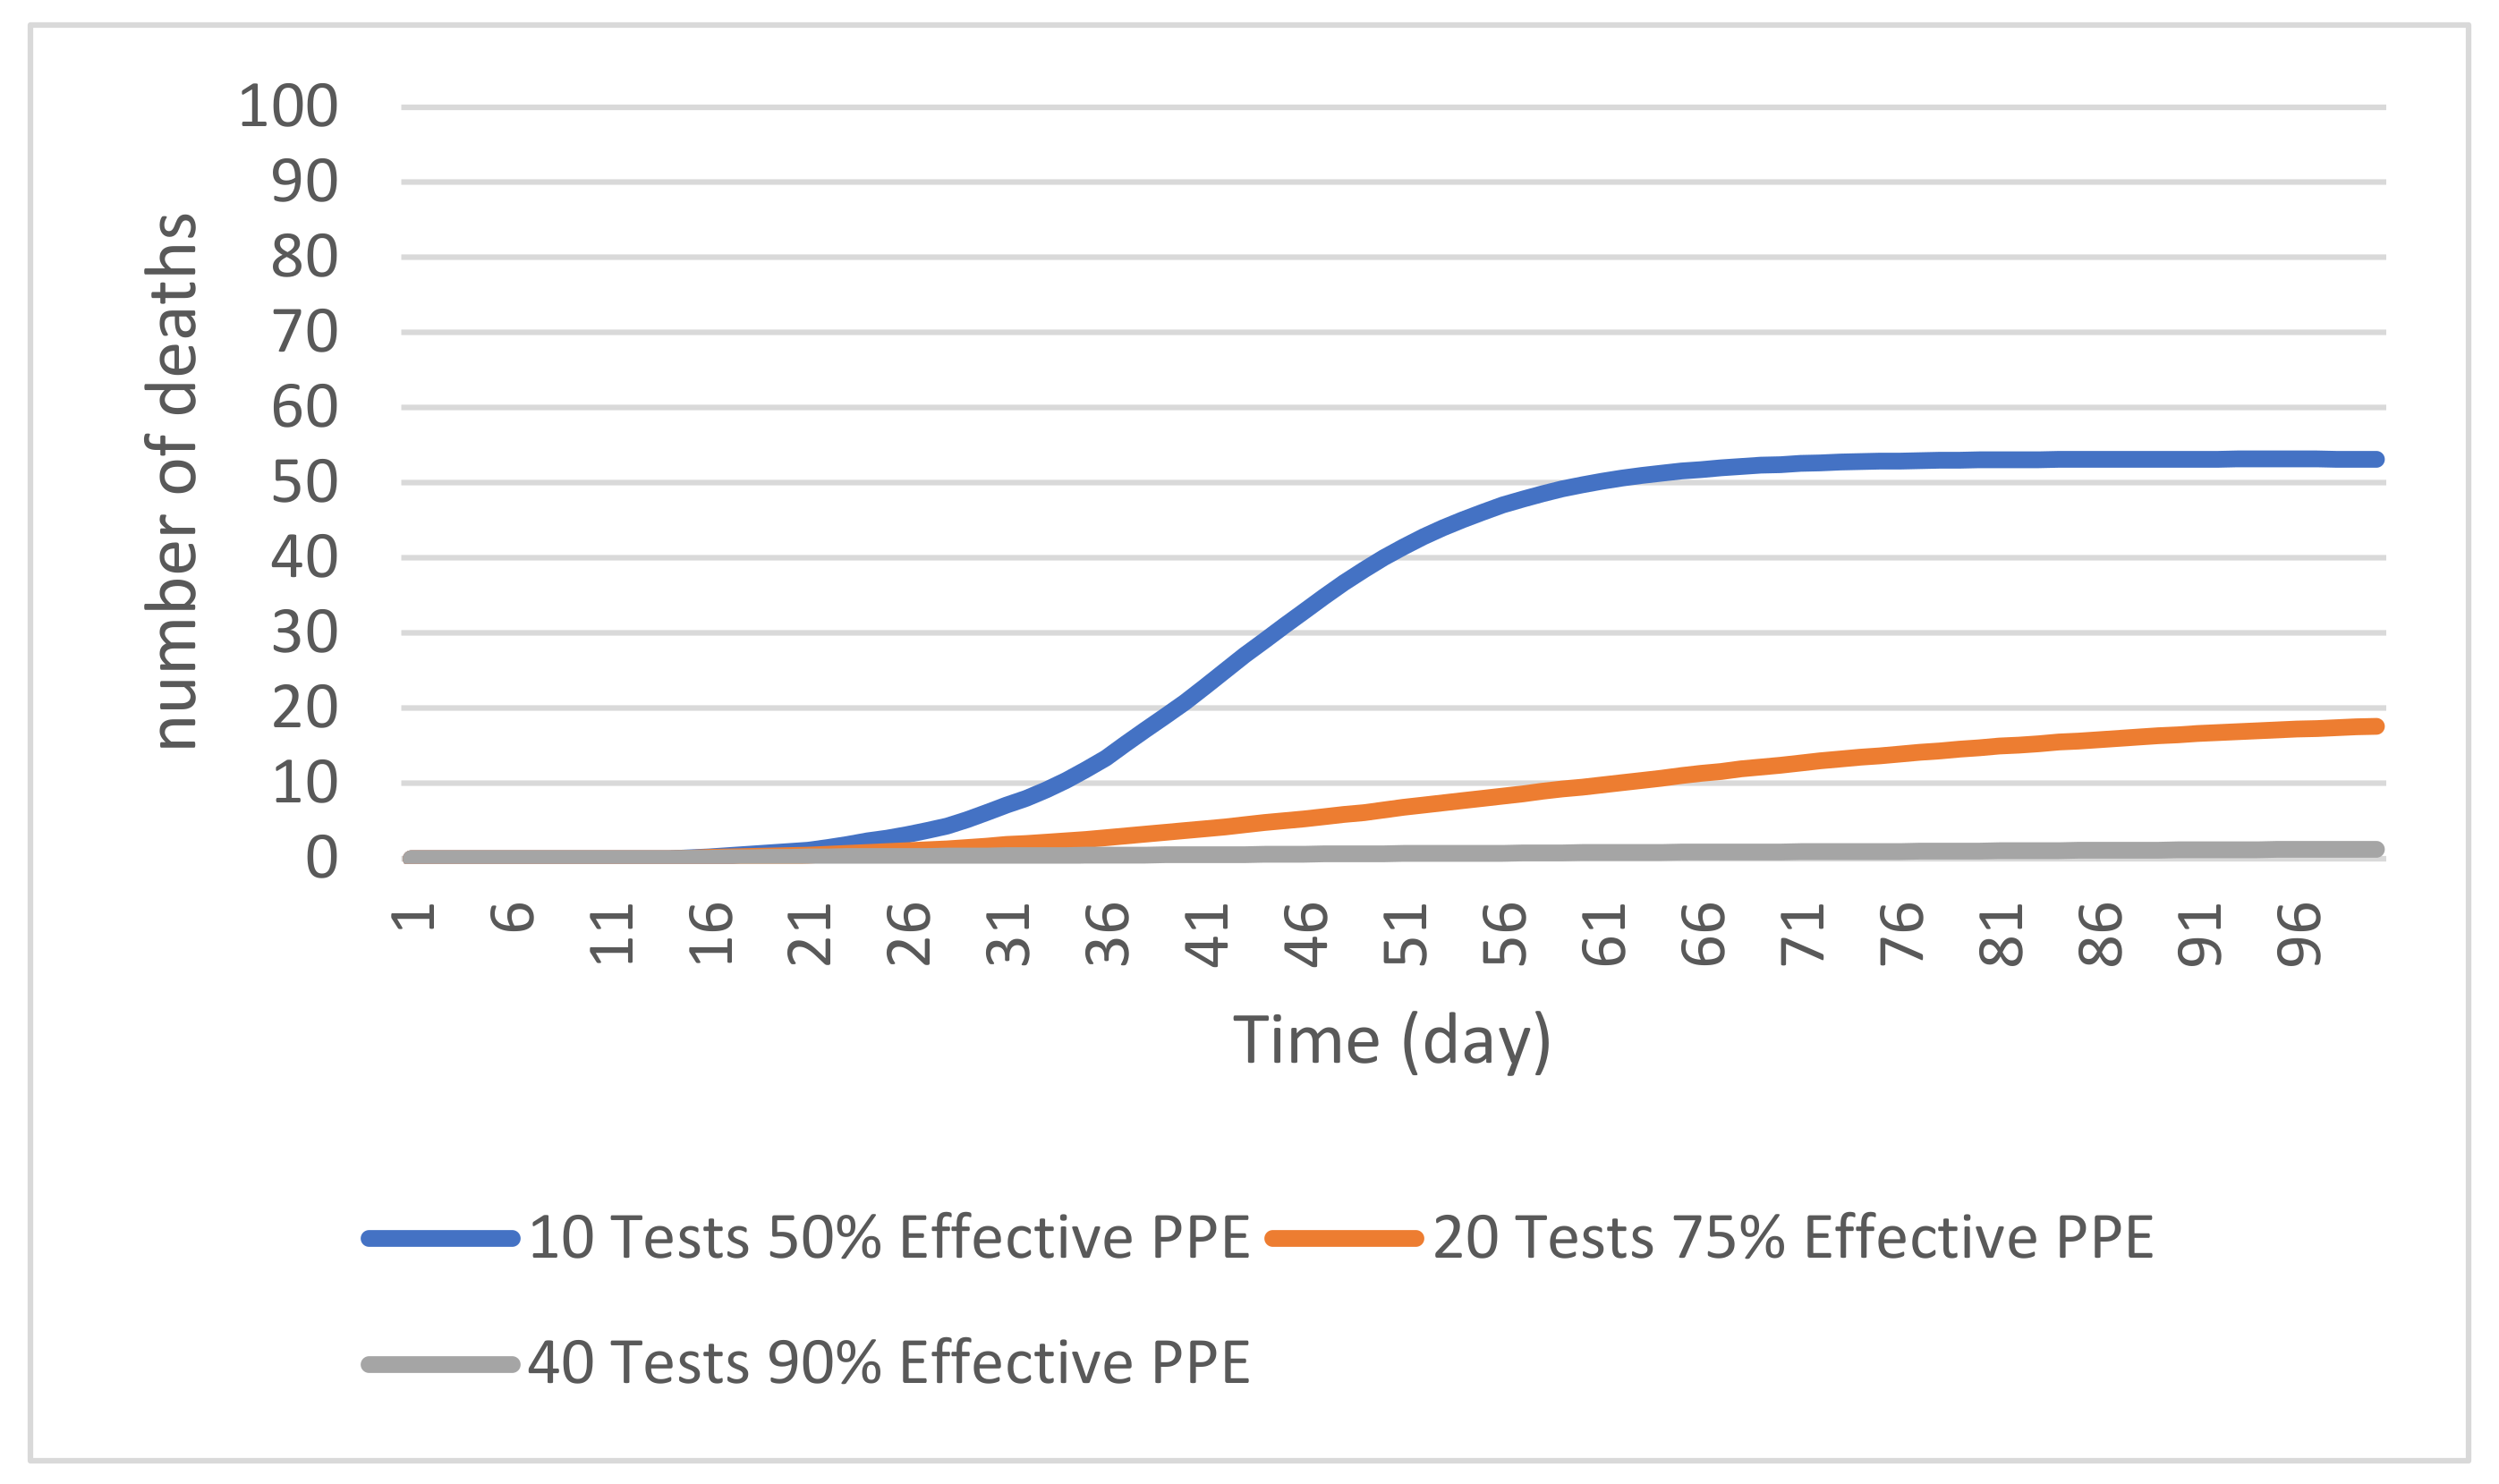
4.2.3. Combined Control Measures
5. Discussion
6. Conclusions
Author Contributions
Funding
Institutional Review Board Statement
Informed Consent Statement
Data Availability Statement
Conflicts of Interest
Appendix A

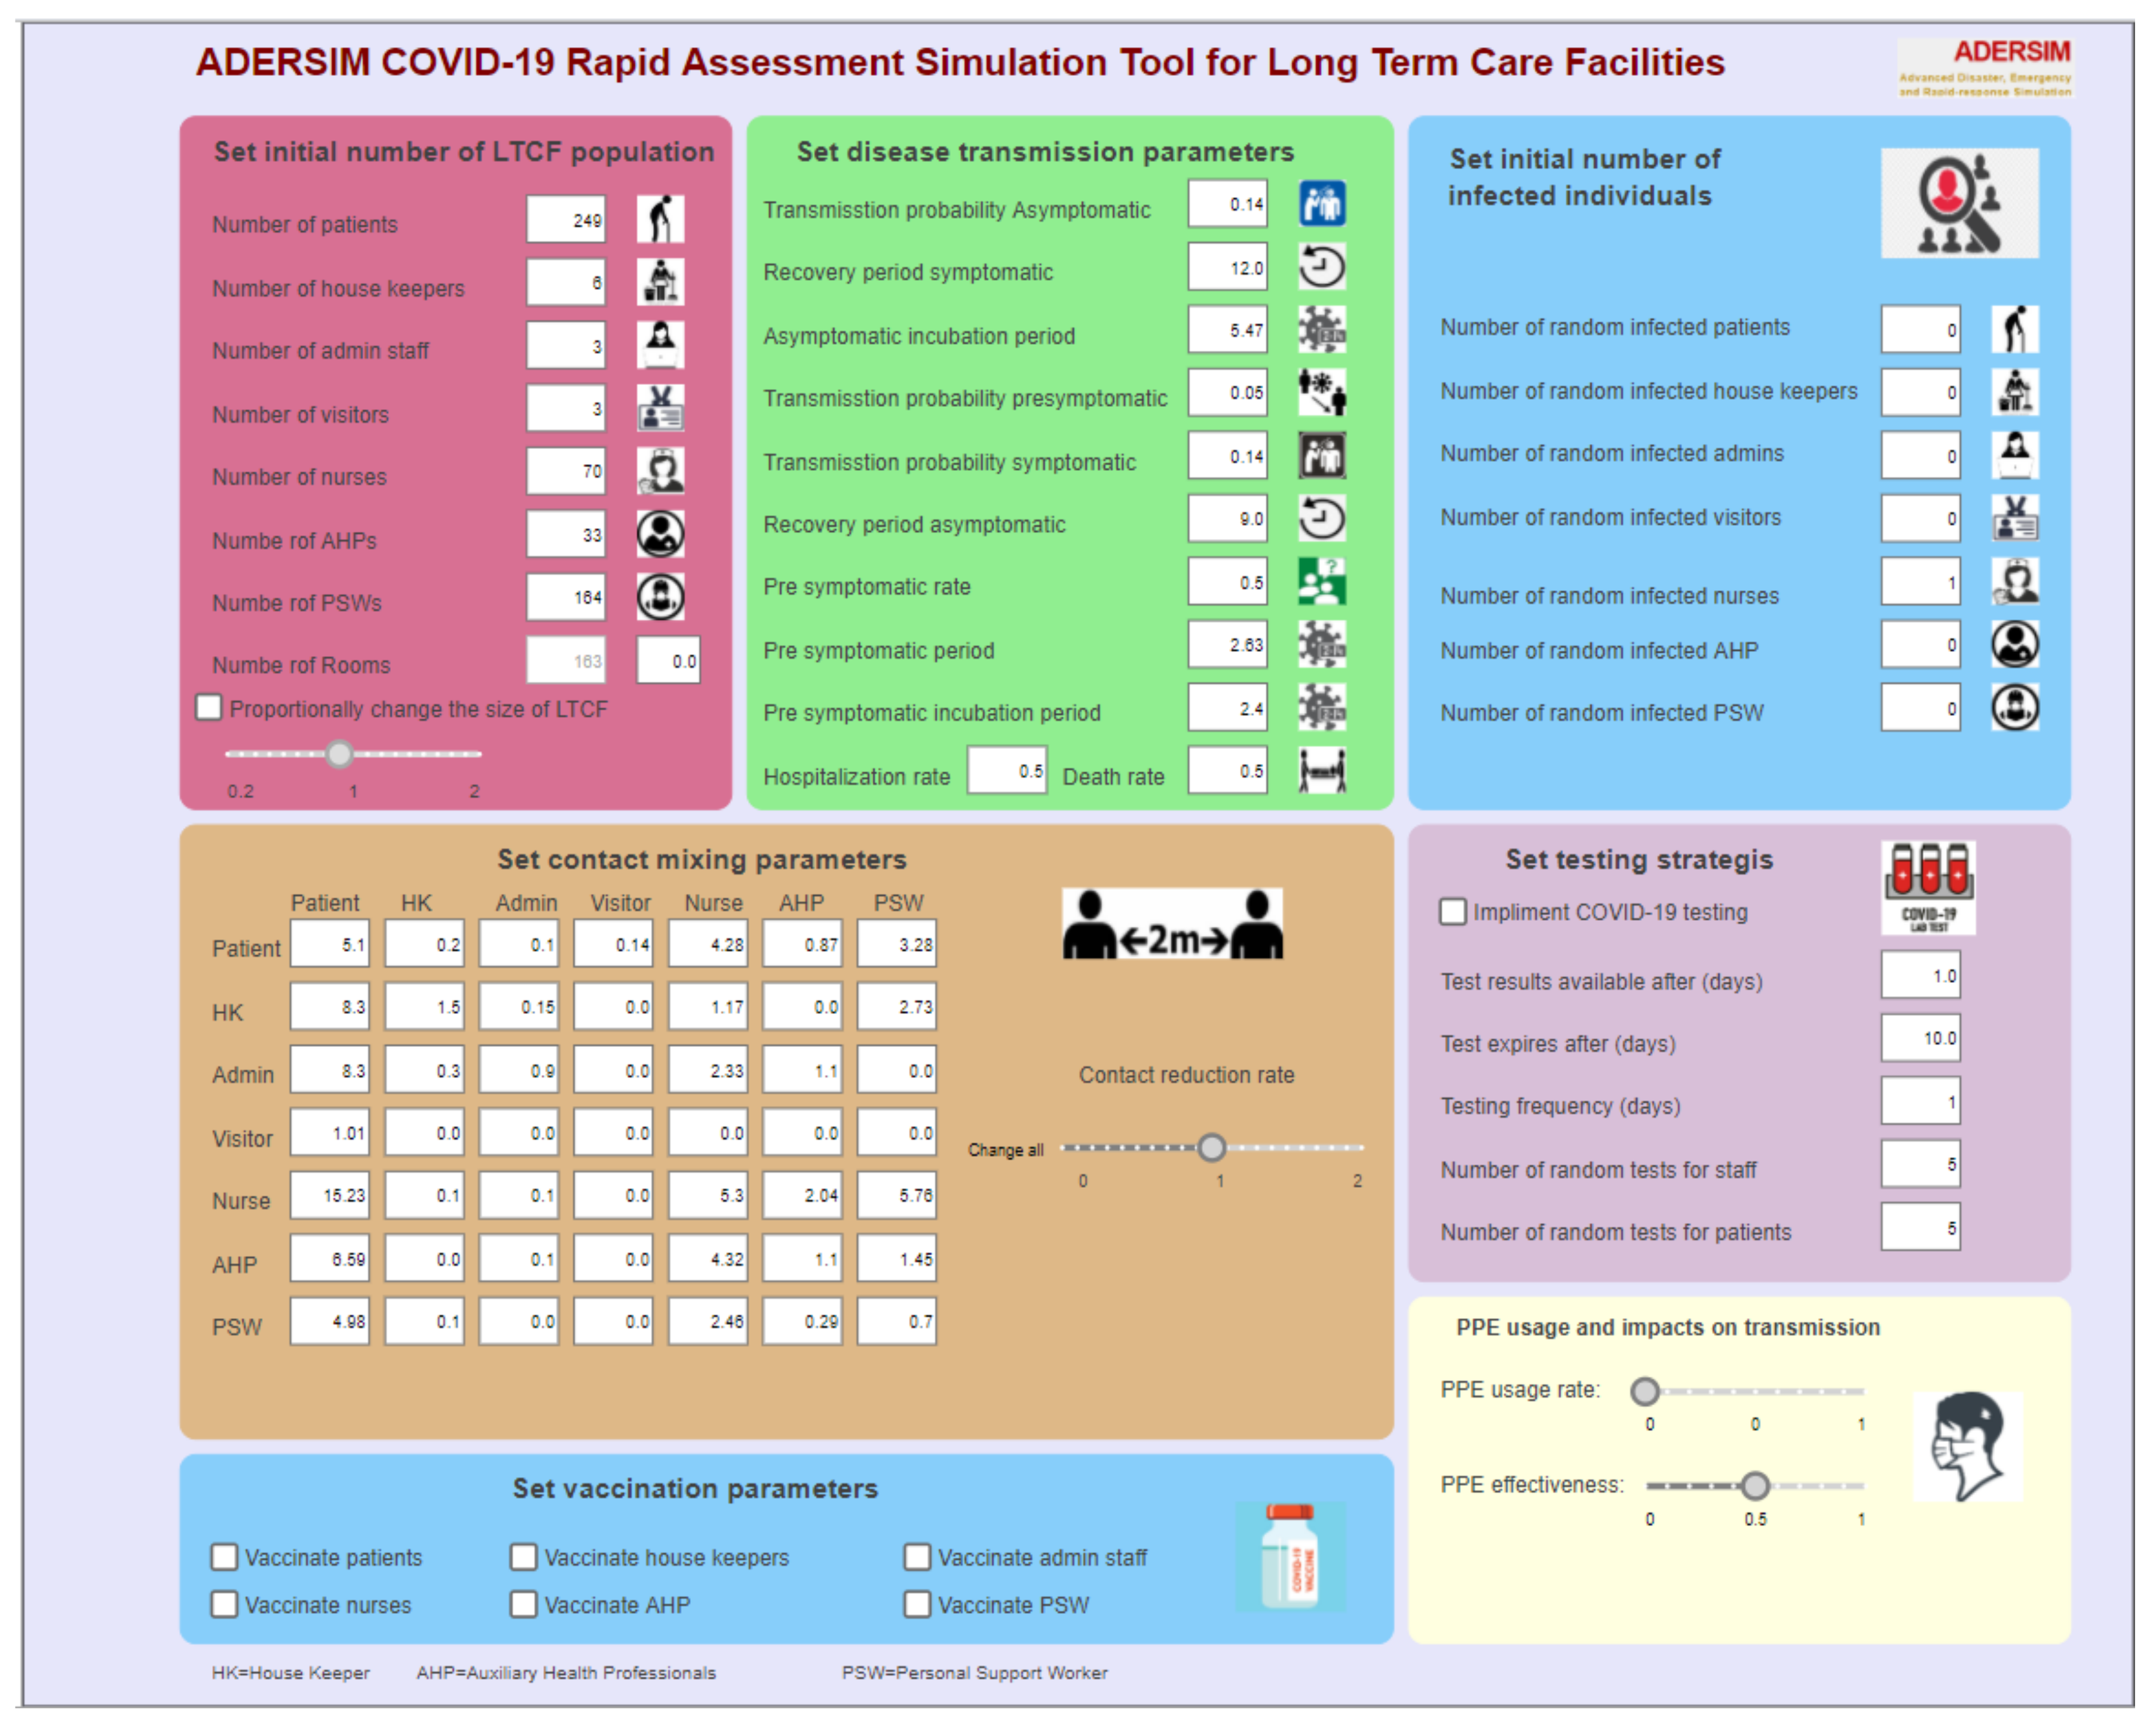
| Purpose | To develop a simulation tool for disease spread in long-term care facilities and examine the impact of different infection scenarios, public health measures including PPE usage, and COVID-19 testing |
| Entities, state variables, and scales | ABM consists of seven entities: (1) resident, (2) personal support worker (PSW), (3) nurse, (4) allied health professional (AHP), (5) administrative staff (admin), (6) housekeeper (HK), and (7) visitor, and each entity has several state variables
|
| Process overview and scheduling | (1) Movement
(4) COVID-19 testing state chart processes the random testing of agents |
| Design concepts Basic principles | The ABMs purpose is to model disease transmision in long-term care facilities based on residents distribution in the facility, close contacts between the residents and various staff working in the facility, and use of different public health meaures to control the disease |
| Interaction Details | There are interactions between patients with other human agents and among other human agents. The interactions are reflected in the contact matrix, see Table 1 |
| Initialization | The simulation models long-term care facilities with a selected number of LTCFs residents and staff |
| Input data | (1) Contact matrix (Table 1) (2) Initial size of the LTCFs (3) Initial number of infected individuals |
| Parameters | The parameters of COVID-19 disease transmission as provided in Table 2 |
References
- Daoust, J.-F. Elderly people and responses to COVID-19 in 27 countries. PLoS ONE 2020, 15, e0235590. [Google Scholar] [CrossRef]
- Fisman, D.N.; Bogoch, I.; Lapointe-Shaw, L.; McCready, J.; Tuite, A.R. Risk factors associated with mortality among residents with Coronavirus disease 2019 (COVID-19) in long-term care facilities in Ontario, Canada. JAMA Netw. Open 2020, 3, e2015957. [Google Scholar] [CrossRef] [PubMed]
- Duval, A.; I-Bird study group; Obadia, T.; Martinet, L.; Boëlle, P.-Y.; Fleury, E.; Guillemot, D.; Opatowski, L.; Temime, L. Measuring dynamic social contacts in a rehabilitation hospital: Effect of wards, patient and staff characteristics. Sci. Rep. 2018, 8, 1686. [Google Scholar] [CrossRef] [PubMed]
- Hunter, E.; Namee, B.M.; Kelleher, J. A taxonomy for agent-based models in human infectious disease epidemiology. J. Artif. Soc. Soc. Simul. 2017, 20, 2. [Google Scholar] [CrossRef] [Green Version]
- Bruch, E.; Atwell, J. Agent-based models in empirical social research. Sociol. Methods Res. 2015, 44, 186–221. [Google Scholar] [CrossRef] [PubMed] [Green Version]
- Hernán, M.A. Invited commentary: Agent-based models for causal inference—Reweighting data and theory in epidemiology. Am. J. Epidemiol. 2015, 181, 103–105. [Google Scholar] [CrossRef] [Green Version]
- El-Sayed, A.M.; Scarborough, P.; Seemann, L.; Galea, S. Social network analysis and agent-based modeling in social epidemiology. Epidemiol. Perspect. Innov. 2012, 9, 1. [Google Scholar] [CrossRef] [Green Version]
- Rakowski, F.; Gruziel, M.; Bieniasz-Krzywiec, Ł.; Radomski, J.P. Influenza epidemic spread simulation for Poland—A large scale, individual based model study. Phys. A Stat. Mech. Its Appl. 2010, 389, 3149–3165. [Google Scholar] [CrossRef]
- Laskowski, M.; Demianyk, B.C.P.; Witt, J.; Mukhi, S.N.; Friesen, M.R.; McLeod, R.D. Agent-based modeling of the spread of influenza-like illness in an emergency department: A simulation study. IEEE Trans. Inf. Technol. Biomed. 2011, 15, 877–889. [Google Scholar] [CrossRef]
- Cooley, P.; Brown, S.; Cajka, J.; Chasteen, B.; Ganapathi, L.; Grefenstette, J.; Hollingsworth, C.R.; Lee, B.Y.; Levine, B.; Wheaton, W.D.; et al. The role of subway travel in an influenza epidemic: A New York City simulation. J. Hered. 2011, 88, 982–995. [Google Scholar] [CrossRef] [Green Version]
- Mao, L. Modeling triple-diffusions of infectious diseases, information, and preventive behaviors through a metropolitan social network—An agent-based simulation. Appl. Geogr. 2014, 50, 31–39. [Google Scholar] [CrossRef] [PubMed]
- Frias-Martinez, E.; Williamson, G.; Frias-Martinez, V. An agent-based model of epidemic spread using human mobility and social network information. In Proceedings of the 2011 IEEE Third International Conference on Privacy, Security, Risk and Trust and 2011 IEEE Third International Conference on Social Computing, Boston, MA, USA, 9–11 October 2011; pp. 57–64. [Google Scholar]
- Duan, W.; Qiu, X.; Cao, Z.; Zheng, X.; Cui, K. Heterogeneous and stochastic agent-based models for analyzing infectious diseases’ super spreaders. IEEE Intell. Syst. 2013, 28, 18–25. [Google Scholar] [CrossRef]
- Tian, Y.; Osgood, N.D.; Al-Azem, A.; Hoeppner, V.H. Evaluating the effectiveness of contact tracing on tuberculosis outcomes in Saskatchewan using individual-based modeling. Health Educ. Behav. 2013, 40, 98–110. [Google Scholar] [CrossRef] [PubMed]
- Crooks, A.; Hailegiorgis, A.B. An agent-based modeling approach applied to the spread of cholera. Environ. Model. Softw. 2014, 62, 164–177. [Google Scholar] [CrossRef]
- Venkatramanan, S.; Lewis, B.; Chen, J.; Higdon, D.; Vullikanti, A.; Marathe, M. Using data-driven agent-based models for forecasting emerging infectious diseases. Epidemics 2018, 22, 43–49. [Google Scholar] [CrossRef]
- Perez, L.; Dragicevic, S. An agent-based approach for modeling dynamics of contagious disease spread. Int. J. Health Geogr. 2009, 8, 50. [Google Scholar] [CrossRef] [Green Version]
- Hunter, E.; Namee, B.M.; Kelleher, J. An open-data-driven agent-based model to simulate infectious disease outbreaks. PLoS ONE 2018, 13, e0208775. [Google Scholar] [CrossRef]
- Kang, J.-Y.; Aldstadt, J. Using multiple scale spatio-temporal patterns for validating spatially explicit agent-based models. Int. J. Geogr. Inf. Sci. 2018, 33, 193–213. [Google Scholar] [CrossRef]
- Hoertel, N.; Blachier, M.; Blanco, C.; Olfson, M.; Massetti, M.; Rico, M.S.; Limosin, F.; Leleu, H. A stochastic agent-based model of the SARS-CoV-2 epidemic in France. Nat. Med. 2020, 26, 1417–1421. [Google Scholar] [CrossRef]
- Asgary, A.; Cojocaru, M.G.; Najafabadi, M.M.; Wu, J. Simulating preventative testing of SARS-CoV-2 in schools: Policy implications. BMC Public Health 2021, 21, 125. [Google Scholar] [CrossRef]
- Gomez, J.; Prieto, J.; Leon, E.; Rodríguez, A. INFEKTA—An agent-based model for transmission of infectious diseases: The COVID-19 case in Bogotá, Colombia. PLoS ONE 2021, 16, e0245787. [Google Scholar] [CrossRef] [PubMed]
- Kou, L.; Wang, X.; Li, Y.; Guo, X.; Zhang, H. A multi-scale agent-based model of infectious disease transmission to assess the impact of vaccination and non-pharmaceutical interventions: The COVID-19 case. J. Saf. Sci. Resil. 2021, 2, 199–207. [Google Scholar] [CrossRef]
- Nguyen, L.K.N.; Howick, S.; McLafferty, D.; Anderson, G.H.; Pravinkumar, S.J.; van der Meer, R.; Megiddo, I. Evaluating intervention strategies in controlling coronavirus disease 2019 (COVID-19) spread in care homes: An agent-based model. Infect. Control. Hosp. Epidemiol. 2021, 42, 1060–1070. [Google Scholar] [CrossRef] [PubMed]
- Smith, D.R.M.; Duval, A.; Pouwels, K.; Guillemot, D.; Fernandes, J.; Huynh, B.-T.; Temime, L.; Opatowski, L. Optimizing COVID-19 surveillance in long-term care facilities: A modelling study. BMC Med. 2020, 18, 386. [Google Scholar] [CrossRef] [PubMed]
- Centers for Disease Control and Prevention. Coronavirus (COVID-19) Frequently Asked Questions. Available online: https://www.cdc.gov/coronavirus/2019-ncov/faq.html (accessed on 9 November 2020).
- Stall, N.M.; Jones, A.; Brown, K.A.; Rochon, P.A.; Costa, A.P. For-profit long-term care homes and the risk of COVID-19 outbreaks and resident deaths. Can. Med. Assoc. J. 2020, 192, E946–E955. [Google Scholar] [CrossRef]
- Public Health Agency of Canada. Coronavirus Disease (COVID-19). Available online: https://www.canada.ca/en/public-health/services/diseases/coronavirus-disease-COVID-19.html (accessed on 9 November 2020).
- McMichael, T.M.; Currie, D.W.; Clark, S.; Pogosjans, S.; Kay, M.; Schwartz, N.G.; Lewis, J.; Baer, A.; Kawakami, V.; Lukoff, M.D.; et al. Epidemiology of COVID-19 in a long-term care facility in King County, Washington. N. Engl. J. Med. 2020, 382, 2005–2011. [Google Scholar] [CrossRef]
- Ontario Long Term Care Association. This Is Long Term Care 2019. Available online: https://www.oltca.com/OLTCA/Documents/Reports/TILTC2019web.pdf (accessed on 6 May 2020).
- Ministry of Long-Term Care. Long-Term Care Staffing Study. Available online: https://files.ontario.ca/mltc-long-term-care-staffing-study-en-2020-07-31.pdf (accessed on 3 December 2020).
- Ontario Long Term Care Association. Ontario Long Term Care Facts and Figures. Available online: https://www.oltca.com/oltca/OLTCA/Public/LongTermCare/FactsFigures.aspx (accessed on 1 March 2021).
- Ministry of Health and Long-Term Care. Long-Term Care Home Design Manual 2015. Available online: http://www.health.gov.on.ca/en/public/programs/ltc/docs/home_design_manual.pdf (accessed on 4 December 2020).
- Najafi, M.; Laskowski, M.; de Boer, P.T.; Williams, E.; Chit, A.; Moghadas, S.M. The effect of individual movements and interventions on the spread of influenza in long-term care facilities. Med. Decis. Mak. 2017, 37, 871–881. [Google Scholar] [CrossRef]
- Public Health Ontario. Best Practices for Environmental Cleaning for Prevention and Control of Infections in All Health Care Settings, 3rd Edition. Available online: https://www.publichealthontario.ca/-/media/documents/b/2018/bp-environmental-cleaning.pdf?la=en (accessed on 4 December 2020).
- Rajagopal, K.; Hasanzadeh, N.; Parastesh, F.; Hamarash, I.I.; Jafari, S.; Hussain, I. A fractional-order model for the novel coronavirus (COVID-19) outbreak. Nonlinear Dyn. 2020, 101, 711–718. [Google Scholar] [CrossRef]
- Holmdahl, I.; Buckee, C. Wrong but useful—What COVID-19 epidemiologic models can and cannot tell us. N. Engl. J. Med. 2020, 383, 303–305. [Google Scholar] [CrossRef]
- Taylor, G. OP Laser-JTFC Observations in Long Term Care Facilities in Ontario. Available online: https://www.tvo.org/article/COVID-19-read-the-canadian-forces-report-on-long-article-care (accessed on 10 November 2020).
- Rolland, Y.; Benetos, A.; Villars, H.; Braun, H.; Blain, H. A COVID-19 support platform for long term care facilities. J. Nutr. Health Aging 2020, 24, 461–462. [Google Scholar] [CrossRef] [Green Version]
- Howard, J.; Huang, A.; Li, Z.; Tufekci, Z.; Zdimal, V.; van der Westhuizen, H.-M.; von Delft, A.; Price, A.; Fridman, L.; Tang, L.-H.; et al. An evidence review of face masks against COVID-19. Proc. Natl. Acad. Sci. USA 2021, 118, e2014564118. [Google Scholar] [CrossRef] [PubMed]
- Love, J.; Keegan, L.T.; Angulo, F.J.; McLaughlin, J.M.; Shea, K.M.; Swerdlow, D.L.; Samore, M.H.; Toth, D.J.A. Continued need for non-pharmaceutical interventions after COVID-19 vaccination in long-term-care facilities. Sci. Rep. 2021, 11, 18093. [Google Scholar] [CrossRef] [PubMed]


| Resident | HK | Admin | Visitor | Nurse | AHP | PSW | |
|---|---|---|---|---|---|---|---|
| Resident | 5.1 | 0.2 | 0.1 | 0.14 | 4.28 | 0.87 | 3.28 |
| HK | 8.3 | 1.5 | 0.15 | 0 | 1.17 | 0 | 2.73 |
| Admin | 8.3 | 0.3 | 0.9 | 0 | 2.33 | 1.1 | 0 |
| Visitor | 1.01 | 0 | 0 | 0 | 0 | 0 | 0 |
| Nurse | 15.23 | 0.1 | 0.1 | 0 | 5.3 | 2.04 | 5.76 |
| AHP | 6.59 | 0 | 0.1 | 0 | 4.32 | 1.1 | 1.45 |
| PSW | 4.98 | 0.1 | 0 | 0 | 2.46 | 0.29 | 0.7 |
| Parameter Name | Value (Unit) |
|---|---|
| Transmission Probability | 14% (per each contact) |
| Symptomatic Recovery Period | 12 (days) |
| Asymptomatic Incubation Period | 5.47 (days) |
| Transmission Probability Pre-symptomatic | 3% (per contact) |
| Transmission Probability Asymptomatic | 14% (per contact) |
| Recovery Period Asymptomatic | 9 (days) |
| Residents Death Rate | 30% |
| Pre-symptomatic Period | 2.63 (days) |
| Pre-Symptomatic Rate | 50% (per person infected) |
| Pre-Symptomatic Incubation Period | 2.4 (days) |
| Outbreak Progression Day (Day the Simulation Begins) | 0 |
| LTCF | Camilla | Forest | Downsview | Orchard | Seven Oaks | ||||
|---|---|---|---|---|---|---|---|---|---|
| Death Rate | 0.3 | 0.4 | 0.3 | 0.2 | 0.3 | 0.3 | 0.4 | 0.3 | 0.2 |
| Simulated Deaths | 61 | 82 | 61 | 41 | 61 | 61 | 81 | 69 | 24 |
| Observed Deaths | 68 | 68 | 51 | 51 | 63 | 70 | 70 | 41 | 41 |
| % Error | 11.5 | −17.1 | −16.4 | 24.4 | 3.3 | 14.8 | −13.6 | −40.6 | 70.8 |
Publisher’s Note: MDPI stays neutral with regard to jurisdictional claims in published maps and institutional affiliations. |
© 2022 by the authors. Licensee MDPI, Basel, Switzerland. This article is an open access article distributed under the terms and conditions of the Creative Commons Attribution (CC BY) license (https://creativecommons.org/licenses/by/4.0/).
Share and Cite
Asgary, A.; Blue, H.; Solis, A.O.; McCarthy, Z.; Najafabadi, M.; Tofighi, M.A.; Wu, J. Modeling COVID-19 Outbreaks in Long-Term Care Facilities Using an Agent-Based Modeling and Simulation Approach. Int. J. Environ. Res. Public Health 2022, 19, 2635. https://doi.org/10.3390/ijerph19052635
Asgary A, Blue H, Solis AO, McCarthy Z, Najafabadi M, Tofighi MA, Wu J. Modeling COVID-19 Outbreaks in Long-Term Care Facilities Using an Agent-Based Modeling and Simulation Approach. International Journal of Environmental Research and Public Health. 2022; 19(5):2635. https://doi.org/10.3390/ijerph19052635
Chicago/Turabian StyleAsgary, Ali, Hudson Blue, Adriano O. Solis, Zachary McCarthy, Mahdi Najafabadi, Mohammad Ali Tofighi, and Jianhong Wu. 2022. "Modeling COVID-19 Outbreaks in Long-Term Care Facilities Using an Agent-Based Modeling and Simulation Approach" International Journal of Environmental Research and Public Health 19, no. 5: 2635. https://doi.org/10.3390/ijerph19052635
APA StyleAsgary, A., Blue, H., Solis, A. O., McCarthy, Z., Najafabadi, M., Tofighi, M. A., & Wu, J. (2022). Modeling COVID-19 Outbreaks in Long-Term Care Facilities Using an Agent-Based Modeling and Simulation Approach. International Journal of Environmental Research and Public Health, 19(5), 2635. https://doi.org/10.3390/ijerph19052635