

Twenty-Year Mortality Trends in Patients with Kidney Disease in Poland with the Use of the Years of Life Lost Measure, 2000–2019

 , and
, and
Abstract
:1. Introduction
2. Materials and Methods
2.1. Research Material
2.2. Statistical Analysis
2.3. Ethics Approval
3. Results
4. Discussion
Limitations of the Study
5. Conclusions
Supplementary Materials
Author Contributions
Funding
Institutional Review Board Statement
Informed Consent Statement
Data Availability Statement
Conflicts of Interest
References
- Rutkowski, B. Chronic kidney disease—ten years in the theory and practice. Forum. Nefrol. 2013, 6, 63–70. [Google Scholar]
- GBD Chronic Kidney Disease Collaboration. Global, regional, and national burden of chronic kidney disease, 1990–2017: A systematic analysis for the Global Burden of Disease Study 2017. Lancet 2020, 395, 709–733. [Google Scholar] [CrossRef]
- Sarnak, M.J.; Levey, A.S.; Schoolwerth, A.C. Kidney disease as a risk factor for development of cardiovascular disease: A statement from the American Heart Association councils on kidney in cardiovascular disease, high blood pressure research, clinical cardiology, and epidemiology and prevention. Circulation 2003, 108, 2154–2169. [Google Scholar] [CrossRef]
- GBD 2019 Diseases and Injuries Collaborators. Global burden of 369 diseases and injuries in 204 countries and territories, 1990–2019: A systematic analysis for the Global Burden of Disease Study 2019. Lancet 2020, 396, 1204–1222. [Google Scholar] [CrossRef]
- GBD Results Tool. Available online: http://ghdx.healthdata.org/gbd-results-tool (accessed on 24 January 2022).
- WHO. Methods and Data Sources for Global Burden of Disease Estimates 2000–2019. Available online: https://cdn.who.int/media/docs/default-source/gho-documents/global-health-estimates/ghe2019_daly-methods.pdf?sfvrsn=31b25009_7 (accessed on 21 January 2022).
- Murray, C.J.; Lopez, A.D. Global Burden of Diseases; University Medical Publishing House Vesalius: Warsaw, Poland, 2000. [Google Scholar]
- Carter, A.J.; Nguyen, C.N. A comparison of cancer burden and research spending reveals discrepancies in the distribution of research funding. BMC Public Health 2012, 12, 526. [Google Scholar] [CrossRef] [PubMed]
- Gouda, H.N.; Powles, J.W. Why my disease is important: Metrics of disease occurrence used in the introductory sections of papers in three leading general medical journals in 1993 and 2003. Popul. Health Metr. 2011, 9, 14. [Google Scholar] [CrossRef] [PubMed]
- Revision of the European Standard Population. Available online: https://ec.europa.eu/eurostat/documents/3859598/5926869/KS-RA-13-028-EN.PDF/e713fa79-1add-44e8-b23d-5e8fa09b3f8f (accessed on 14 June 2021).
- Central Statistical Office in Poland. Local Data Bank. Available online: http://www.bdl.stat.gov.pl (accessed on 24 January 2022).
- Murray, C.J.; Ezzati, M.; Flaxman, A.D.; Ezzati, M.; Flaxman, A.D.; Lim, S.; Lozano, R.; Michaud, C.; Naghavi, M.; Salomon, J.A.; et al. GBD 2010: Design, definitions, and metrics. Lancet 2012, 380, 2063–2066. [Google Scholar] [CrossRef]
- National Cancer Institute. Surveillance Research Program, Statistical Methodology and Applications Branch. Joinpoint Regression Program, Version 4.8.0.1. Available online: https://surveillance.cancer.gov/joinpoint/ (accessed on 5 June 2021).
- Kim, H.J.; Fay, M.P.; Feuer, E.J.; Midthune, D.N. Permutation tests for joinpoint regression with applications to cancer rates. Stat. Med. 2000, 19, 335–351. [Google Scholar] [CrossRef]
- Pikala, M.; Burzyńska, M.; Maniecka-Bryła, I. Epidemiology of Mortality Due to Prostate Cancer in Poland, 2000–2015. Int. J. Environ. Res. Public Health 2019, 16, 2881. [Google Scholar] [CrossRef]
- Burzyńska, M.; Maniecka-Bryła, I.; Pikala, M. Trends of mortality due to breast cancer in Poland 2000–2016. BMC Public Health 2020, 20, 120. [Google Scholar] [CrossRef]
- Ke, C.; Liang, J.; Liu, M.; Liu, S.; Wang, C. Burden of chronic kidney disease and its risk-attributable burden in 137 low-and middle-income countries, 1990–2019: Results from the global burden of disease study 2019. BMC Nephrol. 2022, 23, 17. [Google Scholar] [CrossRef]
- Bikbov, B.; Perico, N.; Remuzzi, G.; on behalf of the GBD Genitourinary Diseases Expert Group. Disparities in Chronic Kidney Disease Prevalence among Males and Females in 195 Countries: Analysis of the Global Burden of Disease 2016 Study. Nephron 2018, 139, 313–318. [Google Scholar] [CrossRef] [PubMed]
- Carrero, J.J.; Hecking, M.; Chesnaye, N.C.; Jager, K.J. Sex and gender disparities in the epidemiology and outcomes of chronic kidney disease. Nat. Rev. Nephrol. 2018, 14, 151–164. [Google Scholar] [CrossRef] [PubMed]
- De La Mata, N.L.; Rosales, B.; MacLeod, G.; Kelly, P.J.; Masson, P.; Morton, R.L.; Wyburn, K.; Webster, A.C. Sex differences in mortality among binational cohort of people with chronic kidney disease: Population based data linkage study. BMJ 2021, 375, e068247. [Google Scholar] [CrossRef]
- Xie, Y.; Bowe, B.; Mokdad, A.H.; Xian, H.; Yan, Y.; Li, T.; Maddukuri, G.; Tsai, C.; Floyd, T.; Al-Aly, Z. Analysis of the Global Burden of Disease study highlights the global, regional, and national trends of chronic kidney disease epidemiology from 1990 to 2016. Kidney Int. 2018, 94, 567–581. [Google Scholar] [CrossRef] [PubMed]
- Jager, K.J.; Fraser, S.D.S. The ascending rank of chronic kidney disease in the global burden of disease study. Nephrol. Dial. Transpl. 2017, 32 (Suppl. S2), 121–128. [Google Scholar] [CrossRef]
- Eurostat. Statistics Explained. Available online: http://ec.europe.eu/eurostat.statistics-explained//index.php?title+Ageing_Europe_-_statistics_on_population_developments (accessed on 15 July 2021).
- Dębka-Ślizień, A.; Rutkowski, B.; Rutkowski, P.; Jagodziński, P.; Korejwo, G.; Przygoda, J.; Lewandowska, D.; Czerwiński, J.; Kamiński, A.; Gellert, R. Current status of renal replacement therapy in Poland in 2019. Nefrol. Dial. Pol. 2020, 24, 38–50. [Google Scholar]
- Topor-Madry, R.; Wojtyniak, B.; Strojek, K.; Rutkowski, D.; Bogusławski, S.; Ignaszewska-Wyrzykowska, A.; Jarosz-Chobot, P.; Czech, M.; Kozierkiewicz, A.; Chlebus, K.; et al. Prevalence of diabetes in Poland: A combined analysis of national databases. Diabet. Med. 2019, 36, 1209–1216. [Google Scholar] [CrossRef]
- Puzianowska-Kuźnicka, M.; Januszkiewicz-Caulier, J.; Kuryłowicz, A.; Mossakowska, M.; Zdrojewski, T.; Szybalska, A.; Skalska, A.; Chudek, J.; Franek, E. Prevalence and socioeconomic predictors of diagnosed and undiagnosed diabetes in oldest-old and younger Caucasian seniors: Results from the PolSenior study. Endokrynol. Pol. 2021, 72, 249–255. [Google Scholar] [CrossRef]
- Suligowska, K.; Gajewska, M.; Stokwiszewski, J.; Gaciong, Z.; Bandosz, P. Insufficient knowledge of adults in Poland on criteria of arterial hypertension and its complications—results of the NATPOL 2011 survey. Nadciśn. Tętn. 2014, 18, 9–18. [Google Scholar]
- Zdrojewski, T.; Wizner, B.; Więcek, A.; Ślusarczyk, P.; Chudek, J.; Mossakowska, M.; Bandosz, P.; Bobak, M.; Kozakiewicz, K.; Broda, G.; et al. Prevalence, awareness, and control of hypertension in elderly and very elderly in Poland: Results of a cross-sectional representative survey. J. Hypertens. 2016, 34, 532–538. [Google Scholar] [CrossRef]
- Khan, M.A.B.; Hashim, M.J.; King, J.K.; Govender, R.D.; Mustafa, H.; Al Kaabi, J. Epidemiology of Type 2 Diabetese—Global Burden of Disease and Forecasted Trends. J. Epidemiol. Global. Health 2020, 10, 107–111. [Google Scholar] [CrossRef] [PubMed]
- Mills, K.T.; Stefanescu, A.; He, J. The global epidemiology of hypertension. Nat. Rev. Nephrol. 2020, 16, 223–237. [Google Scholar] [CrossRef] [PubMed]
- Unequal Treatment for Kidney Patients in Europe. Patients Survey and Analysis of Renal Care across the European Union, European Kidney Patients’ Federation, April 2012. Available online: http://www.ceapir.org/wb/pages/home/renal-survey.php (accessed on 28 August 2021).
- Couser, W.G.; Remuzzi, G.; Mendis, S.; Tonelli, M. The contribution of chronic kidney disease to the global burden of major noncommunicable diseases. Kidney Int. 2011, 80, 1258–1270. [Google Scholar] [CrossRef] [PubMed]
- Cierniak, M. Na co Umarł Pacjent—Czyli, co Jest Wpisywane na Kartach Zgonów? Available online: http://stat.gov.pl/download/gfx/portalinformacyjny/pl/defaultaktualnosci/5746/1/1/2/l_na_co_umarl_pacjent.pdf (accessed on 23 January 2022).
- Wojtyniak, B.; Jankowski, K.; Zdrojewski, T.; Opolski, G. Regional differences in determining cardiovascular diseases as the cause of death in Poland: Time for change. Kardiol. Pol. 2012, 70, 695–701. [Google Scholar] [PubMed]

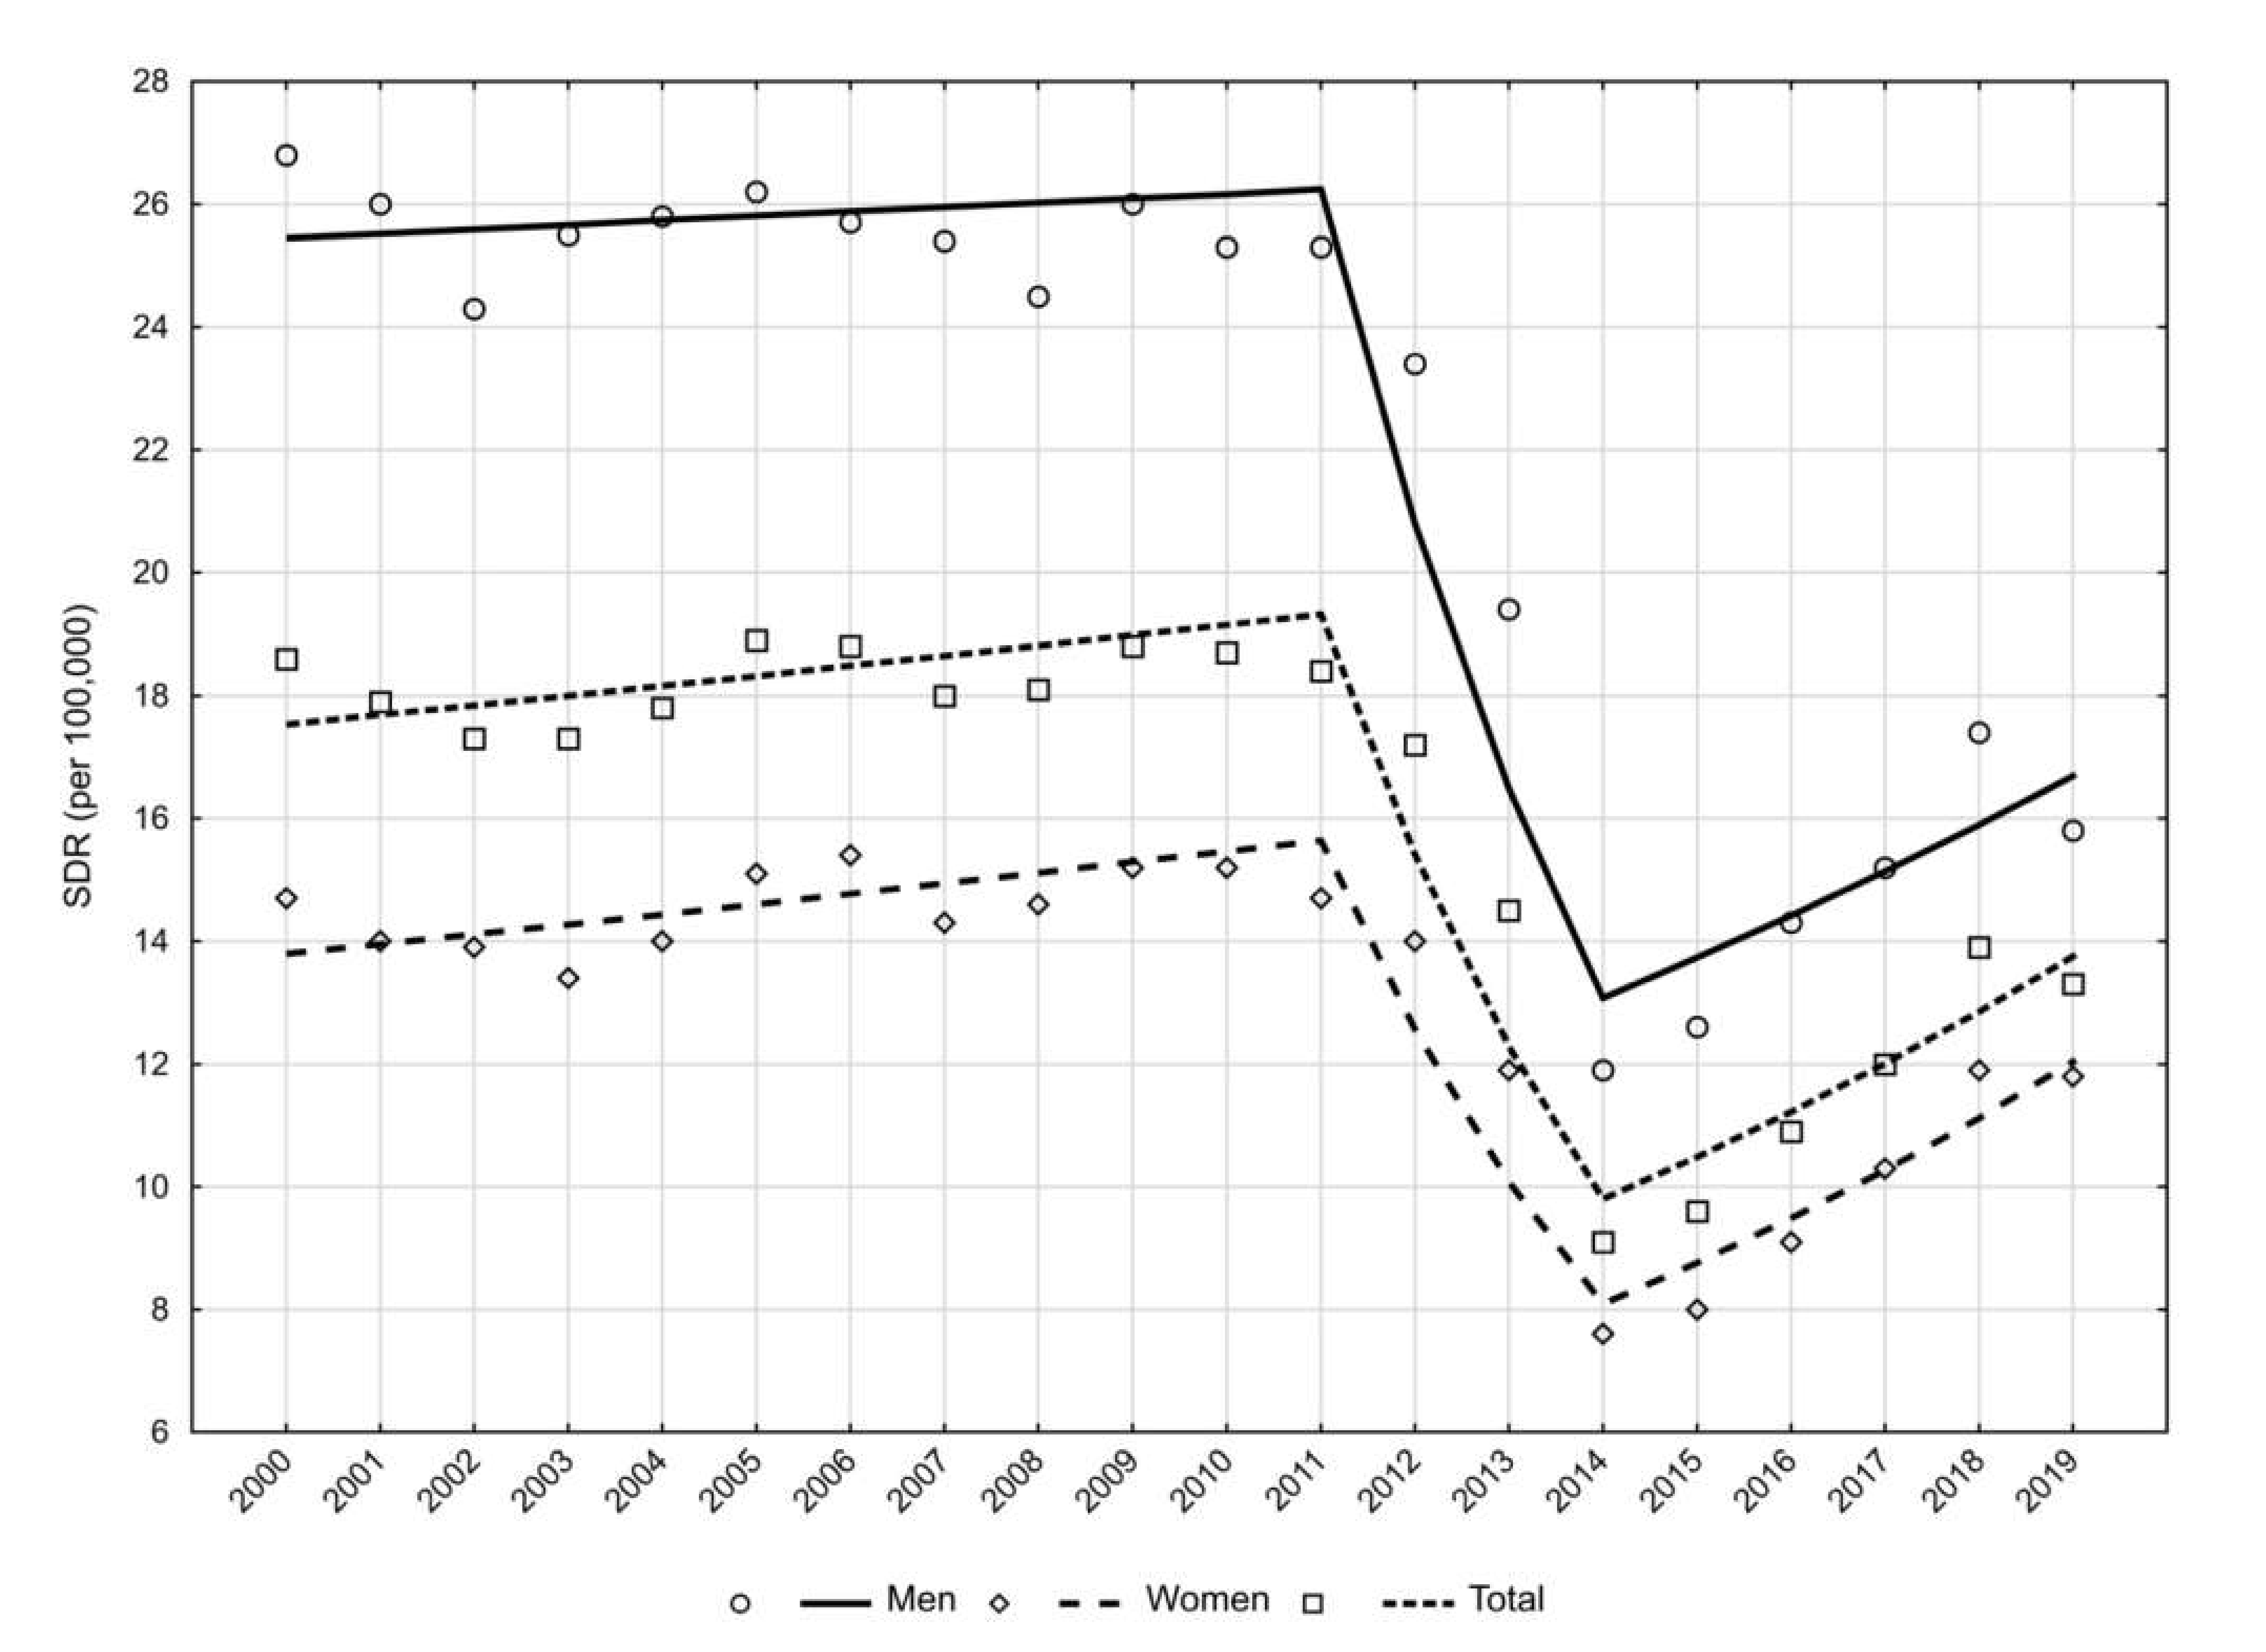
| Year | CDR | SDR | ||||
|---|---|---|---|---|---|---|
| General | Men | Women | General | Men | Women | |
| 2000 | 10.5 | 10.8 | 10.3 | 18.6 | 26.8 | 14.7 |
| 2001 | 10.4 | 10.9 | 9.9 | 17.9 | 26.0 | 14.0 |
| 2002 | 10.3 | 10.5 | 10.1 | 17.3 | 24.3 | 13.9 |
| 2003 | 10.4 | 11.1 | 9.8 | 17.3 | 25.5 | 13.4 |
| 2004 | 10.8 | 11.1 | 10.5 | 17.8 | 25.8 | 14.0 |
| 2005 | 11.8 | 12.0 | 11.6 | 18.9 | 26.2 | 15.1 |
| 2006 | 12.2 | 12.0 | 12.3 | 18.8 | 25.7 | 15.4 |
| 2007 | 12.0 | 12.3 | 11.8 | 18.0 | 25.4 | 14.3 |
| 2008 | 12.4 | 12.4 | 12.3 | 18.1 | 24.5 | 14.6 |
| 2009 | 13.2 | 13.1 | 13.2 | 18.8 | 26.0 | 15.2 |
| 2010 | 13.3 | 13.1 | 13.5 | 18.7 | 25.3 | 15.2 |
| 2011 | 13.5 | 13.6 | 13.4 | 18.4 | 25.3 | 14.7 |
| 2012 | 12.9 | 12.5 | 13.2 | 17.2 | 23.4 | 14.0 |
| 2013 | 11.1 | 10.8 | 11.4 | 14.5 | 19.4 | 11.9 |
| 2014 | 7.2 | 6.9 | 7.5 | 9.1 | 11.9 | 7.6 |
| 2015 | 7.8 | 7.4 | 8.2 | 9.6 | 12.6 | 8.0 |
| 2016 | 9.1 | 8.6 | 9.5 | 10.9 | 14.3 | 9.1 |
| 2017 | 10.1 | 9.4 | 10.7 | 12.0 | 15.2 | 10.3 |
| 2018 | 11.9 | 11.0 | 12.7 | 13.9 | 17.4 | 11.9 |
| 2019 | 11.5 | 10.2 | 12.8 | 13.3 | 15.8 | 11.8 |
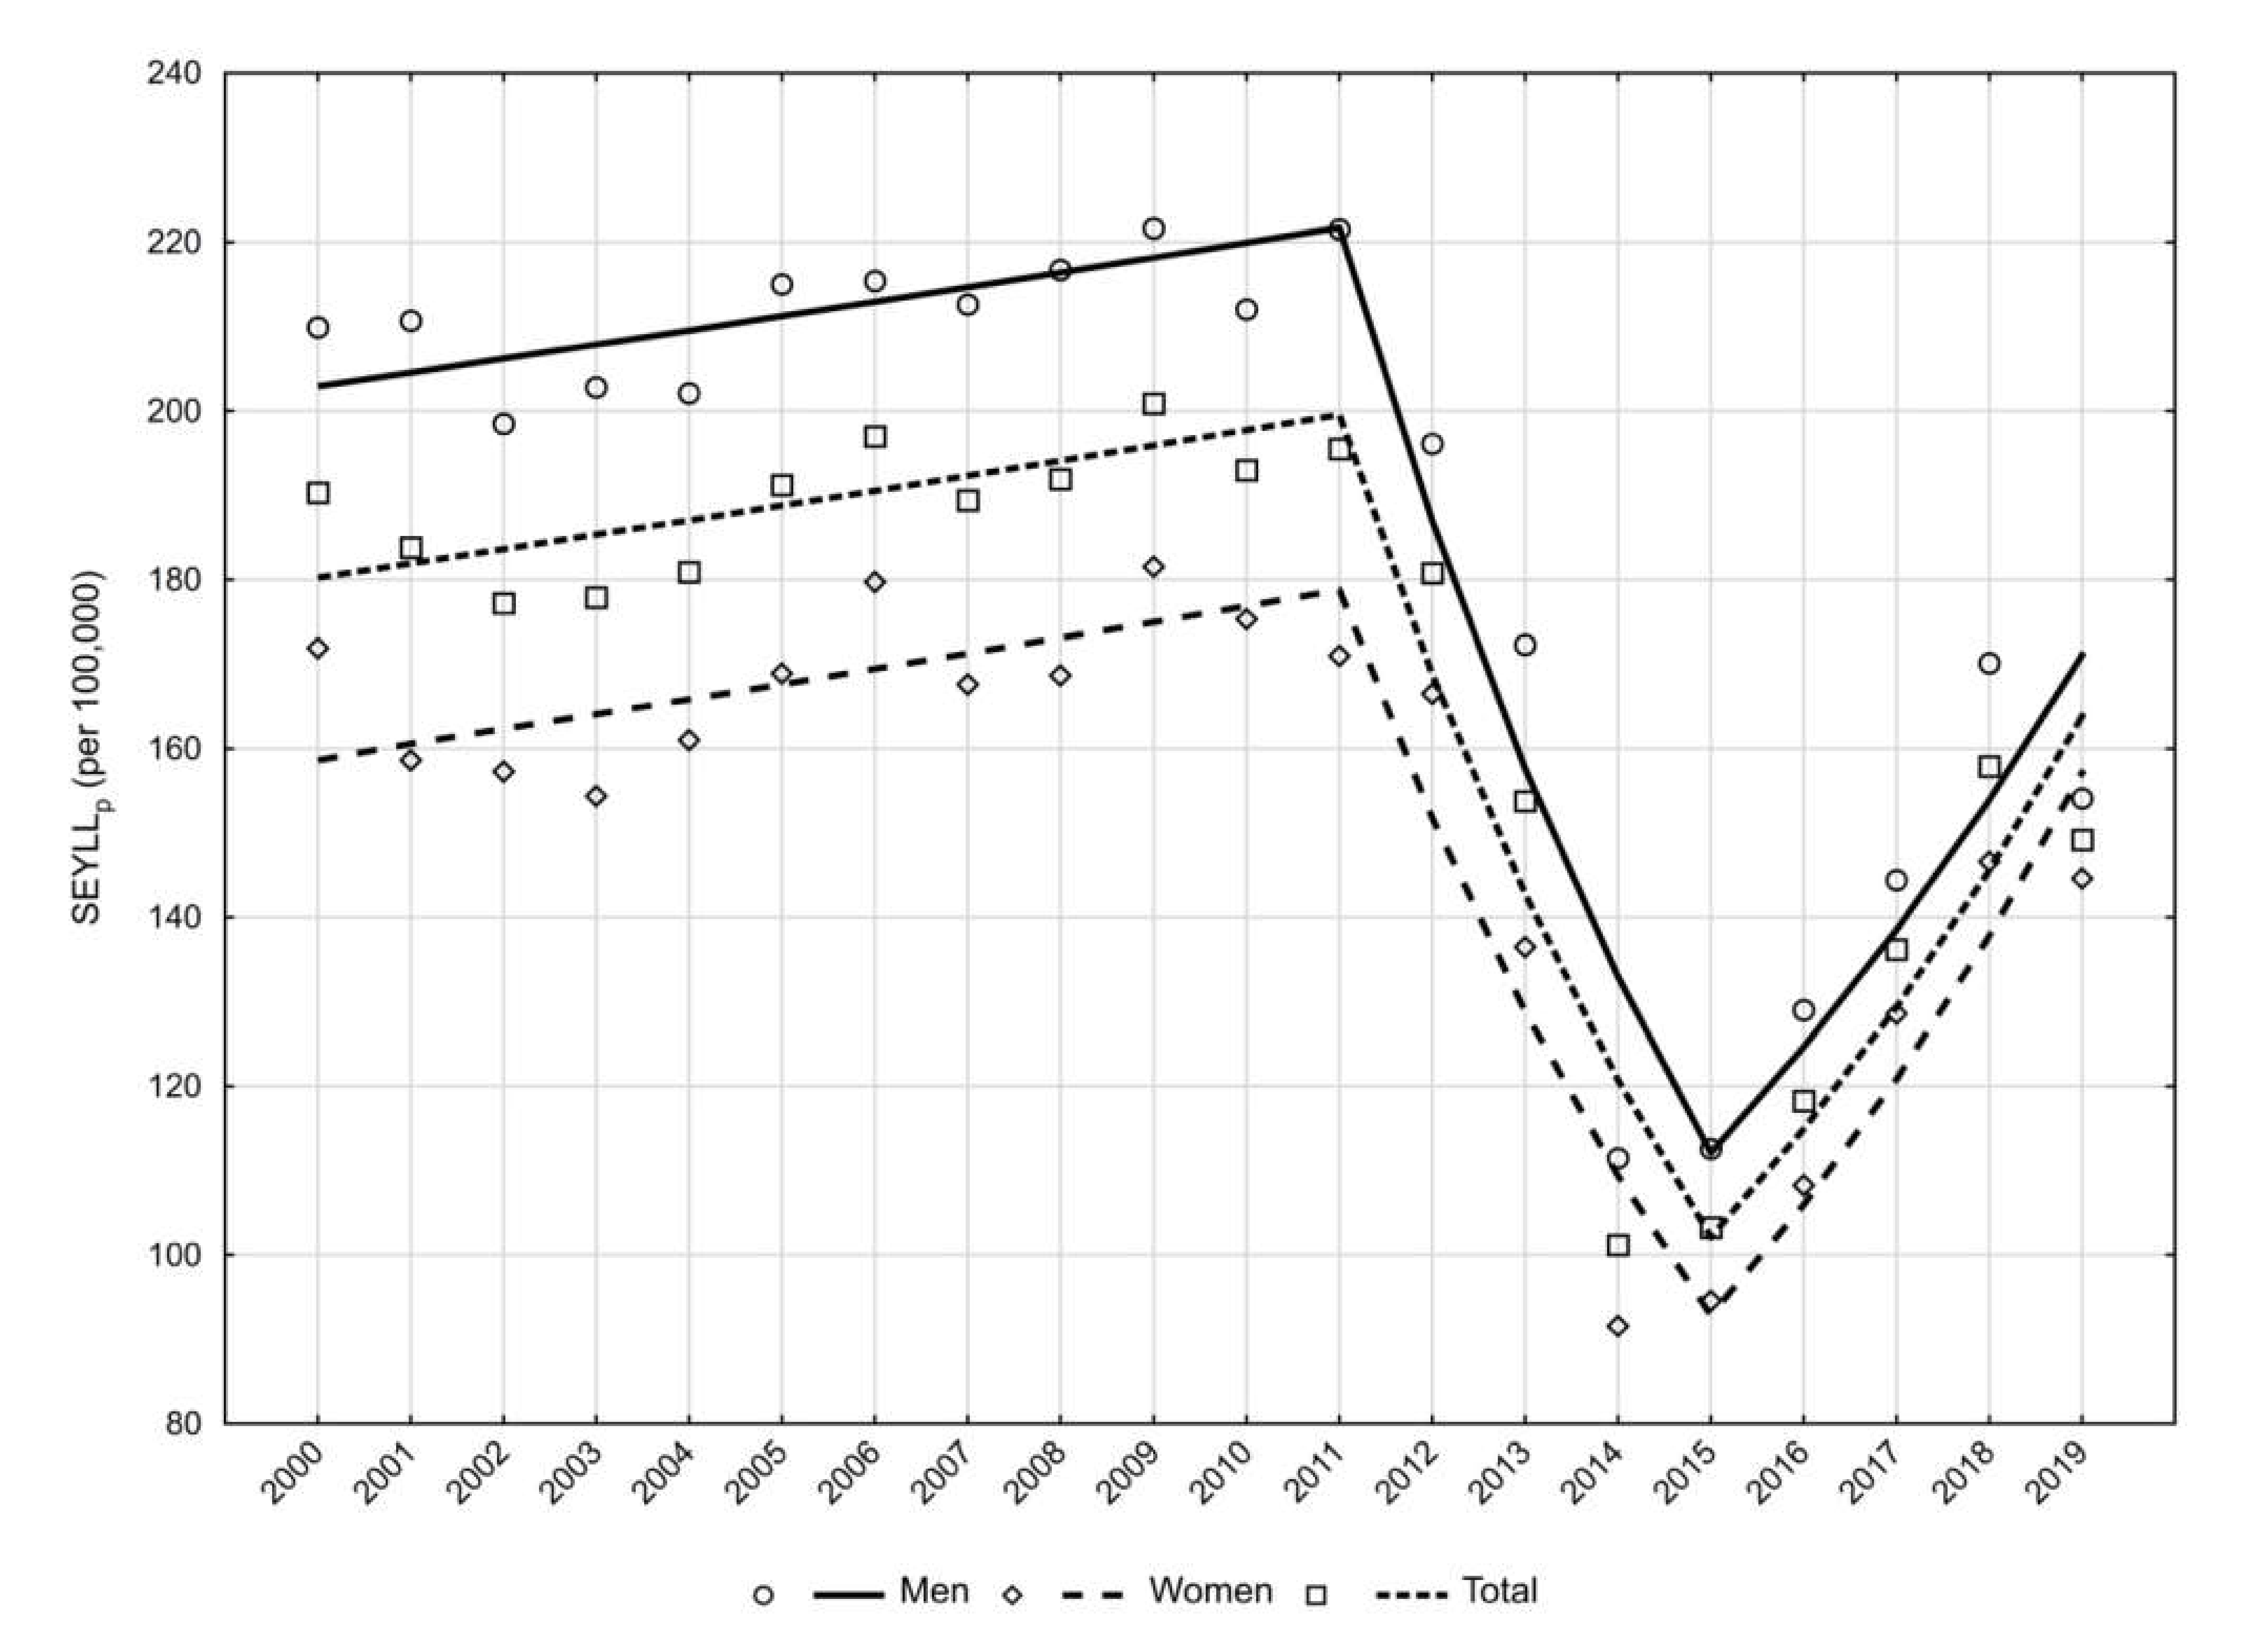
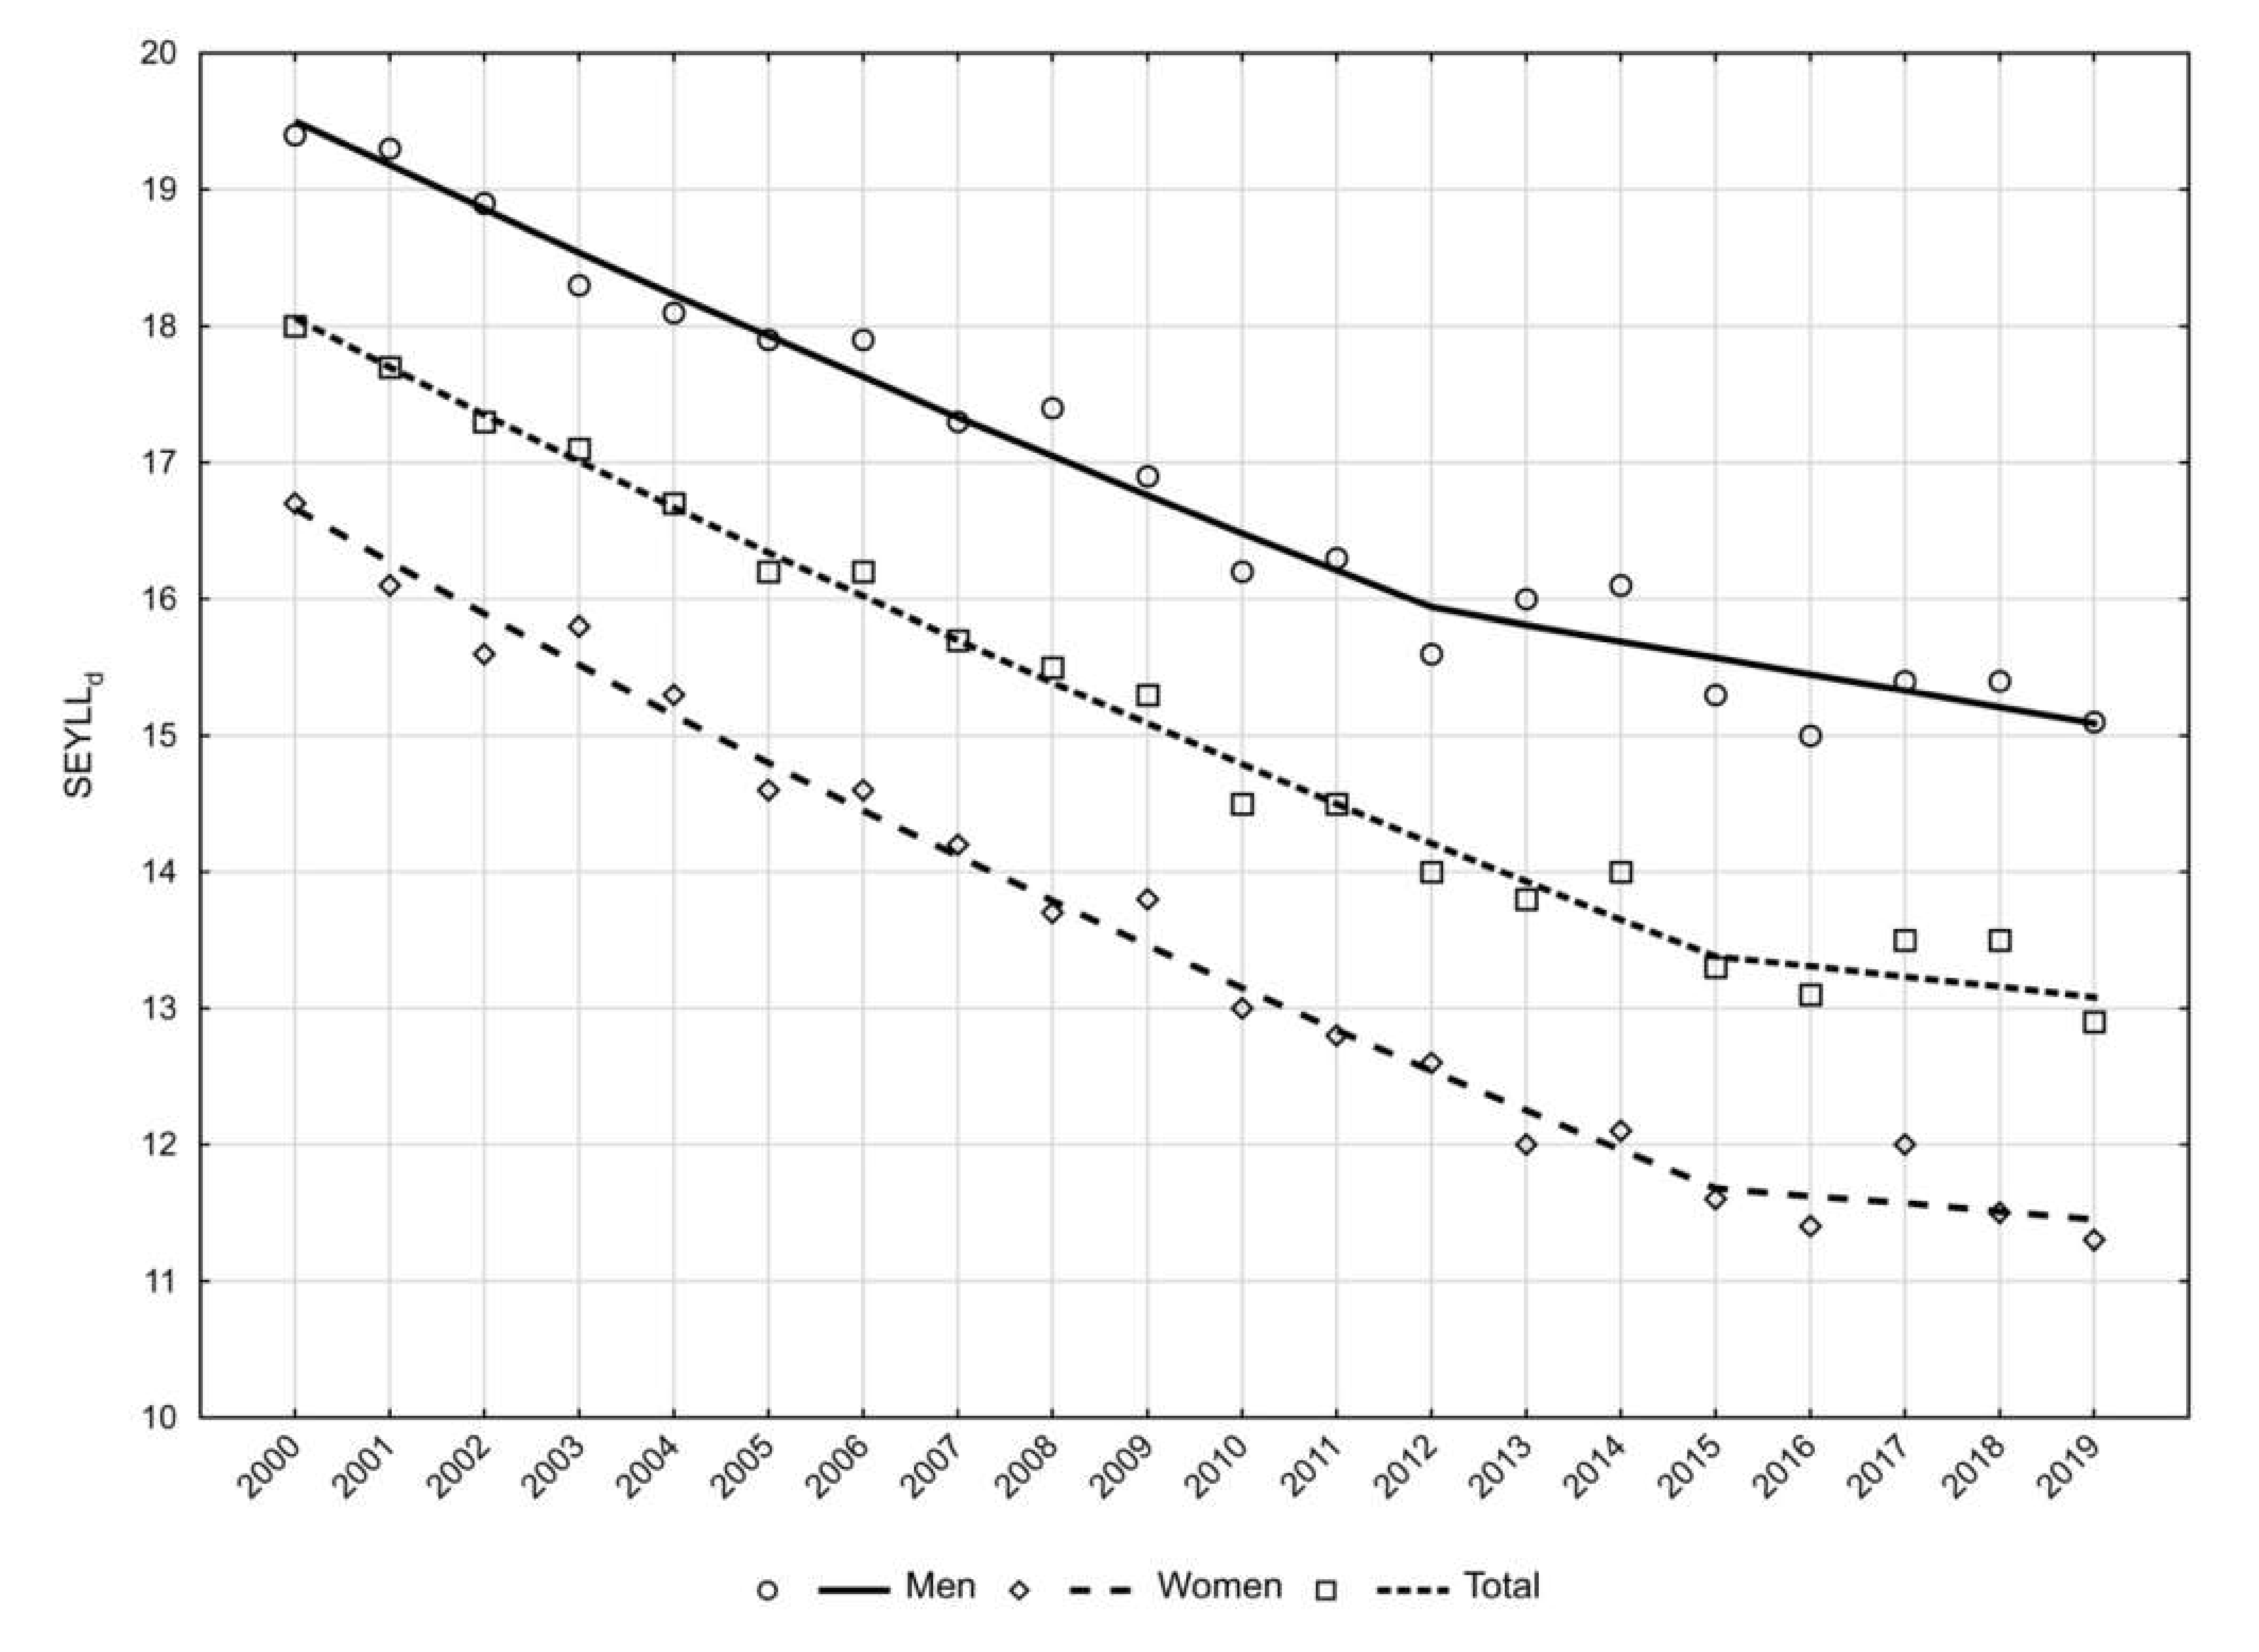
| Year | SEYLLp | SEYLLd | ||||
|---|---|---|---|---|---|---|
| General | Men | Women | General | Men | Women | |
| 2000 | 190.3 | 209.9 | 171.9 | 18.0 | 19.4 | 16.7 |
| 2001 | 183.8 | 210.7 | 158.6 | 17.7 | 19.3 | 16.1 |
| 2002 | 177.2 | 198.5 | 157.3 | 17.3 | 18.9 | 15.6 |
| 2003 | 177.9 | 202.8 | 154.4 | 17.1 | 18.3 | 15.8 |
| 2004 | 180.9 | 202.1 | 161.0 | 16.7 | 18.1 | 15.3 |
| 2005 | 191.2 | 215.0 | 168.9 | 16.2 | 17.9 | 14.6 |
| 2006 | 197.0 | 215.4 | 179.7 | 16.2 | 17.9 | 14.6 |
| 2007 | 189.4 | 212.6 | 167.6 | 15.7 | 17.3 | 14.2 |
| 2008 | 191.9 | 216.7 | 168.7 | 15.5 | 17.4 | 13.7 |
| 2009 | 200.9 | 221.6 | 181.5 | 15.3 | 16.9 | 13.8 |
| 2010 | 193.0 | 212.0 | 175.3 | 14.5 | 16.2 | 13.0 |
| 2011 | 195.5 | 221.5 | 171.0 | 14.5 | 16.3 | 12.8 |
| 2012 | 180.8 | 196.1 | 166.5 | 14.0 | 15.6 | 12.6 |
| 2013 | 153.8 | 172.3 | 136.5 | 13.8 | 16.0 | 12.0 |
| 2014 | 101.2 | 111.5 | 91.6 | 14.0 | 16.1 | 12.1 |
| 2015 | 103.3 | 112.6 | 94.6 | 13.3 | 15.3 | 11.6 |
| 2016 | 118.3 | 129.0 | 108.3 | 13.1 | 15.0 | 11.4 |
| 2017 | 136.2 | 144.4 | 128.6 | 13.5 | 15.4 | 12.0 |
| 2018 | 157.9 | 170.1 | 146.6 | 13.3 | 15.4 | 11.5 |
| 2019 | 149.2 | 154.1 | 144.6 | 12.9 | 15.1 | 11.3 |
Publisher’s Note: MDPI stays neutral with regard to jurisdictional claims in published maps and institutional affiliations. |
© 2022 by the authors. Licensee MDPI, Basel, Switzerland. This article is an open access article distributed under the terms and conditions of the Creative Commons Attribution (CC BY) license (https://creativecommons.org/licenses/by/4.0/).
Share and Cite
Paciej-Gołębiowska, P.; Kurnatowska, I.; Maniecka-Bryła, I.; Pikala, M. Twenty-Year Mortality Trends in Patients with Kidney Disease in Poland with the Use of the Years of Life Lost Measure, 2000–2019. Int. J. Environ. Res. Public Health 2022, 19, 2649. https://doi.org/10.3390/ijerph19052649
Paciej-Gołębiowska P, Kurnatowska I, Maniecka-Bryła I, Pikala M. Twenty-Year Mortality Trends in Patients with Kidney Disease in Poland with the Use of the Years of Life Lost Measure, 2000–2019. International Journal of Environmental Research and Public Health. 2022; 19(5):2649. https://doi.org/10.3390/ijerph19052649
Chicago/Turabian StylePaciej-Gołębiowska, Paulina, Ilona Kurnatowska, Irena Maniecka-Bryła, and Małgorzata Pikala. 2022. "Twenty-Year Mortality Trends in Patients with Kidney Disease in Poland with the Use of the Years of Life Lost Measure, 2000–2019" International Journal of Environmental Research and Public Health 19, no. 5: 2649. https://doi.org/10.3390/ijerph19052649
APA StylePaciej-Gołębiowska, P., Kurnatowska, I., Maniecka-Bryła, I., & Pikala, M. (2022). Twenty-Year Mortality Trends in Patients with Kidney Disease in Poland with the Use of the Years of Life Lost Measure, 2000–2019. International Journal of Environmental Research and Public Health, 19(5), 2649. https://doi.org/10.3390/ijerph19052649