Article

The COVID-19 Pandemic Impacted Maternal Mental Health Differently Depending on Pregnancy Status and Trimester of Gestation

by
Anick Bérard
1,2,3,*,
Jessica Gorgui
1,2,
Vanina Tchuente
2,
Anaïs Lacasse
4,
Yessica-Haydee Gomez
2,
Sylvana Côté
2,5,
Suzanne King
6,
Flory Muanda
7,8,
Yves Mufike
9,
Isabelle Boucoiran
2,10,
Anne Monique Nuyt
2,11,
Caroline Quach
2,12,
Ema Ferreira
1,13,
Padma Kaul
14,
Brandace Winquist
15,
Kieran J. O’Donnell
16,17,
Sherif Eltonsy
18,
Dan Chateau
19,
Jin-Ping Zhao
2,
Gillian Hanley
20,
Tim Oberlander
21,
Behrouz Kassai
22,
Sabine Mainbourg
3,
Sasha Bernatsky
23,
Évelyne Vinet
23,
Annie Brodeur-Doucet
24,
Jackie Demers
24,
Philippe Richebé
25 and
Valerie Zaphiratos
26
add Show full author list remove Hide full author list
1
Faculty of Pharmacy, University of Montreal, Montreal, QC H3T 1J4, Canada
2
Research Center, CHU Sainte-Justine, Montreal, QC H3T 1C5, Canada
3
Faculty of Medicine, Université Claude Bernard Lyon 1, 69003 Lyon, France
4
Health Sciences Department, Université du Québec en Abitibi-Témiscamingue, Rouyn-Noranda, QC J9X 5E4, Canada
5
Faculty of Medicine, School of Public Health, University of Montreal, Montreal, QC H3T 1J4, Canada
6
Faculty of Medicine, McGill University, Montreal, QC H3G 2M1, Canada
7
Department of Epidemiology & Biostatistics, Western University, London, ON N6A 5W9, Canada
8
ICES Western, Western University, London, ON N6A 5W9, Canada
9
Department of Family Medicine, Protestant University in Congo, Kinshasa II, Democratic Republic of the Congo
10
School of Public Health, Department of Obstetrics and Gynecology, University of Montreal, Montreal, QC H3N 1X9, Canada
11
Department of Pediatrics, CHU Sainte-Justine, University of Montreal, Montreal, QC H3T 1C5, Canada
12
Department of Microbiology, Infectious Diseases and Immunology, University of Montreal, Montreal, QC H3T 1J4, Canada
13
Pharmacy Department, CHU Sainte-Justine, Montreal, QC H3T 1C5, Canada
14
Department of Medicine, 4-120 Katz Group Centre for Pharmacy and Health Research, University of Alberta, Edmonton, AL T6G 2R7, Canada
15
College of Medicine, Department of Community Health and Epidemiology, University of Saskatcheawan, Saskatoon, SK S7N 5E5, Canada
16
Yale Child Study Center, Department of OB/GYN and Reproductive Sciences, Yale School of Medicine, New Haven, CT 06510, USA
17
Douglas Research Center, Department of Psychiatry, McGill University, Montreal, QC H4H 1R3, Canada
18
College of Pharmacy, Rady Faculty of Health Sciences, University of Manitoba, Winnipeg, MB R3E 0W2, Canada
19
Manitoba Center for Health Policy, Winnipeg, MB R3E 3P5, Canada
20
Department of Obstetrics & Gynaecology, University of British Columbia, Vancouver, BC V6T 1Z4, Canada
21
Department of Pediatrics, School of Population and Public Health, University of BC, Vancouver, BC V6T 1Z4, Canada
22
Department of Clinical Epidemiology, UMR 5558 CNRS, Clinical Investigation Centre, Inserm-Hospices Civils de Lyon, Claude Bernard University Lyon 1, 69000 Lyon, France
23
Divisions of Clinical Epidemiology and Rheumatology, McGill University Health Centre, Montreal, QC H3A 0G4, Canada
24
Dispensaire Diététique de Montréal/Montreal Diet Dispensary, Montreal, QC H3H 1J3, Canada
25
Department of Anesthesiology and Pain Medicine, CIUSSS de l’Est de l’Ile de Montreal, Maisonneuve-Rosemont Hospital, University of Montreal, Montreal, QC H1T 2M4, Canada
26
Research Center, Maisonneuve-Rosemont Hospital, CIUSSS de l’Est de l’Ile de Montreal, Montreal, QC H1T 2M4, Canada
*
Author to whom correspondence should be addressed.
Int. J. Environ. Res. Public Health 2022, 19(5), 2926; https://doi.org/10.3390/ijerph19052926
Submission received: 1 February 2022 / Revised: 24 February 2022 / Accepted: 25 February 2022 / Published: 2 March 2022

Abstract

:
Introduction: We aimed to measure the impact of the COVID-19 pandemic on maternal mental health, stratifying on pregnancy status, trimester of gestation, and pandemic period/wave. Methods: Pregnant persons and persons who delivered in Canada during the pandemic, >18 years, were recruited, and data were collected using a web-based strategy. The current analysis includes data on persons enrolled between 06/2020–08/2021. Maternal sociodemographic indicators, mental health measures (Edinburgh Perinatal Depression Scale (EPDS), Generalized Anxiety Disorders (GAD-7), stress) were self-reported. Maternal mental health in pregnant women (stratified by trimester, and pandemic period/wave at recruitment) was compared with the mental health of women who had delivered; determinants of severe depression were identified with multivariate logistic regression models. Results: 2574 persons were pregnant and 626 had already delivered at recruitment. Participants who had delivered had significantly higher mean depressive symptom scores compared to those pregnant at recruitment (9.1 (SD, 5.7) vs. 8.4 (SD, 5.3), p = 0.009). Maternal anxiety (aOR 1.51; 95%CI 1.44–1.59) and stress (aOR 1.35; 95%CI 1.24–1.48) were the most significant predictors of severe maternal depression (EDPS ˃ 13) in pregnancy. Conclusion: The COVID-19 pandemic had a significant impact on maternal depression during pregnancy and in the post-partum period. Given that gestational depression/anxiety/stress has been associated with preterm birth and childhood cognitive problems, it is essential to continue following women/children, and develop strategies to reduce COVID-19′s longer-term impact.

1. Introduction

COVID-19-related public health measures and pandemic-related stressors have contributed to emotional distress, particularly depression and anxiety [1,2]. Interventions such as indefinite confinement and conflicting public health messaging intensified distress, especially among vulnerable populations including pregnant persons [3]. After the severe acute respiratory syndrome epidemic in 2003, non-pregnant persons experienced anxiety, stress, and depression for these reasons [4]. In addition, since the start of the COVID-19 pandemic, perinatal care strategies have been revised to decrease in-person visits, which may increase stress and anxiety among pregnant persons as well as hesitation to attend the few necessary clinic visits due to fear of infection, further increasing risk for adverse obstetrical and post-partum outcomes [5].
Prenatal exposure to crises can have lasting effects on the cognitive and behavioral health of pregnant persons and their newborns [6,7,8,9,10]. In Project Ice Storm (1 million Quebec/Ontario residents without electricity, 6 January to 6 February 1998), studies [7,11,12] showed that greater maternal depression and anxiety from the crisis during pregnancy significantly predicted poor outcomes in children, such as lower IQ and altered brain development in children exposed to stress in utero. Furthermore, maternal stress, depression, and anxiety during pregnancy have been independently shown to be associated with low birth weight [13], prematurity [1], and post-partum depression [14]. At present, studies on COVID-19 and pregnancy focus primarily on obstetrical risk to the mother and fetus with little data on pregnant persons’ mental health. Current findings (i) vary depending on the place of residence, (ii) include small sample sizes, (iii) are from hospital samples that are likely not representative of the population, or (iv) do not consistently use standardized measures of mental health. [5,15,16] We know that 37% of pregnant persons in Alberta reported severe depressive symptoms, and 57% severe anxiety symptoms during pregnancy soon after the first COVID-19 cases were identified in Canada [15]. However, no large-scale Canadian study has evaluated the impact of the pandemic on mental health during and after pregnancy, across the first three waves of the COVID-19 pandemic.
Given the reported impact of the pandemic on mental health in the general non-pregnant population [17] and that specific fetal developments occur at different time-points during pregnancy (the first trimester relates to organogenesis, 2nd and 3rd trimesters to prematurity, low birth weight, and cognitive function in children), we aimed to quantify the prevalence of maternal depression, anxiety and stress stratified on the status of pregnancy (pregnant vs. delivered) and trimester of gestation as well as pandemic period/wave, and identify predictors of severe gestational maternal depression during the COVID-19 pandemic.

2. Materials and Methods
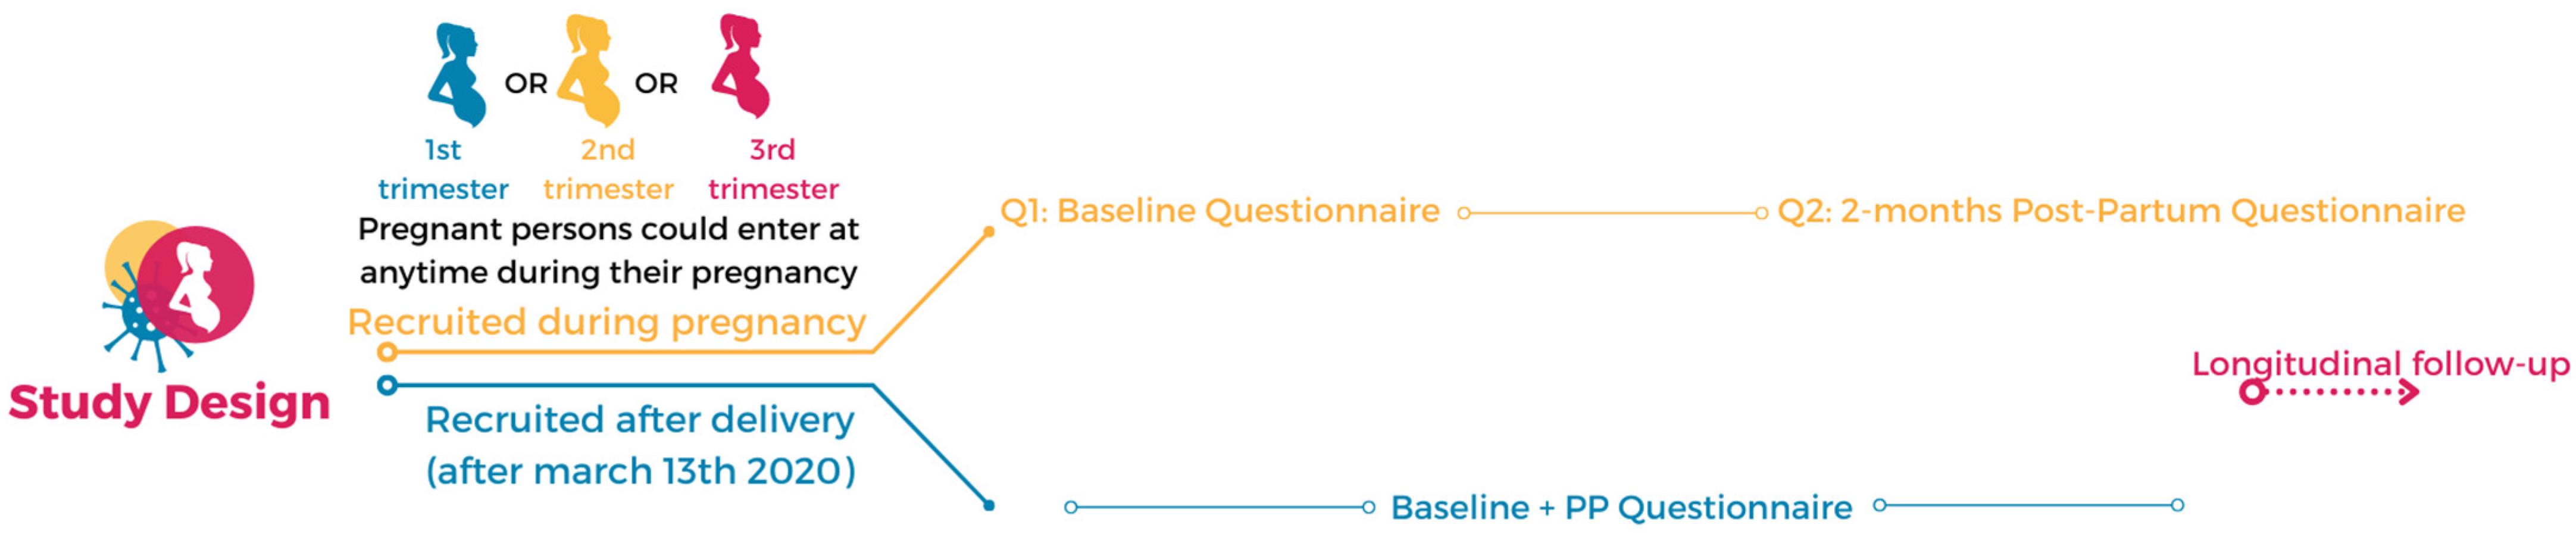
2.1. Study Design

The recruitment started on 26 June 2020 and is ongoing. The present analysis includes cross-sectional data on Canadians enrolled between 26 June–17August 2021. Participants could enter the study at various moments: cohort 1—postpartum period, following a delivery occurring between 13 March 2020 and recruitment, or cohort 2—pregnant at recruitment, at any trimester as described in Figure 1. In Canada, this period captures the three first waves of the COVID-19 pandemic. During this period, Canada went through a summer (2020) of reopening at the end of the first wave (1st wave, June to August 2020), followed by a 2nd wave in the fall (2020) and a lockdown through winter (2020–2021) (2nd wave, September 2020 to March 2021), followed by a 3rd wave in the spring (2021) as vaccination started rolling out (3rd wave, April to August 2021). The study obtained individual consent and collected data online using SurveyMonkey®, a secure platform. Recruitment of participants used diverse methodologies: (i) through press releases and interviews with mainstream media, (ii) online through social media (Facebook, Instagram, Twitter, LinkedIn, and TikTok), (iii) in-person across Canada in community associations for new immigrants, allowing for the recruitment of persons from lower socioeconomic status, (iv) quick response codes were displayed on posters in OB/GYN clinics for persons to directly access the questionnaire with their mobile device. Through recruitment efforts, we aimed to enroll a representative cohort of Canadian pregnant persons or persons who had delivered during the pandemic compared to currently published studies [5,15,16,18,19]. Questionnaires are available in French, English, Mandarin, Spanish, and Portuguese. Team members promoted the study on social media platforms via videos, influencer recruitment with a substantial following (>20,000), mother/child and pregnancy support groups, outpatient and community clinics, hashtag strategies, and through university-affiliated communication specialists. Social media combined with in-person recruitment in crises are appropriate methodologies given the rapidity with which we need answers to pressing questions [20]. Social media recruitment with anonymized data has been used in other similar studies [5,15,16,18,19]. Study eligibility, consent, and baseline data collection were completed electronically; the information was thereafter downloaded on a secure server at CHU Sainte-Justine, Montreal, QC (see https://www.surveymonkey.com/r/etudeCONCEPTIONstudyBL (accessed on 22 November 2021)). All collected data are centralized at CHU Ste-Justine in Montreal, QC, Canada.
Canadian pregnant persons or persons having delivered after 13 March 2020, aged 18 years or older, and able to read French, English, Spanish, Portuguese or Mandarin were eligible.

2.2. Data Collection

Online questionnaires were pretested and took about 25 min to complete. Variables were self-reported and used standardized validated instruments [21,22,23,24]. We collected the following data in a single questionnaire recruitment as described in Figure 1: (A) Maternal characteristics and physical health (history and since the beginning of pregnancy or referring to the entire pregnancy for those who had delivered): (1) sociodemographic characteristics: gestational age, height, and weight pre-pregnancy to calculate body mass index, maternal age, ethnicity, education, annual income, living arrangements (living alone, yes/no), area of residence (urban, suburban, rural); (2) pregnancy history; (3) health behaviors (e.g., smoking, alcohol use, cannabis use, exercise); (4) comorbidities identified with diagnoses and prescribed medication use (including history and comorbid psychiatric illnesses and psychotropic use), and; (5) work status and employment status changes following the start of the pandemic. (B) Perinatal follow-up and birth plan changes: (1) number of and changes in prenatal visits; (2) partners excluded from delivery rooms; (3) visitors not allowed in hospital; (4) newborn allowed to be with mother after delivery; (5) mother able to visit newborn in the neonatal intensive care unit (if applicable), and; (6) concerns regarding healthcare access as well as maternal and/or newborn COVID-19 diagnosis at delivery (measured on a 4-category ordinal scale with responses ranging from not concerned at all to very concerned). Changes measured were from the result of public health or clinic/hospital recommendations. (C) Mental health: (1) maternal depression, measured using the validated Edinburgh Perinatal Depression Scale (EPDS) in reference to the 7 days before questionnaire completion [21]; (2) anxiety, measured using the validated generalized anxiety disorders (GAD-7) scale in reference to the two weeks before questionnaire completion [22], and; (3) overall stress levels (1:no stress–10:extreme stress scale) since the beginning of COVID-19, measured using the validated Hybrid COVID Stress Scale which includes items from the COVID-19 Impact Scale [23], and from the Coronavirus Perinatal Experiences Impact Survey (COPE-IS) [24]. When persons scored >13 on the EPDS or mentioned thoughts of self-harm (Q10 on the EPDS), they were directed towards support groups. No clinical advice was given to participants.
Depression and anxiety symptoms were measured as continuous variables using the EPDS and GAD-7 instruments, respectively. Depression symptoms were also categorized as moderate to severe (EPDS > 9) and severe (EPDS > 13) [21]. Anxiety symptoms were further defined as moderate to severe (GAD-7 > 9) and severe (GAD-7 > 15) [22].
Social fragility was indirectly measured with the sociodemographic variables, and perception/concern measurements with regards to the pandemic described above.

2.3. Data Analyses

Analyses were stratified by pregnancy status at the time of entry in the study (cohort 1 vs. cohort 2, as described in Figure 1). Among those currently pregnant, analyses were stratified on the trimester of pregnancy at recruitment (1st, 2nd, and 3rd). We compared mean maternal depression and anxiety as well as the frequency of severe depression and anxiety, moderate to severe depression and anxiety between study cohorts (cohorts 1 vs. 2), and trimester of pregnancy (cohort 2). Mean stress scores were also compared. For all variables, comparisons using means with standard deviations (SD) or proportions with ranges were done, depending on whether the variables were continuous or categorical, using Student’s t-tests or chi-square statistics, respectively. Missing data for each variable studied are presented; given the study design and recruitment, missing data were not considered in the analyses.
We quantified determinants of severe maternal depression (EDPS > 13) with univariate and multivariate logistic regression models, accounting for maternal anxiety and stress, socio-demographic and lifestyle variables, gestational age and calendar time at recruitment, and other potential determinants listed above. Estimates (Odds Ratios (OR), and 95% confidence intervals (95%CI)) were calculated.
Lastly, we looked at maternal depression, anxiety, and stress according to the pandemic period/wave at recruitment (1st wave, 2nd wave, and 3rd wave).
All statistical analyses were performed using SAS (Version 9.02).
This study was approved by the CHU Sainte-Justine’s Research Ethics Committee on 23 June 2020 (no. MP-21-2021-2973).

3. Results

From 23 June 2020 to 17 August 2021, 5885 visited the study online survey, 4445 gave informed consent, and 3200 (71.99%) participated by filling at least one question from the questionnaire (Figure 2).

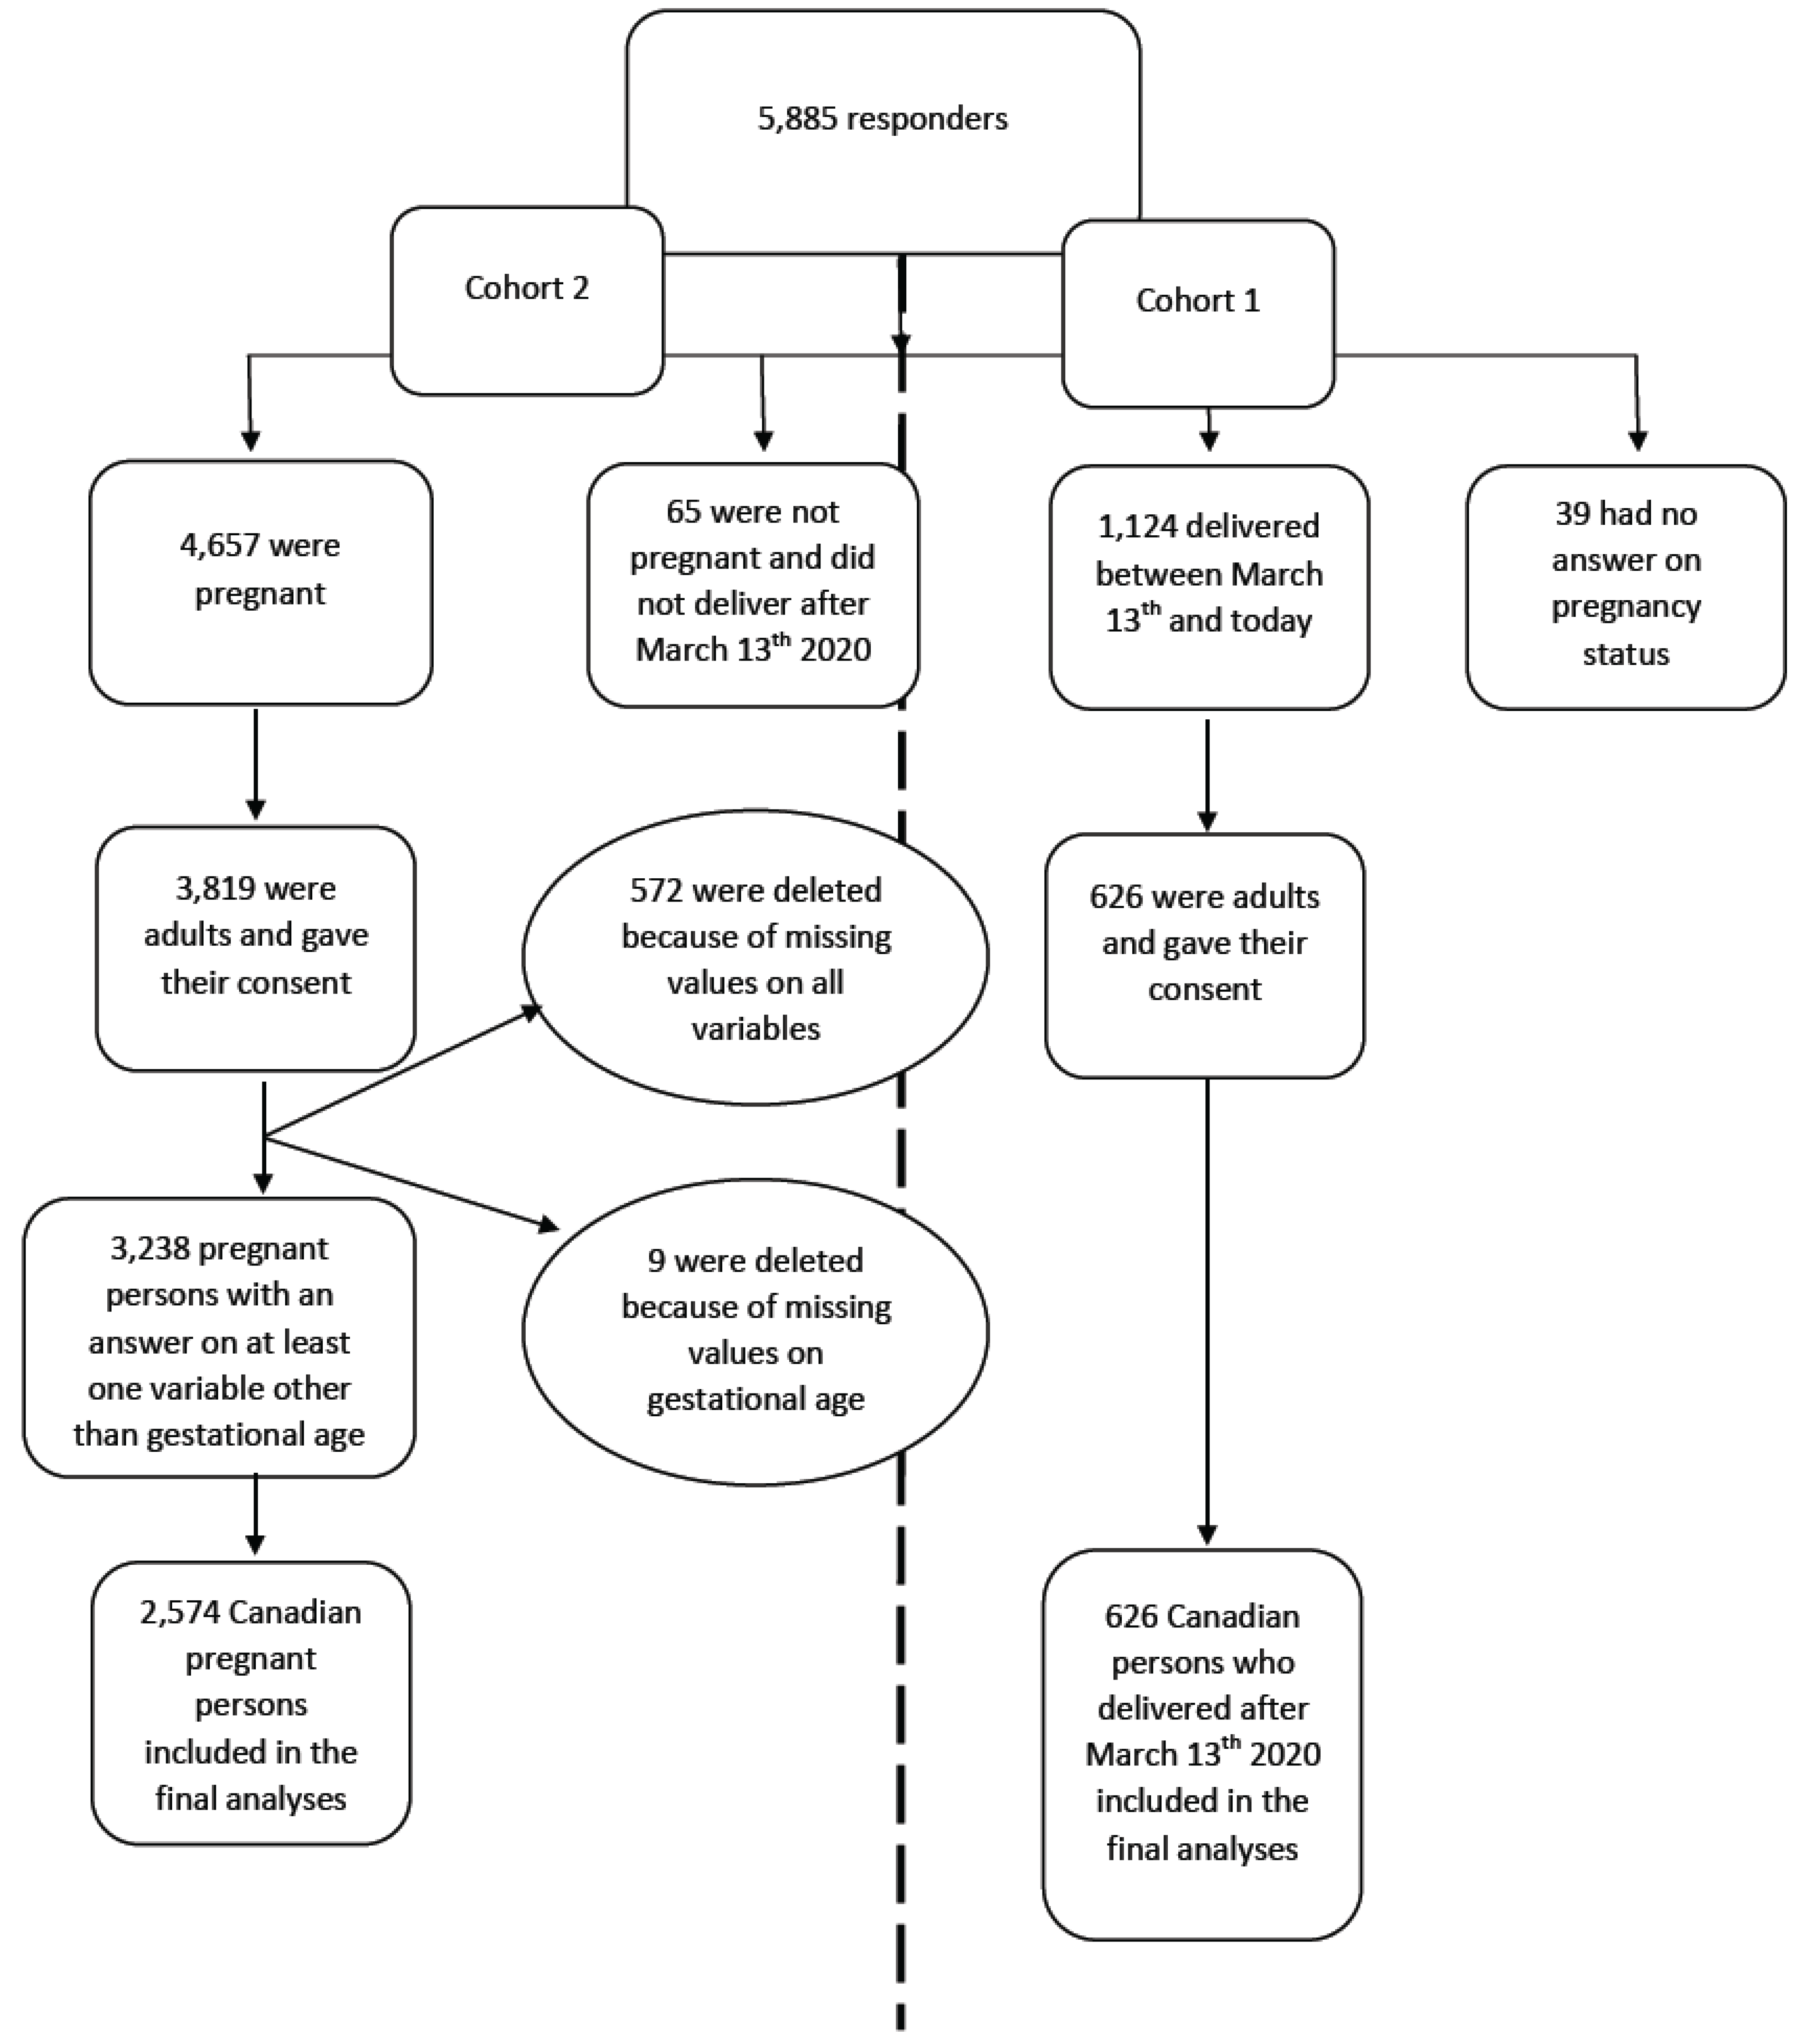
3.1. Description of the Participants

Participants who gave birth after 13 March 2020, comprising cohort 1, delivered at 38.9 ± 1.9 weeks gestation; pregnant persons at recruitment, comprising cohort 2, were at 24.5 ± 9.7 weeks gestation at recruitment (Table 1). Pregnant persons were more likely to be followed by a family physician and/or midwife as opposed to those who had given birth who were more likely followed by obstetricians (Table 1).

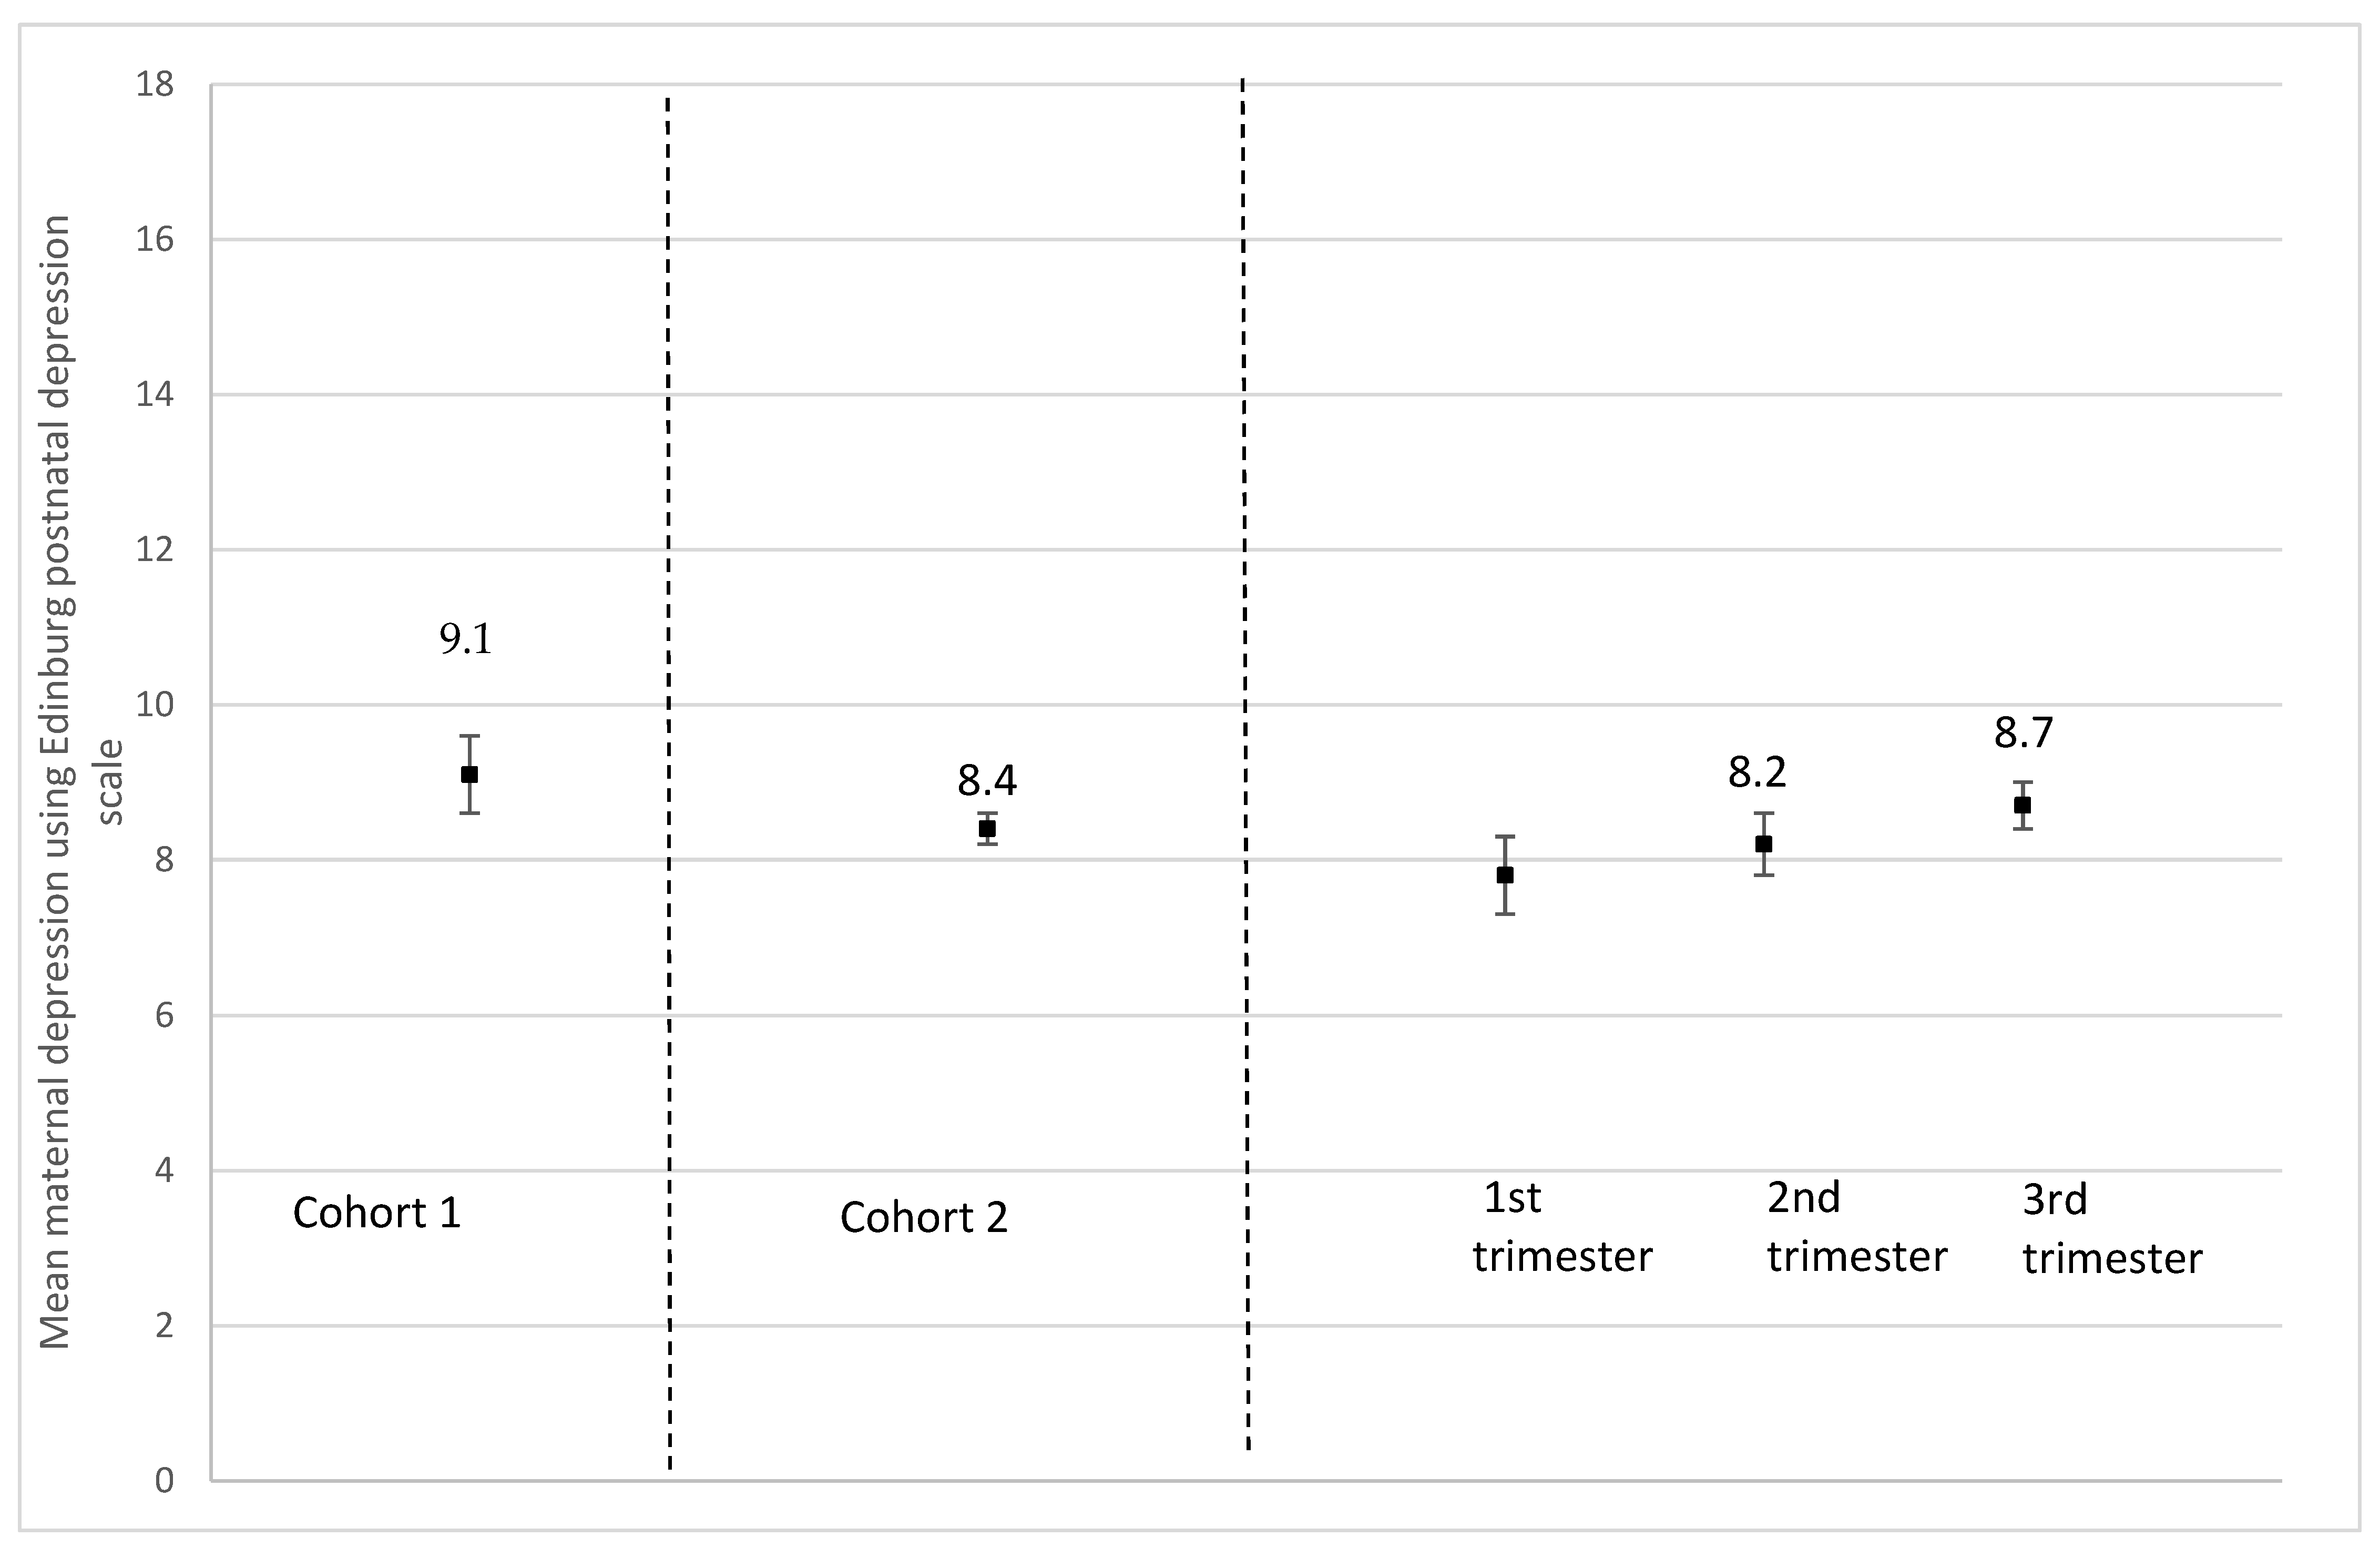
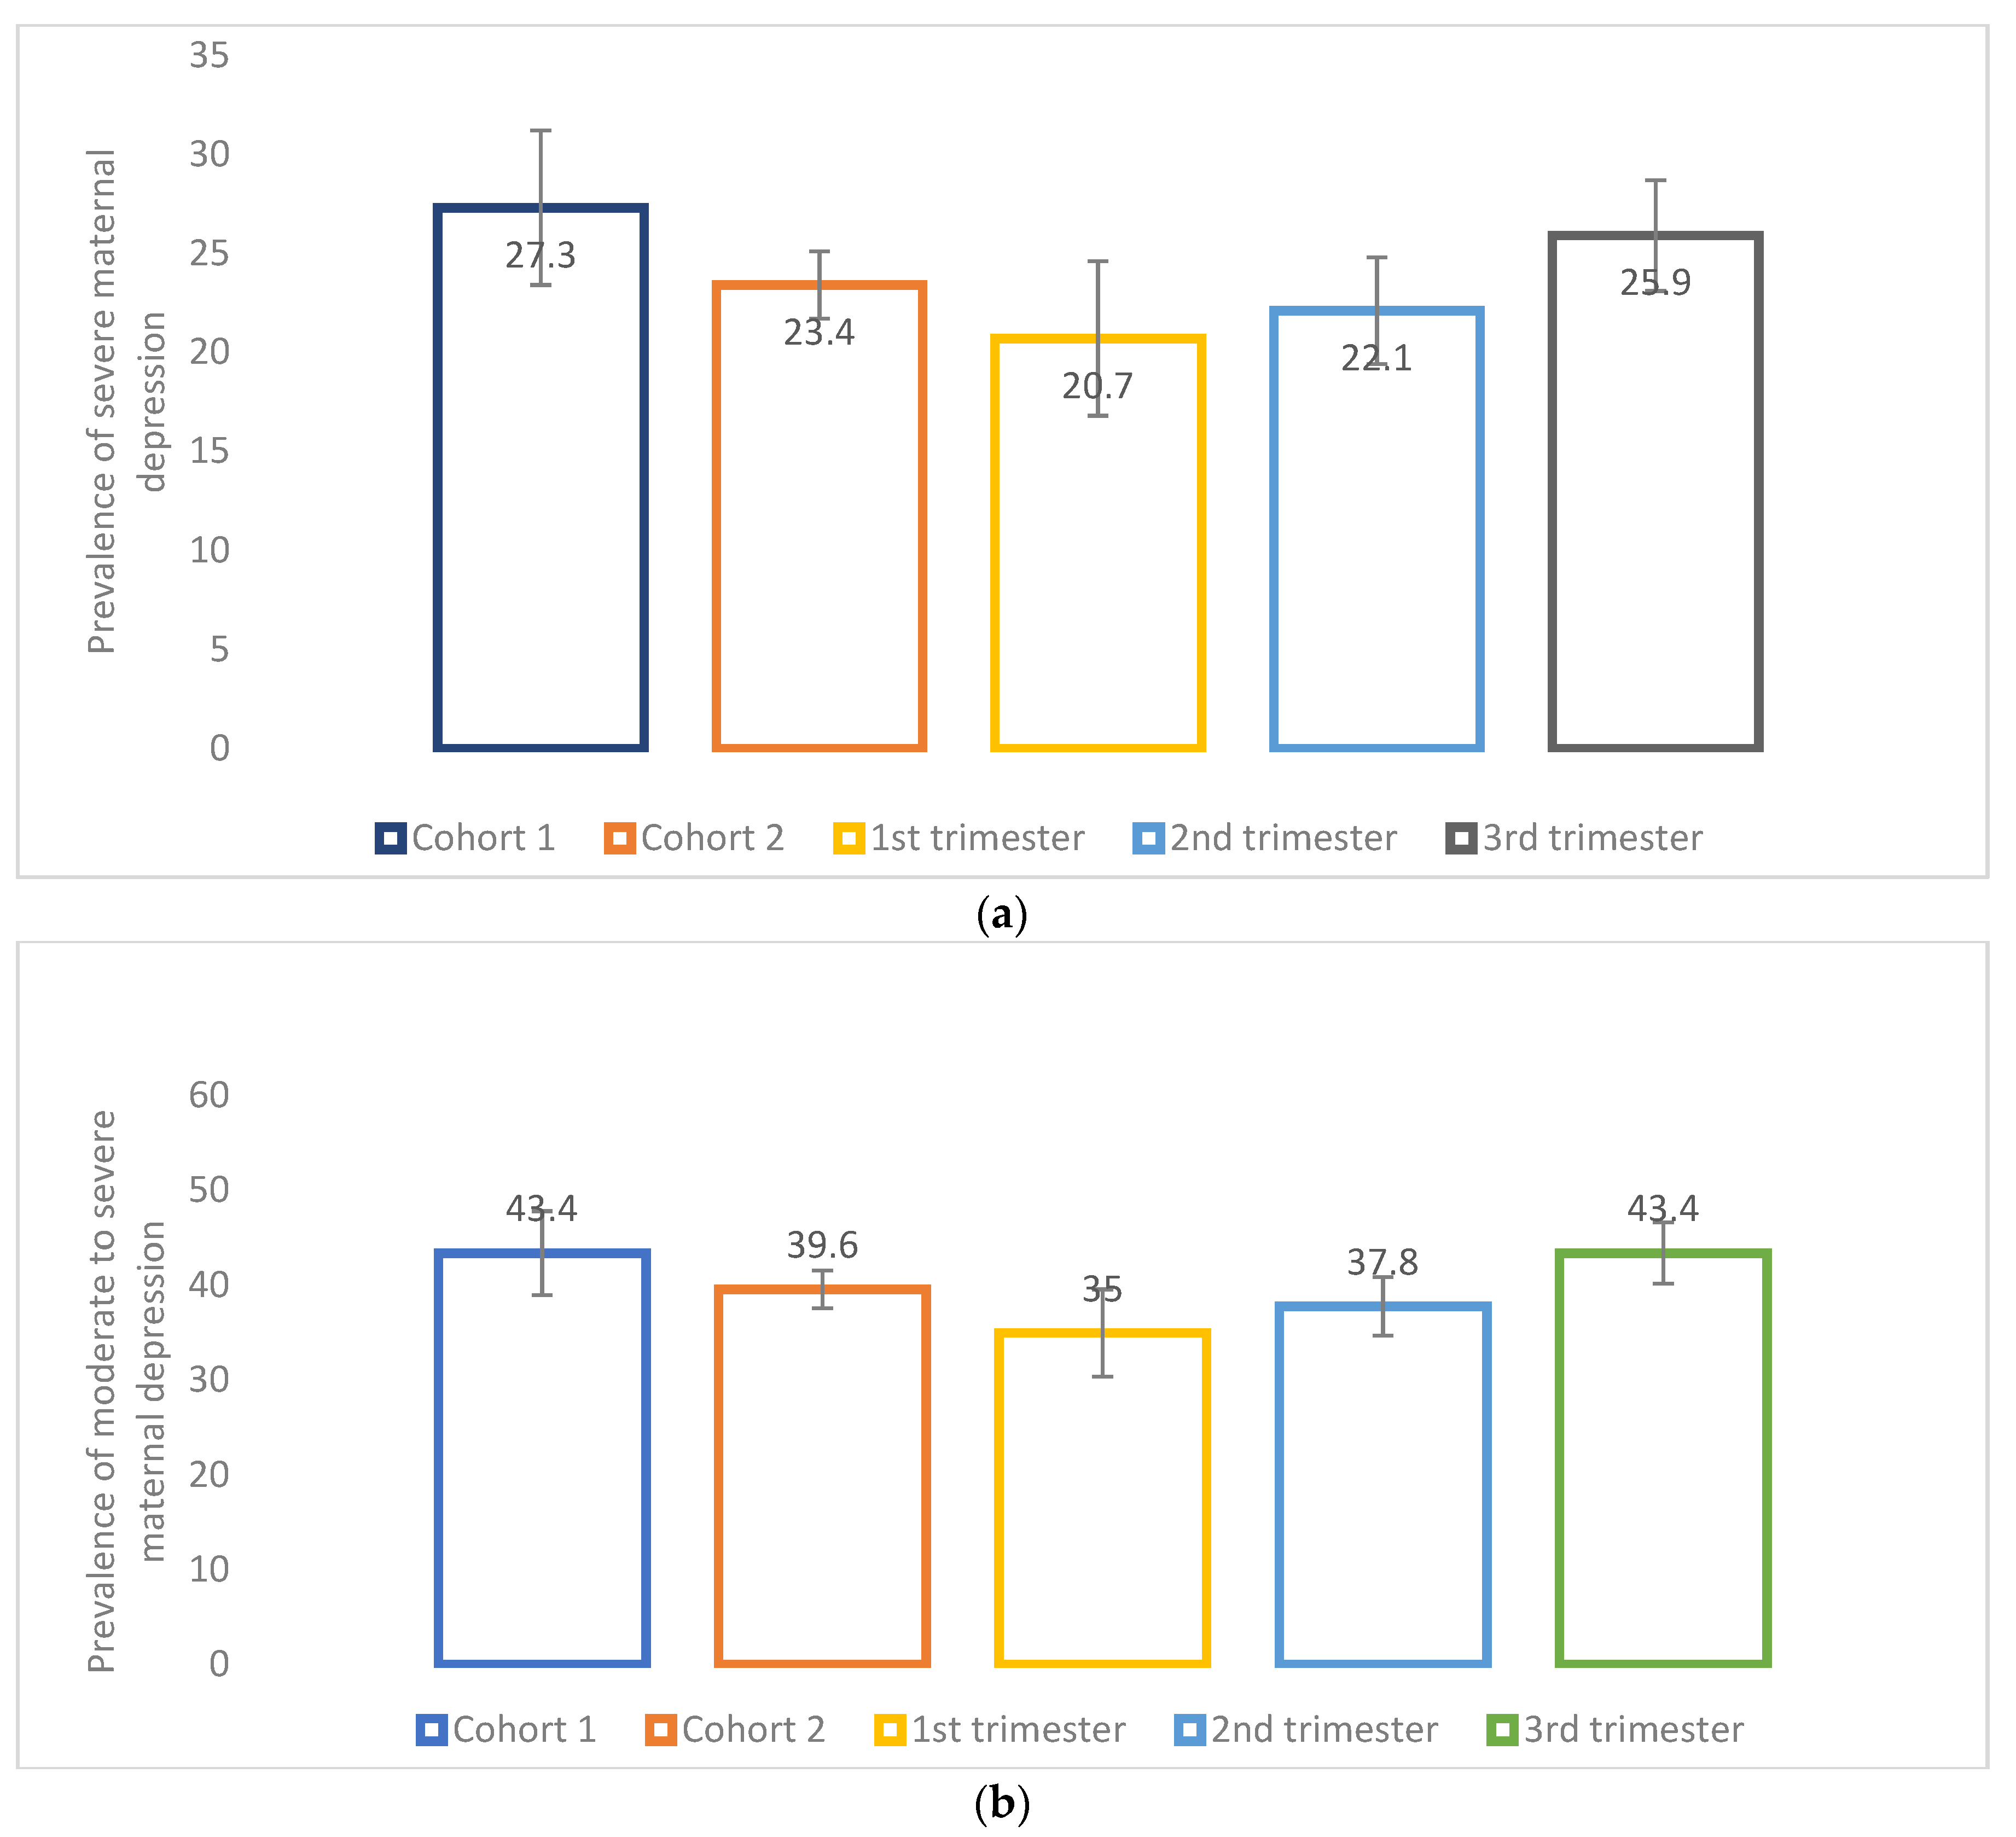
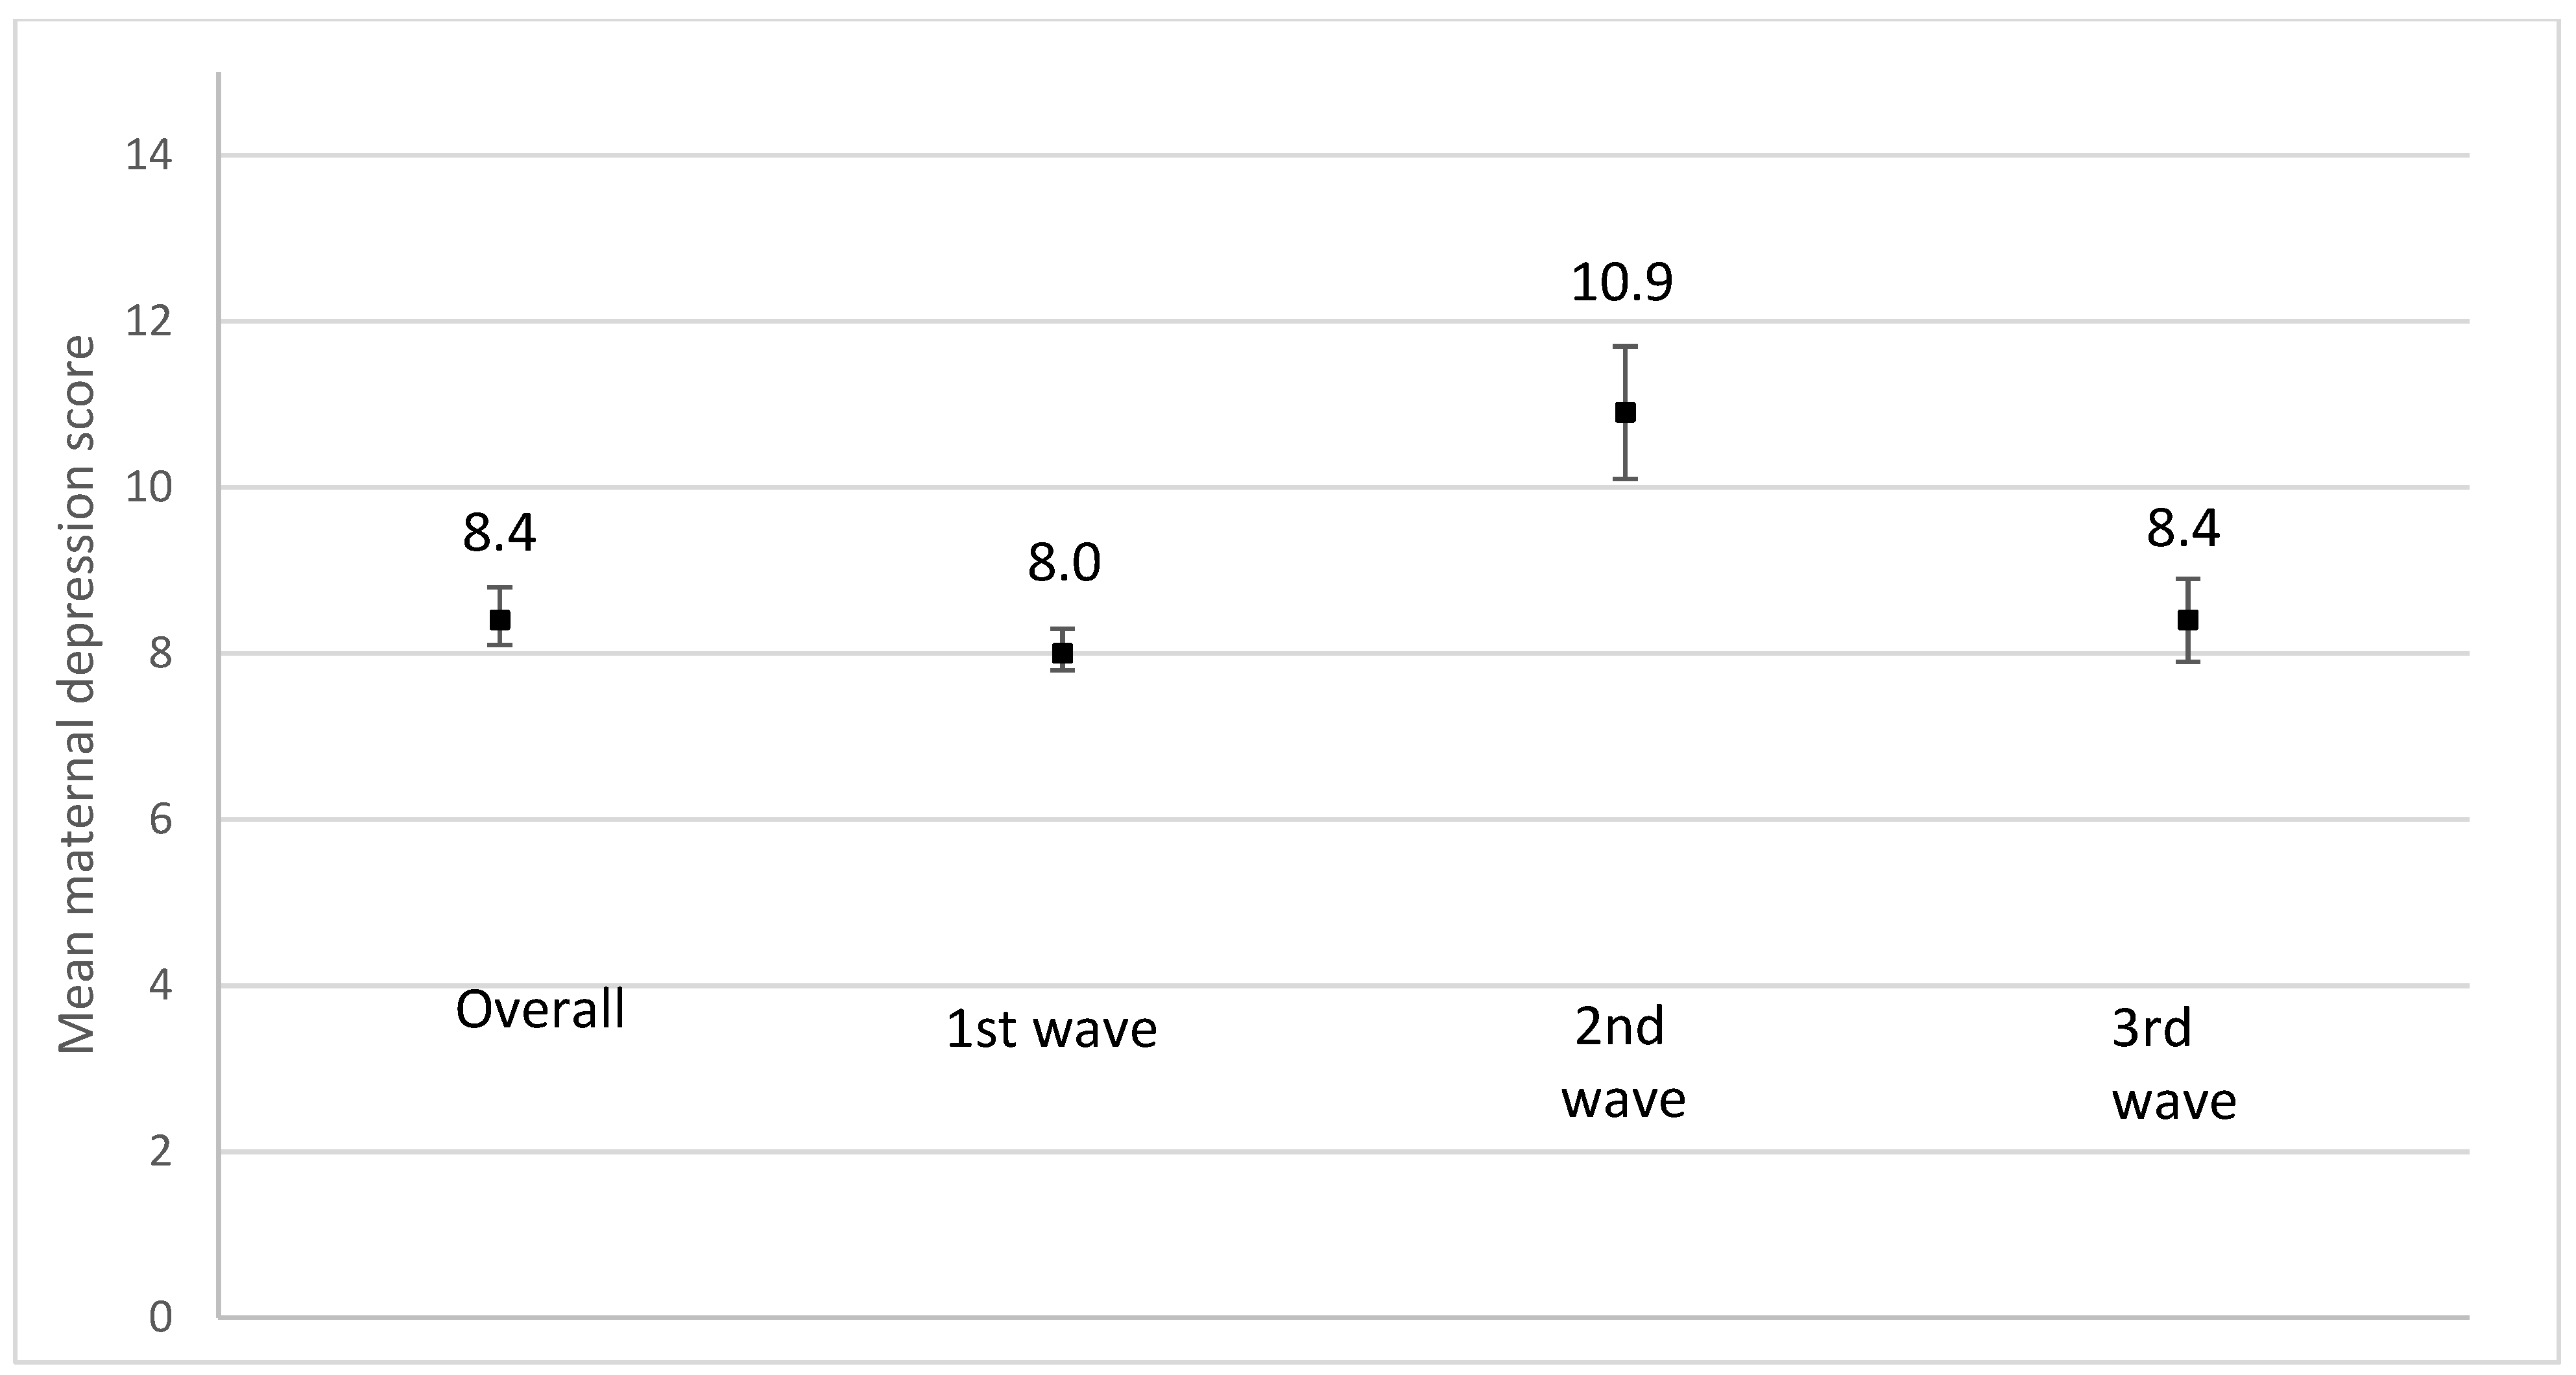
3.2. Maternal Depression

Participants who had delivered had a significantly higher mean depressive symptoms score compared to those pregnant at recruitment (EPDS, 9.1 (SD, 5.7) vs. 8.4 (SD, 5.3), p = 0.009) (Figure 3). Furthermore, pregnant persons who were recruited in their second or third trimester had a significantly higher mean depressive symptoms score compared to those who were recruited in their first trimester (EPDS, 1st trimester, 7.8 (SD, 5.3); 2nd trimester, 8.2 (SD, 5.4); 3rd trimester, 8.7 (SD, 5.2), p = 0.007) (Figure 3). Participants who had already delivered were more likely (27.2%) to have severe depressive symptoms (EPDS ≥ 13) compared with those who were pregnant (23.4%) (p = 0.06) (Figure 4a). Those recruited later in pregnancy (3rd trimester, 25.9%) were more likely to have severe depressive symptoms (EPDS ≥ 13) compared with those recruited earlier (1st trimester, 20.7%; 2nd trimester, 22.1%) (p = 0.054) (Figure 4a). Similarly, those recruited later in pregnancy (3rd trimester, 43.4%) were significantly more likely to have moderate to severe depressive symptoms (EPDS ˃ 9) compared with those recruited earlier (1st trimester, 35.0%; 2nd trimester, 37.8%) (p = 0.006) (Figure 4b).

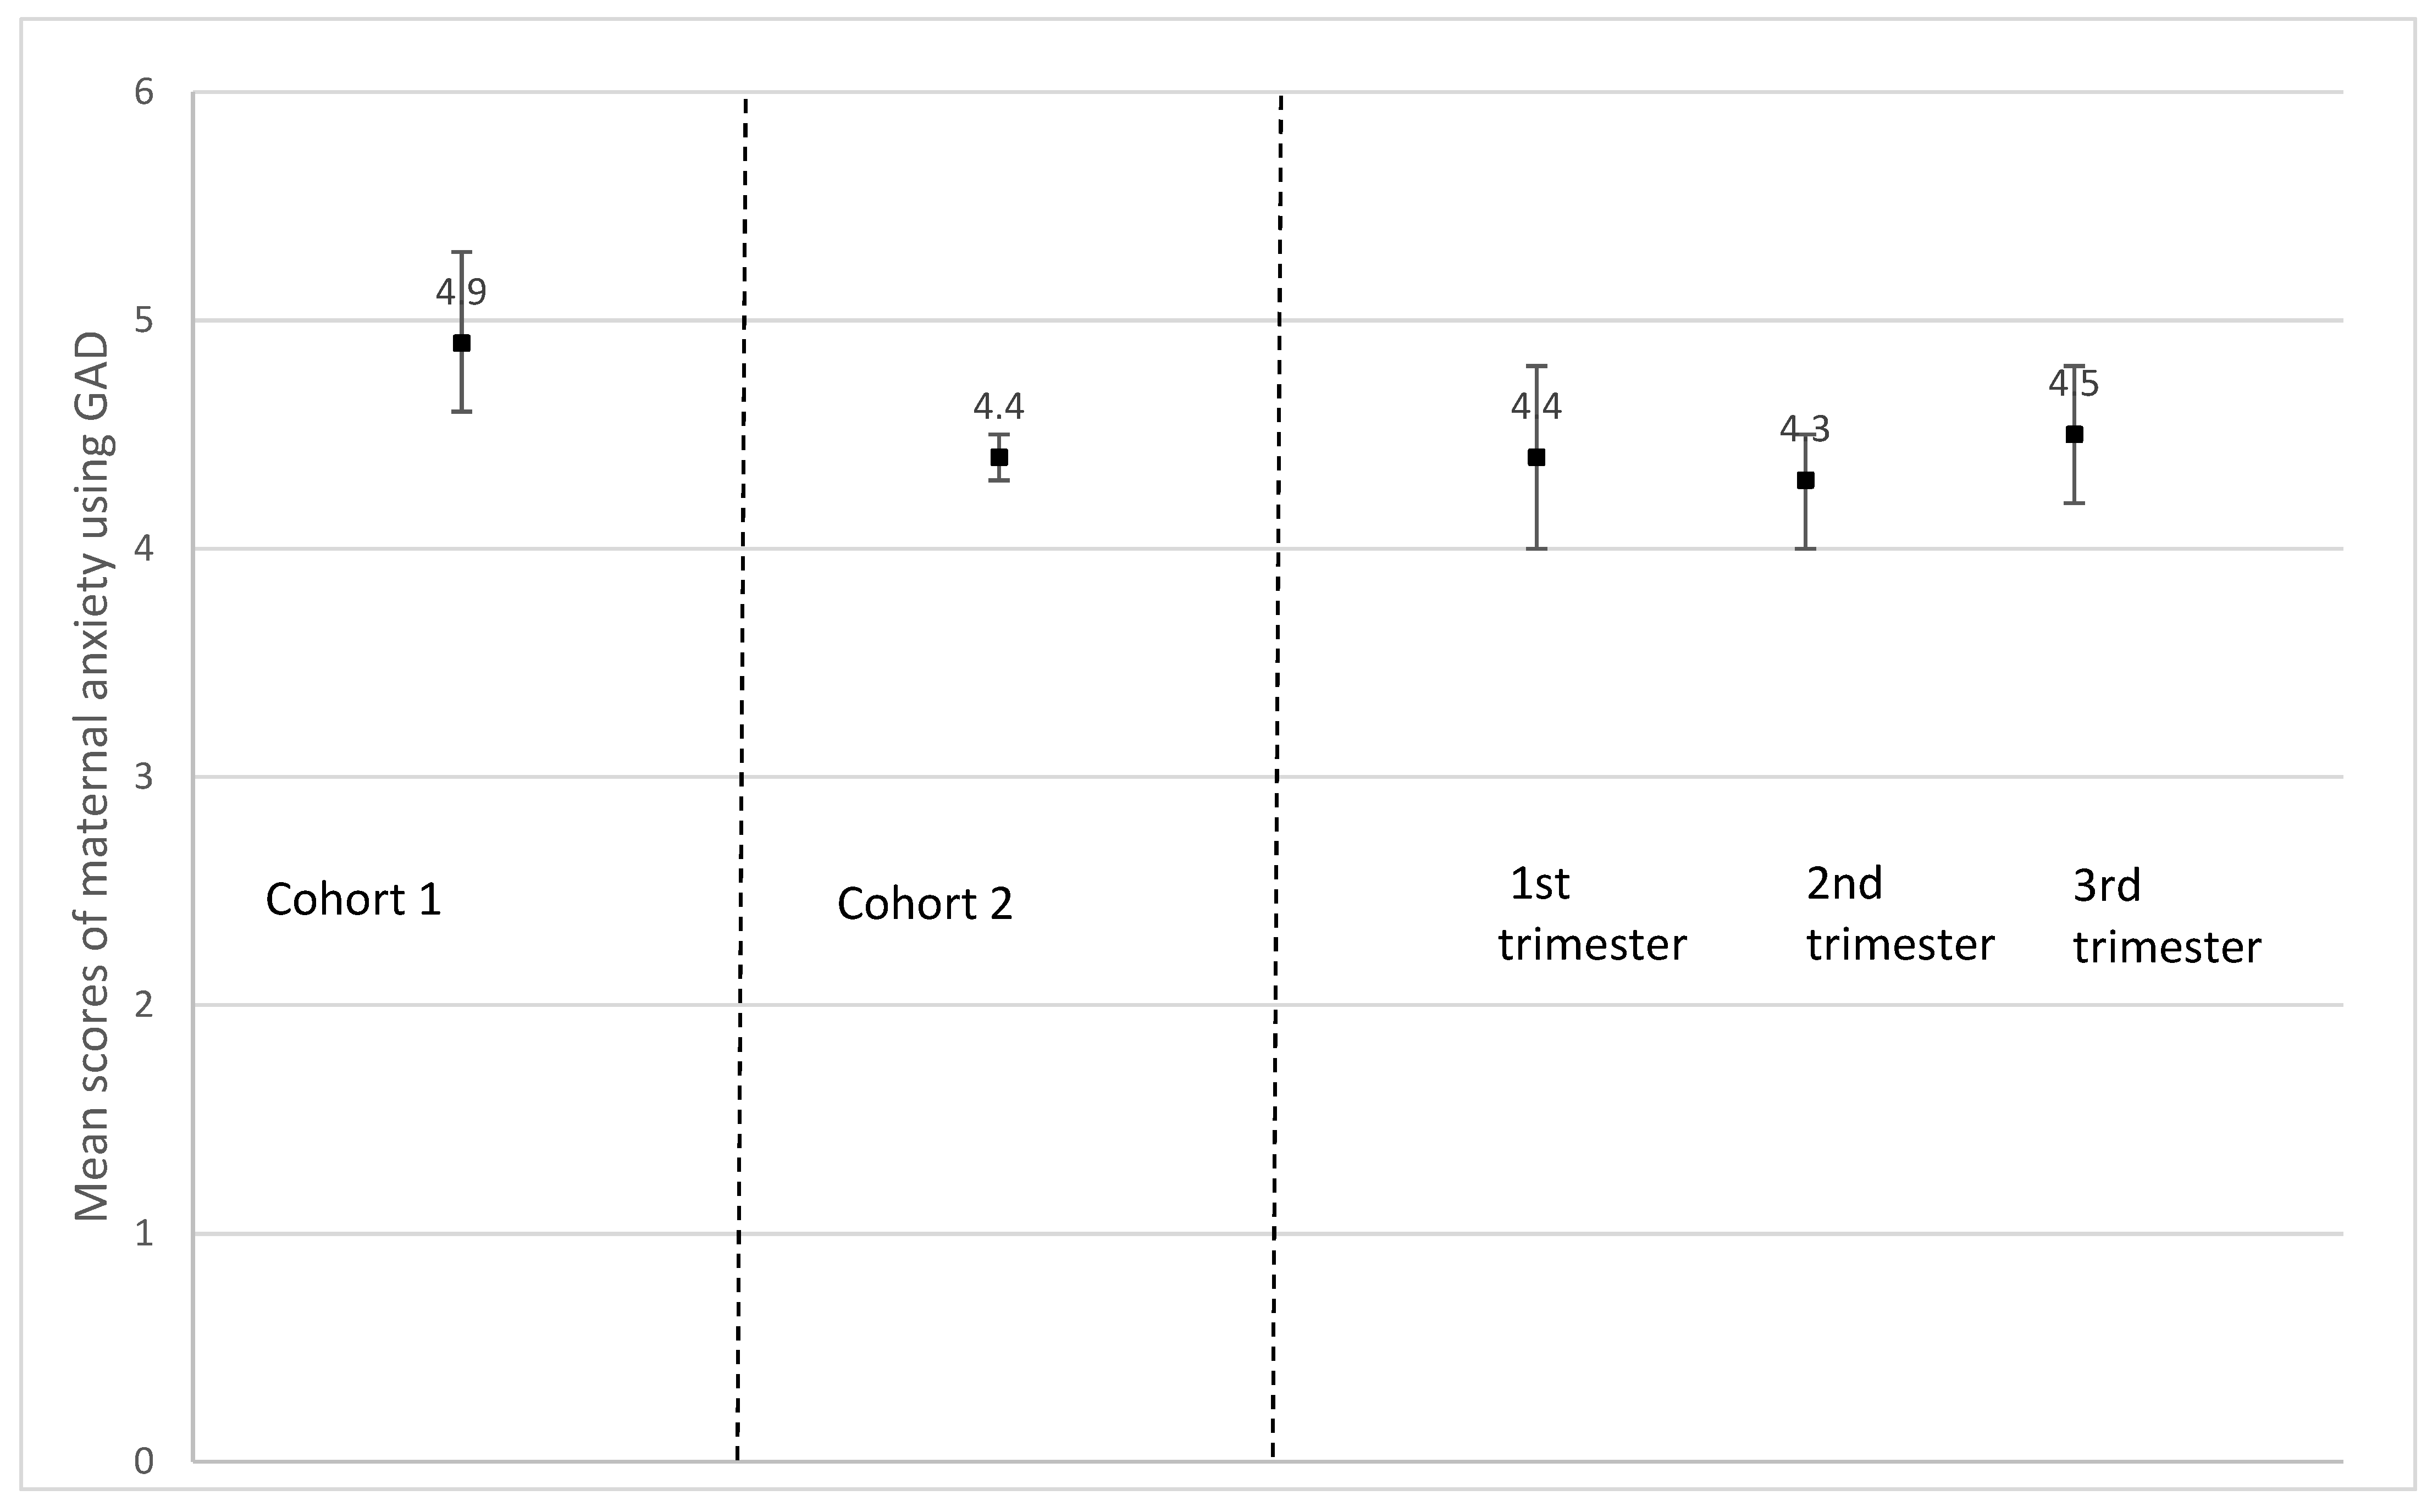
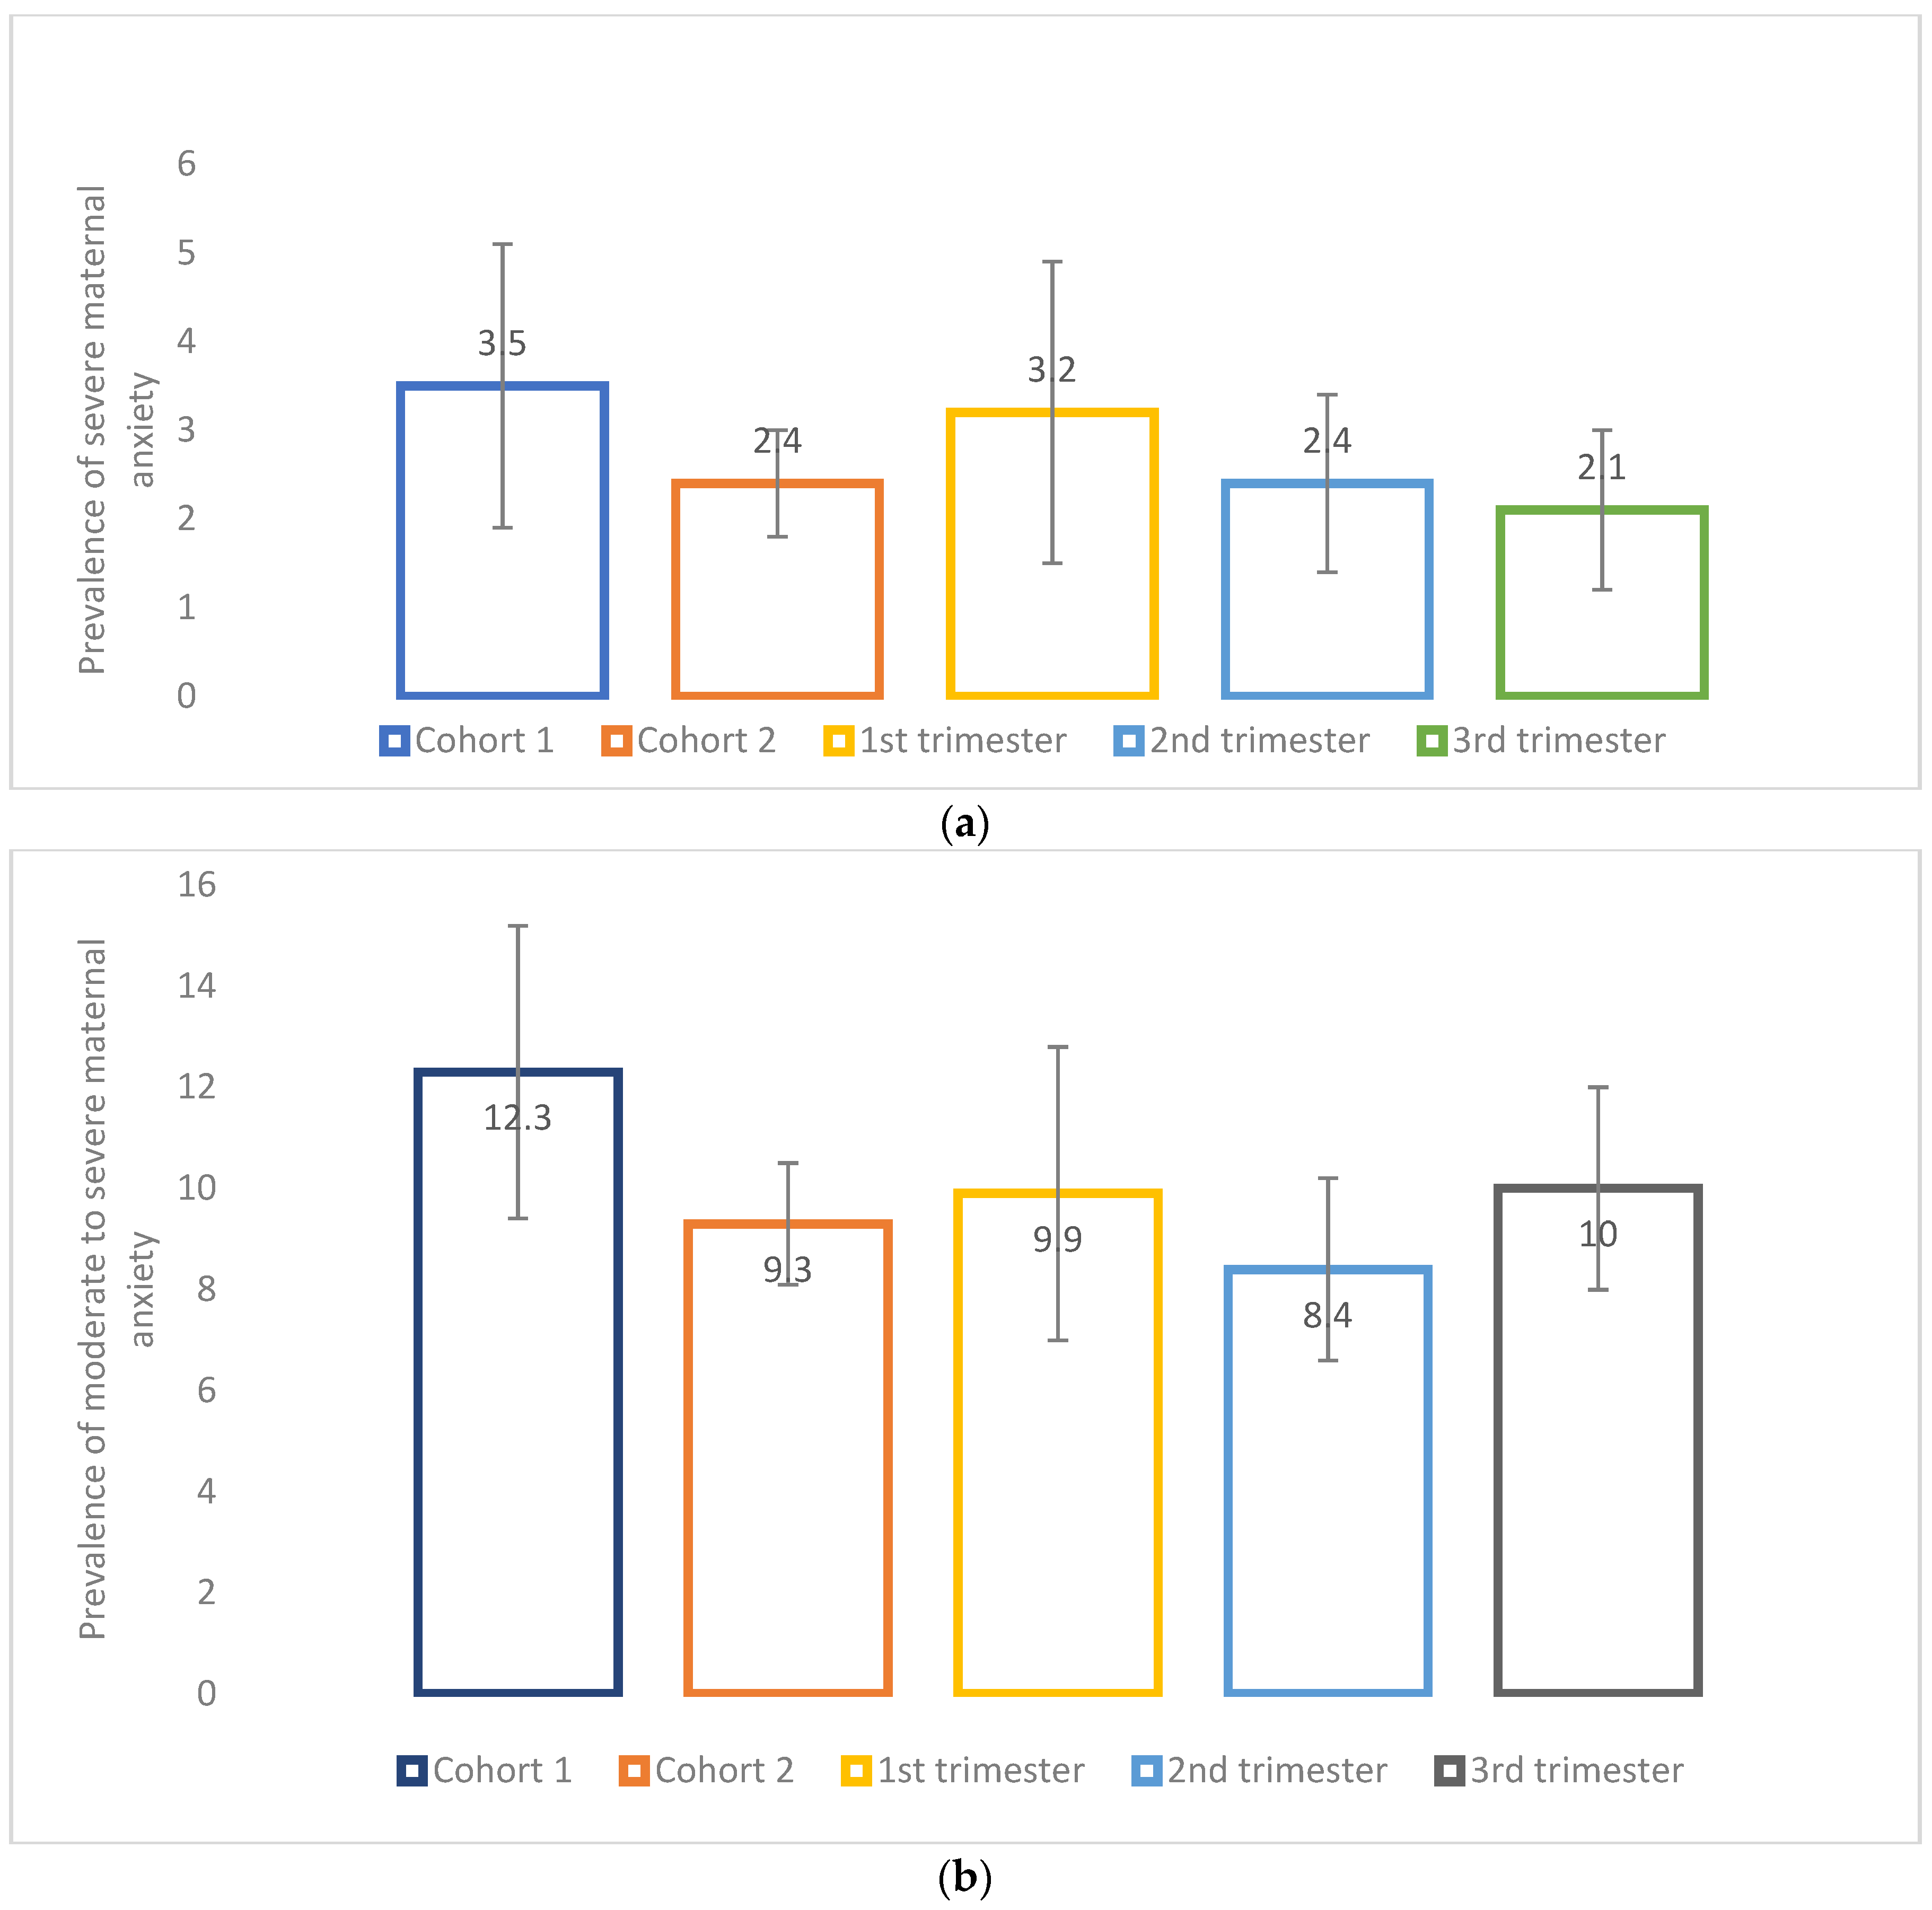
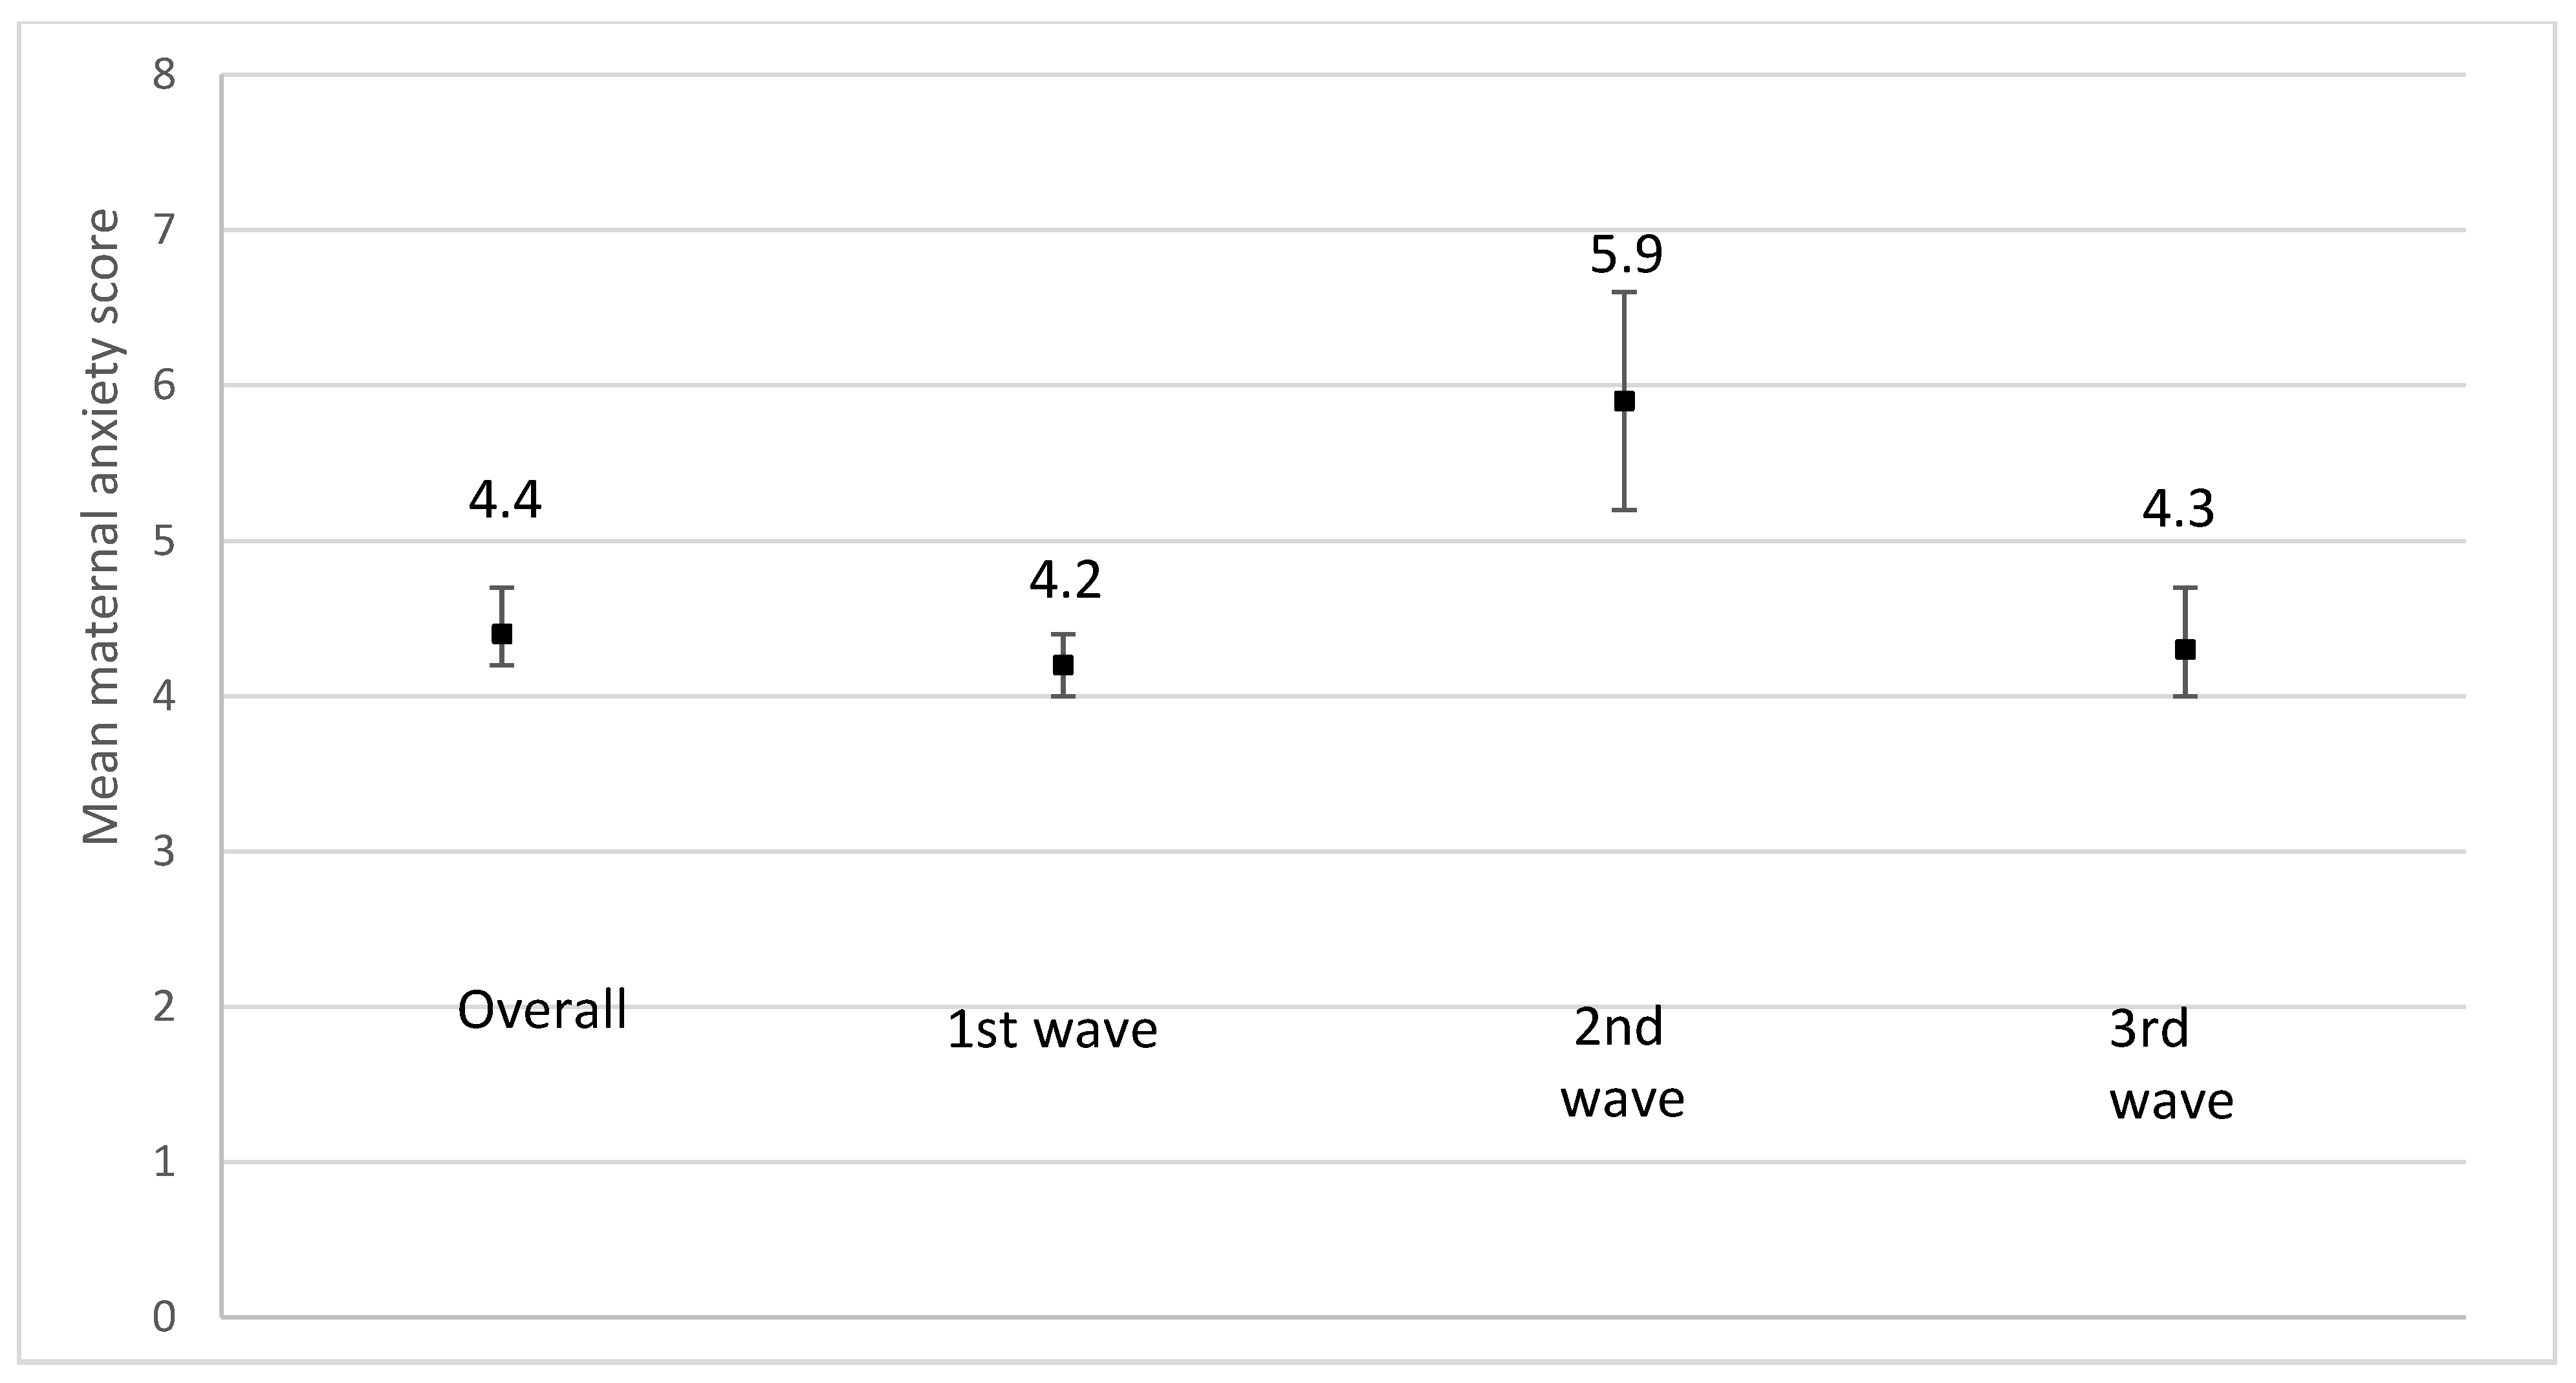
3.3. Maternal Anxiety and Overall Stress

Following the same trends observed for depression, the anxiety score (GAD-7) among those who had delivered was significantly higher on average (4.9 (SD, 4.5)) than for those pregnant at recruitment (4.4 (SD, 3.9) (p = 0.014) (Figure 5). Although non-significant, severe maternal anxiety (GAD-7 ˃ 15) tended to be more prevalent among participants who had delivered (3.5%) than for those who were pregnant (2.4%) (p > 0.05) (Figure 6a); the same was observed for moderate to severe anxiety (GAD-7 ˃ 10) (12.3% for those who had delivered vs. 9.3% for those who were pregnant, p > 0.05) (Figure 6b). Maternal stress measured using a 10-point scale was significantly higher among those who had delivered (5.2 (SD, 2.2)) compared to those who were pregnant at recruitment (4.3 (SD, 2.1) (p < 0.001) (Figure 7). Additionally, stress increased as the pregnancy progressed among those pregnant at recruitment (1st trimester, 4.4 (SD, 2.1); 2nd trimester, 4.5 (SD, 2.1); 3rd trimester, 4.7 (SD, 2.1), p < 0.001)) (Figure 7).

3.4. Predictors of Severe Maternal Depression during Pregnancy

In multivariate analyses, maternal anxiety (aOR 1.51, 95%CI 1.44–1.59) and maternal stress (aOR 1.35, 95%CI 1.24–1.48) significantly increased the risk of severe maternal depression (Table 2). In addition, living in a rural area compared to urban living (aOR 1.64, 95%CI 1.08–2.49), and increasing calendar month of recruitment (proxy for pandemic period/wave) (aOR 1.04, 95%CI, 1.01–1.07) were significant predictors of severe maternal depression; increasing household income progressively decreased the risk of severe maternal depression (income ˃ 180,000CAD, aOR 0.26, 95%CI 0.10–0.66) (Table 2). Depression, anxiety, and stress during pregnancy, stratified on COVID-19 periods/waves.
We observed an increase in mean scores for maternal depression (Figure 8), anxiety (Figure 9), and stress (Figure 10) during the 2nd pandemic wave (September 2020 to March 2021) compared to the first wave, as closures were reinstated and the vaccines were not yet available (p < 0.001). A decrease in all mean scores was observed during the 3rd wave.

4. Discussion

In this large-scale Canadian epidemiological study on the maternal mental health impact of the COVID-19 pandemic, we have shown that those who gave birth during the pandemic were more affected mentally than those who were pregnant. In addition, trimester of pregnancy and pandemic period/wave had a different impact on maternal depression, with those in their third trimester and those recruited during the 2nd wave having higher depressive symptoms than the other pregnant participants; suggesting that the closer one came to their planned delivery time, especially during the 2nd wave when closures were reinstated and while the vaccines were not yet available, the higher the level of depression. Thus far, during this pandemic, maternal anxiety, and stress as well as living in rural areas were all significant predictors of severe maternal depression during pregnancy. In this study, we did not include prior history of psychiatric illnesses and psychotropic medication. We assumed a high correlation between these variables and maternal depression, anxiety, and stress at recruitment.
We have reported higher mean depressive symptom scores in the post-partum period (EPDS, 9.1 (SD, 5.7)), and in pregnancy (EPDS, 8.4 (SD, 5.3)) during the pandemic than what has been reported in other crises and in non-pandemic periods. Indeed, using the same instrument as was used by us to measure depression, the mean depressive symptom scores during the 1998 ice storm (EPDS, 5.5 (SD, 2.6)) [11] and in non-pandemic periods (Norway [25]: EPDS, after delivery, 4.3 (SD, 3.6); 1st trimester, 4.9 (SD, 5.4); 2nd/3rd trimesters, 4.8 (SD, 4.3); Canada/US (Bérard et al. [26]): EPDS ranging from 2.9 to 8.2 depending on antidepressant use during pregnancy) were lower than what we observed. On average, our findings are double that of other crises and non-pandemic periods. [11,25,26] This could be explained by the short duration of the ice storm crisis, which lasted around 30 days and was localized (QC/ON), compared with the current pandemic. At recruitment in this study, the unknown impact of the virus on pregnancy and the baby could explain the increased anxiety and stress, and depression as a result of these two parameters. The growing body of evidence shows that pregnant persons are indeed more at risk of severe disease following COVID-19 infection (e.g., intensive care admission) and death, compared with non-pregnant persons of reproductive age [27]. The restrictions and accommodations for delivery over time can also explain higher levels of depression and anxiety among those who gave birth compared to those who were pregnant at recruitment.
We observed the highest depression, anxiety, and stress scores in the 3rd trimester compared to the 1st trimester, consistent with the literature [28]. This could be explained by hormonal changes through the pregnancy [28,29] and overall anxiety experienced by women who gave birth during a pandemic. This is probably due to anxiety about exposure to the virus in the hospital and also to COVID regulations about husbands in labor rooms.
Depression, anxiety, and stress were markedly increased in the 2nd wave, which consisted of the longest lockdowns across Canada, and when no vaccines were available. Indeed, it has been reported that the top impact indicator of major depressive disorder besides daily cases of COVID-19 infection is the reduction of human mobility [30]. Interestingly, all parameters of mental health were lower in the 3rd wave, which coincides with the deployment of vaccination campaigns [23,31,32] representing what may be defined as an end in sight.
We identified several predictors of severe maternal depression, including maternal anxiety and stress. Anxiety as well as stress are both highly correlated with depression and are predictors of depression [33,34]. Rural compared to urban living was identified as a predictor of severe depression during pregnancy, in line with the literature among Caucasian white women and African Americans alike [35]. Lastly, the calendar month of recruitment, used as a proxy for pandemic period/wave, was identified as a predictor for severe depression. Indeed, as the pandemic progressed, we observed increases in depression, anxiety, and stress levels with a marked increase in the 2nd wave, and a decrease in the 3rd wave, which could explain this finding.
Our study has many strengths. Indeed, it has a large Canadian sample size allowing us to evaluate the impact of the COVID-19 pandemic on persons who delivered and on pregnant persons’ experience using a robust multi-methods recruitment strategy, and standardized and validated instruments. Data intake was done electronically, increasing the speed with which the study was performed, and thus giving real-time results that remain relevant for public health decisions. The continued recruitment further allowed us to assess the impact of different waves and their implications on maternal mental health.
Limitations include the absence of a denominator given the recruitment methods. We cannot rule out that our participants were more concerned about the impact of COVID-19 on their pregnancy/delivery than the general population. Furthermore, although internet access could have been a deterrent to participation, we recruited pregnant persons in-person in community clinics (lower socioeconomic status). Although this increased recruitment of a more diverse pregnant population, selection bias cannot be ruled out. Nevertheless, the mean age of participants is representative of the general population of pregnant persons and persons of reproductive age [1]. Our study is among the largest studies on the impact of the COVID-19 pandemic on maternal mental health during pregnancy and postpartum. Ceulemans et al. [18] published survey data in pregnant European persons with similar data intake strategies but only using social media recruitment. Nevertheless, much of their sample was from 2 countries, Norway and The Netherlands, which resulted in unbalanced sample sizes between countries. Our questionnaire was longer than in other studies. This allowed us to collect many variables of interest to answer many research questions (including the impact of the pandemic on maternal mental health) and follow women and children over time (Phase II of the study). However, the impact of the questionnaire length on the participation rate is difficult to assess.
To our knowledge, no study has been conducted to quantify the prevalence of mental health during the perinatal period and identify its predictors in this population through the trimesters of pregnancy. Additionally, the stratification by pandemic waves allows us to assess the impact of public health measures on maternal mental health.

5. Conclusions

The COVID-19 pandemic has had a detrimental impact on mental health throughout pregnancy and after delivery. Depression, anxiety, and stress were markedly increased in the 2nd wave of the pandemic, which was, until now, the most stressful for pregnant persons than other previous crises. Maternal depression, anxiety, and stress were highly correlated. Given that gestational depression/anxiety/stress has been associated with preterm birth and childhood cognitive problems, it is essential to continue following women/children, and develop strategies to reduce COVID-19′s longer-term impact.

Author Contributions

A.B. had full access to all the data in the study and takes responsibility for the integrity of the data and the accuracy of the data analyses. Acquisition of data: A.B., J.G., Y.-H.G. and A.L. Analysis of data: A.B., V.T., J.G. and Y.-H.G. Statistical analysis: A.B., V.T. Drafting of the manuscript: A.B. Administrative, technical, or material support: A.B., J.G., Y.-H.G. and S.K. All authors contributed to the article, design of this analysis, critical revisions of the manuscript. All authors have read and agreed to the published version of the manuscript.

Funding

This study was funded by the Faculty of Pharmacy, Université de Montréal, Canada. The funding sources had no role in the design and conduct of the study; collection, management, analysis, and interpretation of the data; preparation, review, or approval of the manuscript; and decision to submit the manuscript for publication.

Institutional Review Board Statement

The study was conducted in accordance with the Declaration of Helsinki, and was approved by the CHU Sainte-Justine’s Research Ethics Committee on 23 June 2020 (no. MP-21-2021-2973).

Informed Consent Statement

Informed consent was obtained from all subjects involved in the study.Subjects consented to having the collected data analysed and published in peer reviewered journals.

Data Availability Statement

Anonymised individual-level data from the study including data dictionaries, data collection tools will be made available upon request. Requests for access will be reviewed by a data access committee.

Acknowledgments

We are grateful to the study participants. A Bérard is the recipient of a career award from the Fonds de la recherche en santé du Québec (FRSQ) and with E Ferreira, is on the endowment research chair on Medications, Pregnancy, and Lactation at the Faculty of Pharmacy of the University of Montreal; A Lacasse holds a Junior 2 research scholar award from the FRQS in partnership with the QC SUPPORT Unit (Support for People and Patient-Oriented Research and Trials); FT Muanda is supported by a Canadian Institutes of Health Research (CIHR) and MITACS postdoctoral award; I Boucoiran is the recipients of a salary award from FRQS; C Quach is the recipient of a career award from the FRQS and the Canada Research Chair, Tier 1 in Infection Prevention & Control; P Kaul is the CIHR Sex and Gender Science Chair; KJ O’Donnell is a CIFAR Fellow in Child & Brain Development and the Pfeil Investigator (Brain and Behavior Research Foundation); S Bernatsky is a James McGill Professor of Medicine, and she and A Berard are members of the Canadian Network for Advanced Interdisciplinary Methods for comparative effectiveness research’ (CAN-AIM) team, funded by CIHR through the Drug Safety and Effectiveness Network.

Conflicts of Interest

The authors declare that the research was conducted in the absence of any commercial or financial relationships that could be construed as a potential conflict of interest.

References

  1. Grote, N.K.; Bridge, J.A.; Gavin, A.R.; Melville, J.L.; Iyengar, S.; Katon, W.J. A Meta-analysis of Depression During Pregnancy and the Risk of Preterm Birth, Low Birth Weight, and Intrauterine Growth Restriction. Arch. Gen. Psychiatry 2010, 67, 1012–1024. [Google Scholar] [CrossRef] [PubMed]
  2. Pfefferbaum, B.; North, C.S. Mental Health and the COVID-19 Pandemic. N. Engl. J. Med. 2020, 383, 510–512. [Google Scholar] [CrossRef] [PubMed]
  3. Brooks, S.K.; Webster, R.K.; Smith, L.E.; Woodland, L.; Wessely, S.; Greenberg, N.; Rubin, G.J. The psychological impact of quarantine and how to reduce it: Rapid review of the evidence. Lancet 2020, 395, 912–920. [Google Scholar] [CrossRef] [Green Version]
  4. DiGiovanni, C.; Conley, J.; Chiu, D.; Zaborski, J. Factors Influencing Compliance with Quarantine in Toronto during the 2003 SARS Outbreak. Biosecur. Bioterror. Biodef. Strat. Pract. Sci. 2004, 2, 265–272. [Google Scholar] [CrossRef] [PubMed]
  5. Mappa, I.; Distefano, F.A.; Rizzo, G. Effects of coronavirus 19 pandemic on maternal anxiety during pregnancy: A prospectic observational study. J. Peérinat. Med. 2020, 48, 545–550. [Google Scholar] [CrossRef]
  6. Karam, F.; Sheehy, O.; Huneau, M.-C.; Chambers, C.; Fraser, W.D.; Johnson, D.; Kao, K.; Martin, B.; Riordan, S.H.; Roth, M.; et al. Impact of maternal prenatal and parental postnatal stress on 1-year-old child development: Results from the OTIS antidepressants in pregnancy study. Arch. Women’s Ment. Health 2016, 19, 835–843. [Google Scholar] [CrossRef]
  7. Laplante, D.P.; Brunet, A.; Schmitz, N.; Ciampi, A.; King, S. Project Ice Storm: Prenatal maternal stress affects cognitive and linguistic functioning in 5 1/2-year-old children. J. Am. Acad. Child. Adolesc. Psychiatry 2008, 47, 1063–1072. [Google Scholar] [CrossRef] [Green Version]
  8. Dancause, K.N.; Laplante, D.P.; Fraser, S.; Brunet, A.; Ciampi, A.; Schmitz, N.; King, S. Prenatal exposure to a natural disaster increases risk for obesity in 5(1/2)-year-old children. Pediatr. Res. 2012, 71, 126–131. [Google Scholar] [CrossRef]
  9. Liu, G.T.; Dancause, K.N.; Elgbeili, G.; Laplante, D.P.; King, S. Disaster-related prenatal maternal stress explains increasing amounts of variance in body composition through childhood and adolescence: Project Ice Storm. Environ. Res. 2016, 150, 1–7. [Google Scholar] [CrossRef] [Green Version]
  10. Veru, F.; Dancause, K.; Laplante, D.P.; King, S.; Luheshi, G. Prenatal maternal stress predicts reductions in CD4+ lymphocytes, increases in innate-derived cytokines, and a Th2 shift in adolescents: Project Ice Storm. Physiol. Behav. 2015, 144, 137–145. [Google Scholar] [CrossRef]
  11. Laplante, D.P.; Barr, R.G.; Brunet, A.; Du Fort, G.G.; Meaney, M.L.; Saucier, J.-F.; Zelazo, P.R.; King, S. Stress During Pregnancy Affects General Intellectual and Language Functioning in Human Toddlers. Pediatr. Res. 2004, 56, 400–410. [Google Scholar] [CrossRef] [PubMed] [Green Version]
  12. Laplante, D.P.; Zelazo, P.R.; Brunei, A.; King, S. Functional Play at 2 Years of Age: Effects of Prenatal Maternal Stress. Infancy 2007, 12, 69–93. [Google Scholar] [CrossRef]
  13. Li, X.; Gao, R.; Dai, X.; Liu, H.; Zhang, J.; Liu, X.; Si, D.; Deng, T.; Xia, W. The association between symptoms of depression during pregnancy and low birth weight: A prospective study. BMC Pregnancy Childbirth 2020, 20, 147. [Google Scholar] [CrossRef] [PubMed] [Green Version]
  14. Nakic Rados, S.; Tadinac, M.; Herman, R. Anxiety During Pregnancy and Postpartum: Course, Predictors and Comorbidity with Postpartum Depression. Acta Clin. Croat. 2018, 57, 39–51. [Google Scholar] [CrossRef]
  15. Lebel, C.; MacKinnon, A.; Bagshawe, M.; Tomfohr-Madsen, L.; Giesbrecht, G. Elevated depression and anxiety symptoms among pregnant individuals during the COVID-19 pandemic. J. Affect. Disord. 2020, 277, 5–13. [Google Scholar] [CrossRef] [PubMed]
  16. Wu, Y.; Zhang, C.; Liu, H.; Duan, C.; Li, C.; Fan, J.; Li, H.; Chen, L.; Xu, H.; Li, X.; et al. Perinatal depressive and anxiety symptoms of pregnant women during the coronavirus disease 2019 outbreak in China. Am. J. Obstet. Gynecol. 2020, 223, 240.e1–240.e9. [Google Scholar] [CrossRef]
  17. Statistics Canada. Survey on COVID-19 and Mental Health, September to December 2020. Available online: https://www150.statcan.gc.ca/n1/daily-quotidien/210318/dq210318a-eng.htm (accessed on 22 November 2021).
  18. Ceulemans, M.; Foulon, V.; Ngo, E.; Panchaud, A.; Winterfeld, U.; Pomar, L.; Lambelet, V.; Cleary, B.; O’Shaughnessy, F.; Passier, A.; et al. Mental health status of pregnant and breastfeeding women during the COVID-19 pandemic—A multinational cross-sectional study. Acta Obstet. Gynecol. Scand. 2021, 100, 1219–1229. [Google Scholar] [CrossRef]
  19. Kajdy, A.; Feduniw, S.; Ajdacka, U.; Modzelewski, J.; Baranowska, B.; Sys, D.; Pokropek, A.; Pawlicka, P.; Kaźmierczak, M.; Rabijewski, M.; et al. Risk factors for anxiety and depression among pregnant women during the COVID-19 pandemic: A web-based cross-sectional survey. Medicine 2020, 99, e21279. [Google Scholar] [CrossRef]
  20. Ali, S.H.; Foreman, J.; Capasso, A.; Jones, A.M.; Tozan, Y.; DiClemente, R.J. Social media as a recruitment platform for a nationwide online survey of COVID-19 knowledge, beliefs, and practices in the United States: Methodology and feasibility analysis. BMC Med. Res. Methodol. 2020, 20, 116. [Google Scholar] [CrossRef]
  21. Shrestha, S.D.; Pradhan, R.; Tran, T.; Gualano, R.C.; Fisher, J. Reliability and validity of the Edinburgh Postnatal Depression Scale (EPDS) for detecting perinatal common mental disorders (PCMDs) among women in low-and lower-middle-income countries: A systematic review. BMC Pregnancy Childbirth 2016, 16, 72. [Google Scholar] [CrossRef] [Green Version]
  22. Ruiz, M.A.; Zamorano, E.; Garcia-Campayo, J.; Pardo, A.; Freire, O.; Rejas, J. Validity of the GAD-7 scale as an outcome measure of disability in patients with generalized anxiety disorders in primary care. J. Affect. Disord. 2011, 128, 277–286. [Google Scholar] [CrossRef] [PubMed]
  23. Society of Obstetricians and Gynaecologists of Canada. SOGC Statement on the COVID-19 Vaccines and Rare Adverse Outcomes of Thrombosis Associated with Low Platelets. 2021. Available online: https://www.sogc.org/en/content/featured-news/SOGC_Statement_on_the_COVID-19_vaccines_and_rare_adverse_outcomes_of_%20thrombosis.aspx (accessed on 22 November 2021).
  24. García, F.E.; Barraza-Peña, C.G.; Wlodarczyk, A.; Alvear-Carrasco, M.; Reyes-Reyes, A. Psychometric properties of the Brief-COPE for the evaluation of coping strategies in the Chilean population. Psicol Reflex Crit. 2018, 31, 11–22. [Google Scholar] [CrossRef] [PubMed]
  25. Eberhard-Gran, M.; Tambs, K.; Opjordsmoen, S.; Skrondal, A.; Eskild, A. Depression during pregnancy and after delivery: A repeated measurement study. J. Psychosom. Obstet. Gynecol. 2004, 25, 15–21. [Google Scholar] [CrossRef] [PubMed]
  26. Bérard, A.; Sheehy, O.; Zhao, J.-P.; Chambers, C.; Roth, M.; Bozzo, P.; Johnson, D.; Kao, K.; Lavigne, S.; Wolfe, L.; et al. Impact of antidepressant use, discontinuation, and dosage modification on maternal depression during pregnancy. Eur. Neuropsychopharmacol. 2019, 29, 803–812. [Google Scholar] [CrossRef]
  27. Krubiner, C.B.; Faden, R.R.; Karron, R.A.; Little, M.O.; Lyerly, A.D.; Abramson, J.S.; Beigi, R.H.; Cravioto, A.R.; Durbin, A.P.; Gellin, B.G.; et al. Pregnant women & vaccines against emerging epidemic threats: Ethics guidance for preparedness, research, and response. Vaccine 2019, 39, 85–120. [Google Scholar] [CrossRef] [PubMed]
  28. Onoye, J.M.; Shafer, L.A.; Goebert, D.A.; Morland, L.A.; Matsu, C.R.; Hamagami, F. Changes in PTSD symptomatology and mental health during pregnancy and postpartum. Arch. Women’s Ment. Health 2013, 16, 453–463. [Google Scholar] [CrossRef]
  29. Yim, I.S.; Glynn, L.M.; Schetter, C.D.; Hobel, C.J.; Chicz-DeMet, A.; Sandman, C.A. Risk of Postpartum Depressive Symptoms With Elevated Corticotropin-Releasing Hormone in Human Pregnancy. Arch. Gen. Psychiatry 2009, 66, 162–169. [Google Scholar] [CrossRef] [Green Version]
  30. Santomauro, D.F.; Herrera, A.M.M.; Shadid, J.; Zheng, P.; Ashbaugh, C.; Pigott, D.M.; Abbafati, C.; Adolph, C.; Amlag, J.O.; Aravkin, A.Y.; et al. Global prevalence and burden of depressive and anxiety disorders in 204 countries and territories in 2020 due to the COVID-19 pandemic. Lancet 2021, 398, 1700–1712. [Google Scholar] [CrossRef]
  31. Poliquin, V.; Castillo, E.; Boucoiran, I.; Wong, J.; Watson, H.; Yudin, M.; Money, D.; Van Schalkwyk, J.; Elwood, C.; on behalf of the Infectious Disease Committee of the Society of Obstetricians and Gynaecologists of Canada. SOGC Statement on COVID-19 Vaccination in Pregnancy. 2021. Available online: https://sogc.org/common/Uploaded%20files/Latest%20News/SOGC_Statement_COVID-19_Vaccination_in_Pregnancy.pdf (accessed on 22 November 2021).
  32. MSSS. COVID-19 ARNm: Vaccins à ARN Messager Contre la COVID-19. 2021. Available online: https://www.msss.gouv.qc.ca/professionnels/vaccination/piq-vaccins/covid-19-vaccin-a-arn-messager-contre-la-covid-19/ (accessed on 22 November 2021).
  33. Kalin, N.H. The Critical Relationship Between Anxiety and Depression. Am. J. Psychiatry 2020, 177, 365–367. [Google Scholar] [CrossRef]
  34. Hammen, C.; Kim, E.Y.; Eberhart, N.K.; Brennan, P.A. Chronic and acute stress and the prediction of major depression in women. Depress. Anxiety 2009, 26, 718–723. [Google Scholar] [CrossRef] [Green Version]
  35. Weaver, A.; Himle, J.A.; Taylor, R.J.; Matusko, N.N.; Abelson, J.M. Urban vs Rural Residence and the Prevalence of Depression and Mood Disorder Among African American Women and Non-Hispanic White Women. JAMA Psychiatry 2015, 72, 576–583. [Google Scholar] [CrossRef] [PubMed] [Green Version]
Figure 1. Study design and data collection.
Ijerph 19 02926 g001
Figure 2. Study flow chart.
Ijerph 19 02926 g002
Figure 3. Mean maternal depression scores using the Edinburgh Postnatal Depression Scale (EPDS) according to pregnancy status and trimester of pregnancy. Cohort 1 = women who delivered between 13 March and today at the time of recruitment; n = 498; missing values on maternal depression = 128. Cohort 2 = women who were pregnant at the time of the recruitment; n = 2251; missing values on maternal depression = 323. p-value between cohort 1 and 2 = 0.0091. 1st trimester = women who were at their 1st trimester of pregnancy at the time of recruitment; n = 411; missing values on maternal depression = 93. 2nd trimester = women who were at their 2nd trimester of pregnancy at the time of recruitment; n = 925; missing values on maternal depression = 107. 3rd trimester = women who were at their 3rd trimester of pregnancy at the time of recruitment; n = 915; missing values on maternal depression = 123. p-value for all trimesters = 0.0074.
Ijerph 19 02926 g003
Figure 4. (a) Prevalence of severe maternal depressive symptoms using the Edinburgh Postnatal Depression Scale (EPDS) cut-off (≥13) according to pregnancy status and trimester of pregnancy. Cohort 1 = women who delivered between 13 March and today at the time of recruitment; n = 498; missing values on maternal depression = 128. Cohort 2 = women who were pregnant at the time of the recruitment; n = 2251; missing values on maternal depression = 323. p-value between cohort 1 and 2 = 0.0627. 1st trimester = women who were at their 1st trimester of pregnancy at the time of recruitment; n = 411; missing values on maternal depression = 93. 2nd trimester = women who were at their 2nd trimester of pregnancy at the time of recruitment; n = 925; missing values on maternal depression = 107. 3rd trimester = women who were at their 3rd trimester of pregnancy at the time of recruitment; n = 915; missing values on maternal depression = 123. p-value for all trimesters = 0.0542. (b) Prevalence of moderate to severe maternal depressive symptoms using the Edinburgh Postnatal Depression Scale (EPDS) cut-off (>9) according to pregnancy status and trimester of pregnancy. Cohort 1 = women who delivered between 13 March and today at the time of recruitment; n = 498; missing values on maternal depression = 128. Cohort 2 = women who were pregnant at the time of the recruitment; n = 2251; missing values on maternal depression = 323. p-value between cohort 1 and 2 = 0.1185. 1st trimester = women who were at their 1st trimester of pregnancy at the time of recruitment; n = 411; missing values on maternal depression = 93. 2nd trimester = women who were at their 2nd trimester of pregnancy at the time of recruitment; n = 925; missing values on maternal depression = 107. 3rd trimester = women who were at their 3rd trimester of pregnancy at the time of recruitment; n = 915; missing values on maternal depression = 123. p-value for all trimesters = 0.0059 (Compared to the 1st trimester, women in their 3rd trimester had significant results).
Ijerph 19 02926 g004
Figure 5. Mean maternal anxiety score using the Generalized Anxiety Disorder 7-item scale (GAD-7) according to pregnancy status and trimester of pregnancy. Cohort 1 = women who delivered between 13 March and today at the time of recruitment; n = 489; missing values on maternal depression = 137. Cohort 2 = women who were pregnant at the time of the recruitment; n = 2220; missing values on maternal depression = 354. p-value between cohort 1 and 2 = 0.0139. 1st trimester = women who were at their 1st trimester of pregnancy at the time of recruitment; n = 403; missing values on maternal depression = 101. 2nd trimester = women who were at their 2nd trimester of pregnancy at the time of recruitment; n = 917; missing values on maternal depression = 115. 3rd trimester = women who were at their 3rd trimester of pregnancy at the time of recruitment; n = 900; missing values on maternal depression = 138. p-value for all trimesters = 0.4146.
Ijerph 19 02926 g005
Figure 6. (a) Prevalence of severe maternal anxiety symptoms using the Generalized Anxiety Disorder 7-item scale (GAD-7) cut-off (>15) according to pregnancy status and trimester of pregnancy. Cohort 1 = women who delivered between 13 March and today at the time of recruitment; n = 489; missing values on maternal depression = 137.Cohort 2 = women who were pregnant at the time of the recruitment; n = 2220; missing values on maternal depression = 354. p-value between cohort 1 and 2 = 0.1908. 1st trimester = women who were at their 1st trimester of pregnancy at the time of recruitment; n = 403; missing values on maternal depression = 101. 2nd trimester = women who were at their 2nd trimester of pregnancy at the time of recruitment; n = 917; missing values on maternal depression = 115. 3rd trimester = women who were at their 3rd trimester of pregnancy at the time of recruitment; n = 900; missing values on maternal depression = 138. p-value for all trimesters = 0.4808 (No significant results when compared 2nd trimester and 3rd trimester to 1st trimester). (b) Prevalence of moderate to severe maternal anxiety symptoms using the Generalized Anxiety Disorder 7-item scale (GAD-7) cut-off (>10) according to pregnancy status and trimester of pregnancy. Cohort 1 = women who delivered between 13 March and today at the time of recruitment; n = 489; missing values on maternal depression = 137. Cohort 2 = women who were pregnant at the time of the recruitment; n = 2220; missing values on maternal depression = 354.np-value between cohort 1 and 2 = 0.0479. 1st trimester = women who were at their 1st trimester of pregnancy at the time of recruitment; n = 403; missing values on maternal depression = 101. 2nd trimester = women who were at their 2nd trimester of pregnancy at the time of recruitment; n = 917; missing values on maternal depression = 115. 3rd trimester = women who were at their 3rd trimester of pregnancy at the time of recruitment; n = 900; missing values on maternal depression = 138. p-value for all trimesters = 0.4513 (No significant results when compared 2nd trimester and 3rd trimester to 1st trimester).
Ijerph 19 02926 g006
Figure 7. Mean maternal COVID-19-related stress using a scale from 1 (No stress) to 10 (Extreme stress) according to pregnancy status and trimester of pregnancy. Cohort 1 = women who delivered between 13 March and today at the time of recruitment; n = 527; missing values on maternal depression = 99. Cohort 2 = women who were pregnant at the time of the recruitment; n = 2314; missing values on maternal depression = 260. p-value between cohort 1 and 2 <0.0001. 1st trimester = women who were at their 1st trimester of pregnancy at the time of recruitment; n = 424; missing values on maternal depression = 80. 2nd trimester = women who were at their 2nd trimester of pregnancy at the time of recruitment; n = 948; missing values on maternal depression = 84. 3rd trimester = women who were at their 3rd trimester of pregnancy at the time of recruitment; n = 946; missing values on maternal depression = 96. p-value for all trimesters <0.0001.
Ijerph 19 02926 g007
Figure 8. Mean maternal depression scores using the Edinburgh Postnatal Depression Scale (EPDS) according to the recruitment period. 1st wave: recruitment between June and August 2020; n = 1605; missing values on maternal depression = 221. 2nd wave: recruitment from September 2020 to March 2021; n = 184; missing values on maternal depression = 32. 3rd wave: recruitment from April 2021 to August 2021; n = 462; missing values on maternal depression = 70. p-value < 0.0001.
Ijerph 19 02926 g008
Figure 9. Mean maternal anxiety score using the Generalized Anxiety Disorder 7-item scale (GAD-7) according to the recruitment period. 1st wave: recruitment between June and August 2020; n = 1577; missing values on maternal depression = 249. 2nd wave: recruitment from September 2020 to March 2021; n = 181; missing values on maternal depression = 35. 3rd wave: recruitment from April 2021 to August 2021; n = 462; missing values on maternal depression = 70. p-value < 0.0001.
Ijerph 19 02926 g009
Figure 10. Mean maternal COVID-19-related stress due to the COVID-19 pandemic using a scale from 1 (No stress) to 10 (extreme stress) according to the recruitment period. 1st wave: recruitment between June and August 2020; n = 1653; missing values on maternal depression = 173. 2nd wave: recruitment from September 2020 to March 2021; n = 188; missing values on maternal depression = 28. 3rd wave: recruitment from April 2021 to August 2021; n = 473; missing values on maternal depression = 59. p-value < 0.0001.
Ijerph 19 02926 g010
Table 1. Sociodemographic characteristics of participants according to pregnancy status and trimester of pregnancy.
Women Who
Delivered
(Cohort 1)
n = 626
Women Currently Pregnant (Cohort 2)
n = 2574
p-Value +First
Trimester
n = 504
Second
Trimester
n = 1032
Third Trimester
n = 1038
p-Value /
Age at recruitment (mean, SD), years33.2 (4.5)32.2 (4.3)<0.000132.2 (4.3)32.3 (4.4)32.1 (4.2)0.7320
Missing48 125
Gestational age at recruitment (SD), weeks38.9 (1.9)24.5 (9.7)<0.00019.8 (3.0)22.1 (4.0)34.1 (3.3)<0.0001
Missing
Prenatal care follow-up *
Family physician201 (32.8)906 (35.5)0.2179196 (39.4)385 (37.6)325 (31.6)0.0023
Obstetrician/Gynaecologist426 (69.6)1570 (61.5)0.0002275 (55.2)614 (59.9)681 (66.1)<0.0001
Midwife47 (7.7)308 (12.1)0.002065 (13.1)118 (11.5)125 (12.1)0.6847
Missing1421 678
Pre-pregnancy body mass index, kg/m2 0.9147
Mean (SD)25.1 (5.)25.0 (5.8)0.655624.9 (5.7)25.0 (5.8)25.1 (5.7)
Missing726 21212
Pregnancy body mass index, kg/m2 <0.0001
Mean (SD)30.1 (5.5)27.6 (5.9)<0.000125.5 (5.8)27.0 (5.7)29.2 (5.8)
Missing1458 132223
Education, years 0.7740
Mean (SD)17.4 (3.2)16.9 (4.5)0.004216.9 (4.7)17.0 (4.4)16.9 (4.5)
Missing3998 213245
Ethnicity-Caucasian/White540 (90.9)2242 (90.8)0.9377434 (90.8)901 (90.5)907 (91.2)0.8662
Missing32105 263643
Marital status–Living alone20 (3.4)52 (2.1)0.066110 (2.1)19 (1.9)23 (2.3)0.8139
Missing3086 212738
Annual household income, CAN$ 0.2549 0.3405
<30,00027 (4.8)69 (2.9) 4 (0.8)36 (3.8)29 (3.1)
30,001–60,00049 (8.7)239 (10.1) 54 (11.5)91 (9.5)94 (9.9)
60,001–90,00083 (14.7)374 (15.8) 78 (16.6)150 (15.7)146 (15.4)
90,001–120,000143 (25.4)606 (25.5) 126 (26.7)250 (26.2)230 (24.3)
120,001–150,000101 (17.9)429 (18.1) 81 (17.2)175 (18.3)173 (18.3)
150,001–180,00065 (11.5)299 (12.6) 56 (11.9)117 (12.3)126 (13.3)
>180,00096 (17.0)356 (15.0) 72 (15.3)136 (14.2)148 (15.7)
Missing62202 337792
Area of residence 0.2757 0.9796
Urban268 (45.0)1065 (42.9) 208 (43.1)432 (43.2)425 (42.6)
Suburban260 (43.6)1073 (43.3) 212 (43.9)431 (43.1)430 (43.1)
Rural68 (11.4)343 (13.8) 63 (13.0)138 (13.7)142 (14.3)
Missing3093 213141
Recruitment period - <0.0001
1st COVID wave---341 (67.7)714 (69.2)771 (74.3)
2nd COVID wave---67 (13.3)95 (9.2)54 (5.2)
3rd COVID wave---96 (19.0)223 (21.6)213 (20.5)
These are numbers (column percentages) unless stated otherwise. SD: standard deviation; CAN$: Canadian dollars currency; Cohort 1: women who delivered between 13 March and today at the time of recruitment; Cohort 2: women who were pregnant at the time of recruitment; + for comparison between cohort 1 and cohort 2; / for comparison between the three trimesters of pregnancy with 1st trimester as a reference; * women can select multiple options; - 1st wave: recruitment between June and August 2020, 2nd wave: recruitment from September 2020 to March 2021; 3rd wave: recruitment from April 2021 to August 2021.
Table 2. Determinants of severe maternal depressive symptoms (EPDS > 13) during pregnancy after the start of the COVID-19 pandemic; univariate and multivariate logistic regression models.
VariableNo Depression
n = 1693 (%)
Severe Depression +
n = 511 (%)
Unadjusted
OR (95%CI)
Adjusted
OR * (95%CI)
Recruitment trimester of pregnancy
1st trimester316 (18.7)80 (15.7)ReferenceReference
2nd trimester713 (42.1)201 (39.3)1.11 (0.83; 1.49)1.29 (0.85; 1.95)
3rd trimester664 (39.2)230 (45.0)1.37 (1.03; 1.82)1.48 (0.97; 2.27)
Maternal anxiety /, mean (SD)3.1 (2.7)8.7 (4.3)1.63 (1.55; 1.71)1.51 (1.44; 1.59)
Maternal stress -, mean (SD)4.1 (1.9)6.2 (1.7)1.86 (1.74; 2.00)1.35 (1.24; 1.48)
Maternal age at recruitment, years32.3 (4.2)32.4 (4.2)1.00 (0.98; 1.03)1.00 (0.97; 1.04)
Education, years17.2 (4.3)16.4 (5.0)0.96 (0.94; 0.98)1.00 (0.97; 1.03)
Ethnicity/Race
Caucasian1552 (91.7)464 (90.8)ReferenceReference
Others141 (8.3)47 (9.2)1.12 (0.79; 1.58)0.86 (0.51; 1.45)
Annual household income, CAD
<30,00033 (1.9)24 (4.7)ReferenceReference
30,001–60,000147 (8.7)71 (13.9)0.66 (0.37; 1.21)0.57 (0.23; 1.37)
60,001–90,000267 (15.8)75 (14.7)0.39 (0.22; 0.69)0.38 (0.16; 0.92)
90,001–120,000416 (24.6)138 (27.0)0.46 (0.26; 0.80)0.47 (0.20; 1.10)
120,001–150,000311 (18.4)89 (17.4)0.39 (0.22; 0.70)0.43 (0.18; 1.03)
150,001–180,000232 (13.7)61 (11.9)0.36 (0.20; 0.66)0.43 (0.17; 1.07)
>180,000287 (16.9)53 (10.4)0.25 (0.14; 0.46)0.26 (0.10; 0.66)
Area of residence
Urban735 (43.4)207 (40.5)ReferenceReference
Suburban733 (43.3)223 (43.6)1.08 (0.87; 1.34)0.89 (0.65; 1.22)
Rural225 (13.3)81 (15.9)1.28 (0.95; 1.72)1.64 (1.08; 2.49)
Current number of children
0881 (52.0)232 (45.4)ReferenceReference
1583 (34.4)209 (40.9)0.74 (0.59; 0.91)0.76 (0.55; 1.05)
≥2229 (13.6)70 (13.7)0.85 (0.63; 1.16)0.98 (0.63; 1.53)
Marital status–Living alone
No1663 (98.2)497 (97.3)ReferenceReference
Yes30 (1.8)14 (2.7)1.56 (0.82; 2.97)1.77 (0.67; 4.72)
Pre-pregnancy body mass index, mean (SD) 24.9 (5.7)25.8 (6.0)1.03 (1.01; 1.04)1.01 (0.99; 1.04)
Coffee intake
No588 (34.7)162 (31.7)ReferenceReference
Yes1105 (65.3)349 (68.3)1.15 (0.93; 1.42)1.24 (0.92; 1.67)
Smoking
No1667 (98.5)495 (96.9)ReferenceReference
Yes26 (1.5)16 (3.1)2.07 (1.10; 3.89)0.96 (0.31; 2.94)
Alcohol
No1626 (96.0)491 (96.1)ReferenceReference
Yes67 (4.0)20 (3.9)0.99 (0.59; 1.65)0.62 (0.28; 1.39)
Cannabis use
No1681 (99.3)501 (98.0)ReferenceReference
Yes12 (0.7)10 (2.0)2.80 (1.20; 6.51)0.75 (0.14; 3.93)
Physical activity
No change509 (30.1)119 (23.3)ReferenceReference
Start/Increase298 (17.6)66 (12.9)0.95 (0.68; 1.32)0.99 (0.63; 1.57)
Stop/Decrease886 (52.3)326 (63.8)1.57 (1.24; 1.99)1.21 (0.87; 1.70)
Multivitamin use during pregnancy
No194 (11.5)67 (13.1)ReferenceReference
Yes1499 (88.5)444 (86.9)0.86 (0.64; 1.16)1.03 (0.67; 1.59)
Asthma
No1522 (89.9)445 (87.1)ReferenceReference
Yes171 (10.1)66 (12.9)1.32 (0.98; 1.79)0.84 (0.54; 1.32)
Diabetes
No1616 (95.5)475 (92.9)ReferenceReference
Yes77 (4.5)36 (7.1)1.59 (1.06; 2.40)0.93 (0.51; 1.72)
Hypertension
No1651 (97.5)484 (94.7)ReferenceReference
Yes42 (2.5)27 (5.3)2.19 (1.34; 3.59)1.32 (0.65; 2.68)
Nausea
No1351 (79.8)378 (74.0)ReferenceReference
Yes342 (20.2)133 (26.0)1.39 (1.10; 1.75)1.27 (0.92; 1.77)
Thyroid disease
No1477 (87.2)454 (88.8)ReferenceReference
Yes216 (12.8)57 (11.2)0.86 (0.63; 1.17)0.64 (0.42; 1.00)
Anemia
No1530 (90.4)437 (85.5)ReferenceReference
Yes163 (9.6)74 (14.5)1.59 (1.18; 2.14)1.47 (0.97; 2.23)
Concerns about reduced access to preferred medications
Not at all concerned951 (56.2)195 (38.2)ReferenceReference
A little concerned368 (21.7)131 (25.6)1.74 (1.35; 2.23)1.33 (0.93; 1.91)
Moderately/Very concerned374 (22.1)185 (36.2)2.41 (1.91; 3.05)1.31 (0.92; 1.87)
Concerns about unavailability of primary health care provider for hospital birth
Not at all concerned137 (8.1)24 (4.7)ReferenceReference
A little concerned324 (19.1)61 (11.9)1.08 (0.64; 1.80)1.15 (0.56; 2.36)
Moderately/Very concerned1232 (72.8)426 (83.4)1.97 (1.26; 3.09)0.99 (0.51; 1.94)
Concerns about a possible separation from baby after delivery
Not at all concerned238 (14.1)35 (6.9)ReferenceReference
A little concerned326 (19.2)64 (12.5)1.34 (0.86; 2.08)0.62 (0.32; 1.18)
Moderately/Very concerned1129 (66.7)412 (80.6)2.48 (1.71; 3.60)0.70 (0.36; 1.35)
Concerns about a shorter stay in hospital after delivery
Not at all concerned639 (37.7)131 (25.6)ReferenceReference
A little concerned430 (25.4)102 (20.0)1.16 (0.87; 1.54)0.97 (0.64; 1.45)
Moderately/Very concerned624 (36.9)278 (54.4)2.17 (1.72; 2.75)0.98 (0.67; 1.43)
Concerns about adequate opportunity for skin-to skin contact with newborn
Not at all concerned336 (19.9)47 (9.2)ReferenceReference
A little concerned385 (22.7)93 (18.2)1.73 (1.18; 2.53)1.75 (0.94; 3.27)
Moderately/Very concerned972 (57.4)371 (72.6)2.73 (1.97; 3.79)1.45 (0.75; 2.80)
Concerns about insufficient opportunity to initiate breastfeeding
Not at all concerned444 (26.2)82 (16.1)ReferenceReference
A little concerned357 (21.1)82 (16.1)1.24 (0.89; 1.74)0.79 (0.46; 1.35)
Moderately/Very concerned892 (52.7)347 (67.8)2.11 (1.61; 2.75)0.79 (0.47; 1.33)
Concerns about no visit from family and friends after delivery
Not at all concerned356 (21.0)74 (14.5)ReferenceReference
A little concerned348 (20.6)81 (15.8)1.12 (0.79; 1.59)0.88 (0.54; 1.43)
Moderately/Very concerned989 (58.4)356 (69.7)1.73 (1.31; 2.29)0.95 (0.63; 1.43)
Concerns about reduction of optimal postnatal care
Not at all concerned339 (20.0)38 (7.4)ReferenceReference
A little concerned421 (24.9)77 (15.1)1.63 (1.08; 2.47)1.25 (0.71; 2.20)
Moderately/Very concerned933 (55.1)396 (77.5)3.79 (2.65; 5.40)1.49 (0.86; 2.58)
Concerns about less access to lactation support after discharge from hospital
Not at all concerned497 (29.4)83 (16.2)ReferenceReference
A little concerned424 (25.0)94 (18.4)1.33 (0.96; 1.83)1.33 (0.83; 2.12)
Moderately/Very concerned772 (45.6)334 (65.4)2.59 (1.99; 3.38)1.56 (0.98; 2.46)
Concerns about birth complications due to contracting COVID-19
Not at all concerned242 (14.3)34 (6.7)ReferenceReference
A little concerned500 (29.5)86 (16.8)1.22 (0.80; 1.87)0.83 (0.43; 1.62)
Moderately/Very concerned951 (56.2)391 (76.5)2.93 (2.01; 4.27)0.66 (0.33; 1.29)
Concerns about possible exposure to COVID-19 during pregnancy
Not at all concerned121 (7.1)13 (2.5)ReferenceReference
A little concerned469 (27.7)64 (12.5)1.27 (0.68; 2.38)0.59 (0.23; 1.49)
Moderately/Very concerned1103 (65.2)434 (85.0)3.66 (2.04; 6.56)0.67 (0.26; 1.74)
Concerns about possible exposure to COVID-19 during labour/delivery or shortly thereafter
Not at all concerned164 (9.7)17 (3.3)ReferenceReference
A little concerned505 (29.8)69 (13.5)1.32 (0.75; 2.31)0.74 (0.29; 1.87)
Moderately/Very concerned1024 (60.5)425 (83.2)4.00 (2.40; 6.68)0.93 (0.35; 2.46)
Concerns about baby being infected with COVID-19 after birth
Not at all concerned91 (5.4)6 (1.2)ReferenceReference
A little concerned379 (22.4)62 (12.1)2.48 (1.04; 5.91)2.45 (0.67; 8.96)
Moderately/Very concerned1223 (72.2)443 (86.7)5.49 (2.39; 12.64)1.61 (0.44; 5.98)
Concerns about being infected with COVID-19 and unable to care for newborn
Not at all concerned156 (9.2)14 (2.7)ReferenceReference
A little concerned427 (25.2)61 (11.9)1.59 (0.87; 2.93)1.72 (0.65; 4.51)
Moderately/Very concerned1110 (65.6)436 (85.3)4.38 (2.51; 7.65)2.12 (0.78; 5.79)
Work from home
No1036 (61.2)313 (61.2)ReferenceReference
Yes657 (38.8)198 (38.8)1.00 (0.81; 1.22)0.98 (0.73; 1.32)
Loss of job
No1580 (93.3)444 (86.9)ReferenceReference
Yes113 (6.7)67 (13.1)2.11 (1.53; 2.91)1.30 (0.80; 2.11)
Decreased take-home pay due to the COVID-19 pandemic
No1335 (78.9)379 (74.2)ReferenceReference
Yes358 (21.1)132 (25.8)1.30 (1.03; 1.63)1.15 (0.83; 1.60)
Change in daily routine
No change52 (3.1)12 (2.4)ReferenceReference
Mild259 (15.3)43 (8.4)0.72 (0.36; 1.46)0.55 (0.21; 1.43)
Moderate/severe1382 (81.6)456 (89.2)1.43 (0.76; 2.70)0.57 (0.23; 1.40)
Change in medical health care access
No change640 (37.8)125 (24.4)ReferenceReference
Mild855 (50.5)262 (51.3)1.57 (1.24; 1.99)1.12 (0.81; 1.54)
Moderate/severe198 (11.7)124 (24.3)3.21 (2.39; 4.31)1.32 (0.87; 2.01)
Change in access to family, extended family and non-family social support
No change71 (4.2)14 (2.7)ReferenceReference
Mild781 (46.1)119 (23.3)0.77 (0.42; 1.42)1.13 (0.45; 2.82)
Moderate/severe841 (49.7)378 (74.0)2.28 (1.27; 4.10)1.68 (0.68; 4.14)
Recruitment time (month and year)---1.04 (1.01; 1.07)
n = 2204 because of missing values on maternal depression, anxiety and stress (n = 370); SD: standard deviation; CAN$: Canadian dollars currency; + severe depression: EDPS ≥ 13; / Using Generalized Anxiety Disorder; - Using Overall maternal stress related to COVID-19 scale from 0 (no stress) to 10 (extreme stress). * adjusted for all variables in the table and time. All bold numbers have a significant difference (p < 0.05).
Publisher’s Note: MDPI stays neutral with regard to jurisdictional claims in published maps and institutional affiliations.

