Article

Identification of Candidate lncRNA and Pseudogene Biomarkers Associated with Carbon-Nanotube-Induced Malignant Transformation of Lung Cells and Prediction of Potential Preventive Drugs

1
College of Textile and Clothing Engineering, Soochow University, Suzhou 215123, China
2
Shanghai Jing Rui Yang Industrial Co., Ltd., Shanghai 200122, China
3
Shanghai Institute of Spacecraft Equipment, Shanghai 200240, China
*
Author to whom correspondence should be addressed.
Int. J. Environ. Res. Public Health 2022, 19(5), 2936; https://doi.org/10.3390/ijerph19052936
Submission received: 21 January 2022 / Revised: 24 February 2022 / Accepted: 28 February 2022 / Published: 2 March 2022

Abstract

:
Mounting evidence has linked carbon nanotube (CNT) exposure with malignant transformation of lungs. Long non-coding RNAs (lncRNAs) and pseudogenes are important regulators to mediate the pathogenesis of diseases, representing potential biomarkers for surveillance of lung carcinogenesis in workers exposed to CNTs and possible targets to develop preventive strategies. The aim of this study was to screen crucial lncRNAs and pseudogenes and predict preventive drugs. GSE41178 (small airway epithelial cells exposed to single- or multi-walled CNTs or dispersant control) and GSE56104 (lung epithelial cells exposed to single-walled CNTs or dispersant control) datasets were downloaded from the Gene Expression Omnibus database. Weighted correlation network analysis was performed for these two datasets, and the turquoise module was preserved and associated with CNT-induced malignant phenotypes. In total, 24 lncRNAs and 112 pseudogenes in this module were identified as differentially expressed in CNT-exposed cells compared with controls. Four lncRNAs (MEG3, ARHGAP5-AS1, LINC00174 and PVT1) and five pseudogenes (MT1JP, MT1L, RPL23AP64, ZNF826P and TMEM198B) were predicted to function by competing endogenous RNA (MEG3/RPL23AP64-hsa-miR-942-5p-CPEB2/PHF21A/BAMBI; ZNF826P-hsa-miR-23a-3p-SYNGAP1, TMEM198B-hsa-miR-15b-5p-SYNGAP1/CLU; PVT1-hsa-miR-423-5p-PSME3) or co-expression (MEG3/MT1L/ZNF826P/MT1JP-ATM; ARHGAP5-AS1-TMED10, LINC00174-NEDD4L, ARHGAP5-AS1/PVT1-NIP7; MT1L/MT1JP-SYNGAP1; MT1L/MT1JP-CLU) mechanisms. The expression levels and prognosis of all genes in the above interaction pairs were validated using lung cancer patient samples. The receiver operating characteristic curve analysis showed the combination of four lncRNAs, five pseudogenes or lncRNAs + pseudogenes were all effective for predicting lung cancer (accuracy >0.8). The comparative toxicogenomics database suggested schizandrin A, folic acid, zinc or gamma-linolenic acid may be preventive drugs by reversing the expression levels of lncRNAs or pseudogenes. In conclusion, this study highlights lncRNAs and pseudogenes as candidate diagnostic biomarkers and drug targets for CNT-induced lung cancer.

1. Introduction

Carbon nanotubes (CNTs), which are structurally composed of nano-sized hollow molecular cylinders rolled up from single (single-walled CNTs, SWCNTs) or multiple layers (multi-walled CNTs, MWCNTs) of graphene sheets, have become widely utilized in industrial and biomedical fields due to their unique properties [1,2,3,4,5]. However, their wide range of applications and mass production may lead to a concern that these CNTs can potentially enter the human body (especially for occupational workers) and cause adverse health consequences. Therefore, toxicity issues regarding CNTs have recently been the subject of much attention.
Inhalation is the primary route of human exposure to environmental pollutants, and the lungs are the major target organ for airborne exposure. Thus, inhalation of CNTs may result in an elevated risk for lung diseases, such as fatal lung cancer [6]. This theory has been observed in several in vitro and in vivo studies. Wang et al. found significant increases in the proliferation, migration and invasion abilities of human lung epithelial BEAS-2B cells and small airway epithelial cells (SAECs) exposed to SWCNTs and MWCNTs for 24 weeks [7,8]. Luanpitpong et al. demonstrated that exposure to SWCNTs and MWCNTs induced the transformation of primary human lung fibroblasts into cancer-associated fibroblasts and promoted the growth of human lung carcinoma H460 cells in mice [9]. Suzui et al. administered MWCNTs to rats and found the incidence of lung tumors was 14/38 in the MWCNT group but 0/28 in the control group after a 109-week follow-up period [10]. A study by Saleh et al. showed that administration of MWCNTs into rat lungs significantly elevated the incidence of lung tumors (7/20 vs. 1/19) compared with the vehicle group [11]. These findings indicate the necessity of investigating the carcinogenic mechanisms of CNTs to develop surveillance and prevention strategies.
Recently, studies have assessed the molecular mechanisms of CNT-induced malignant transformation of lungs. Voronkova et al. identified that exposure of BEAS-2B cells to SWCNTs for six months induced cell transformation by increasing the expression level of SOX9 protein [12]. Polimeni et al. reported that incubation of BEAS-2B cells with MWCNTs for 96 h could induce cell epithelial–mesenchymal transition (EMT) by activation of the transforming growth factor (TGF)-β-mediated signaling pathway [13]. Wang et al. confirmed that SWCNT-induced upregulation of Slug contributed to EMT, migration, invasion and anchorage-independent growth of BEAS-2B cells and tumor formation, as well as metastasis in xenograft mouse models [14]. Furthermore, the microarray or sequencing method was used to explore the genome-wide expression changes in CNT-transformed BEAS-2B cells. Upregulation of MYC, PPARG [8], c-FLIP [15], caveolin-1 [16], Ras family genes [17], CXCL8 and ADCY1 [18] and downregulation of cyclin E [19], FLG, SCN9A and TNS4 [18] were identified. A 35-gene signature was screened from mice 56 days after exposure to MWCNTs, and this signature was proven to predict the development of lung cancer from controls at a high accuracy rate (>60%) [20]. These findings suggest that these genes may be underlying biomarkers for medical surveillance of the lung cancer risk in occupational CNT-exposed workers and potential targets for the development of preventive and therapeutic drugs. However, the mechanisms linking CNT exposure to lung cancer is not well understood. More importantly, the genome not only consists of coding messenger RNAs (mRNAs) but also includes non-coding RNAs (ncRNAs), such as microRNAs (miRNAs), long ncRNAs (lncRNAs) and pseudogenes [21]. LncRNAs and pseudogenes can act as upstream factors to modulate the expression levels of mRNAs by directly regulating their transcription (that is, co-expression mechanism) or by sponging miRNAs and then influencing miRNA-mediated gene silencing (that is, competing endogenous RNA (ceRNA) mechanism) [21], indicating lncRNAs and pseudogenes may also represent crucial biomarkers and targets for CNT-induced lung cancer, which had not been reported previously.
In this study, we aimed to screen hub lncRNAs and pseudogenes linked to CNT-induced malignant transformation of human lung epithelial cells based on construction of ceRNA and co-expression networks and validation of the expression levels and prognosis of network genes. The drugs that reversed the expression levels of these lncRNAs and pseudogenes were also predicted. Our findings may provide new insights into predicting and preventing lung diseases of occupational workers with CNT exposure.

2. Materials and Methods

2.1. Data Acquisition and Preprocessing

The mRNA expression profiles of lung cancer induced by bare, hydrophobic CNT particles that were not wrapped in biocompatible materials were retrieved from the National Center for Biotechnology Information (NCBI) Gene Expression Omnibus (GEO) database (http://www.ncbi.nlm.nih.gov/geo/, accessed on 5 September 2021) by searching with the following key words: [“carbon nanotubes” AND (“lung carcinogenesis” OR “lung transformation”)], after which only two microarray datasets (GSE41178 [8] and GSE56104 [15]) were obtained. In the GSE41178 dataset, which is based on the platform of NimbleGen Homo sapiens Expression Array [100718_HG18_opt_expr] (GPL16025), whole-genome expression profiling was conducted on human immortalized SAECs following chronic exposure to dispersed SWCNTs (CNI, Houston, TX, USA; dry mean length, 1–4 μm; dispersed mean length, 1.08 μm; dry mean width, 1–4 nm; dispersed mean width, 270 nm; surface area, 400–1040 m2/g; metal contamination, <1%), MWCNTs (MWNT-7, Mitsui & Company, Tokyo, Japan; dry mean length, 8.19 ± 1.7 μm; dispersed mean length, 5.1 μm; dry mean width, 81 ± 5 nm; dispersed mean width, 78 nm; surface area, 26 m2/g; metal contamination, 0.78% [8]; the number of walls, 20–50 walls [22]) and Survanta® dispersant (control) for six months (24 passages). A sub-toxic concentration (0.02 μg/cm2, equivalent to 0.1 μg/mL) was used for SWCNT and MWCNT exposure, which had been demonstrated to be either co-localize in the cytoplasm of cells or puncture the cellular or nuclear membranes and lead to increases in soft agar colony formation, proliferation, invasion, migration and angiogenesis of SAECs (malignant transformation phenotypes) [8]. Each treatment possessed three biological replicates. In the GSE56104 dataset, human immortalized BEAS-2B cells were exposed to Survanta® dispersant or SWCNTs (CNI, Houston, TX, USA) with the similar concentration and characteristics as the GSE41178 dataset for six months. The proliferative, invasive, migration and angiogenic activities were increased, whereas apoptosis was reduced in BEAS-2B cells treated with SWCNTs [7,15]. Then, three biological replicates were collected for each treatment to perform whole-genome expression profiling on the platform of NimbleGen Homo sapiens HG18 expression array [100718_HG18_opt_expr_HX12] SEQ_ID condensed version (GPL18451).
The expression matrix and gene-symbol annotation files of GSE41178 and GSE56104 datasets were downloaded from the GEO database. The gene type (belonging to lncRNAs, mRNAs or pseudogenes) was annotated according to the file retrieved from the NCBI Entrez Gene ftp site (ftp://ftp.ncbi.nlm.nih.gov/gene/DATA/; accessed on 5 September 2021).

2.2. Weighted Correlation Network Analysis of lncRNAs and Pseudogenes

The weighted correlation network analysis (WGCNA) package in R (v1.61; https://cran.r-project.org/web/packages/WGCNA/index.html; accessed on 7 September 2021) [23] was employed to screen crucial lncRNAs and pseudogenes associated with CNT-induced phenotypic traits. The data of all overlapped lncRNAs and pseudogenes between GSE41178 and GSE56104 datasets were used to build the co-expression network. GSE41178 was set as the training dataset, and GSE56104 was set as the testing dataset. The filtering principle of the optimal soft threshold power (β) was to make the network have the scale-free topology characteristics. The weighted adjacency matrix was transformed into a topological overlap matrix to construct a dendrogram. The dynamic tree cut method was applied to detect gene modules with a minModuleSize of 50 and a cut height of 0.995. The preservation of identified modules was analyzed using the modulePreservation function, with a Z summary score > 2–10 defined as moderately preserved. The module eigengenes (ME) were calculated to represent the overall expression level of each module. The correlation between ME and the disease status was investigated in each module. If the correlation coefficient, r, was >0.5 and the p-value was <0.05, modules were considered crucial. Furthermore, the gene significance (GS) was measured to represent the correlation between the expression levels of genes in each module and each trait; module membership (MM) was measured to correlate the ME with gene expression values to determine the importance of a gene in a given module. LncRNAs and pseudogenes with |GS| > 0.5 and |MM| > 0.5 in crucial modules were considered hub genes.

2.3. Differential Analysis of lncRNAs, Pseudogenes and mRNAs in GSE41178 Dataset

The LIMMA (linear models for microarray data) package (v3.34.7; https://bioconductor.org/packages/release/bioc/html/limma.html; accessed on 10 September 2021) [24] was used to identify differentially expressed lncRNAs (DE-lncRNAs), pseudogenes (DE-pseudogenes) and mRNAs (DE-mRNAs) between SWCNT- or MWCNT-exposed and dispersant control-treated SAECs. The adjusted p-value < 0.05 and |log2fold change (FC)| > 0.5 were set as the cut-off point. The heatmaps of DE-lncRNAs, DE-pseudogenes and DE-mRNAs were plotted with R package “pheatmap” (v1.0.8; https://cran.r-project.org/web/packages/pheatmap; accessed on 10 September 2021). A Venn diagram (http://bioinformatics.psb.ugent.be/webtools/Venn/; accessed on 10 September 2021) was used to obtain the overlapped DE-lncRNAs, DE-pseudogenes and DE-mRNAs induced by SWCNTs and MWCNTs, as well as the overlapped DE-lncRNAs and DE-pseudogenes with hub genes in crucial modules identified by WGCNA analysis.

2.4. Validation of the Expression Levels and Prognosis of DE-lncRNAs and DE-Pseudogenes in Lung Cancer

To evaluate whether these hub DE-lncRNAs and DE-pseudogenes were associated with initiation of lung cancer, we validated their expression levels using Gene Expression Profiling Interactive Analysis (GEPIA, http://gepia.cancer-pku.cn; accessed on 12 September 2021), a newly developed interactive web server for analyzing the RNA sequencing expression data of 9736 tumors and 8587 normal samples from the Cancer Genome Atlas (TCGA) and the Genotype-Tissue Expression (GTEx) project [25]. Lung adenocarcinoma (LUAD) and squamous cell carcinoma (LUSC) samples were selected as the disease group; whereas match TCGA normal and GTEx data or match TCGA normal data were selected as the control group. |log2FC| > 0.5 and p-value < 0.05 were set as the cut-off point.
To evaluate whether these hub DE-lncRNAs and DE-pseudogenes were associated with prognostic outcomes of lung cancer patients, the Kaplan–Meier plotting (http://www.kmplot.com/analysis/index.php?p=background; accessed on 12 September 2021) [26] was performed. Kaplan–Meier plots allow for assessment of the effects of DE-lncRNAs and DE-pseudogenes (included in mRNA data) on survival using the GeneChip and RNA-seq data of GEO, the European Genome-Phenome Archive and TCGA databases. The overall survival (OS) and recurrence-free survival (RFS) was assessed by RNA-seq data analysis, whereas OS, first-progression survival (FPS) and post-progression survival (PPS) were assessed in GeneChip data analysis. Patients were divided into two groups by “auto-select best cut-off”. Hazard ratios (HRs) with 95% confidence intervals (CIs) and log-rank p-values were automatically calculated. A log-rank test p-value < 0.05 was considered statistically significant. HR < 1 indicated a better survival rate for the high-expression group; HR > 1 indicated a poor survival rate for the high-expression group.

2.5. Construction of lncRNA- and Pseudogene-Related ceRNA Networks

The DE-lncRNAs and DE-pseudogenes with validated expression and survival associations in lung cancer data were used to construct the ceRNA networks. The interactions between DE-lncRNAs/DE-pseudogenes and miRNAs were predicted using the starBase database (v2.0; http://starbase.sysu.edu.cn/; accessed on 26 September 2021) [27] with the cut-off point of Ago CLIP-seq Data ≥ 3. Then, miRNAs that interacted with lncRNAs/pseudogenes were used to predict their target mRNAs by the starBase database, with the cut-off point of predicting program ≥ 3 and CLIP data > 3. The final lncRNA/pseudogene–miRNA–mRNA interaction pairs were confirmed after comparing the predicted mRNAs and DE-mRNAs. Only DE-mRNAs that had expression trends similar to those of lncRNAs or pseudogenes were retained. The ceRNA network was visualized in Cytoscape (v3.6.1; www.cytoscape.org/; accessed on 26 September 2021).

2.6. Construction of lncRNA- and Pseudogene-mRNA Co-Expression Networks

The DE-lncRNAs and DE-pseudogenes with validated expression and survival associations in lung cancer data were used to construct the co-expression networks. The Pearson correlation coefficient (PCC) was calculated between DE-lncRNAs/DE-pseudogenes and DE-mRNAs. Meaningful correlation pairs were defined as PCC > 0.9 and p-value < 0.05. The co-expression network was visualized using Cytoscape.

2.7. Construction of Protein–Protein Interaction (PPI) Networks

To further screen hub DE-mRNAs from ceRNA and co-expression networks, we respectively imported DE-mRNAs of lncRNA- and pseudogene-related networks into the Search Tool for the Retrieval of Interacting Genes (STRING; v10.0; http://stringdb.org/; accessed on 26 September 2021) database [28] to obtain the PPI pairs. PPI pairs with a combined score > 0.4 were considered significant. Furthermore, seven topological characteristics of each protein in the PPI network were calculated using the CytoNCA plugin in Cytoscape software (http://apps.cytoscape.org/apps/cytonca; accessed on 26 September 2021) [29], including degree, betweenness, closeness, eigenvector, local average connectivity, information and subgragh centrality. The proteins ranked in the top 60 of each topological characteristic were suggested to be hub DE-mRNAs.

2.8. Validation of the Expression Levels and Survival Associations of DE-mRNAs in Lung Cancer

The mRNA expression levels of hub DE-mRNAs were confirmed using the GEPIA database as lncRNAs and pseudogenes. The protein expression levels of hub DE-mRNAs were validated using UALCAN (http://ualcan.path.uab.edu/index.html; accessed on 26 September 2021) (in which proteomic datasets of LUAD and normal controls from the Clinical Proteomic Tumor Analysis Consortium (CPTAC) were provided; p-value < 0.05 was set as the significant threshold value) and the Human Protein Atlas (HPA; v20.1, https://www.proteinatlas.org; accessed on 27 September 2021) (in which immunohistochemistry results for LUAD and LUSC tissues were available). The associations of hub DE-mRNAs with OS, RFS, FPS and PPS were analyzed using the Kaplan–Meier plotter based on the sequencing and chip data.

2.9. Validation of the Expression Levels and Survival Associations of miRNAs in Lung Cancer

The expression levels of miRNAs associated with hub DE-lncRNAs and DE-mRNAs were confirmed using the UALCAN database (http://ualcan.path.uab.edu/index.html; accessed on 6 October 2021) based on the TCGA data of LUAD and LUSC patient samples. Furthermore, Ventura et al. performed an miRNA expression profile analysis of A549 cells exposed to MWCNTs (MWCNT-7, Mitsui & Company, Ibaraki, Japan) and controls [30]. The differentially expressed miRNAs identified in the study of Ventura et al. were also compared with ours to confirm the expression levels of crucial miRNAs induced by CNTs. The associations of miRNAs with OS and RFS were identified using the Kaplan–Meier plotter based on the sequencing data.

2.10. Function Enrichment Analysis

To understand potential functions of mRNAs regulated by DE-lncRNAs and DE-pseudogenes, the online Database for Annotation, Visualization and Integrated Discovery (DAVID) (v6.8; http://david.abcc.ncifcrf.gov; accessed on 12 October 2021) [31] was searched, after which gene ontology (GO) biological process, molecular function terms and Kyoto Encyclopedia of Genes and Genomes (KEGG) pathways were obtained at a significance level of p-value < 0.05. The “Goplot” package in R was used to draw the chord plot for hub DE-mRNAs.

2.11. Diagnostic Analysis of Hub lncRNAs and Pseudogenes

The mRNA sequencing data of LUAD/LUSC patients and normal controls were downloaded from the TCGA database. The receiver operating characteristic (ROC) curve analysis was performed using the MedCalc program (v9.3; MedCalc, Mariakerke, Belgium) to assess the diagnostic value of hub lncRNAs and pseudogenes in distinguishing lung cancer from normal controls. The area under the ROC curve (AUC), sensitivity and specificity were calculated. The genes with AUC > 0.5 were considered to have diagnostic significance.

2.12. Prediction of Small-Molecule Drugs That Regulated Hub lncRNAs and Pseudogenes

To predict potential drugs that may prevent and treat CNT-induced lung cancer, the Comparative Toxicogenomics Database (CTD, http://ctdbase.org; accessed on 12 October 2021) [32] was searched to obtain the chemical interactions of hub lncRNAs and pseudogenes associated with CNT exposure. Only chemical drugs that reversed the expression levels of lncRNAs and pseudogenes and involved in cancer initiation and development were screened (that is, if the lncRNA was upregulated, we selected the drugs that decreased its expression levels). The lncRNA/pseudogene–chemical interaction network was visualized in Cytoscape.

3. Results

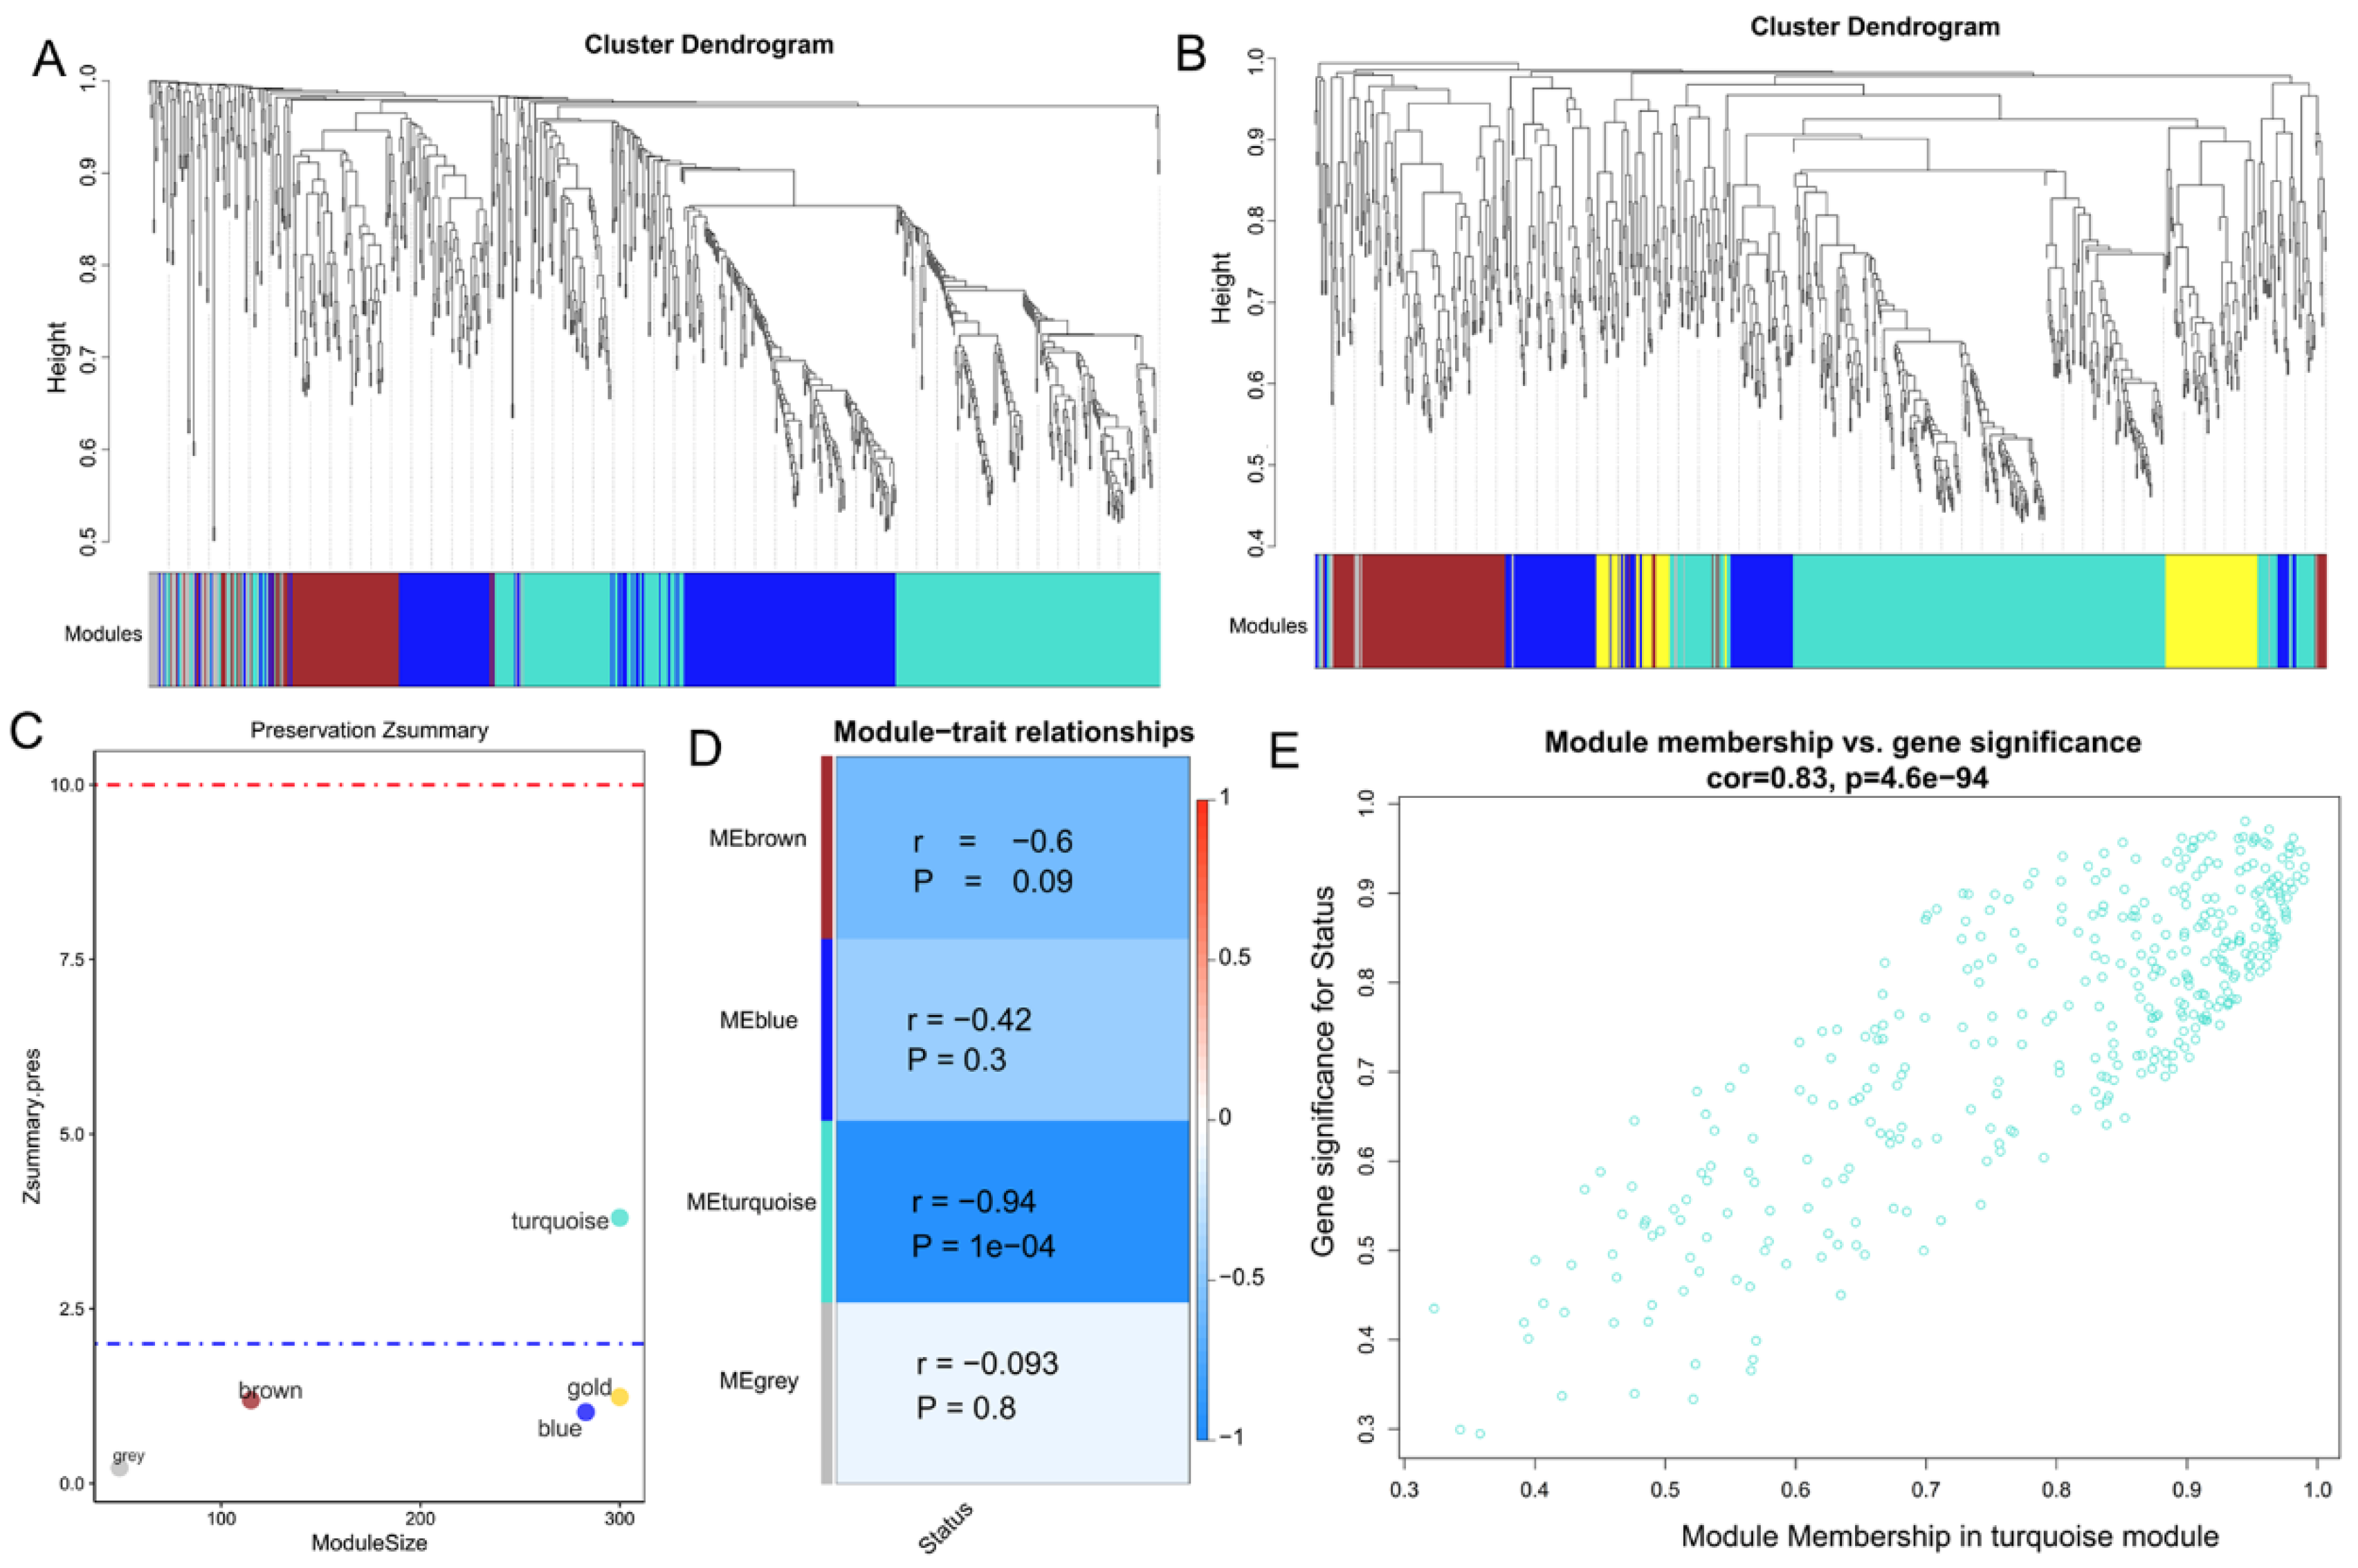
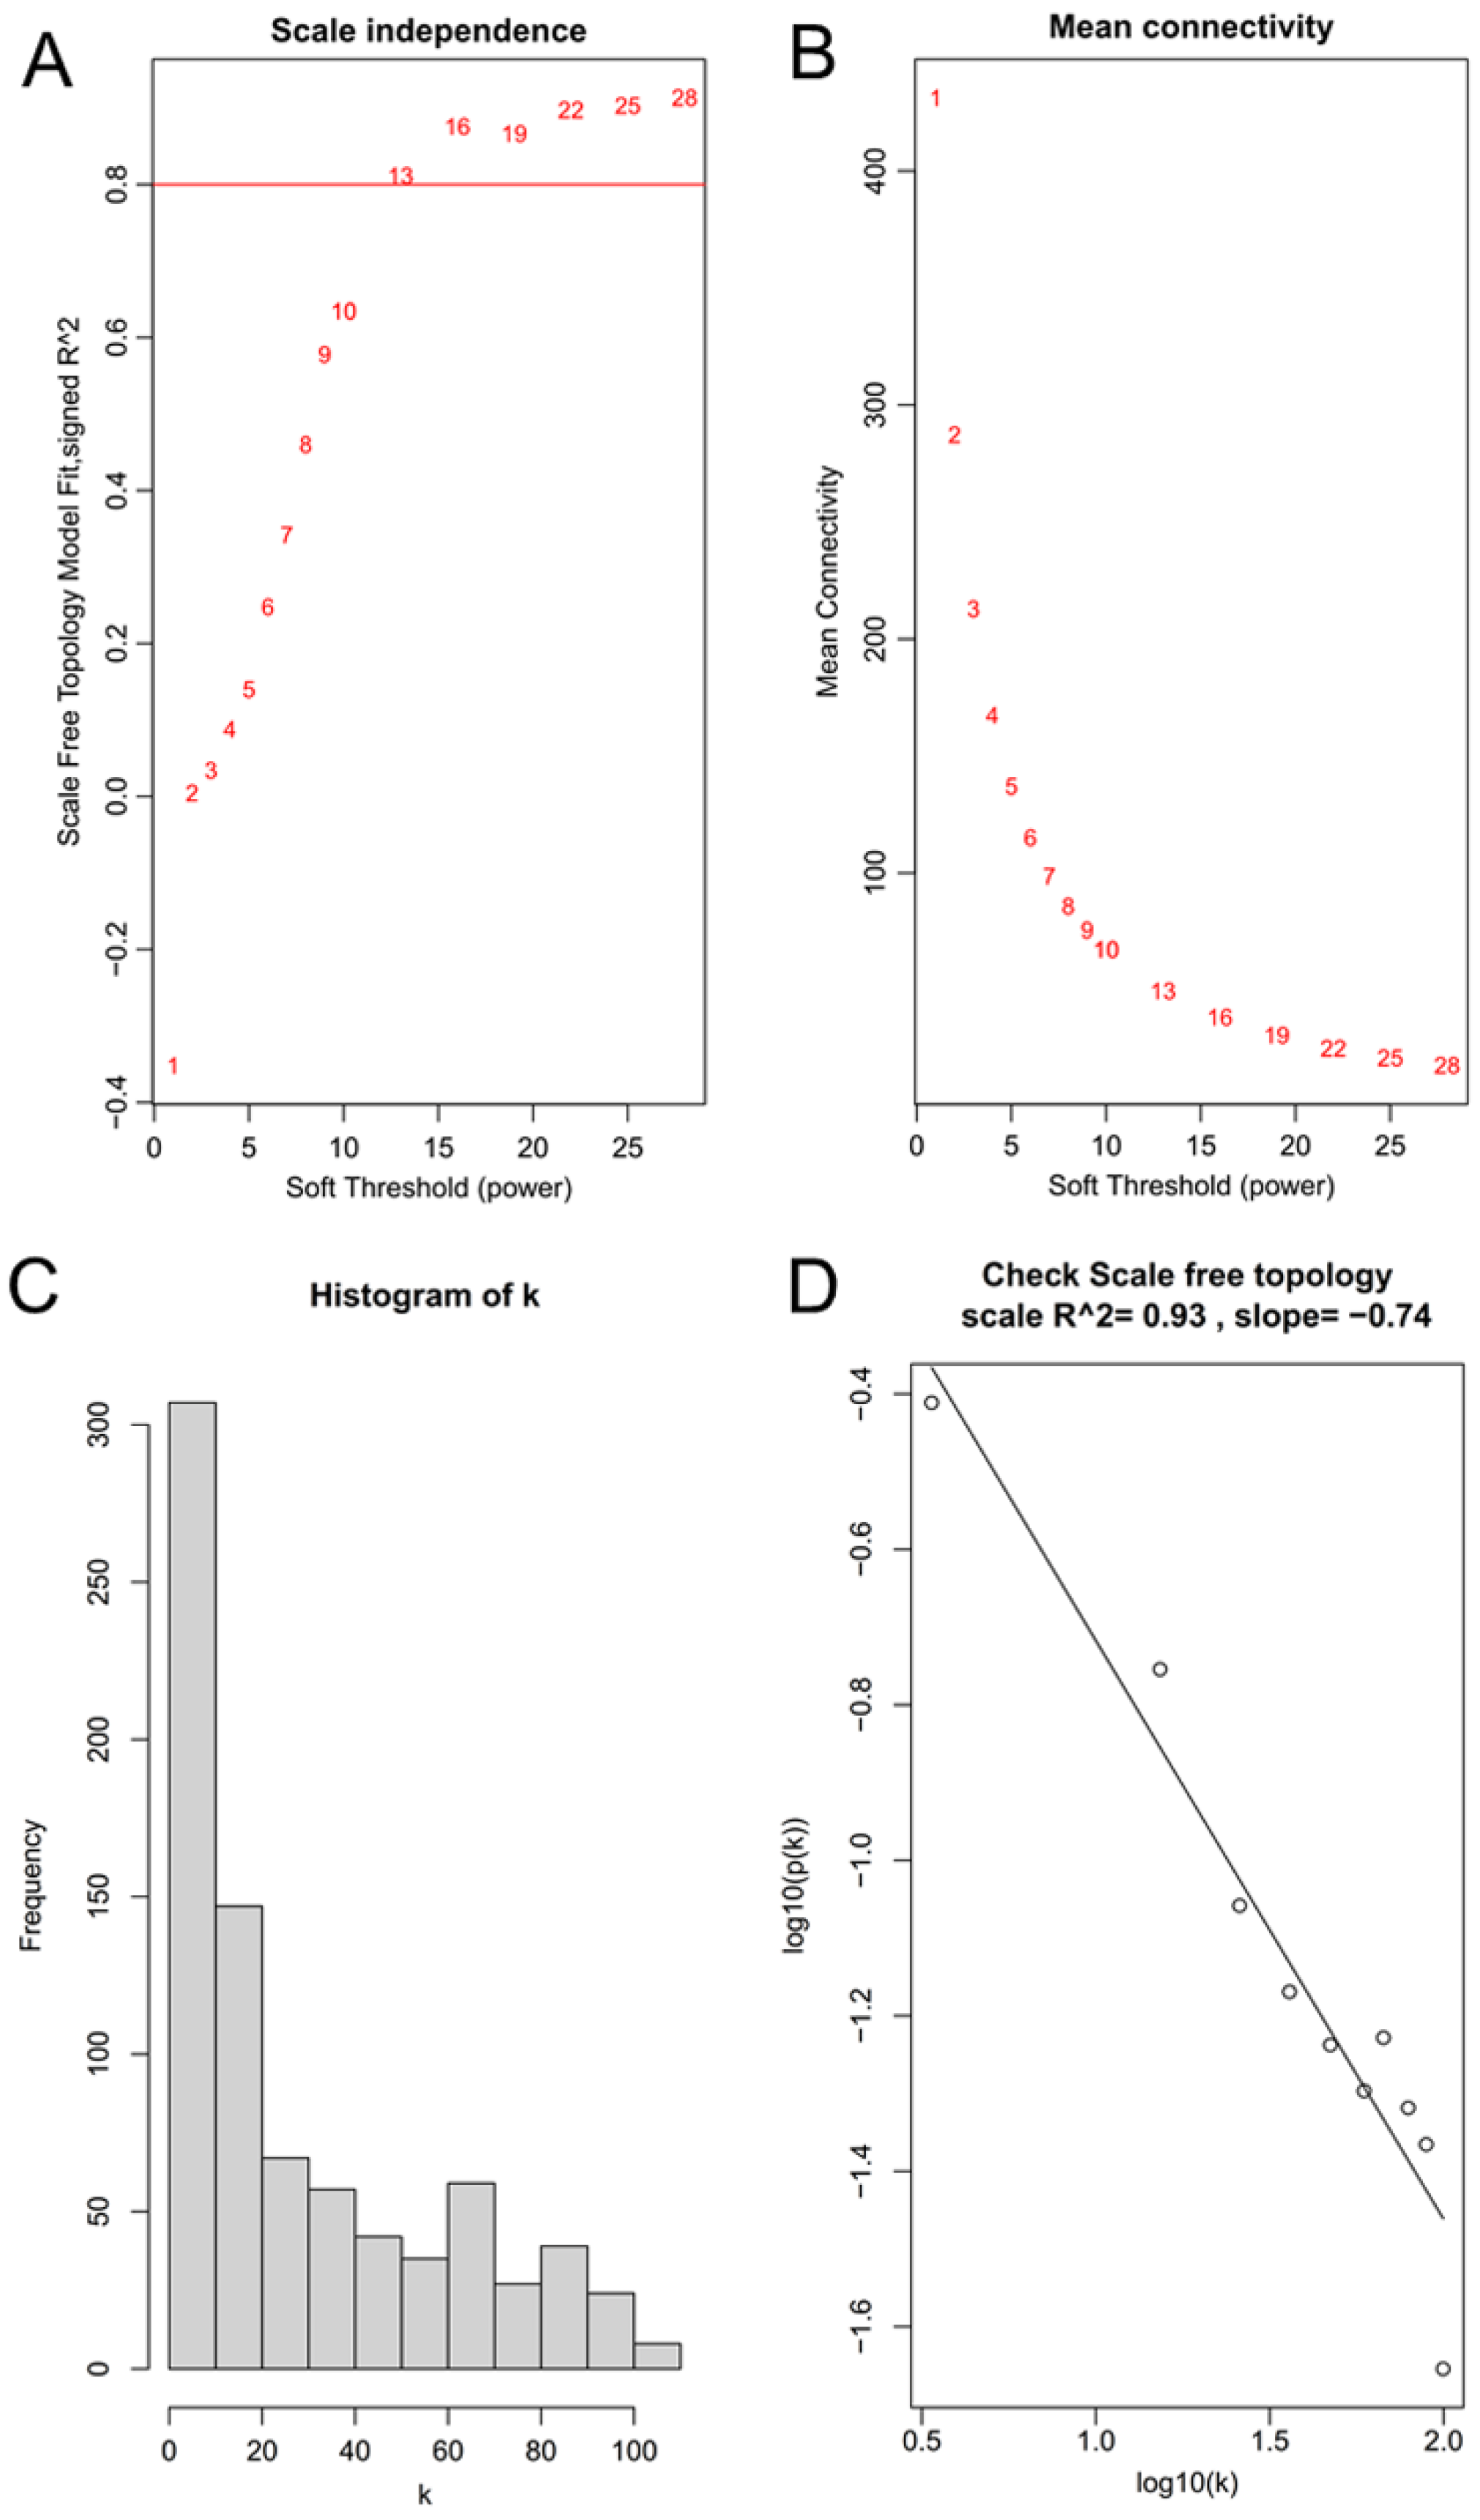
3.1. Identification of Key Modules Related to CNT-Induced Malignant Transformation of Lung Cells

After Entrez Gene annotation, the GSE41178 dataset was found to include 995 lncRNAs (726) and pseudogenes (269), whereas the GSE56104 dataset included 1051 lncRNAs (305) and pseudogenes (746). A total of 812 lncRNAs and pseudogenes were shared between the GSE41178 and GSE56104 datasets. Additionally, the expression levels (r = 0.87, p < 1 × 10200) and connectivity (r = 0.13, p = 2 × 10⁴ were significantly positively correlated between these two datasets. Thus, these shared 812 lncRNAs and pseudogenes were used for WGCNA analysis.
A β value of 13 was selected to satisfy the requirements of the scale-free network distribution (Figure 1A,B). By calculating the scale-free topology fitting index, the value of R square was confirmed to reach 0.93 (Figure 1C,D). After a dynamic tree cut analysis, four modules were discovered using the GSE41178 training dataset (Figure 2A). These modules were also generated after analysis with the GSE56104 testing dataset (Figure 2B). Among them, only the turquoise module was moderately preserved (Z summary score = 4.21; Figure 2C). The module–trait heatmap revealed that the eigengenes of the turquoise module were strongly correlated with disease status (r = −0.94, p = 1 × 10⁸; Figure 2D). The correlation between GS for disease status and MM in the turquoise module was also significant (r = 0.83, p = 4.61 × 1094; Figure 2E). These findings indicated that 66 lncRNAs and 299 pseudogenes in this module were highly correlated with CNT-induced malignant transformation of lung cells. Among them, 57 lncRNAs and 267 pseudogenes had |GS| > 0.5 and |MM| > 0.5. Thus, they were considered to be hub lncRNAs and pseudogenes and chosen for further analyses.

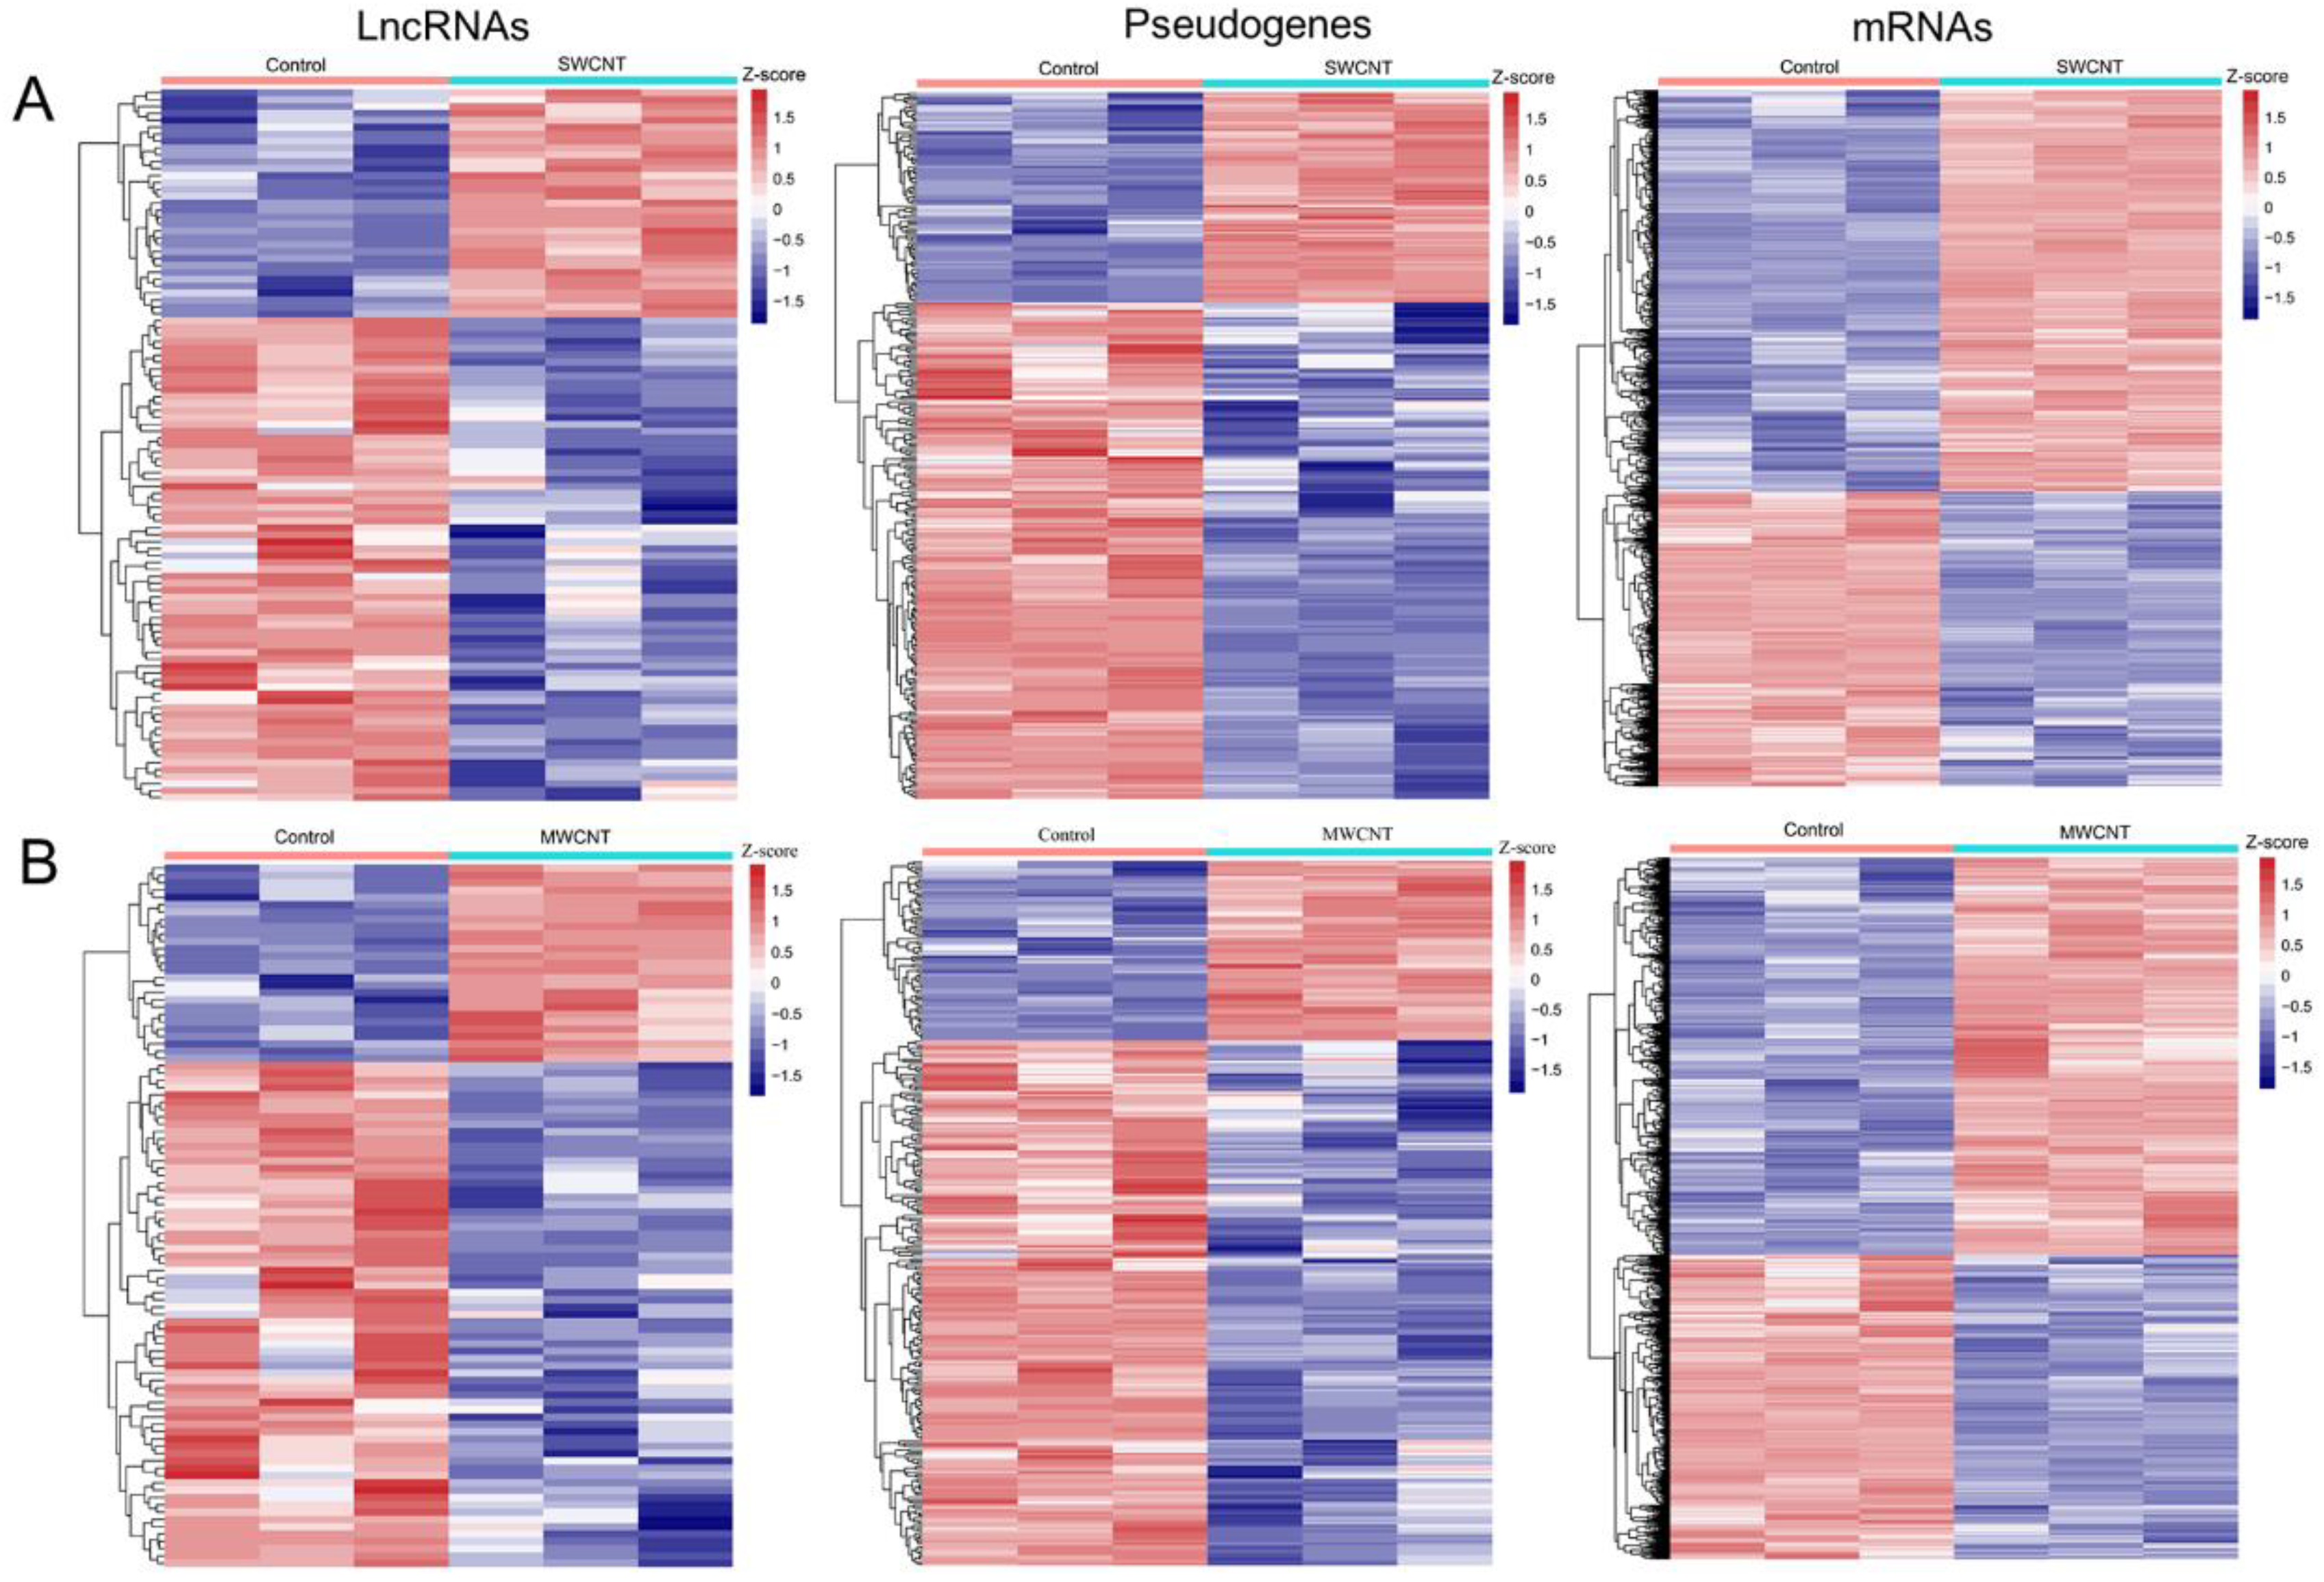
3.2. Identification of Differential Genes in CNT-Induced Malignant Transformation of Lung Cells

Using theLIMMA method, a total of 103 lncRNAs (33 upregulated, 70 downregulated), 289 pseudogenes (86 upregulated, 203 downregulated) and 5136 mRNAs (2961 upregulated, 2175 downregulated) were identified to be differentially expressed between SWCNT-exposed and control-treated SAECs. A total of 99 lncRNAs (27 upregulated, 72 downregulated), 276 pseudogenes (70 upregulated, 206 downregulated) and 4695 mRNAs (2659 upregulated, 2036 downregulated) were identified to be differentially expressed between MWCNT-exposed and control-treated SAECs. The heatmaps of DE-lncRNAs, DE-pseudogenes and DE-mRNAs are displayed in Figure 3. A Venn diagram showed that there were 63 DE-lncRNAs (15 upregulated, 48 downregulated), 203 DE-pseudogenes (47 upregulated, 156 downregulated) and 3348 DE-mRNAs (1976 upregulated, 1372 downregulated) shared between SWCNTs and MWCNTs (Figure S1A,B). Furthermore, we also compared these DE-lncRNAs and DE-pseudogenes with hub lncRNAs and pseudogenes identified in WGCNA analysis. The results showed that 24 lncRNAs and 112 pseudogenes were overlapped (Figure S1C). These findings suggest that these 24 DE-lncRNAs and 112 DE-pseudogenes may be particularly important lncRNAs and pseudogenes associated with CNT-induced malignant transformation of lung cells.

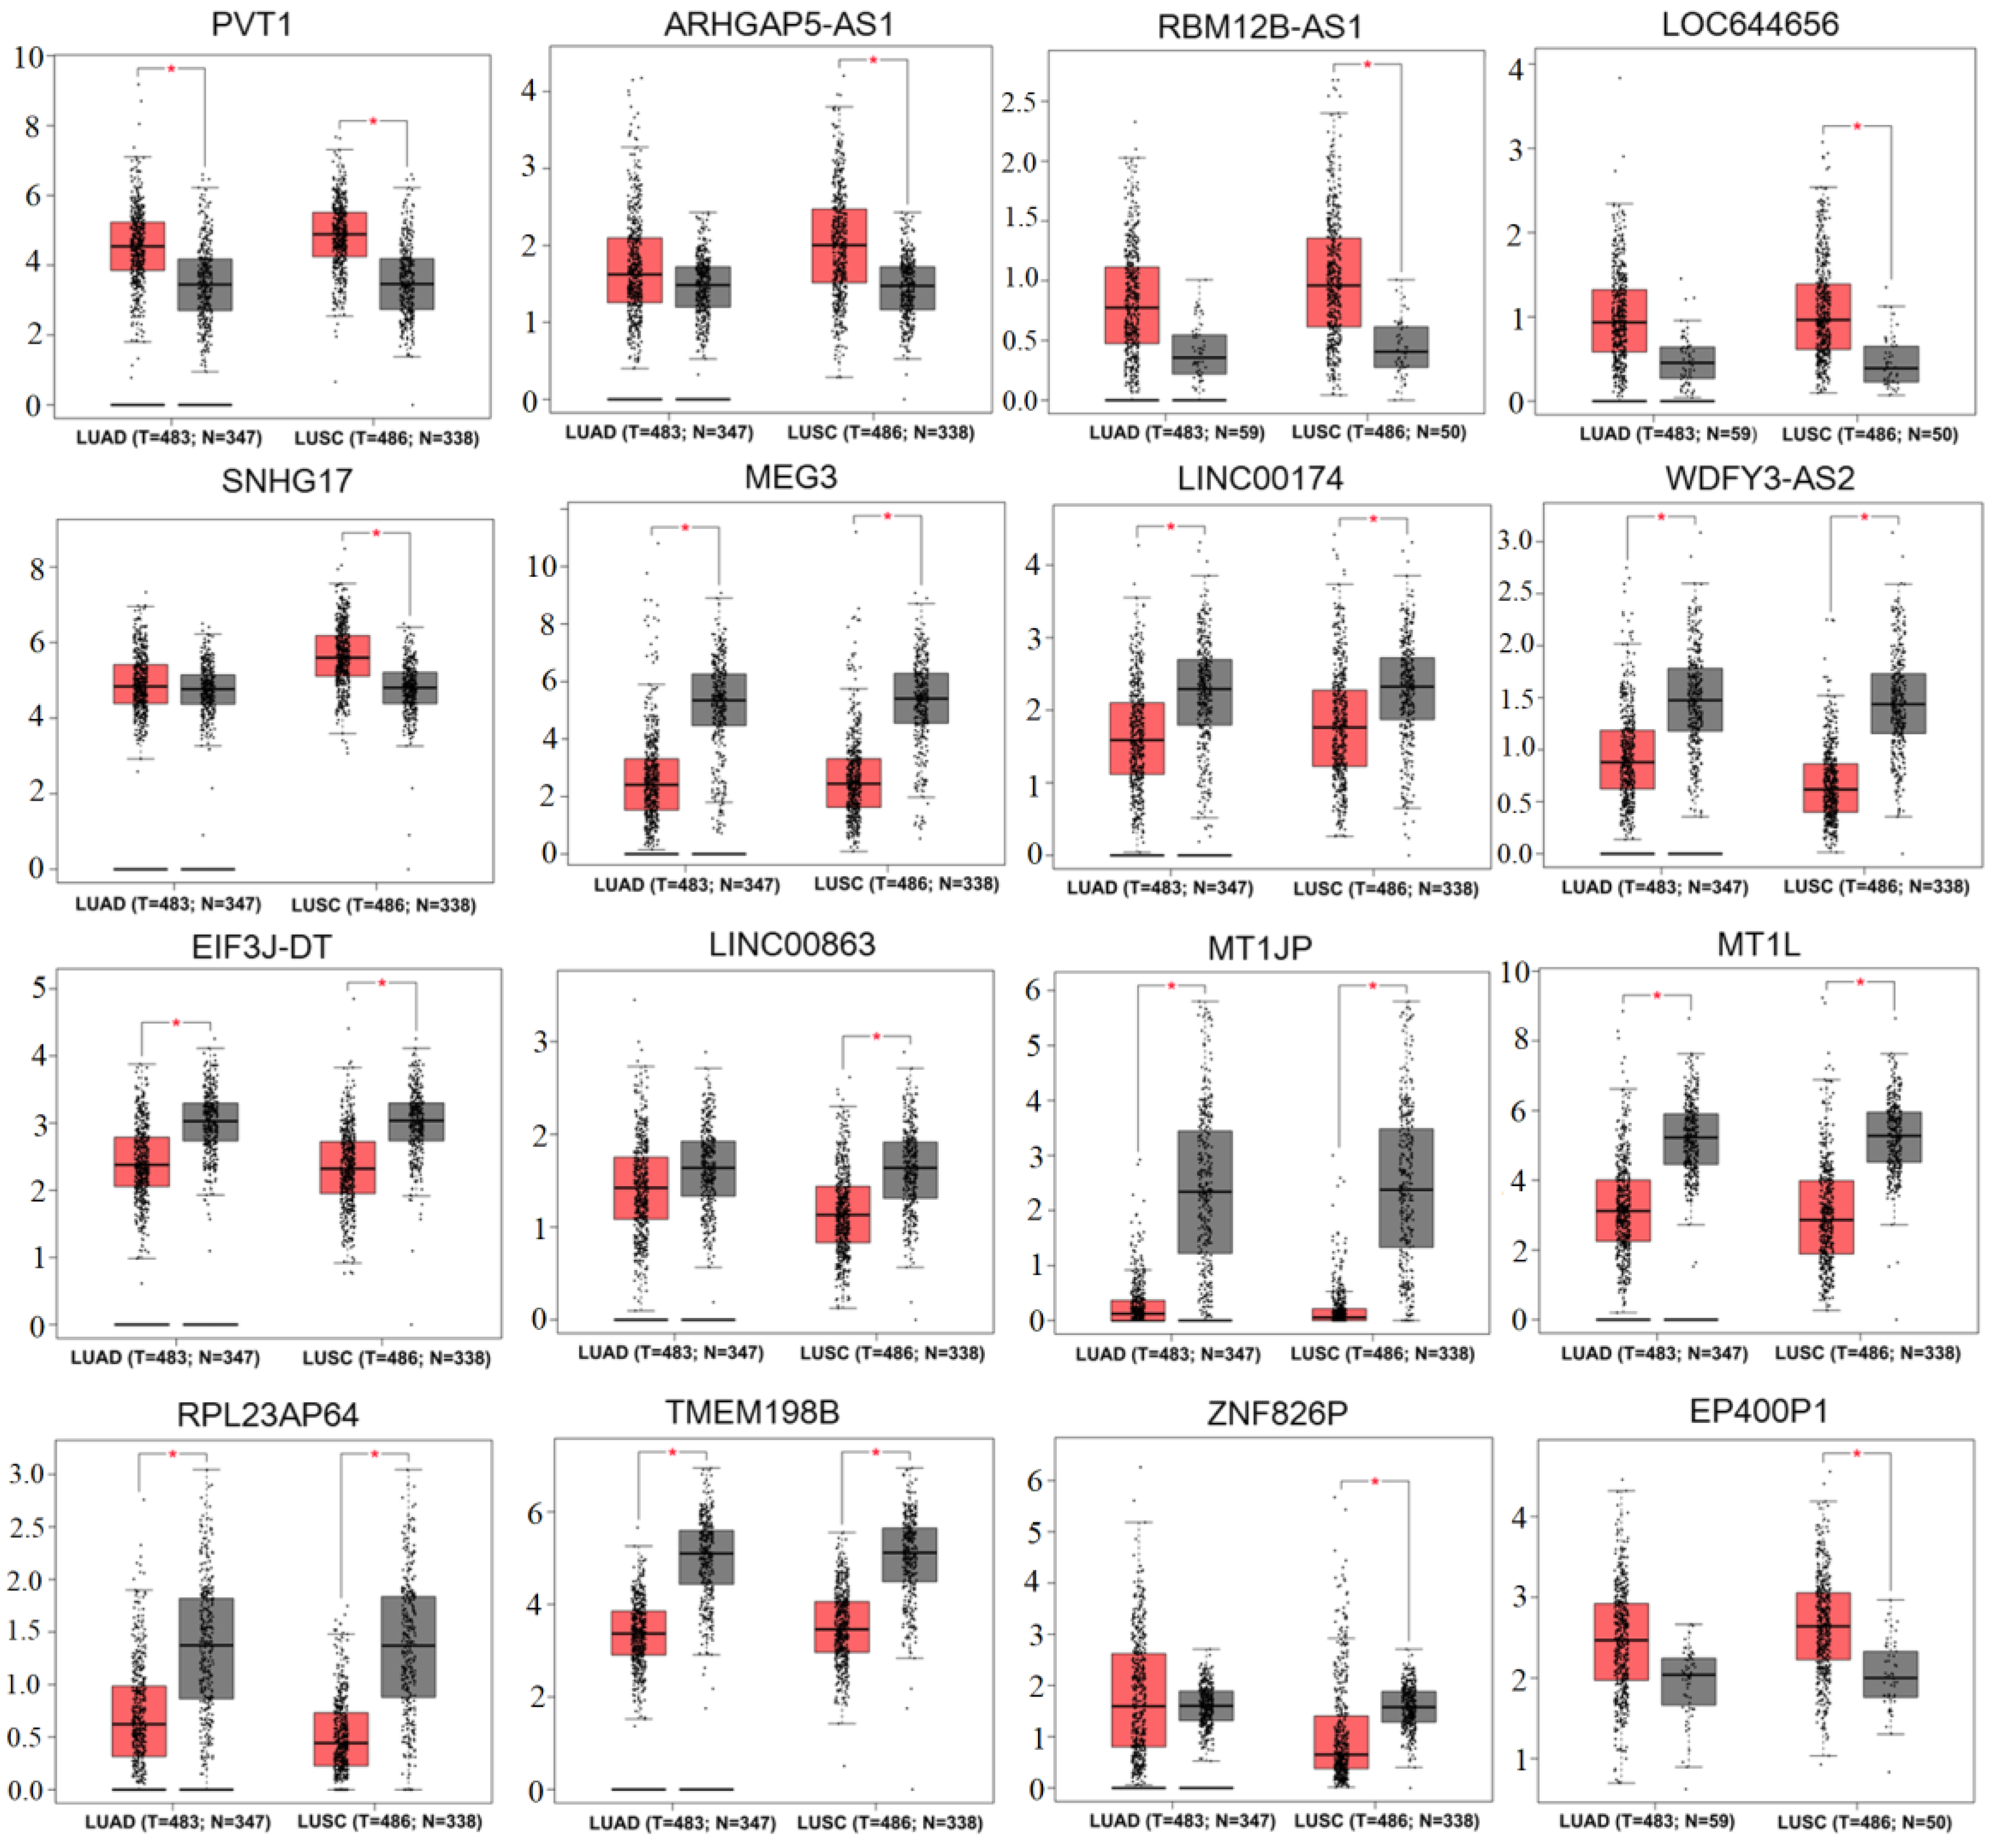
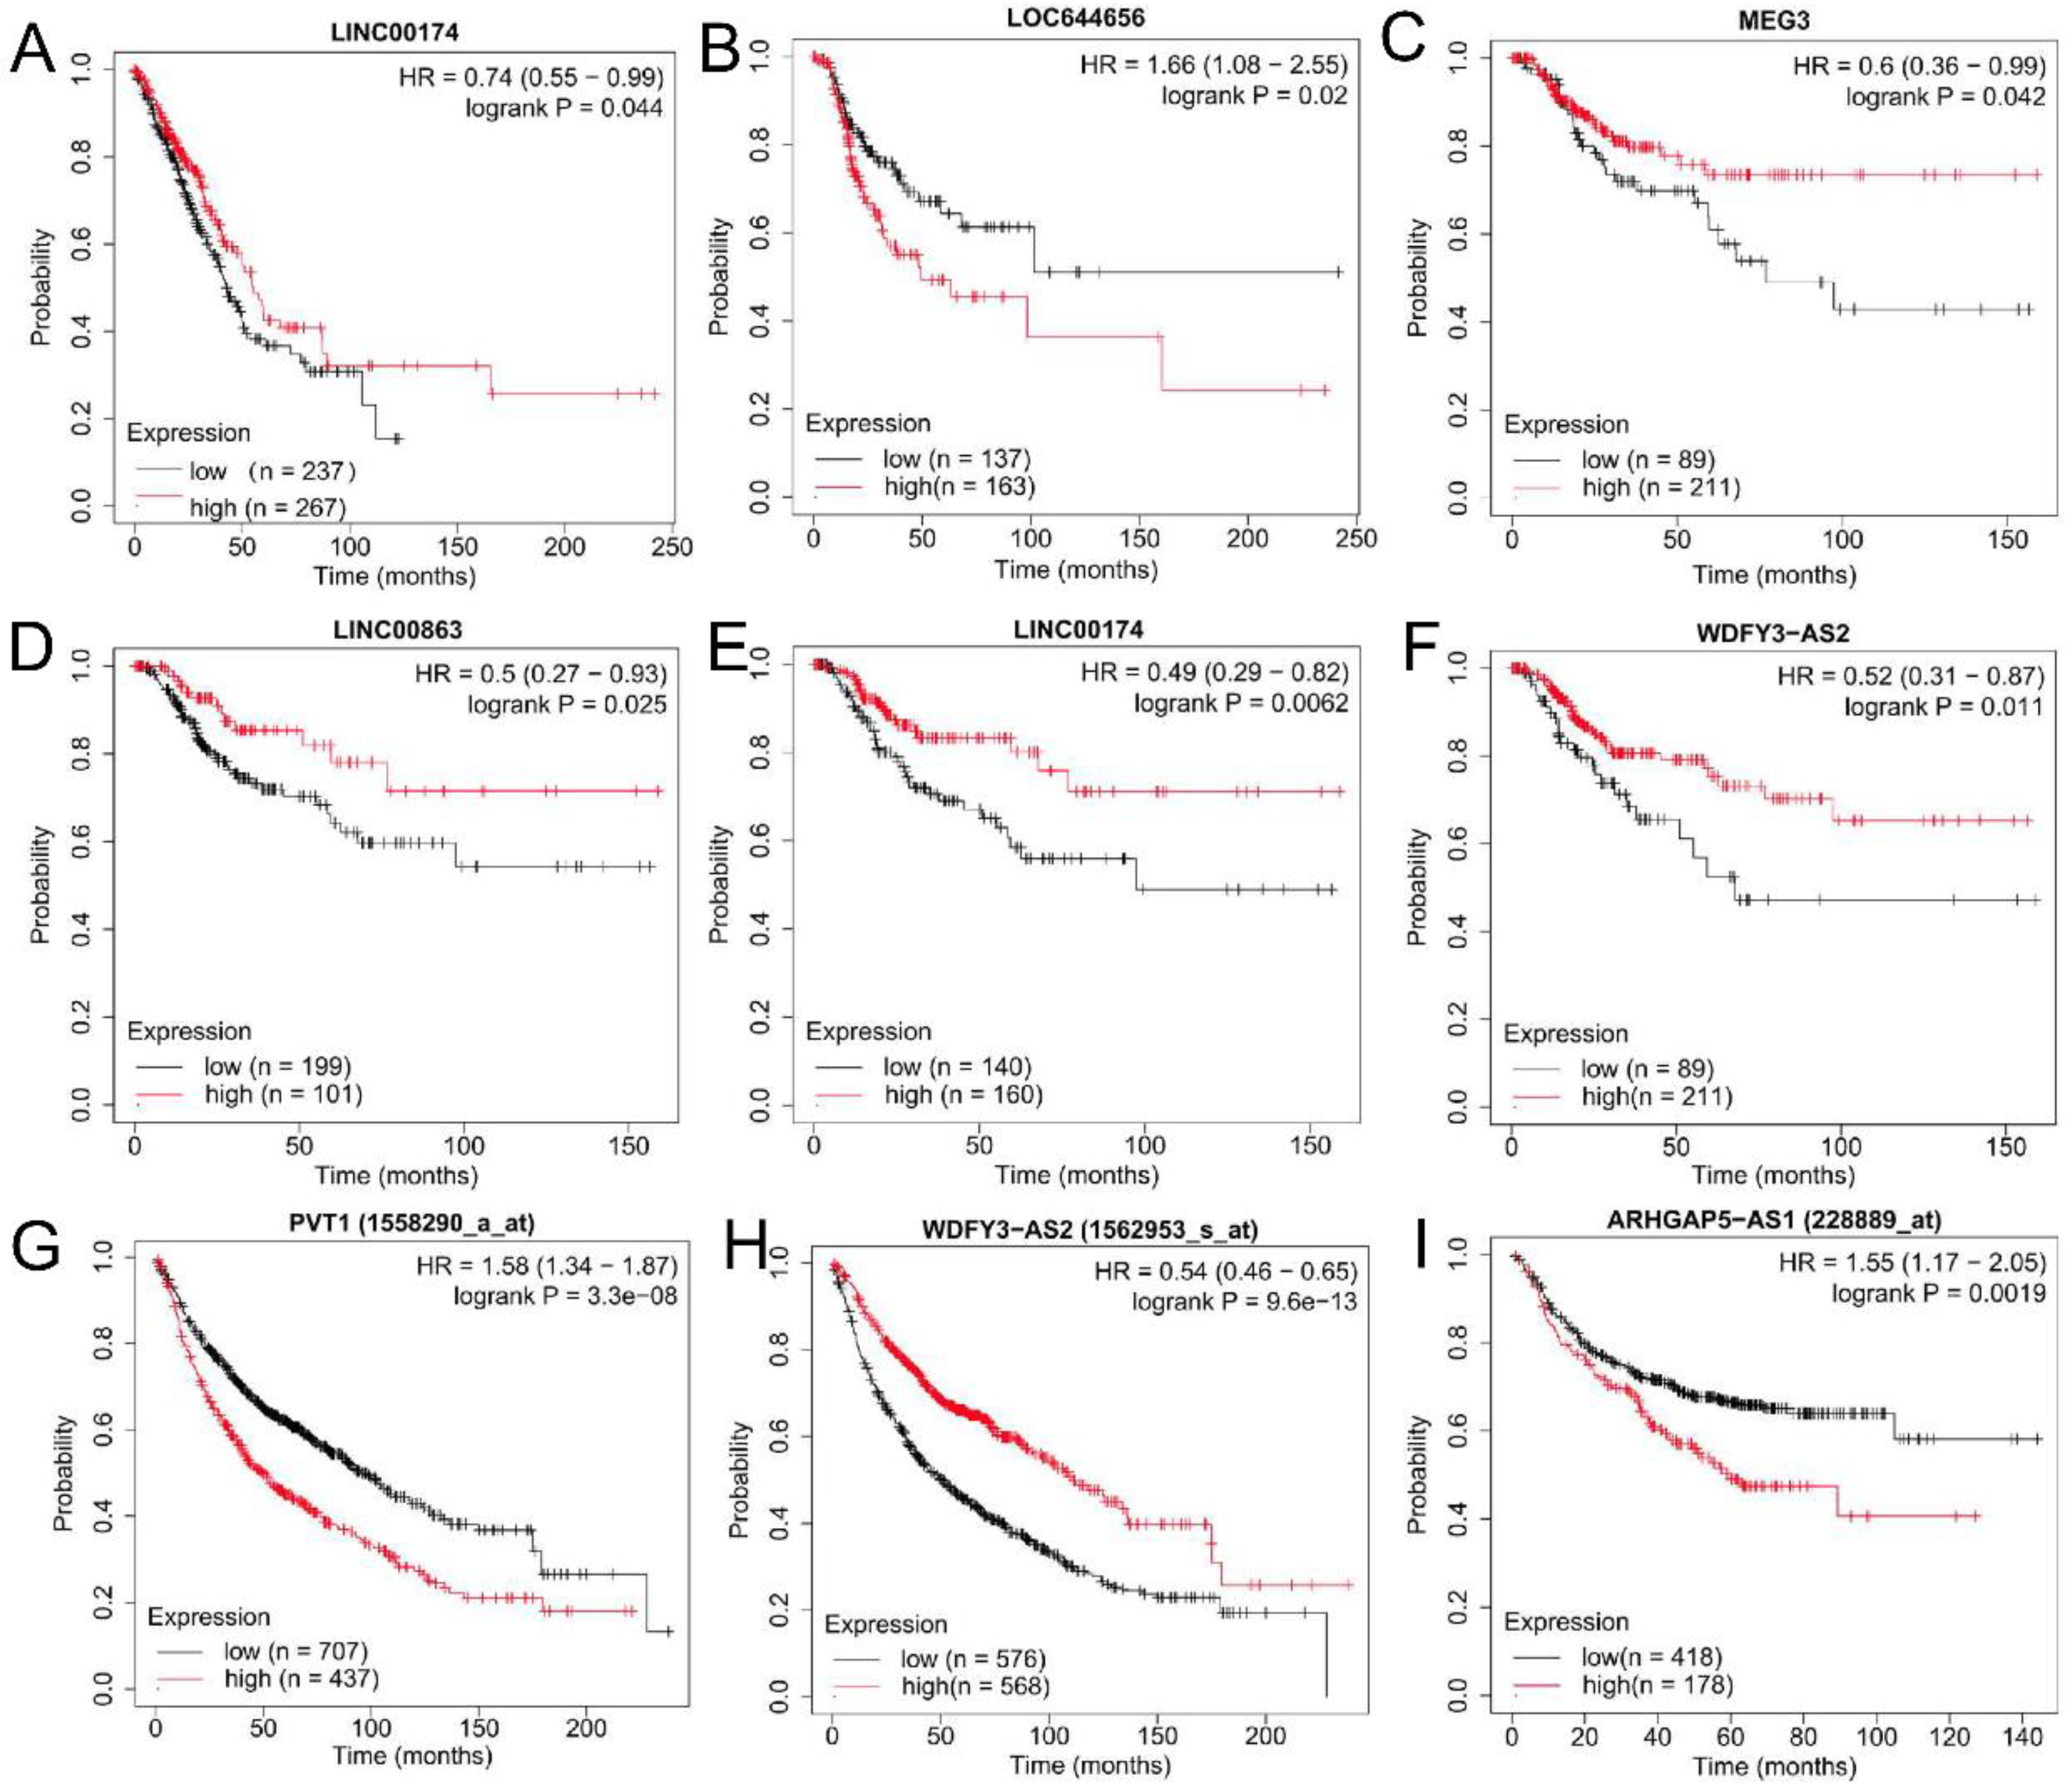
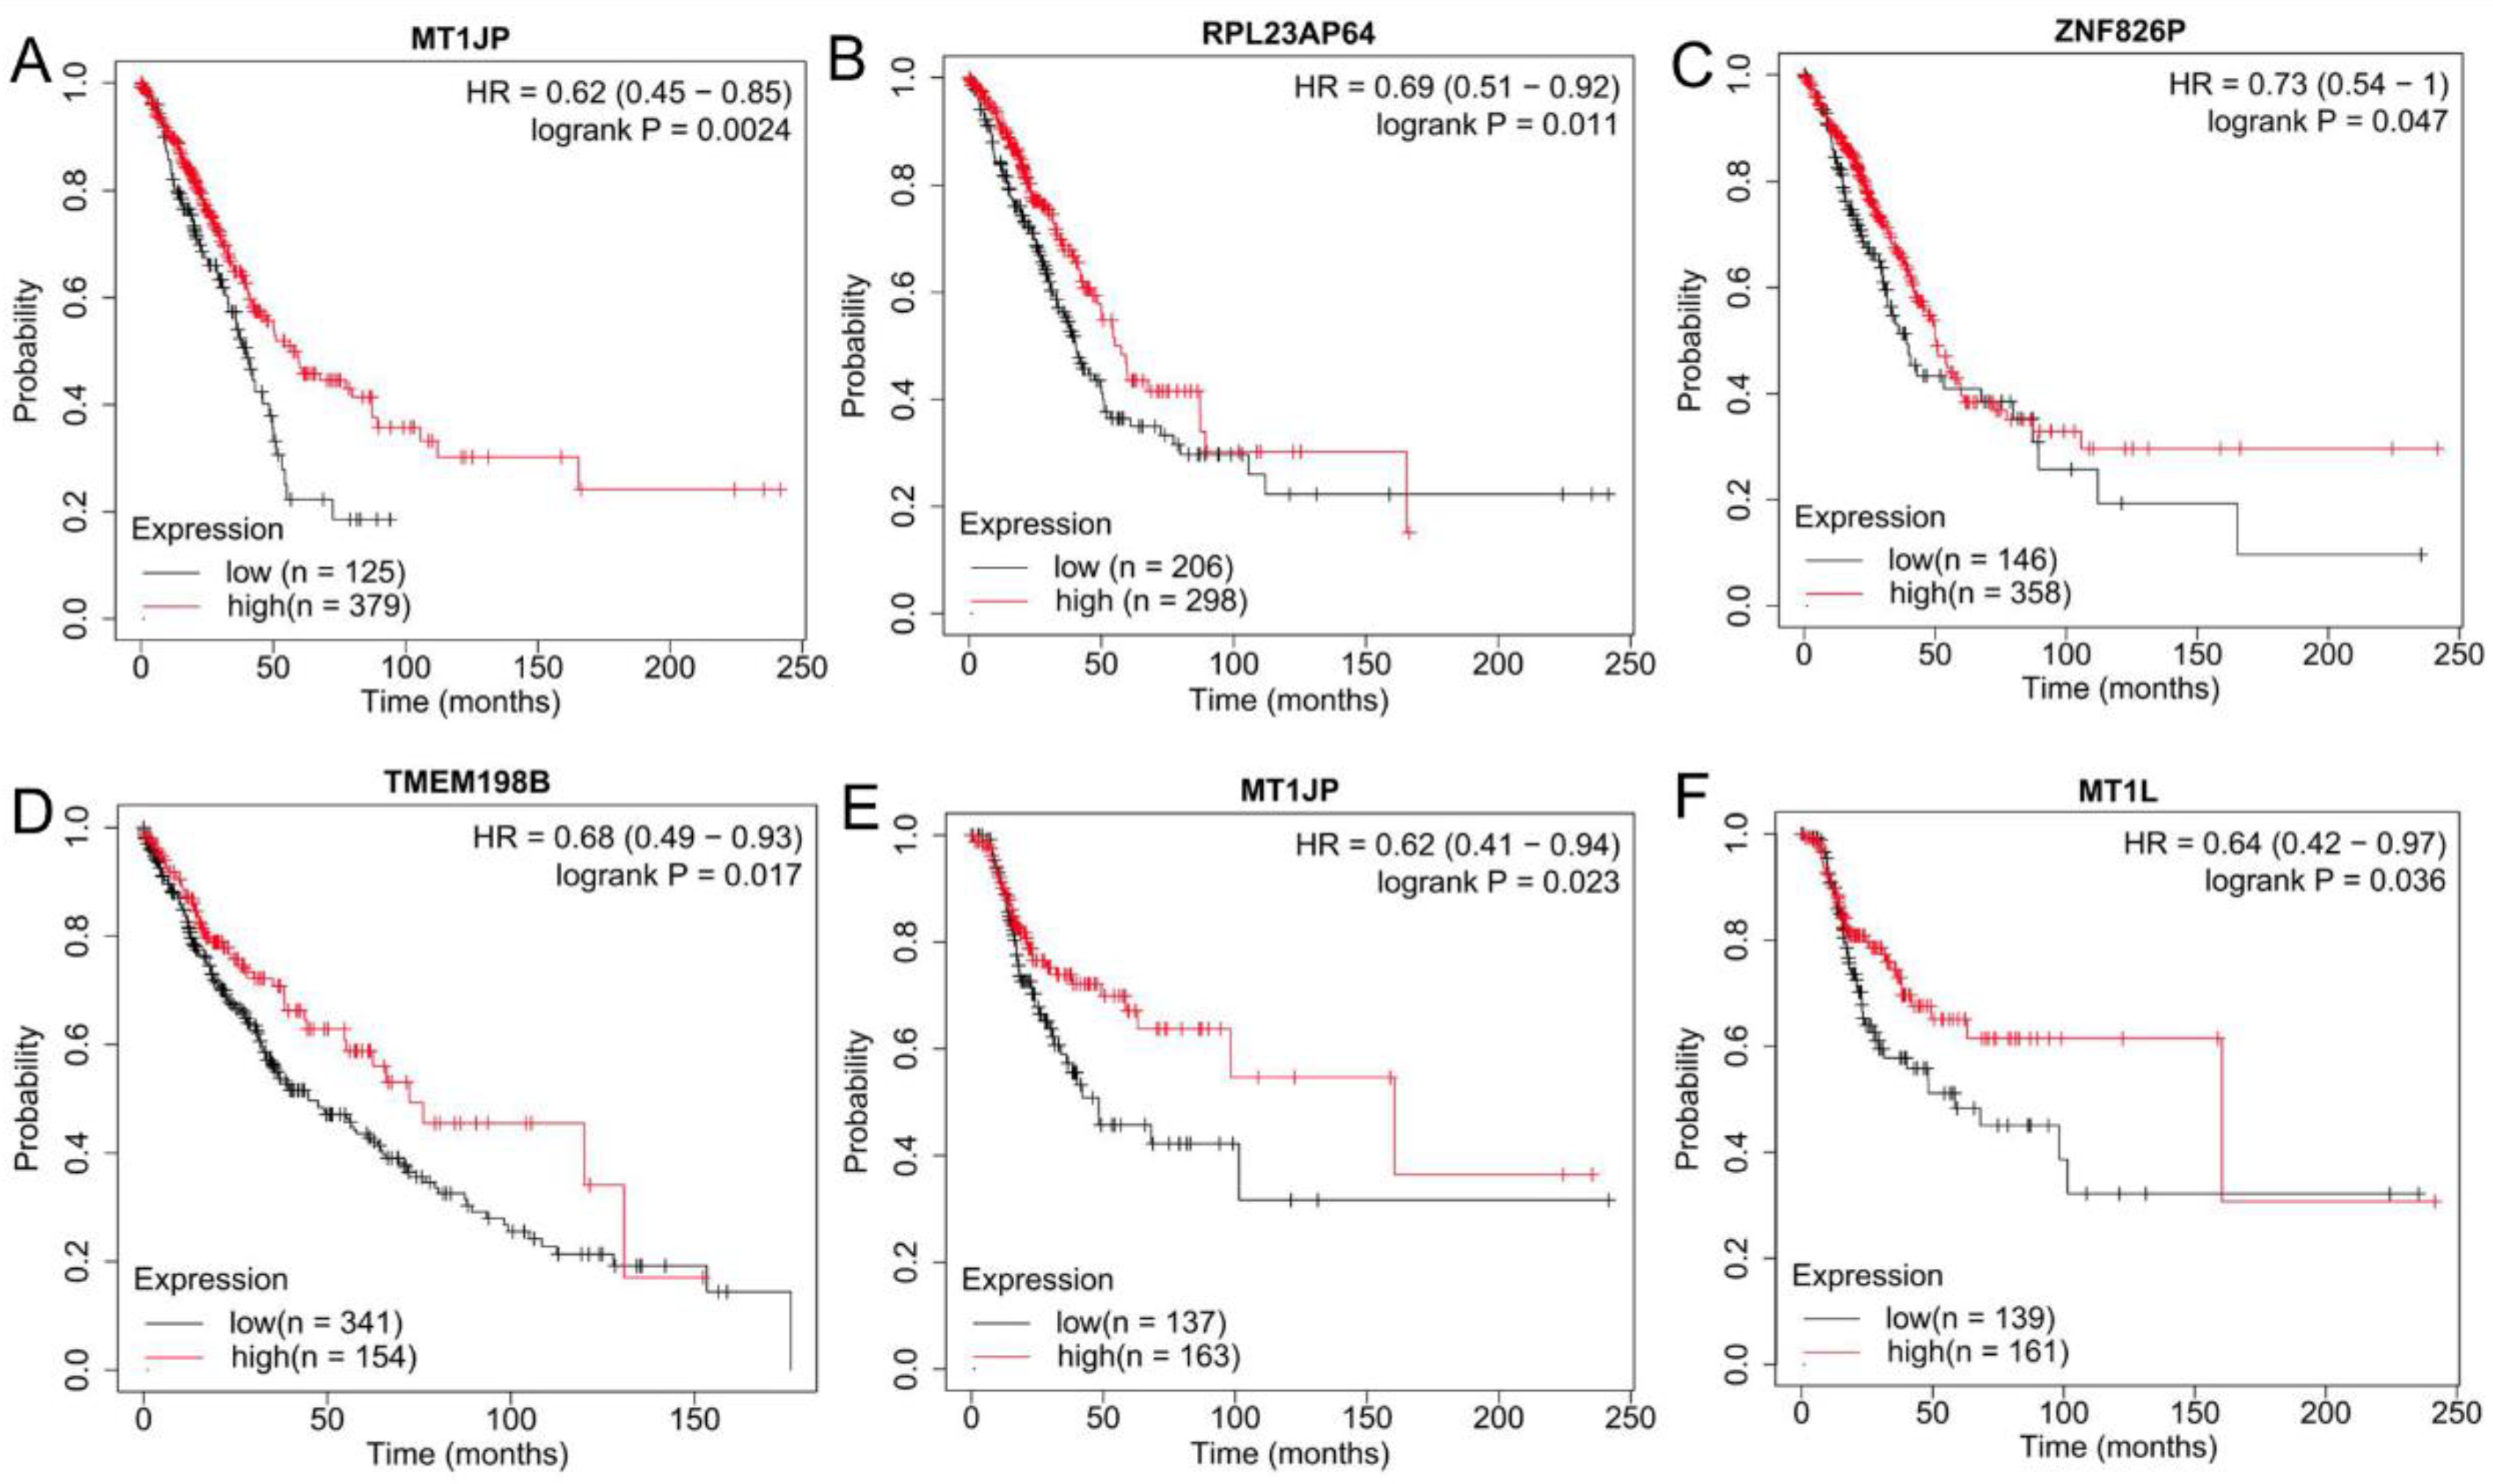
3.3. Validation of the Expression Levels and Prognosis of lncRNAs and Pseudogenes in Tissues of Lung Cancer Patients

Under the threshold of log2FC > 0.5 and p-value < 0.5, the GEPIA database confirmed that PVT1 was significantly upregulated in both LUAD and LUSC samples compared with controls; ARHGAP5-AS1, RBM12B-AS1, LOC644656 and SNHG17 were only more highly expressed in LUSC samples compared to controls; MEG3, LINC00174, WDFY3-AS2 and EIF3J-DT were significantly downregulated in both LUAD and LUSC samples compared with controls; LINC00863 was only had lower expression in LUSC samples compared to controls (Figure 4). The expression trend was in line with the results of these lncRNAs identified in the GSE41178 dataset (Table 1). Kaplan–Meier plotter analysis demonstrated that patients with high expression levels of PVT1, ARHGAP5-AS1 and LOC644656 possessed a shorter survival rate (HR >1), whereas high expression levels of MEG3, LINC00174, WDFY3-AS2 and LINC00863 were associated with excellent prognostic outcomes (HR< 1) (Figure 5; Table S1). The prognostic results of these lncRNAs were in accordance with our expectation according to their expression trends. Likewise, GEPIA and the Kaplan–Meier plotter database were used to confirm the expression levels and prognosis of pseudogenes, respectively. As a result, MT1JP, MT1L, RPL23AP64 and TMEM198B were found to be significantly downregulated in both LUAD and LUSC samples compared with controls; ZNF826P was downregulated and EP400P1 was upregulated in LUSC samples compared with controls (Figure 4), which was in line with the results obtained in the GSE41178 dataset (Table 1). Among these six pseudogenes, five (HR <1 in all pseudogenes) were significantly associated with prognostic outcomes of lung cancer patients (Figure 6). These findings suggest that these seven lncRNAs and five pseudogenes may be potentially important genes associated with CNT-induced initiation and progression of lung cancer, which were used for the following ceRNA and co-expression network analyses.

3.4. Establishment of lncRNA- and Pseudogene-Based ceRNA Regulatory Networks

The starBase database predicted that five lncRNAs (LINC00174, LINC00863, MEG3, ARHGAP5-AS1 and PVT1) could interact with 41 miRNAs, and among these 41 miRNAs, 32 could target 3429 mRNAs. Integration of these lncRNA–mRNA and miRNA–mRNA interaction pairs and selection of the intersection of predicted mRNAs with DE-mRNAs showed that upregulated PVT1 could interact with 15 miRNAs to lead to the upregulation of 376 DE-mRNAs, whereas downregulated LINC00174, LINC00863 and MEG3 could interact with 15 miRNAs to result in the downregulation of 88 DE-mRNAs. Thus, these four DE-lncRNAs-30, miRNAs-464 and DE-mRNAs were used to establish an lncRNA-related ceRNA network (Table S2).
The starBase database predicted that three downregulated pseudogenes (RPL23AP64, ZNF826P and TMEM198B) could interact with 36 miRNAs, whereas 35 miRNAs could target 3053 mRNAs (among which 146 were downregulated). Thus, three DE-pseudogenes-27, miRNAs-146 and DE-mRNAs were ultimately used to establish a pseudogene-related ceRNA regulatory network (Table S2).

3.5. Establishment of lncRNA- and Pseudogene-Based Co-Expression Networks

Under the threshold of PCC > 0.9 and p-value < 0.05, a total of 402 co-expression pairs were obtained, including the interactive relationships between three upregulated DE-lncRNAs (PVT, ARHGAP5-AS1 and LOC64465) and 161 upregulated DE-mRNAs, as well as between four downregulated DE-lncRNAs (MEG3, WDFY3-AS2, LINC00863 and LINC00174) and 192 downregulated DE-mRNAs (Table S4); for pseudogenes, a total of 455 co-expression pairs, which were constructed by five downregulated DE-pseudogenes (MT1JP, MT1L, TMEM198B, ZNF826P and RPL23AP64) and 302 downregulated DE-mRNAs, were identified (Table S3).

3.6. Establishment of PPI Networks for lncRNA- and Pseudogene-Related Target Genes

To screen crucial target mRNAs regulated by lncRNAs and pseudogenes, we attempted to explore the interactions of mRNAs in the ceRNA and co-expression networks by using the STRING database. As a result, 2527 PPI pairs with a combined score > 0.4, were obtained for target mRNAs of lncRNAs, which were constructed by 685 genes, whereas 286 genes and 513 PPI pairs were predicted for target mRNAs of pseudogenes (Table S4). The hub genes were selected according to the top 60 genes ranked in seven topological characteristics, which led to 112 genes screened from lncRNA- (Table 2) and pseudogene-related (Table 3) PPI pairs, respectively.

3.7. Validation of the Expression Levels and Prognosis of lncRNA- and Pseudogene-Related mRNAs and miRNAs in Lung Cancer

To screen crucial interaction axes, we compared the miRNAs and mRNAs in the ceRNA network, co-expression network and the top 60 genes of the PPI network. The results showed that hsa-miR-942-5p was the only overlapped miRNA included in the ceRNA networks of lncRNAs and pseudogenes. Thus, MEG3/RPL23AP64-hsa-miR-942-5p-cytoplasmic polyadenylation element binding protein 2 (CPEB2)/PHD finger protein 21A (PHF21A)/BMP and activin membrane-bound inhibitor (BAMBI) interactive axes were potentially important; ATM serine/threonine kinase (ATM) was the target gene that could be regulated by both of lncRNA MEG3 and pseudogene MT1L/ZNF826P in the co-expression network and was ranked as the hub gene in the PPI networks of both lncRNAs and pseudogenes. The intersection analysis of mRNAs in the ceRNA, co-expression and PPI networks of lncRNAs identified three mRNAs (transmembrane p24 trafficking protein 10, TMED10; NEDD4 like E3 ubiquitin protein ligase, NEDD4L; and nucleolar pre-rRNA processing protein NIP7, NIP7), and their corresponding relationship pairs were ARHGAP5-AS1-TMED10, PVT1-hsa-miR-214-3p/hsa-miR-873-5p-TMED10, LINC00174-NEDD4L, LINC00174-hsa-miR-519a-3p/hsa-miR-519b-3p/hsa-miR-519c-3p-NEDD4L, PVT1-hsa-miR-873-5p-NIP7 and ARHGAP5-AS1/PVT1-NIP7; the intersection analysis of mRNAs in the ceRNA, co-expression and PPI networks of pseudogenes identified three mRNAs (synaptic Ras GTPase activating protein 1, SYNGAP1; clusterin, CLU; and serum/glucocorticoid regulated kinase family member 3, SGK3), and their corresponding relationship pairs were MT1L-SYNGAP1, TMEM198B-hsa-miR-15a-5p/hsa-miR-15b-5p/hsa-miR-16-5p/hsa-miR-195-5p/hsa-miR-424-5p/hsa-miR-497-5p-SYNGAP1, ZNF826P-hsa-miR-23a-3p/hsa-miR-23b-3p-SYNGAP1, TMEM198B-hsa-miR-15a-5p/hsa-miR-15b-5p/hsa-miR-16-5p/hsa-miR-195-5p/hsa-miR-424-5p/hsa-miR-497-5p-CLU, MT1L-CLU, RPL23AP64-hsa-miR-376a-3p/hsa-miR-376b-3p-SGK3 and MT1JP/MT1L/RPL23AP64/ZNF826P-SGK3.
GEPIA analysis confirmed that the mRNA expression levels of CPEB2, PHF21A, BAMBI, ATM, NEDD4L, SYNGAP1, CLU and SGK3 were significantly lower, whereas TMED10 and NIP7 were significantly higher in both LUAD and LUSC samples than those in the normal controls (Figure S2). UALCAN analysis with the proteomic data validated that the protein expression levels of CPEB2, NEDD4L, SYNGAP1, CLU and SGK3 were significantly downregulated, whereas TMED10 and NIP7 were significantly upregulated in LUAD samples compared with controls (Figure S3). HPA immunohistochemical results revealed that PHF21A was expressed at medium levels in normal tissues but at medium to not-detected levels in LUAD and LUSC tissues. BAMBI was expressed at low levels in normal tissues but at not-detected levels in most LUAD and LUSC tissues. ATM was expressed at high levels in normal tissues but at medium-low levels in LUAD and medium to not-detected levels in most LUSC tissues. TMED10 was expressed at low levels in normal tissues but at high-medium levels in all LUAD samples and at medium levels in most LUSC tissues. SGK3 was expressed at low levels in normal tissues but at not-detected levels in LUAD and LUSC tissues (Figure S4). Kaplan–Meier plotter analysis demonstrated that there were significant associations between these 10 mRNAs and prognostic outcomes (Figure S5 and Table S5).
For miRNAs on interactive axes, only hsa-miR-942, hsa-miR-23a and has-miR-15b were validated to be differentially expressed and associated with prognosis after UALCAN and Kaplan–Meier plotter analyses (Figure S6). Consistent with TCGA analysis results, hsa-miR-23a-3p (log2FC = 0.69, p = 2.89 × 10³) and has-miR-15b-5p (log2FC = 0.62, p = 2.71 × 10⁴) were also detected to be upregulated in A549 cells after 24 h of exposure to MWCNTs [30]. Although the expression level of hsa-miR-423 (non-significant for LUAD; upregulated in LUSC) in TCGA data were not in line with our expectations, hsa-miR-423-5p was identified to be downregulated in A549 cells after 24 h of exposure to MWCNTs (log2FC = −0.76, p = 3.10 × 10¹⁶) (Figure S7). Additionally, Kaplan–Meier plotter analysis proved that high levels of hsa-miR-423 contributed to a longer survival rate (Figure S7). Thus, we considered that hsa-miR-423-5p-related ceRNA axes may also be pivotal. As the target mRNA of hsa-miR-423-5p, PSME3 was included in hub genes of the PPI network. PSME3 had significantly higher expression in LUAD and LUSC samples and predicted a poor prognosis (Figure S7).
In summary, we believe that lncRNAs MEG3, ARHGAP5-AS1, LINC00174, PVT1 and pseudogenes MT1JP, MT1L, RPL23AP64, ZNF826P and TMEM198B may be crucial for CNT-induced lung carcinogenesis by the following interaction mechanisms: MEG3/RPL23AP64-hsa-miR-942-5p-CPEB2/PHF21A/BAMBI; ZNF826P-hsa-miR-23a-3p-SYNGAP1, TMEM198B-hsa-miR-15b-5p-SYNGAP1/CLU; PVT1-hsa-miR-423-5p-PSME3 (Figure 7A); MEG3/MT1L/ZNF826P-ATM; ARHGAP5-AS1-TMED10, LINC00174-NEDD4L, ARHGAP5-AS1/PVT1-NIP7; MT1L-SYNGAP1; MT1L-CLU; MEG3/MT1JP/MT1L/RPL23AP64/ZNF826P-SGK3 (Figure 7B).

3.8. Function Enrichment Analysis

All genes in PPI networks of lncRNAs and pseudogenes were uploaded into the DAVID database to predict their potential functions. A total of 125 GO biological process, 43 molecular function terms and 23 KEGG pathways were enriched (Table S6). The mRNAs regulated by crucial lncRNAs and pseudogenes were predicted to be involved in GO:0006915~apoptotic process (PSME3), GO:0030334~regulation of cell migration (SGK3), GO:0007179~transforming growth factor beta receptor signaling pathway, GO:0010718~positive regulation of epithelial to mesenchymal transition (BAMBI), GO:0007265~Ras protein signal transduction (SYNGAP1), GO:0006888~ER to Golgi vesicle-mediated transport (TMED10), GO:0000209~protein polyubiquitination (NEDD4L), GO:0006351~transcription, DNA-templated (PHF21A), GO:0071456~cellular response to hypoxia (CPEB2), GO:0001836~release of cytochrome c from mitochondria (CLU), O:0005515~protein binding (NIP7) (Figure 7C), hsa04115:p53 signaling pathway (ATM), hsa04350:TGF-beta signaling pathway (BAMBI), hsa04068:FoxO signaling pathway (ATM, SGK3), hsa04064:NF-kappa B signaling pathway (ATM), etc. (Figure 7D).

3.9. Diagnostic Values of Hub lncRNAs and Pseudogenes

ROC analysis was performed on these four lncRNAs (MEG3, ARHGAP5-AS1, LINC00174 and PVT1) and five pseudogenes (MT1JP, MT1L, RPL23AP64, ZNF826P and TMEM198B) to explore their diagnostic values. The results showed that the AUCs of all single lncRNAs and pseudogenes were >0.5, indicating they had diagnostic significance in distinguishing lung cancer from normal controls. PVT1 and MT1JP may be especially effective because their AUCs were larger than 0.85 in the analysis of LUAD and LUSC samples (Figure 8A,B). Furthermore, the combination of all lncRNAs, pseudogenes and lncRNAs + pseudogenes was shown to further increase the AUC, sensitivity or specificity. Thus, this gene combination should be considered as a promising diagnostic biomarker (Figure 8A,B; Table 4).

3.10. Prediction of Small-Molecule Drugs That Regulated Hub lncRNAs and Pseudogenes

CTD analysis identified a series of drugs that reversed the expression levels of hub lncRNAs and pseudogenes in cancer (Figure 8C). Among them, schizandrin A (targeted MEG3), folic acid (targeted MEG3 and TMEM198B), zinc (targeted MT1JP and MT1L) and gamma-linolenic acid (targeted MT1L) may be candidate drugs to prevent the development of lung cancer for CNT occupational workers because they were components of traditional Chinese medicine or OTC health products.

4. Discussion

In recent decades, mounting evidence has supported the idea that environmental pollutants (such as PM2.5 [33,34,35], nickel [36] and cadmium [37,38]) promote the malignant transformation of lung epithelial cells by changing the expression levels of ncRNAs. Dysregulation of ncRNA expression levels was also revealed to be a novel paradigm for interpretation of the toxicology of various nanoparticles [39,40,41]. However, to date, there has been no study exploring the molecular mechanisms associated with CNT-induced lung carcinogenesis from the perspective of lncRNAs and pseudogenes. In this study, we, for the first time, attempted to screen potential lncRNAs and pseudogenes associated with CNT-induced lung carcinogenesis based on a comprehensive bioinformatics analysis of microarray data of lung cells directly exposed to CNTs without other influencing factors (GSE41178 and GSE561040) and sequencing (TCGA), proteomics (CPTAC) and immunohistochemical data (HPA) of lung cancer patients. Similar to the studies of PM2.5 [35], nickel [36] and cadmium [37] exposure, we also identified that the upregulation of PVT1 and downregulation of MEG3 contributed to the acquisition of tumorigenic phenotypes of human SAECs after CNT exposure. An increase in the expression level of lncRNA ARHGAP5-AS1 and decreases in the expression levels of lncRNA LINC00174, pseudogene MT1JP, MT1L, RPL23AP64, ZNF826P and TMEM198B were newly identified mechanisms in our study to explain the carcinogenic effects of CNTs. Nevertheless, some of our newly identified lncRNAs and pseudogenes had been demonstrated to mediate cancer development and progression. For example, Zhu et al. identified that ARHGAP5-AS1 was upregulated in chemo-resistant gastric cancer cells, and its knockdown reversed the chemo-resistance. A high expression level of ARHGAP5-AS1 was associated with a poor prognosis for gastric cancer patients [42]. The expression level of MT1JP was shown to be significantly lower in gastric cancer [43], hepatocellular carcinoma [44] and lung cancer [45] tissues (especially for lymph node metastasis and advanced-stage cancer) than that in adjacent normal tissues. The survival time was significantly lengthened in cancer patients with a higher expression level of MT1JP [44]. Functionally, overexpression of MT1JP was found to inhibit cell proliferation, migration and invasion, promote cell apoptosis in vitro and slow down tumor growth and metastasis in vivo [43,44]. Ding et al. reported low MT1L expression in bladder cancer [46]. These findings indirectly indicate the importance of our identified lncRNAs and pseudogenes for CNT-induced lung cancer.
LncRNAs and pseudogenes were shown to be involved in various cell processes by regulating the expression levels of mRNAs via ceRNA [34,35] or co-expression [36,37,39,47] mechanisms. Thus, in our study, we constructed ceRNA and co-expression networks to identify the interaction pairs of hub lncRNAs and pseudogenes. As a result, we found that MEG3 and RPL23AP64 acted as a ceRNA to positively regulate the expression levels of CPEB2, PHF21A and BAMBI by sponging miR-942-5p, and PVT1, ZNF826P, RPL23AP64 and TMEM198B regulated the expression levels of PSME3, SYNGAP1, SGK3 and CLU expression by absorbing miR-423-5p, miR-23a-3p and miR-15b-5p, respectively. Furthermore, MEG3 and ZNF826P directly modulated the transcription of ATM and SGK3; MT1L could co-express with ATM, SYNGAP1, CLU and SGK3; ARHGAP5-AS1 could co-express with TMED10 and NIP7; LINC00174 could co-express with NEDD4L; RPL23AP64 could co-express with SGK3; PVT1 could co-express with NIP7; and MT1JP could co-express with SGK3. Among these regulatory relationship pairs, only the binding of PVT1 and miR-423-5p was verified by dual-luciferase reporter, RNA immunoprecipitation and RNA pull-down assays [48]. The expression level of PVT1 was significantly and negatively correlated with miR-423-5p in cancer tissues [48]. Thus, other mechanisms may be the first evidence provided by our study. However, the expression levels and roles of related miRNAs or mRNAs had been reported previously in lung cancer or other cancers. For example, Dong et al. found that miR-942-5p was significantly upregulated in human LUAD tissues and cell lines [49]. Enforced expression of miR-942-5p significantly enhanced the growth [49], migration and invasion capacities of non-small cell lung cancer (NSCLC) cells [50]. GSE24279 dataset analysis and PCR experiments confirmed that miR-23a-3p was upregulated in pancreatic cancer compared with controls [51]. Analysis of NSCLC tissue data in TCGA database showed a higher expression level of miR-23a was significantly associated with a shorter OS rate [52]. Serum miR-15b-5p was detected to be significantly upregulated in NSCLCs. Multivariate logistic regression analysis revealed that miR-15b-5p expression was an independent diagnostic factor for the identification of patients with NSCLCs from controls [53]. Knockdown of miR-15b-5p restrained growth and invasiveness and induced apoptosis of breast and prostate cancer cells [54,55]. Knockout of CPEB2 was shown to promote oncogenic properties of MCF10A and MCF7 cells, including increased proliferation, migration, invasion, EMT and stem-like cell phenotypes. Injection of CPEB2-knockout MCF10A cells in mice resulted in the formation of subcutaneous tumors and spontaneous lung metastases [56]. Kaplan–Meier analyses of GSE4412 and GSE4271 datasets demonstrated that downregulation of PHF21A was closely associated with a decreased OS rate among patients with glioma. A multivariate analysis further confirmed that the expression level of PHF21A was an independent prognostic factor [57]. BAMBI is a negative regulator of the TGF-β signaling pathway. Downregulation of BAMBI was observed to promote TGF-β-induced EMT, migration and invasion of NSCLCs in vitro, along with increased tumor burdens and tumor growth in vivo [58]. Overexpression of BAMBI possessed antitumor potentialities [58,59]. Immunohistochemistry experiments showed that PSME3 was highly expressed in pancreatic cancer cells [60]. RNA interference-mediated silencing of PSME3 suppressed cancer cell proliferation, invasion and migration; induced cell apoptosis and cell cycle arrest at the G2/M phase; and enhanced radiosensitivity [61]. SYNGAP1 (also known as RASA5) was frequently methylated in multiple carcinomas to induce a decrease in its expression levels. Knockdown of RASA5 enhanced Ras signaling and then promoted tumor cell growth, migration and invasion via activation of EMT [62]. NSCLC patients with clusterin-positive tumors had a significantly longer survival period relative to those with clusterin-negative tumors (63% vs. 42%) [63]. Consistent with the tissues, the mRNA level of CLU was lower in lung cancer cell lines. Knockdown of CLU was verified to significantly promote the growth of lung cancer cells in vitro and in vivo [64]. A decreased expression level of ATM was associated with inferior OS and higher prostate cancer-specific mortalities [65]. Activation of the ATM/checkpoint kinase 2/p53-dependent signaling pathway was shown to inhibit the chemoresistance of HGC-27 cells to oxaliplatin [66]. The cell viability was significantly higher, but the apoptotic rate was significantly lower by transfection with TMED10 into a papillary thyroid cancer cell line than those in the control group [67]. NEDD4L was downregulated in NSCLCs, which was correlated with lymph node invasion, advanced stage and poor prognosis. Overexpression of NEDD4L significantly suppressed cell proliferation, migration and invasion abilities, whereas knockdown of NEDD4L enhanced the tumor metastasis of NSCLC cells [68]. NIP7 was significantly upregulated in the TCGA glioblastoma dataset [69]. In line with these studies, we also confirmed that CPEB2, PHF21A, BAMBI, ATM, SYNGAP1, CLU, NEDD4L and miR-423-5p were downregulated, whereas TMED10, PSME3, NIP7, miR-15b-5p and miR-23a-3p were upregulated in CNT-exposed lung cells and lung cancer samples. All of them (including miR-942) were associated with survival of lung cancer patients. Experimental studies revealed that SGK3 was an oncogenic gene [70,71]; however, TCGA analysis of several cancer data indicated SGK3 was downregulated compared with controls (including lung cancer, which was also confirmed in our prognosis and HPA analyses) (Figure S8). Thus, further experiments are necessary to confirm the expression levels and roles of SGK3 in CNT-related lung cancer. Furthermore, co-expression relationships between MT1JP and SYNGAP1/BAMBI/NEDD4L/ATM/CPEB2/CLU/PHF21A were present (all r > 0.6 and p < 0.01; Table S4), indicating MT1JP also functioned in lung cancer by influencing these genes.
To confirm whether our identified lncRNAs and pseudogenes were potential biomarkers for early diagnosis of CNT occupational workers with the risk to develop lung cancer, we performed ROC curve analysis based on the TCGA data of lung cancer. Our results showed the diagnostic accuracy of a four-lncRNA signature, a five-pseudogene signature or a nine-lncRNA-pseudogene signature were all higher than 80% (even approximate to 1), which was obviously higher than those of the 35-mRNA signature previously identified by Guo et al. (accuracy of 62–80%) [20] and essentially similar to a four-gene signature identified in our previous study [72]. Thus, we consider that our lncRNA and pseudogene signatures may be promising biomarkers for medical surveillance of lung cancer risk in occupational CNT-exposed workers.
To provide underlying preventive drugs, we mined the CTD database and selected some chemical molecules that reversed the expression levels of lncRNAs and pseudogenes. Our results showed that using supplements of Schisandra chinensis (containing a schizandrin A component), folic acid, zinc and gamma-linolenic Acid may be a potential approach to reduce the risk of developing lung cancer for populations with long-term CNT exposure. Our hypothesis can be indirectly validated because there studies have demonstrated the antitumor effects of these drugs. For example, Zhu et al. found schizandrin A treatment reduced viability, inhibited proliferation and induced cell cycle arrest and apoptosis of NSCLC cells [73]. Bae reported that higher foliate levels can decrease lung cancer risk in men (odds ratios = 0.82) and former smokers (odds ratios = 0.7) [74]. A meta-analysis performed by Charoenngam et al. showed that individuals with higher zinc intake had a significantly decreased risk of lung cancer, with a pooled risk ratio of 0.68 [75]. Dietary supplementation with gamma-linolenic acid was shown to inhibit the growth of a human lung carcinoma implanted in nude mice [76]. In vitro experiments also confirmed that gamma-linolenic acid was effective in inhibiting the migration and invasion of NSCLC cells [77].
This research has some limitations. First, this study preliminarily screened lncRNAs and pseudogenes associated with CNT-induced lung carcinogenesis based on two microarray data of human lung epithelial cells and the sequencing data of lung cancer patient tissues. Their expression and downstream function mechanisms (target genes identified by ceRNA or co-expression analysis) still needed further confirmation by more high-throughput datasets and wet experiments (including PCR, Western blot, overexpression or silencing of genes, dual-luciferase reporter assay, proliferation, apoptosis, invasion and metastasis analyses) in in vitro (different cell lines) and in vivo lung cancer models induced by different types of CNTs, especially for those first reported in our study, such as RPL23AP64, ZNF826P and TMEM198B. Second, CNT-induced lung cancer may be a long-term process. It may be difficult to collect samples from clinical populations. Thus, mice models with low-dose, chronic, long-term exposure to CNTs should be first established to observe the risk of development of lung cancer and validate the diagnostic values of our identified lncRNAs and pseudogenes. Furthermore, dietary supplementation of schizandrin A, folic acid, zinc or gamma-linolenic acid were also assigned for model mice to reveal their possible protective roles in the development of lung cancer in CNT occupational workers. However, a repository of biological samples from CNT-exposed workers needs to be created in the future by collaboration with other experts, which may be more beneficial to monitor biologically relevant changes of humans over time and to verify the effects of molecular biomarkers and drugs [78].

5. Conclusions

In the present study, we identified four lncRNAs (MEG3, ARHGAP5-AS1, LINC00174 and PVT1) and five pseudogenes (MT1JP, MT1L, RPL23AP64, ZNF826P and TMEM198B) that function as a ceRNA for miRNA–mRNA interactions or co-express with mRNAs as candidate biomarkers for surveillance of lung malignant transformation in occupational CNT-exposed workers. Dietary supplementation of schizandrin A, folic acid, zinc or gamma-linolenic acid may be a potential preventive strategy for CNT-induced lung cancer.

Supplementary Materials

The following are available online at https://www.mdpi.com/article/10.3390/ijerph19052936/s1, Figure S1: Venn diagram to show the overlapped genes. (A) commonly upregulated DE-lncRNAs, DE-pseudogenes and DE-mRNAs between SWCNT and MWCNT; (B) commonly downregulated lncRNAs, pseudogenes and mRNAs between SWCNT and MWCNT; (C) the overlap between module lncRNAs/pseudogenes and DE-lncRNAs/DE-pseudogenes. DE-lncRNAs, differentially expressed lncRNAs; DE-pseudogenes, differentially expressed pseudogenes; DE-mRNAs, differentially expressed mRNAs. Figure S2: GEPIA analysis to validate the expression of mRNAs in lung cancer. N = 50 or 59 indicates the control is match TCGA normal data; N = 338 or 347 indicates the control is match TCGA normal and GTEx data; asterisk (*) indicates the statistical significance at the threshold of |log2FC| > 0.5 and p-value < 0.05. Figure S3: UALCAN analysis to validate the expression of mRNAs in lung adenocarcinoma. Proteomic data from Clinical Proteomic Tumor Analysis Consortium (CPTAC) are used. Figure S4: HPA immunohistochemical staining results to validate the expression of mRNAs in lung cancer. LUAD, lung adenocarcinoma; LUSC, and squamous cell carcinomas. Figure S5: Validation of the prognosis of mRNAs in lung cancer. (A–G) PHF21A (A), TMED10 (B), NEDD4L (C), NIP7 (D), SYNGAP1 (E), CLU (F), SGK3 (G). Prediction for overall survival of LUAD patients by analysis of TCGA data; (H-J) CPEB2 (H), BAMBI (I), ATM (J). Prediction for overall survival of all lung cancer patients by analysis of chip data. HR, hazard ratio; LUAD, lung adenocarcinoma; TCGA, The Cancer Genome Atlas. Figure S6: Validation of the expression and prognosis of miR-942, miR-23a, miR-376b and miR-15b. A-D: the expression of miRNAs; E-H, the prognosis of miRNAs. LUAD, lung adenocarcinoma; LUSC, and squamous cell carcinomas. Figure S7: Validation of the expression and prognosis of miR-423 and its target mRNA PSME3. A: the prognosis of miR-423; B: the expression of PSME3; C: the prognosis of PSME3 for overall survival of TCGA LUAD samples; D: the prognosis of PSME3 for recurrence-free survival of TCGA LUAD samples; E: the prognosis of PSME3 for recurrence-free survival of TCGA LUSC samples. LUAD, lung adenocarcinoma; LUSC, and squamous cell carcinomas; TCGA, The Cancer Genome Atlas. Figure S8: SGK3 downregulated in several cancers. Asterisk indicates the statistical significance at the threshold of |log2FC| > 0.5 and p-value < 0.05. CESC, cervical squamous cell carcinoma and endocervical adenocarcinoma; OV, Ovarian serous cystadenocarcinoma; UCEC, uterine corpus endometrial carcinoma; UCS, uterine carcinosarcoma. Table S1: Survival analysis for lncRNAs. Table S2: The ceRNA interaction pairs for lncRNAs and pseudogenes. Table S3: The co-expression interaction pairs for lncRNAs and pseudogenes. Table S4: The protein-protein interaction pairs for lncRNAs and pseudogenes. Table S5: Survival analysis for mRNAs. Table S6: Function enrichment results for all genes in the protein-protein interaction networks of lncRNAs and pseudogenes.

Author Contributions

G.C.: conceptualization, methodology, data curation, formal analysis, writing—original draft; D.X.: methodology, data curation, formal analysis. J.H.: investigation, software; T.W.: investigation, visualization; K.C.: investigation, funding acquisition. X.L.: conceptualization, supervision, funding acquisition, writing—review and editing. All authors have read and agreed to the published version of the manuscript.

Funding

This research received financial support from the National Key Research and Development Program of China (2017YFA0204600) and Project funded by China Postdoctoral Science Foundation (2017M621322, 2018T110324).

Institutional Review Board Statement

Not applicable.

Informed Consent Statement

Not applicable.

Data Availability Statement

All data were downloaded from GEO (GSE41178 and GSE56104; http://www.ncbi.nlm.nih.gov/geo/, accessed on 5 September 2021) and TCGA-LUAD/LUSC (https://portal.gdc.cancer.gov/, accessed on 5 September 2021) databases.

Conflicts of Interest

The authors declare that they have no competing interests. Tong Wu is an employee of Shanghai Jing Rui Yang Industrial Co., Ltd. No hidden conflict of interest exist associate with this company.

References

  1. Luo, X.; Liang, Y.; Weng, W.; Hu, Z.; Zhu, M. Polypyrrole-coated carbon nanotube/cotton hybrid fabric with high areal capacitance for flexible quasi-solid-state supercapacitors. Energy Storage Mater. 2020, 33, 11–17. [Google Scholar] [CrossRef]
  2. Luo, X.; Weng, W.; Liang, Y.; Hu, Z.; Zhang, Y.; Yang, J.; Yang, L.; Yang, S.; Zhu, M.; Cheng, H.M. Multifunctional fabrics of carbon nanotube fibers. J. Mater. Chem. A 2019, 7, 8790–8797. [Google Scholar] [CrossRef]
  3. Abazari, S.; Shamsipur, A.; Bakhsheshi-Rad, H.R.; Ismail, A.F.; Sharif, S.; Razzaghi, M. Carbon Nanotubes (CNTs)-Reinforced Magnesium-Based Matrix Composites: A Comprehensive Review. Materials 2020, 13, 4421. [Google Scholar] [CrossRef]
  4. Yin, Z.; Cui, C.; Chen, H.; Yu, X.; Qian, W. The Application of Carbon Nanotube/Graphene-Based Nanomaterials in Wastewater Treatment. Small 2020, 16, e1902301. [Google Scholar] [CrossRef] [PubMed]
  5. Negri, V.; Pacheco-Torres, J. Carbon Nanotube in Biomedicine. Top. Curr. Chem. 2020, 378, 15. [Google Scholar] [CrossRef] [PubMed]
  6. Aoki, K.; Saito, N. Biocompatibility and Carcinogenicity of Carbon Nanotubes as Biomaterials. Nanomaterials 2020, 10, 264. [Google Scholar] [CrossRef] [PubMed]
  7. Wang, L.; Luanpitpong, S.; Castranova, V.; Tse, W.; Lu, Y.; Pongrakhananon, V.; Rojanasakul, Y. Carbon nanotubes induce malignant transformation and tumorigenesis of human lung epithelial cells. Nano. Lett. 2011, 11, 2796–2803. [Google Scholar] [CrossRef] [PubMed] [Green Version]
  8. Wang, L.; Stueckle, T.A.; Mishra, A.; Derk, R.; Meighan, T.; Castranova, V.; Rojanasakul, Y. Neoplastic-like transformation effect of single-walled and multi-walled carbon nanotubes compared to asbestos on human lung small airway epithelial cells. Nanotoxicology 2014, 8, 485–507. [Google Scholar] [CrossRef] [PubMed] [Green Version]
  9. Luanpitpong, S.; Wang, L.; Castranova, V.; Dinu, C.Z.; Issaragrisil, S.; Chen, Y.C.; Rojanasakul, Y. Induction of cancer-associated fibroblast-like cells by carbon nanotubes dictates its tumorigenicity. Sci. Rep. 2016, 6, 39558. [Google Scholar] [CrossRef] [PubMed]
  10. Suzui, M.; Futakuchi, M.; Fukamachi, K.; Numano, T.; Abdelgied, M.; Takahashi, S.; Ohnishi, M.; Omori, T.; Tsuruoka, S.; Hirose, A.; et al. Multiwalled carbon nanotubes intratracheally instilled into the rat lung induce development of pleural malignant mesothelioma and lung tumors. Cancer Sci. 2016, 107, 924–935. [Google Scholar] [CrossRef] [PubMed] [Green Version]
  11. Saleh, D.M.; Alexander, W.T.; Numano, T.; Ahmed, O.H.M.; Gunasekaran, S.; Alexander, D.B. Comparative carcinogenicity study of a thick, straight-type and a thin, tangled-type multi-walled carbon nanotube administered by intra-tracheal instillation in the rat. Part. Fibre Toxicol. 2020, 17, 48. [Google Scholar] [CrossRef] [PubMed]
  12. Voronkova, M.A.; Luanpitpong, S. SOX9 Regulates Cancer Stem-Like Properties and Metastatic Potential of Single-Walled Carbon Nanotube-Exposed Cells. Sci. Rep. 2017, 7, 11653. [Google Scholar] [CrossRef]
  13. Polimeni, M.; Gulino, G.R.; Gazzano, E.; Kopecka, J.; Marucco, A.; Fenoglio, I.; Cesano, F.; Campagnolo, L.; Magrini, A.; Pietroiusti, A.; et al. Multi-walled carbon nanotubes directly induce epithelial-mesenchymal transition in human bronchial epithelial cells via the TGF-β-mediated Akt/GSK-3β/SNAIL-1 signalling pathway. Part. Fibre Toxicol. 2016, 13, 27. [Google Scholar] [CrossRef] [Green Version]
  14. Wang, P. Induction of Slug by Chronic Exposure to Single-Walled Carbon Nanotubes Promotes Tumor Formation and Metastasis. Chem. Res. Toxicol. 2017, 30, 1396–1405. [Google Scholar] [CrossRef]
  15. Pongrakhananon, V.; Luanpitpong, S.; Stueckle, T.A.; Wang, L.; Nimmannit, U.; Rojanasakul, Y. Carbon nanotubes induce apoptosis resistance of human lung epithelial cells through FLICE-inhibitory protein. Toxicol. Sci. 2015, 143, 499–511. [Google Scholar] [CrossRef] [Green Version]
  16. Luanpitpong, S.; Wang, L.; Stueckle, T.A.; Tse, W.; Chen, Y.C.; Rojanasakul, Y. Caveolin-1 regulates lung cancer stem-like cell induction and p53 inactivation in carbon nanotube-driven tumorigenesis. Oncotarget 2014, 5, 3541–3554. [Google Scholar] [CrossRef]
  17. Chen, D.; Stueckle, T.A.; Luanpitpong, S.; Rojanasakul, Y.; Lu, Y.; Wang, L. Gene expression profile of human lung epithelial cells chronically exposed to single-walled carbon nanotubes. Nanoscale Res. Lett. 2015, 10, 12. [Google Scholar] [CrossRef] [Green Version]
  18. Wang, J.; Tian, X.; Zhang, J.; Tan, L.; Ouyang, N.; Jia, B.; Chen, C.; Ge, C.; Li, J. Postchronic Single-Walled Carbon Nanotube Exposure Causes Irreversible Malignant Transformation of Human Bronchial Epithelial Cells through DNA Methylation Changes. ACS Nano 2021, 15, 7094–7104. [Google Scholar] [CrossRef]
  19. He, X.; Despeaux, E.; Stueckle, T.A.; Chi, A.; Castranova, V.; Dinu, C.Z.; Wang, L.; Rojanasakul, Y. Role of mesothelin in carbon nanotube-induced carcinogenic transformation of human bronchial epithelial cells. Am. J. Physiol. Lung Cell Mol. Physiol. 2016, 311, L538–L549. [Google Scholar] [CrossRef] [Green Version]
  20. Guo, N.L.; Wan, Y.W.; Denvir, J.; Porter, D.W.; Pacurari, M.; Wolfarth, M.G.; Castranova, V.; Qian, Y. Multiwalled carbon nanotube-induced gene signatures in the mouse lung: Potential predictive value for human lung cancer risk and prognosis. J. Toxicol. Environ. Health A 2012, 75, 1129–1153. [Google Scholar] [CrossRef] [Green Version]
  21. Chan, J.J.; Tay, Y. Noncoding RNA: RNA Regulatory Networks in Cancer. Int. J. Mol. Sci. 2018, 19, 1310. [Google Scholar] [CrossRef] [PubMed] [Green Version]
  22. Porter, D.W.; Hubbs, A.F.; Mercer, R.R.; Wu, N.; Wolfarth, M.G.; Sriram, K.; Leonard, S.; Battelli, L.; Schwegler-Berry, D.; Friend, S.; et al. Mouse pulmonary dose- and time course-responses induced by exposure to multi-walled carbon nanotubes. Toxicology 2010, 269, 136–147. [Google Scholar] [CrossRef] [PubMed]
  23. Langfelder, P.; Horvath, S. WGCNA: An R package for weighted correlation network analysis. BMC Bioinform. 2008, 9, 559. [Google Scholar] [CrossRef] [PubMed] [Green Version]
  24. Ritchie, M.E.; Phipson, B.; Wu, D.; Hu, Y.; Law, C.W.; Shi, W.; Smyth, G.K. Limma powers differential expression analyses for RNA-sequencing and microarray studies. Nucleic Acids Res. 2015, 43, e47. [Google Scholar] [CrossRef]
  25. Tang, Z.; Li, C.; Kang, B.; Gao, G.; Li, C.; Zhang, Z. GEPIA: A web server for cancer and normal gene expression profiling and interactive analyses. Nucleic Acids Res. 2017, 45, W98–W102. [Google Scholar] [CrossRef] [PubMed] [Green Version]
  26. Győrffy, B. Survival analysis across the entire transcriptome identifies biomarkers with the highest prognostic power in breast cancer. Comput. Struct. Biotechnol. J. 2021, 19, 4101–4109. [Google Scholar] [CrossRef]
  27. Li, J.H.; Liu, S.; Zhou, H.; Qu, L.H.; Yang, J.H. starBase v2.0: Decoding miRNA-ceRNA, miRNA-ncRNA and protein-RNA interaction networks from large-scale CLIP-Seq data. Nucleic Acids Res. 2014, 42, D92–D97. [Google Scholar] [CrossRef] [Green Version]
  28. Szklarczyk, D.; Franceschini, A.; Wyder, S.; Forslund, K.; Heller, D.; Huerta-Cepas, J.; Simonovic, M.; Roth, A.; Santos, A.; Tsafou, K.P.; et al. STRING v10: Protein-protein interaction networks, integrated over the tree of life. Nucleic Acids Res. 2015, 43, D447. [Google Scholar] [CrossRef]
  29. Tang, Y.; Li, M.; Wang, J.; Pan, Y.; Wu, F.X. CytoNCA: A cytoscape plugin for centrality analysis and evaluation of protein interaction networks. Biosystems. 2015, 127, 67–72. [Google Scholar] [CrossRef]
  30. Ventura, C.; Vieira, L.; Silva, C.; Sousa-Uva, A.; Silva, M.J. Functional effects of differentially expressed microRNAs in A549 cells exposed to MWCNT-7 or crocidolite. Toxicol. Lett. 2020, 328, 7–18. [Google Scholar] [CrossRef] [PubMed]
  31. Dennis, G.; Sherman, B.T.; Hosack, D.A.; Yang, J.; Gao, W.; Lane, H.C.; Lempicki, R.A. DAVID: Database for Annotation, visualization, and Integrated Discovery. Genome. Biol. 2003, 4, P3. [Google Scholar] [CrossRef] [PubMed]
  32. Grondin, C.J.; Davis, A.P.; Wiegers, J.A.; Wiegers, T.C.; Sciaky, D.; Johnson, R.J.; Mattingly, C.J. Predicting molecular mechanisms, pathways, and health outcomes induced by Juul e-cigarette aerosol chemicals using the Comparative Toxicogenomics Database. Curr. Res. Toxicol. 2021, 2, 272–281. [Google Scholar] [CrossRef] [PubMed]
  33. Jiang, P.; Hao, S.; Xie, L.; Xiang, G.; Hu, W.; Wu, Q.; Liu, Z.; Li, S. LncRNA NEAT1 contributes to the acquisition of a tumor like-phenotype induced by PM 2.5 in lung bronchial epithelial cells via HIF-1α activation. Environ. Sci. Pollut. Res. Int. 2021, 28, 43382–43393. [Google Scholar] [CrossRef] [PubMed]
  34. Fu, Y.; Li, B.; Yun, J.; Xu, J.; Meng, Q.; Li, X.; Chen, R. lncRNA SOX2-OT ceRNA network enhances the malignancy of long-term PM(2.5)-exposed human bronchial epithelia. Ecotoxicol. Environ. Saf. 2021, 217, 112242. [Google Scholar] [CrossRef]
  35. Qi, H.; Liu, Y.; Wang, N.; Xiao, C. Lentinan Attenuated the PM2.5 Exposure-Induced Inflammatory Response, Epithelial-Mesenchymal Transition and Migration by Inhibiting the PVT1/miR-199a-5p/caveolin1 Pathway in Lung Cancer. DNA Cell Biol. 2021, 40, 683–693. [Google Scholar] [CrossRef]
  36. Zhou, C.; Huang, C.; Wang, J.; Huang, H.; Li, J.; Xie, Q.; Liu, Y.; Zhu, J.; Li, Y.; Zhang, D.; et al. LncRNA MEG3 downregulation mediated by DNMT3b contributes to nickel malignant transformation of human bronchial epithelial cells via modulating PHLPP1 transcription and HIF-1α translation. Oncogene 2017, 36, 3878–3889. [Google Scholar] [CrossRef] [PubMed] [Green Version]
  37. Lin, H.P.; Rea, M.; Wang, Z.; Yang, C. Down-regulation of lncRNA MEG3 promotes chronic low dose cadmium exposure-induced cell transformation and cancer stem cell-like property. Toxicol. Appl. Pharmacol. 2021, 430, 115724. [Google Scholar] [CrossRef] [PubMed]
  38. Lin, H.P.; Wang, Z.; Yang, C. LncRNA DUXAP10 up-regulation and the Hedgehog pathway activation are critically involved in chronic cadmium exposure-induced cancer stem cell-like property. Toxicol. Sci. 2021, 184, 33–45. [Google Scholar] [CrossRef]
  39. Ndika, J.; Karisola, P.; Kinaret, P. Profiling Non-Coding RNA Changes Associated with 16 Different Engineered Nanomaterials in a Mouse Airway Exposure Model. Cells 2021, 10, 1085. [Google Scholar] [CrossRef] [PubMed]
  40. Yu, F.; Zhang, X.; Gao, L.; Xue, H.; Liu, L.; Wang, S.; Chen, S.; Huang, L. LncRNA loc105377478 promotes NPs-Nd(2)O(3)-induced inflammation in human bronchial epithelial cells through the ADIPOR1/NF-κB axis. Ecotoxicol. Environ. Saf. 2021, 208, 111609. [Google Scholar] [CrossRef] [PubMed]
  41. Zhan, H.; Chang, X.; Wang, X.; Yang, M.; Gao, Q.; Liu, H.; Li, C.; Li, S.; Sun, Y. LncRNA MEG3 mediates nickel oxide nanoparticles-induced pulmonary fibrosis via suppressing TGF-β1 expression and epithelial-mesenchymal transition process. Environ. Toxicol. 2021, 36, 1099–1110. [Google Scholar] [CrossRef] [PubMed]
  42. Zhu, L.; Wang, Y.; Lv, W.; Wu, X.; Sheng, H.; He, C.; Hu, J. Impaired autophagic degradation of lncRNA ARHGAP5-AS1 promotes chemoresistance in gastric cancer. Cell Death Dis. 2019, 10, 383. [Google Scholar] [CrossRef] [PubMed]
  43. Zhang, G.; Li, S.; Lu, J.; Ge, Y.; Wang, Q.; Ma, G.; Zhao, Q.; Wu, D.; Gong, W.; Du, M.; et al. LncRNA MT1JP functions as a ceRNA in regulating FBXW7 through competitively binding to miR-92a-3p in gastric cancer. Mol. Cancer 2018, 17, 87. [Google Scholar] [CrossRef] [PubMed] [Green Version]
  44. Wu, J.H.; Xu, K.; Liu, J.H.; Du, L.L.; Li, X.S.; Su, Y.M.; Liu, J.C. LncRNA MT1JP inhibits the malignant progression of hepatocellular carcinoma through regulating AKT. Eur. Rev. Med. Pharmacol. Sci. 2020, 24, 6647–6656. [Google Scholar] [PubMed]
  45. Ma, J.; Yan, H.; Zhang, J.; Tan, Y.; Gu, W. Long-Chain Non-Coding RNA (lncRNA) MT1JP Suppresses Biological Activities of Lung Cancer by Regulating miRNA-423-3p/Bim Axis. Med. Sci. Monit. 2019, 25, 5114–5126. [Google Scholar] [CrossRef] [PubMed]
  46. Ding, Y.; Liu, N.; Chen, M.; Xu, Y.; Fang, S.; Xiang, W.; Hua, X.; Chen, G.; Zhong, Y.; Yu, H. Overexpressed pseudogene MT1L associated with tumor immune infiltrates and indicates a worse prognosis in BLCA. World J. Surg. Oncol. 2021, 19, 133. [Google Scholar] [CrossRef] [PubMed]
  47. Sabbir Ahmed, C.M.; Paul, B.C.; Cui, Y.; Frie, A.L.; Burr, A.; Kamath, R.; Chen, J.Y.; Nordgren, T.M.; Bahreini, R.; Lin, Y.H. Integrative Analysis of lncRNA-mRNA Coexpression in Human Lung Epithelial Cells Exposed to Dimethyl Selenide-Derived Secondary Organic Aerosols. Chem. Res. Toxicol. 2021, 34, 892–900. [Google Scholar] [CrossRef] [PubMed]
  48. Lin, Q.Y.; Qi, Q.L.; Hou, S.; Chen, Z.; Zhang, L.; Zhao, H.G.; Lin, C.H. LncRNA PVT1 Acts as a Tumor Promoter in Thyroid Cancer and Promotes Tumor Progression by Mediating miR-423-5p-PAK3. Cancer Manag. Res. 2020, 12, 13403–13413. [Google Scholar] [CrossRef] [PubMed]
  49. Dong, Y.; Qiu, T.; Xuan, Y.; Liu, A.; Sun, X.; Huang, Z.; Su, W.; Du, W.; Yun, T.; Wo, Y.; et al. circFBXW7 attenuates malignant progression in lung adenocarcinoma by sponging miR-942-5p. Transl. Lung Cancer Res. 2021, 10, 1457–1473. [Google Scholar] [CrossRef]
  50. Wang, Q.; Wu, J.; Huang, H.; Jiang, Y.; Huang, Y.; Fang, H.; Zheng, G.; Zhou, X.; Wu, Y.; Lei, C.; et al. lncRNA LIFR-AS1 suppresses invasion and metastasis of non-small cell lung cancer via the miR-942-5p/ZNF471 axis. Cancer Cell Int. 2020, 20, 180. [Google Scholar] [CrossRef]
  51. Bi, C.; Wang, G. LINC00472 suppressed by ZEB1 regulates the miR-23a-3p/FOXO3/BID axis to inhibit the progression of pancreatic cancer. J. Cell Mol. Med. 2021, 25, 8312–8328. [Google Scholar] [CrossRef] [PubMed]
  52. Shangguan, W.J.; Liu, H.T.; Que, Z.J.; Qian, F.F.; Liu, L.S.; Tian, J.H. TOB1-AS1 suppresses non-small cell lung cancer cell migration and invasion through a ceRNA network. Exp. Ther. Med. 2019, 18, 4249–4258. [Google Scholar] [CrossRef] [Green Version]
  53. Fan, L.; Qi, H.; Teng, J.; Su, B.; Chen, H.; Wang, C.; Xia, Q. Identification of serum miRNAs by nano-quantum dots microarray as diagnostic biomarkers for early detection of non-small cell lung cancer. Tumour Biol. 2016, 37, 7777–7784. [Google Scholar] [CrossRef] [PubMed]
  54. Wu, B.; Liu, G.; Jin, Y.; Yang, T.; Zhang, D.; Ding, L.; Zhou, F.; Pan, Y.; Wei, Y. miR-15b-5p Promotes Growth and Metastasis in Breast Cancer by Targeting HPSE2. Front. Oncol. 2020, 10, 108. [Google Scholar] [CrossRef] [PubMed] [Green Version]
  55. Chen, R.; Sheng, L. miR-15b-5p facilitates the tumorigenicity by targeting RECK and predicts tumour recurrence in prostate cancer. J. Cell Mol. Med. 2018, 22, 1855–1863. [Google Scholar] [CrossRef] [PubMed] [Green Version]
  56. Tordjman, J.; Majumder, M.; Amiri, M.; Hasan, A.; Hess, D.; Lala, P.K. Tumor suppressor role of cytoplasmic polyadenylation element binding protein 2 (CPEB2) in human mammary epithelial cells. BMC Cancer 2019, 19, 561. [Google Scholar] [CrossRef] [Green Version]
  57. Liu, M.; Xu, Z.; Du, Z.; Wu, B. The Identification of Key Genes and Pathways in Glioma by Bioinformatics Analysis. J. Immunol. Res. 2017, 2017, 1278081. [Google Scholar] [CrossRef] [Green Version]
  58. Marwitz, S.; Depner, S.; Dvornikov, D.; Merkle, R.; Szczygieł, M.; Müller-Decker, K.; Lucarelli, P.; Wäsch, M.; Mairbäurl, H.; Rabe, K.F.; et al. Downregulation of the TGFβ Pseudoreceptor BAMBI in Non-Small Cell Lung Cancer Enhances TGFβ Signaling and Invasion. Cancer Res. 2016, 76, 3785–3801. [Google Scholar] [CrossRef] [Green Version]
  59. Wang, X.; Li, M.; Hu, M.; Wei, P.; Zhu, W. BAMBI overexpression together with β-sitosterol ameliorates NSCLC via inhibiting autophagy and inactivating TGF-β/Smad2/3 pathway. Oncol. Rep. 2017, 37, 3046–3054. [Google Scholar] [CrossRef] [Green Version]
  60. Yu, L.; Li, J.J.; Liang, X.L.; Wu, H.; Liang, Z. PSME3 Promotes TGFB1 Secretion by Pancreatic Cancer Cells to Induce Pancreatic Stellate Cell Proliferation. J. Cancer 2019, 10, 2128–2138. [Google Scholar] [CrossRef] [Green Version]
  61. Song, W.; Guo, C.; Chen, J.; Duan, S.; Hu, Y.; Zou, Y.; Chi, H.; Geng, J.; Zhou, J. Silencing PSME3 induces colorectal cancer radiosensitivity by downregulating the expression of cyclin B1 and CKD1. Exp. Biol. Med. 2019, 244, 1409–1418. [Google Scholar] [CrossRef] [PubMed]
  62. Li, L.; Fan, Y.; Huang, X.; Luo, J.; Zhong, L.; Shu, X.S.; Lu, L.; Xiang, T.; Chan, A.T.C.; Yeo, W.; et al. Tumor Suppression of Ras GTPase-Activating Protein RASA5 through Antagonizing Ras Signaling Perturbation in Carcinomas. Iscience 2019, 21, 1–18. [Google Scholar] [CrossRef] [PubMed] [Green Version]
  63. Albert, J.M.; Gonzalez, A.; Massion, P.P.; Chen, H.; Olson, S.J.; Shyr, Y.; Diaz, R.; Lambright, E.S.; Sandler, A.; Carbone, D.P.; et al. Cytoplasmic clusterin expression is associated with longer survival in patients with resected non small cell lung cancer. Cancer Epidemiol. Biomark. Prev. 2007, 16, 1845–1851. [Google Scholar] [CrossRef] [Green Version]
  64. Chen, Z.; Fan, Z.; Dou, X.; Zhou, Q.; Zeng, G.; Liu, L.; Chen, W.; Lan, R.; Liu, W.; Ru, G.; et al. Inactivation of tumor suppressor gene Clusterin leads to hyperactivation of TAK1-NF-κB signaling axis in lung cancer cells and denotes a therapeutic opportunity. Theranostics 2020, 10, 11520–11534. [Google Scholar] [CrossRef] [PubMed]
  65. Walker, S.R.; Abdelsalam, R.; Ghosh, S.; Livingstone, J.; Palanisamy, N.; Boutros, P.C.; Yip, S.M.; Lees-Miller, S.P.; Bismar, T.A. Decreased ATM Protein Expression Is Substantiated with PTEN Loss in Defining Aggressive Phenotype of Prostate Cancer Associated with Lethal Disease. Eur. Urol. Open Sci. 2021, 29, 93–101. [Google Scholar] [CrossRef]
  66. Wu, Q.; Wang, H.; Liu, L.; Zhu, K.; Yu, W.; Guo, J. Hsa_circ_0001546 acts as a miRNA-421 sponge to inhibit the chemoresistance of gastric cancer cells via ATM/Chk2/p53-dependent pathway. Biochem. Biophys. Res. Commun. 2020, 521, 303–309. [Google Scholar] [CrossRef]
  67. Xu, X.; Gao, H.; Qin, J.; He, L.; Liu, W. TMP21 modulates cell growth in papillary thyroid cancer cells by inducing autophagy through activation of the AMPK/mTOR pathway. Int. J. Clin. Exp. Pathol. 2015, 8, 10824–10831. [Google Scholar]
  68. Wang, X.; Duan, J.; Fu, W.; Yin, Z.; Sheng, J.; Lei, Z.; Wang, H. Decreased expression of NEDD4L contributes to NSCLC progression and metastasis. Biochem. Biophys. Res. Commun. 2019, 513, 398–404. [Google Scholar] [CrossRef]
  69. Bhushan, A.; Kumari, R.; Srivastava, T. Scouting for common genes in the heterogenous hypoxic tumor microenvironment and their validation in glioblastoma. 3 Biotech 2021, 11, 451. [Google Scholar] [CrossRef]
  70. Nalairndran, G.; Hassan Abdul Razack, A.; Mai, C.W.; Fei-Lei Chung, F.; Chan, K.K.; Hii, L.W.; Lim, W.M.; Chung, I.; Leong, C.O. Phosphoinositide-dependent Kinase-1 (PDPK1) regulates serum/glucocorticoid-regulated Kinase 3 (SGK3) for prostate cancer cell survival. J. Cell Mol. Med. 2020, 24, 12188–12198. [Google Scholar] [CrossRef]
  71. Liu, F.; Wu, X.; Jiang, X.; Qian, Y.; Gao, J. Prolonged inhibition of class I PI3K promotes liver cancer stem cell expansion by augmenting SGK3/GSK-3β/β-catenin signalling. J. Exp. Clin. Cancer Res. 2018, 37, 122. [Google Scholar] [CrossRef] [Green Version]
  72. Xie, D.; Luo, X. Identification of four methylation-driven genes as candidate biomarkers for monitoring single-walled carbon nanotube-induced malignant transformation of the lung. Toxicol. Appl. Pharmacol. 2021, 412, 115391. [Google Scholar] [CrossRef]
  73. Zhu, L.; Wang, Y.; Lv, W.; Wu, X.; Sheng, H.; He, C.; Hu, J. Schizandrin A can inhibit non-small cell lung cancer cell proliferation by inducing cell cycle arrest, apoptosis and autophagy. Int. J. Mol. Med. 2021, 48, 214. [Google Scholar] [CrossRef]
  74. Bae, J.M. Serum Folate Levels and Lung Cancer Risk: A Meta-Epidemiological Study of Population-based Case-Control Studies. Asian Pac. J. Cancer Prev. 2020, 21, 1829–1833. [Google Scholar] [CrossRef]
  75. Charoenngam, N.; Ponvilawan, B.; Ungprasert, P. Higher zinc intake is associated with decreased risk of lung cancer. J. Evid. Based Med. 2021, 14, 185–187. [Google Scholar] [CrossRef]
  76. De Bravo, M.G.; Tournier, H.; Schinella, G.; Viaggi, M.; Quintans, C. Effect of dietary supplementation with gamma-linolenic acid on the growth of a human lung carcinoma implanted in nude mice. Medicina 1995, 55, 670–674. [Google Scholar]
  77. Wang, Y.; Shi, J.; Gong, L. Gamma linolenic acid suppresses hypoxia-induced proliferation and invasion of non-small cell lung cancer cells by inhibition of HIF1α. Genes Genom. 2020, 42, 927–935. [Google Scholar] [CrossRef]
  78. Barbarino, M.; Giordano, A. Assessment of the Carcinogenicity of Carbon Nanotubes in the Respiratory System. Cancers 2021, 13, 1318. [Google Scholar] [CrossRef]
Figure 1. Determination of the best soft-threshold power in the WGCNA. (A) Analysis of the scale-free fit index for various soft-threshold powers (from 1 to 28); (B) analysis of the mean connectivity for various soft-threshold powers (from 1 to 28); (C) the histogram of k; (D), the correlation coefficient between k and p (k) to check the scale-free topology when β = 13.
Ijerph 19 02936 g001
Figure 2. Identification of modules associated with CNT-induced malignant transformation of lung cells. (A) A clustering dendrogram obtained from data of the GSE41178 dataset; (B) a clustering dendrogram obtained from data of the GSE56104 dataset; (C) the preservation median rank of co-expression modules; (D): module–trait associations. Each row corresponds to a module eigengene (ME) and each column to a trait. Each cell contains the corresponding correlation (r) and p-value; (E) scatter plot showing the correlation of gene significance versus module membership for genes in the turquoise module.
Ijerph 19 02936 g002
Figure 3. Heatmap of the expression levels of all differentially expressed lncRNAs, pseudogenes and mRNAs between CNT-exposed and control SAECs. (A) The difference between SWCNT-exposed and control SAECs; (B) the difference between MWCNT-exposed and control SAECs. SWCNT, single-walled carbon nanotube; MWCNT, multiple-walled carbon nanotube; red, high expression; blue, low expression.
Ijerph 19 02936 g003
Figure 4. Validation of the expression levels of lncRNAs and pseudogenes in lung cancer. N = 50 or 59 indicates the controls are match TCGA normal data; N = 338 or 347 indicates the controls are match TCGA normal and GTEx data; asterisk (*) indicates the statistical significance at the threshold of |log2FC| > 0.5 and p-value < 0.05.
Ijerph 19 02936 g004
Figure 5. Validation of the prognosis of lncRNAs in lung cancer. (A) LINC00174. Prediction for overall survival of LUAD patients by analysis of TCGA data; (B) LOC644656. Prediction for recurrence-free survival of LUAD patients by analysis of TCGA data; (CF) MEG3 (C), LINC00863 (D), LINC00174 (E) and WDFY3-AS2 (F). Prediction for recurrence-free survival of LUSC patients by analysis of TCGA data; (G,H) PVT1 (G) and WDFY3-AS2 (H). Prediction for overall survival of all lung cancer patients by analysis of chip data; (I) ARHGAP5-AS1. Prediction for first-progression survival of all lung cancer patients by analysis of chip data. HR, hazard ratio; LUAD, lung adenocarcinoma; LUSC, lung squamous cell carcinoma; TCGA, the Cancer Genome Atlas.
Ijerph 19 02936 g005
Figure 6. Validation of the prognosis of pseudogenes in lung cancer. (AC) MT1JP (A), RPL23AP64 (B) and ZNF826P (C). Prediction for overall survival of LUAD patients by analysis of TCGA data; (D) TMEM198B. Prediction for overall survival of LUAD patients by analysis of TCGA data; (E,F) MT1JP (E) and MT1L (F). Prediction for recurrence-free survival of LUSC patients by analysis of TCGA data. HR, hazard ratio; LUAD, lung adenocarcinoma; LUSC, lung squamous cell carcinoma; TCGA, the Cancer Genome Atlas.
Ijerph 19 02936 g006
Figure 7. Functions of hub lncRNAs and pseudogenes. (A) ceRNA regulatory networks for hub lncRNAs and pseudogenes; (B) co-expression regulatory networks for hub lncRNAs and pseudogenes; (C) Gene ontology for target mRNAs of hub lncRNAs and pseudogenes; (D) KEGG pathway enrichment analysis for target mRNAs of hub lncRNAs and pseudogenes. ceRNA, competing endogenous RNA. Hexagon indicates lncRNAs and pseudogenes; rhombus indicates miRNAs; ellipse indicates mRNAs; red, upregulation; green, downregulation.
Ijerph 19 02936 g007
Figure 8. Diagnostic biomarkers and drug targets. (A,B) Diagnostic potential analysis of hub lncRNAs and pseudogenes. (A) Analysis of LUAD samples in TCGA database; (B) analysis of LUSC samples in TCGA database; (C) Drugs that reversed the expression levels of hub lncRNAs and pseudogenes in cancer, increased the expression or decreased the expression. Red, upregulated lncRNAs and pseudogenes; green, downregulated lncRNAs and pseudogenes; blue, drugs. LUAD, lung adenocarcinoma; LUSC, lung squamous cell carcinoma; TCGA, the Cancer Genome Atlas.
Ijerph 19 02936 g008
Table 1. The expression levels of crucial genes.
GSE41178 (SWCNT vs. Control)GSE41178 (MWCNT vs. Control)
Log2FCFDRLog2FCFDR
lncRNAsARHGAP5-AS11.463.91 × 1041.465.35 × 104
PVT10.71.04 × 1031.142.86 × 104
LINC00174−1.233.31 × 104−1.012.14 × 103
MEG3−1.091.44 × 102−1.372.00 × 103
PseudogenesMT1L−1.97.49 × 105−1.776.05 × 105
ZNF826P−1.196.06 × 103−1.243.38 × 103
MT1JP−0.875.15 × 104−1.212.86 × 104
RPL23AP64−0.782.63 × 103−0.991.62 × 103
TMEM198B−0.663.94 × 103−0.544.41 × 103
mRNAsNIP70.663.56 × 1030.758.43 × 104
TMED100.614.28 × 1030.616.93 × 103
PSME30.608.01 × 1040.575.52 × 103
CPEB2−3.296.40× 105−3.251.63 × 104
CLU−2.772.49 × 105−1.873.67 × 105
ATM−2.263.58 × 104−1.73.58 × 104
SGK3−2.043.89× 105−2.083.19 × 105
SYNGAP1−1.456.28 × 104−1.081.50 × 103
BAMBI−1.347.39 × 105−1.22.23 × 104
NEDD4L−1.294.58 × 105−0.861.43 × 103
PHF21A−1.159.71 × 105−0.796.65 × 103
FC, fold change; FDR, false discovery rate; SWCNT, single-walled carbon nanotube; MWCNT, multiple-walled carbon nanotube.
Table 2. Topological characteristics of target genes regulated by lncRNAs in the PPI network.
GenesDCGenesBCGenesCCGenesECGenesLACGenesICGenesSC
MYC89MYC69325.03MYC0.046924MYC0.345324COL4A211.14286MYC4.519095MYC3.95 × 107
ATM53CASP328914.29CASP30.046573HIST2H3PS20.232677COL6A110.95652ATM4.37312HIST2H3PS21.79 × 107
HIST2H3PS249ATM26878.67ATM0.046346CASP30.218635COL11A110.88889HIST2H3PS24.345062CASP31.58 × 107
CASP349PPARG21315.25HIST2H3PS20.046318ATM0.213316COL6A210.34783CASP34.345062ATM1.51 × 107
PPARG40HIST2H3PS217839.02PPARG0.046209CCNB10.196486COL5A210.2PPARG4.263963CCNB11.28 × 107
CCNB137NRAS16979.76NRAS0.046184CHEK10.175156COL1A19.67742CCNB14.229326CHEK11.02 × 107
NRAS36PTK215259.33CCNB10.046091AURKA0.154292COL6A39.636364NRAS4.216698AURKA7896703
CHEK134AURKA15109.43SMAD20.046085FOS0.145202NID18.923077CHEK14.189493FOS6983669
AURKA33SMAD214891.42FOS0.046038CCND20.137003CCNB18.648648AURKA4.17482CCND26221439
SMAD232HSPA912724.54SP10.04601NRAS0.13518LAMC18.6SMAD24.159399NRAS6054038
FOS31TJP112550.71SOD20.045982CCNE20.135058CHEK18.588235COL1A14.14313CCNE26049281
WDR531TGFBR111898.11PTK20.045967PPARG0.13326LAMA48.5FOS4.14313PPARG5887511
COL1A131UBE2I11854.41CHEK10.045967RBBP40.12862HIST2H3PS28.408163WDR54.14313RBBP45483687
RBBP430RERE11608.05RBBP40.045964LMNB10.124717MYC8.314607PTK24.125951LMNB15156968
PTK230SOD211343.42UBE2I0.045952SMAD20.121389COL18A17.888889RBBP44.125951SMAD24895097
HSPA930FOS10771.87AURKA0.045945SP10.117861LEPREL17.818182HSPA94.125951SP14601198
UBE2I29TMED1010569.32CCNE20.045884WDR50.112875COL8A17.5UBE2I4.107765WDR54226990
AGO227RBBP410403.83TGFBR10.045859PLK40.111689FBN17.428571AGO24.068093PLK44140534
CCNE226DMD10381.87SIRT70.045847RAD210.110684COL11A27.375CCNE24.046388RAD214063987
NUP9826WDR510283.43CCND20.045826MCL10.110118CCND27.363637NUP984.046388MCL14018060
TGFBR125CHEK110165.99AGO20.045816NUP980.109068CASP36.979592TGFBR14.023259NUP983947886
SP123TFRC9382.314TJP10.045813UBE2I0.10781CCNE26.923077COL6A13.972192UBE2I3852734
SOD223COL1A19344.245RAD210.04581TOP10.106882NUP1336.833334COL6A23.972192TOP13787653
TJP123CCNB19142.68WDR50.045786AGO20.104175RAD51AP16.714286FH3.972192AGO23599771
NCBP223TXNRD18277.166HSPA90.04578ATAD20.098454AURKA6.606061ACLY3.972192PTK23242236
FH23PPP6C7909.077AKT30.04578PTK20.097769PLK46.454546SP13.972192ATAD23214702
ACLY23SP17895.044FGFR20.045773DTL0.095207NDC16.428571SOD23.972192DTL3011290
COL6A123FGFR27834.322NUP980.045773RNF20.091295ATM6.415094NCBP23.972192RNF22763911
COL6A223CCT37686.299PGK10.045767CDC270.089433MCL16.375TJP13.972192CDC272653227
CCND222CCNE27528.156TOP10.045758MYBL20.0881ATAD26.375COL6A33.943907MYBL22572502
PLK422ITCH7308.306PRKCD0.045749KAT6A0.087586DTL6.363637CCND23.943907KAT6A2543617
DTL22CSF27290.804LMNB10.045749AKT30.081991LEPREL26.285714PLK43.943907AKT32227275
PGK122PINK17266.99MCL10.045734PAX60.080551LMNB16.210527DTL3.943907COL1A12210530
COL6A322AKT37194.102RUNX10.045715SIRT70.080551ITGA76.166667PGK13.943907SIRT72151882
CCT322AGO26931.627EPAS10.045691AGO10.080408NUP506.117647CCT33.943907PAX62149573
TOP121UBQLN16730.845PAX60.045688RCOR10.07753NUP986.076923COL4A23.91349AGO12144101
RNF221ACLY6575.635RNF20.045679PTCH10.077235HK26TOP13.91349RCOR11993021
AGO121GOLPH36248.143AGO10.045664COL1A10.076574FH6RNF23.91349PTCH11976036
COL4A221PLK46190.994PTCH10.045651SOD20.076143SERPINH15.888889AGO13.91349SOD21923597
ABCE121SERPINH16138.03PAK20.045648TGFBR10.075727CS5.75ABCE13.91349TGFBR11910805
RAD2120MAPRE36080.12YES10.045648RUNX10.075226GPI5.733333COL5A23.880701RUNX11875071
AKT320EPAS15907.968KAT6A0.045639RAD51AP10.073014PGK15.727273LAMC13.880701RAD51AP11771838
EPAS120PAK25893.081COL1A10.045636CCNH0.072743MYBL25.571429RAD213.880701CCNH1754899
ITCH20SRPR5857.721PLK40.045609FGFR20.070863ACLY5.565218DMD3.880701FGFR21663734
LAMC120ABCE15784.403MAX0.045606PGK10.070127FOS5.548387TXNRD13.880701PGK11635160
DMD20PPL5654.79CDC270.045603EPAS10.069382PTK25.533333AKT33.880701EPAS11595363
COL5A220BCL25523.898ITCH0.045597TJP10.068124SEH1L5.466667EPAS13.880701TJP11540930
TXNRD120RAD215511.951TFRC0.045591CSF20.068085SMAD25.4375ITCH3.880701CSF21535941
TMED1020PGK15500.145MYBL20.045579PRKCD0.066951AGO25.333334TMED103.880701PRKCD1485477
LMNB119SLC25A335496.237PSME30.045572MAX0.065213NIP75.333334LMNB13.845279TGFB31411799
FGFR219NEDD4L5484.699TGFB30.045566TGFB30.064884TRMT115.230769NEDD4L3.845279MAX1409118
NEDD4L19CCNH5324.429ACLY0.04556NCBP20.064605SP15.217392FGFR23.845279NCBP21385477
RUNX118F11R5165.416NCBP20.045551HSPA90.064468RCOR15.142857COL11A13.806871HSPA91381436
CCNH18FH5138.533ATAD20.045548HK20.0622NRAS5.111111COL18A13.806871HK21286048
DDX1818AGO15105.469NEDD4L0.045542HIST1H3J0.061885RAD215.1SERPINH13.806871HIST1H3J1270916
COL18A118DDX185075.202GOLPH30.045539NFYA0.06188PNO15.058824DDX183.806871NFYA1268920
COL11A118SIRT75028.431HK20.045539NDC10.061369RBBP45CCNH3.806871NDC11251614
SERPINH118NCBP24760.606CCNH0.045527MDM40.060536TGFB35RUNX13.806871MDM41214375
CDC2717TCEA14649.523CSF20.045521PAK20.06015NOC3L5NUP503.765087PAK21205645
KAT6A17CCND24621.744RCOR10.045521POLE30.060104RBM195HK23.765087POLE31200180
DC, degree centrality; BC, betweenness centrality; CC, closeness centrality; EC, eigenvector centrality; LAC, local average connectivity; IC, information centrality; SC, subgragh centrality; PPI, protein–protein interaction.
Table 3. Topological characteristics of target genes regulated by pseudogenes in the PPI network.
GenesDCGenesBCGenesCCGenesECGenesLACGenesICGenesSC
HIST2H3PS224IGF112,657.02IGF10.020131HIST2H3PS20.336233HIST2H2AB8.666667HIST2H3PS22.791786HIST2H3PS215879.49
ATM23ATM10,286.39ATM0.020117HIST1H4F0.293143HIST2H3D8.533334ATM2.778953HIST1H4F12090.06
IGF121ICAM18398.269NFKBIA0.020094HIST3H30.282137HIST1H1E8.4IGF12.750203HIST3H311213.9
HIST1H4F18NFKBIA6650.969HIST2H3PS20.020077HIST2H3D0.273608HIST1H3J8.307693HIST1H4F2.697331HIST2H3D10568.27
CCL218HIST2H3PS25622.567ICAM10.020076HIST1H2AJ0.269709HIST3H38.125CCL22.697331HIST1H2AJ10266.41
NFKBIA17CCL25539.708IKBKB0.020066HIST2H2AB0.2494HIST1H2AI8NFKBIA2.676373HIST2H2AB8764.285
HIST3H316TUBB4A5141.43SOD20.020055HIST1H3J0.247382HIST1H2AJ7.625HIST3H32.65333HIST1H3J8645.107
HIST1H2AJ16IKBKB5052.972CCL20.020028ATM0.233653HIST1H4F7.555555HIST1H2AJ2.65333ATM7783.067
HIST2H3D15RCVRN4885.731PAX60.020013HIST1H2AI0.220319HIST1H1A7.4HIST2H3D2.627873HIST1H2AI6837.918
POU5F114SOD24803.247POU5F10.020007HIST1H1E0.217499HIST2H3PS26.75POU5F12.599608HIST1H1E6684.745
ICAM114AKT34681.91TUBB4A0.020004HIST1H1A0.209097HIST1H2AD5.333334ICAM12.599608HIST1H1A6168.202
HIST1H3J13CCND24486.447AKT30.020001HIST1H2AD0.19763PHF21A5.333334HIST1H3J2.568042HIST1H2AD5525.728
IKBKB13CD594309.046CSF20.019999PHF21A0.176246TNFAIP34.25IKBKB2.568042PHF21A4369.904
HIST2H2AB12POU5F13915.681CCND20.019997WHSC10.160865WHSC14HIST2H2AB2.532561WHSC13640.597
HIST1H2AD12WWC13888.129FGFR10.019978KAT6A0.150582IKBKB3.846154HIST1H2AD2.532561KAT6A3188.971
PAX611CDK53827.028FGFR20.019959CBX60.137474ATM3.826087PAX62.492376CBX62673.861
SOD211CSF23700.629WWC10.019931IGF10.112766KAT6A3.75SOD22.492376IGF12112.217
CSF211KIF5C3555.034HIST1H4F0.01993POU5F10.102878CBX63.5CSF22.492376POU5F11541.507
RCVRN11PAX63298.453RCVRN0.019922PAX60.100751CCL23.333333RCVRN2.492376PAX61454.034
HIST1H2AI10WWOX2962.674TNFAIP30.019909AIRE0.096106TUBB83.2HIST1H2AI2.446504NFKBIA1431.716
HIST1H1E10ZNF3952778.826WWOX0.019906CCND20.089509NFKBIA3.058824HIST1H1E2.446504IKBKB1324.191
HIST1H1A10TGM12707.593TUBA1A0.019905NFKBIA0.087309AIRE3HIST1H1A2.446504AIRE1304.235
CCND210SYN32563.518CDK50.01989IKBKB0.084984SOD22.909091CCND22.446504CCND21161.27
TUBB4A10GNG122428.181BCL20.019888CTBP10.074958ICAM12.857143TUBB4A2.446504CTBP1804.1904
PHF21A9FZR12387.046SIRPA0.01988TET30.06408TUBA1A2.857143PHF21A2.393643CCL2775.7595
WHSC19CAMK1G2352.95CTBP10.019877AKT30.059664TUBA4A2.666667WHSC12.393643SOD2677.2321
AKT39CAV32350.628KAT6A0.019877FGFR20.058941IGF12.571429AKT32.393643ICAM1610.6983
KAT6A8MYO5B2350.244ZC3H12A0.019873SOD20.056252TUBB4A2.4KAT6A2.332049TET3582.8483
CBX68XCL12339.667HIST3H30.019869EYA20.052028VAMP12.4CBX62.332049AKT3560.5861
FGFR28EXOC42334.192THPO0.019866WWC10.050389CSF22.363636FGFR22.332049FGFR2529.6174
FGFR18COPZ21880EYA20.019866TAL10.048814CCND22FGFR12.332049CSF2405.3018
TNFAIP38KCND31875.697WHSC10.019865CCL20.048485ZC3H12A2TNFAIP32.332049EYA2384.0464
CDK58CCK1872PHF21A0.019863FGFR10.047015SIRPA2CDK52.332049WWC1368.5083
KIF5C8LIN7C1762.686IGFBP30.019861TNRC6C0.046971NFKBIE2KIF5C2.332049FGFR1354.2804
VAMP88FGFR11600.013HIST2H2AB0.019858ICAM10.044627TNIP22VAMP82.332049TNFAIP3343.6676
CTBP17RAB11FIP51546.701HIST1H2AI0.019855ERCC60.044454SYT172CTBP12.259382TAL1341.3784
WWC17F11R1532.283HOXB70.019852TUBA1A0.03925LCE1D2WWC12.259382TNRC6C314.0037
TUBA1A7F71457.162ADRBK10.019851CSF20.037267LCE1F2TUBA1A2.259382ERCC6280.5435
WWOX7UBE2K1414HIST1H2AJ0.019841TNFAIP30.032499POU5F11.857143WWOX2.259382TUBA1A252.0046
CD597TCEAL61411CLU0.01984CDK50.030225FGFR21.75GNG122.259382ZC3H12A188.933
GNG127WDFY21410ERCC60.019832WWOX0.02852FGFR11.75CD592.259382TUBB4A185.0031
CAV37CREB3L31407.115HIST1H1A0.019829TUBB4A0.02729VAMP81.75CAV32.259382CDK5147.8962
ZC3H12A6BID1394.544TET30.019826ZC3H12A0.027068CTBP11.714286ZC3H12A2.172348WWOX136.4548
BID6RGMA1341.624CD590.019821FOXP10.02444SYN31.666667BID2.172348SIRPA98.61929
BCL26CACNA1E1306.522CADM10.019819TACC30.02356AKT31.555556BCL22.172348FOXP196.34972
TUBA4A6SOD31285.36NRG10.019818BID0.0221TET31.5TUBA4A2.172348RCVRN90.32636
SYN36VAMP81285.289HIST2H3D0.019818FGFRL10.01855IGFBP31.5EXOC42.172348TACC386.21384
EXOC46TUBA1A1254.487CSH10.019812SIRPA0.01763KCND31.5SYN32.172348NFKBIE83.78503
TGM16CLU1220.285HIST1H3J0.019812RCVRN0.017589PKP21.5TGM12.172348TNIP283.78503
TAL15BCL21190.642BID0.019811BCL20.017578TUBA3C1.5FOXP12.066228BID81.1344
FOXP15FNDC51174.097FNDC50.01981ZIC10.017441PPL1.5F72.066228IGFBP369.96769
TUBB85SPTB1171.549SGK30.01981NFKBIE0.017346PAX61.454546VAMP12.066228BCL266.91744
FZR15ZIC11159.743HAND20.019808TNIP20.017346RCVRN1.454546TAL12.066228FGFRL151.49969
CLU5SYNGAP11106.794IGFBP50.019805HOXB70.016011BCL21.333333FZR12.066228THPO51.38118
VAMP15PLAT1016.892PLAT0.019797IGFBP30.015366PTX31.333333CLU2.066228ZIC150.78407
SYT115CTBP1992.8071HIST1H2AD0.019796THPO0.013824RGMB1.333333TUBB82.066228CADM150.12931
SCN1B5CABP4974.4585LIN7C0.019793NRG10.013609TCEAL21.333333SYT112.066228HOXB746.41033
F75SCN1B959.0853NFKBIE0.019793FZR10.012277FOXP11.2CACNA1E2.066228PTX345.3798
CACNA1E5NLGN2958.3921TNIP20.019793HAND20.011935SYT111.2SCN1B2.066228TUBA4A40.56611
AIRE4CBX6949.5727TUBA4A0.01979PCGF30.011594SCN1B1.2AIRE1.933961PLAT39.07808
DC, degree centrality; BC, betweenness centrality; CC, closeness centrality; EC, eigenvector centrality; LAC, local average connectivity; IC, information centrality; SC, subgragh centrality; PPI, protein–protein interaction.
Table 4. Diagnostic values of our identified lncRNAs and pseudogenes.
AUCSensitivity (%)Specificity (%)
LUADARHGAP5-AS10.59530.65100.00
LINC001740.73353.6483.05
MEG30.62040.7584.75
PVT10.97488.9794.42
MEG3 + ARHGAP5-AS1 + LINC00174 + PVT10.97693.8391.53
MT1JP0.85577.5784.75
MT1L0.74357.7696.61
RPL23AP640.51228.7979.66
TMEM198B0.57936.2688.14
ZNF826P0.51940.5691.53
MT1L + MT1JP + RPL23AP64 + TMEM198B + ZNF826P0.83489.3566.10
All lncRNAs+all pseudogenes0.97794.3989.93
LUSCARHGAP5-AS10.76854.1893.88
LINC001740.76858.3785.71
MEG30.52546.6171.43
PVT10.97595.2291.84
MEG3+ARHGAP5-AS1+LINC00174+PVT10.99093.8295.92
MT1JP0.93984.0693.88
MT1L0.79565.9495.92
RPL23AP640.72166.5369.39
TMEM198B0.54125.5095.92
ZNF826P0.76566.3391.84
MT1L + MT1JP + RPL23AP64 + TMEM198B + ZNF826P0.92586.0687.76
All lncRNAs+all pseudogenes0.99495.4297.96
LUAD, lung adenocarcinoma; LUSC, lung squamous cell carcinoma; AUC, the area under the receiver operating characteristic curve.
Publisher’s Note: MDPI stays neutral with regard to jurisdictional claims in published maps and institutional affiliations.

