
Can El Niño–Southern Oscillation Increase Respiratory Infectious Diseases in China? An Empirical Study of 31 Provinces


Abstract
:1. Introduction
2. Literature Review
2.1. The Impact of ENSO on Infectious Diseases
2.2. The Moderating Effect of Income Factors
2.3. The Moderating Effect of Education Factors
3. Data
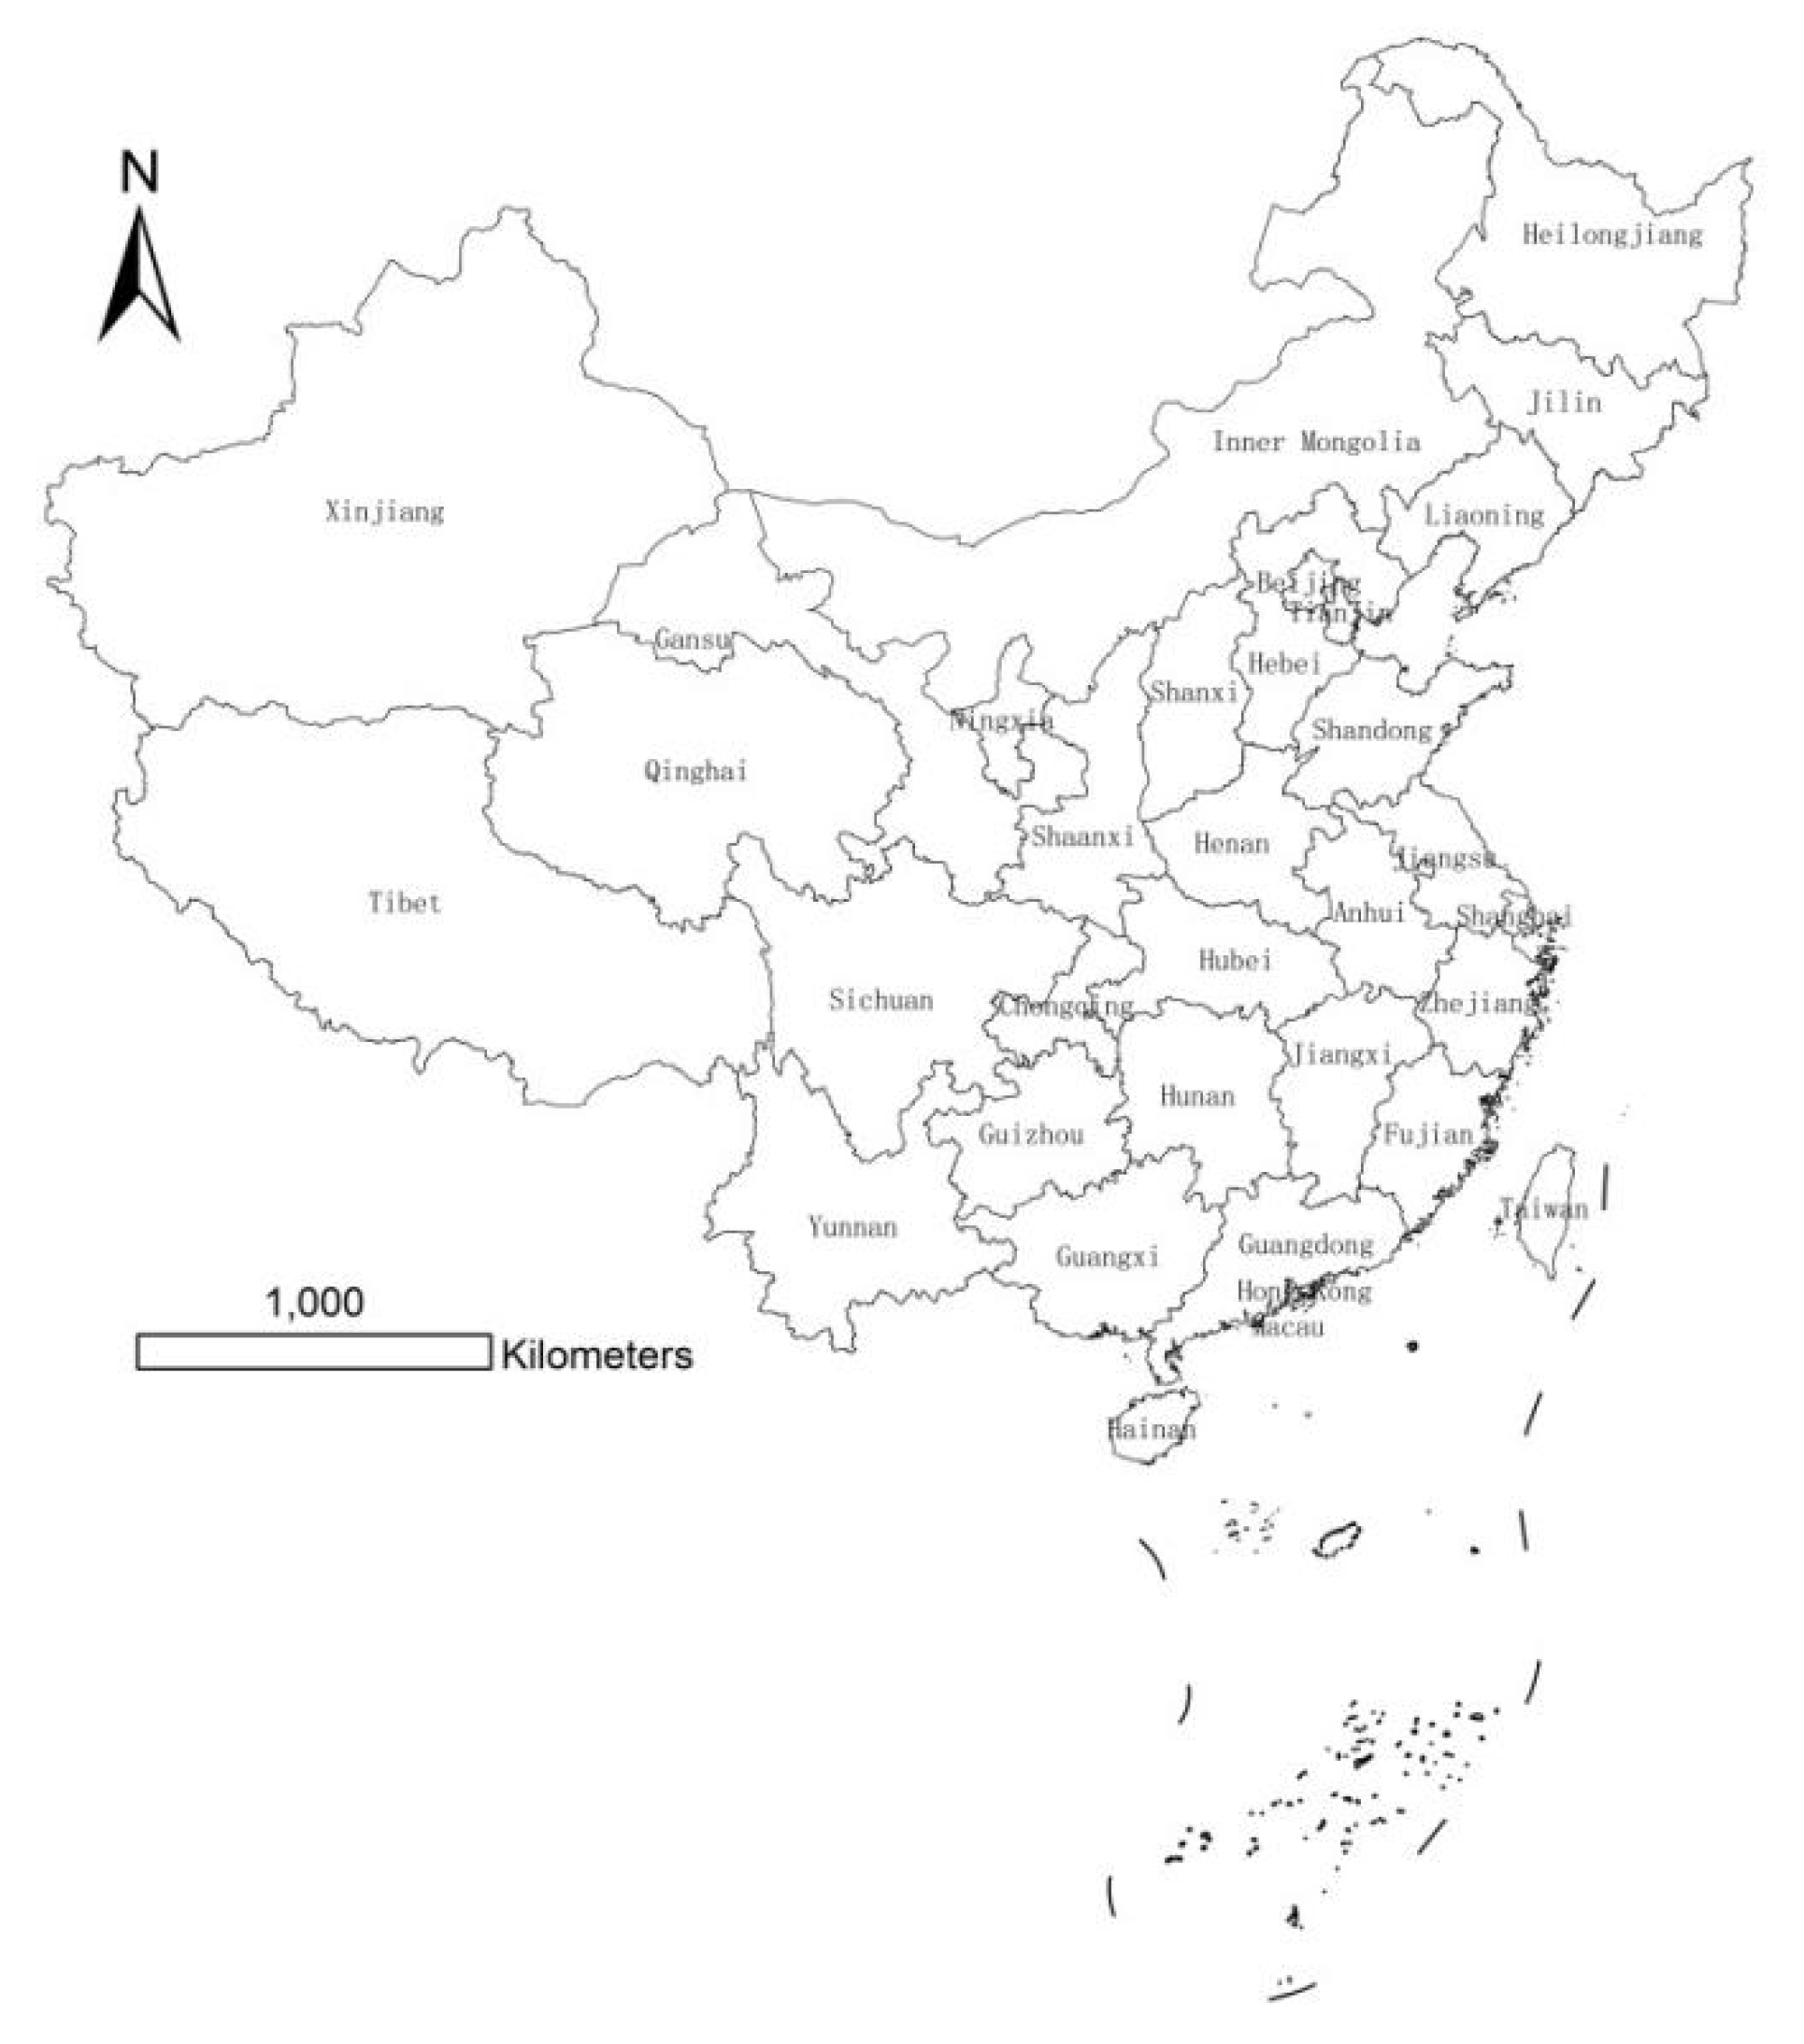
3.1. Study Area
3.2. Variables
3.2.1. Dependent Variables
3.2.2. Core Independent Variables
3.2.3. Control Variables
3.3. Descriptive Statistics
4. Model
4.1. Model Setting
4.2. Endogenous Analysis
4.3. Granger Causality Test
5. Model Results and Discussion
5.1. Does ENSO Have a Significant and Positive Impact on RID Morbidity?
5.2. Does Per Capita Disposable Income Have a Moderating Effect on the Relationship between ENSO and RID Morbidity?
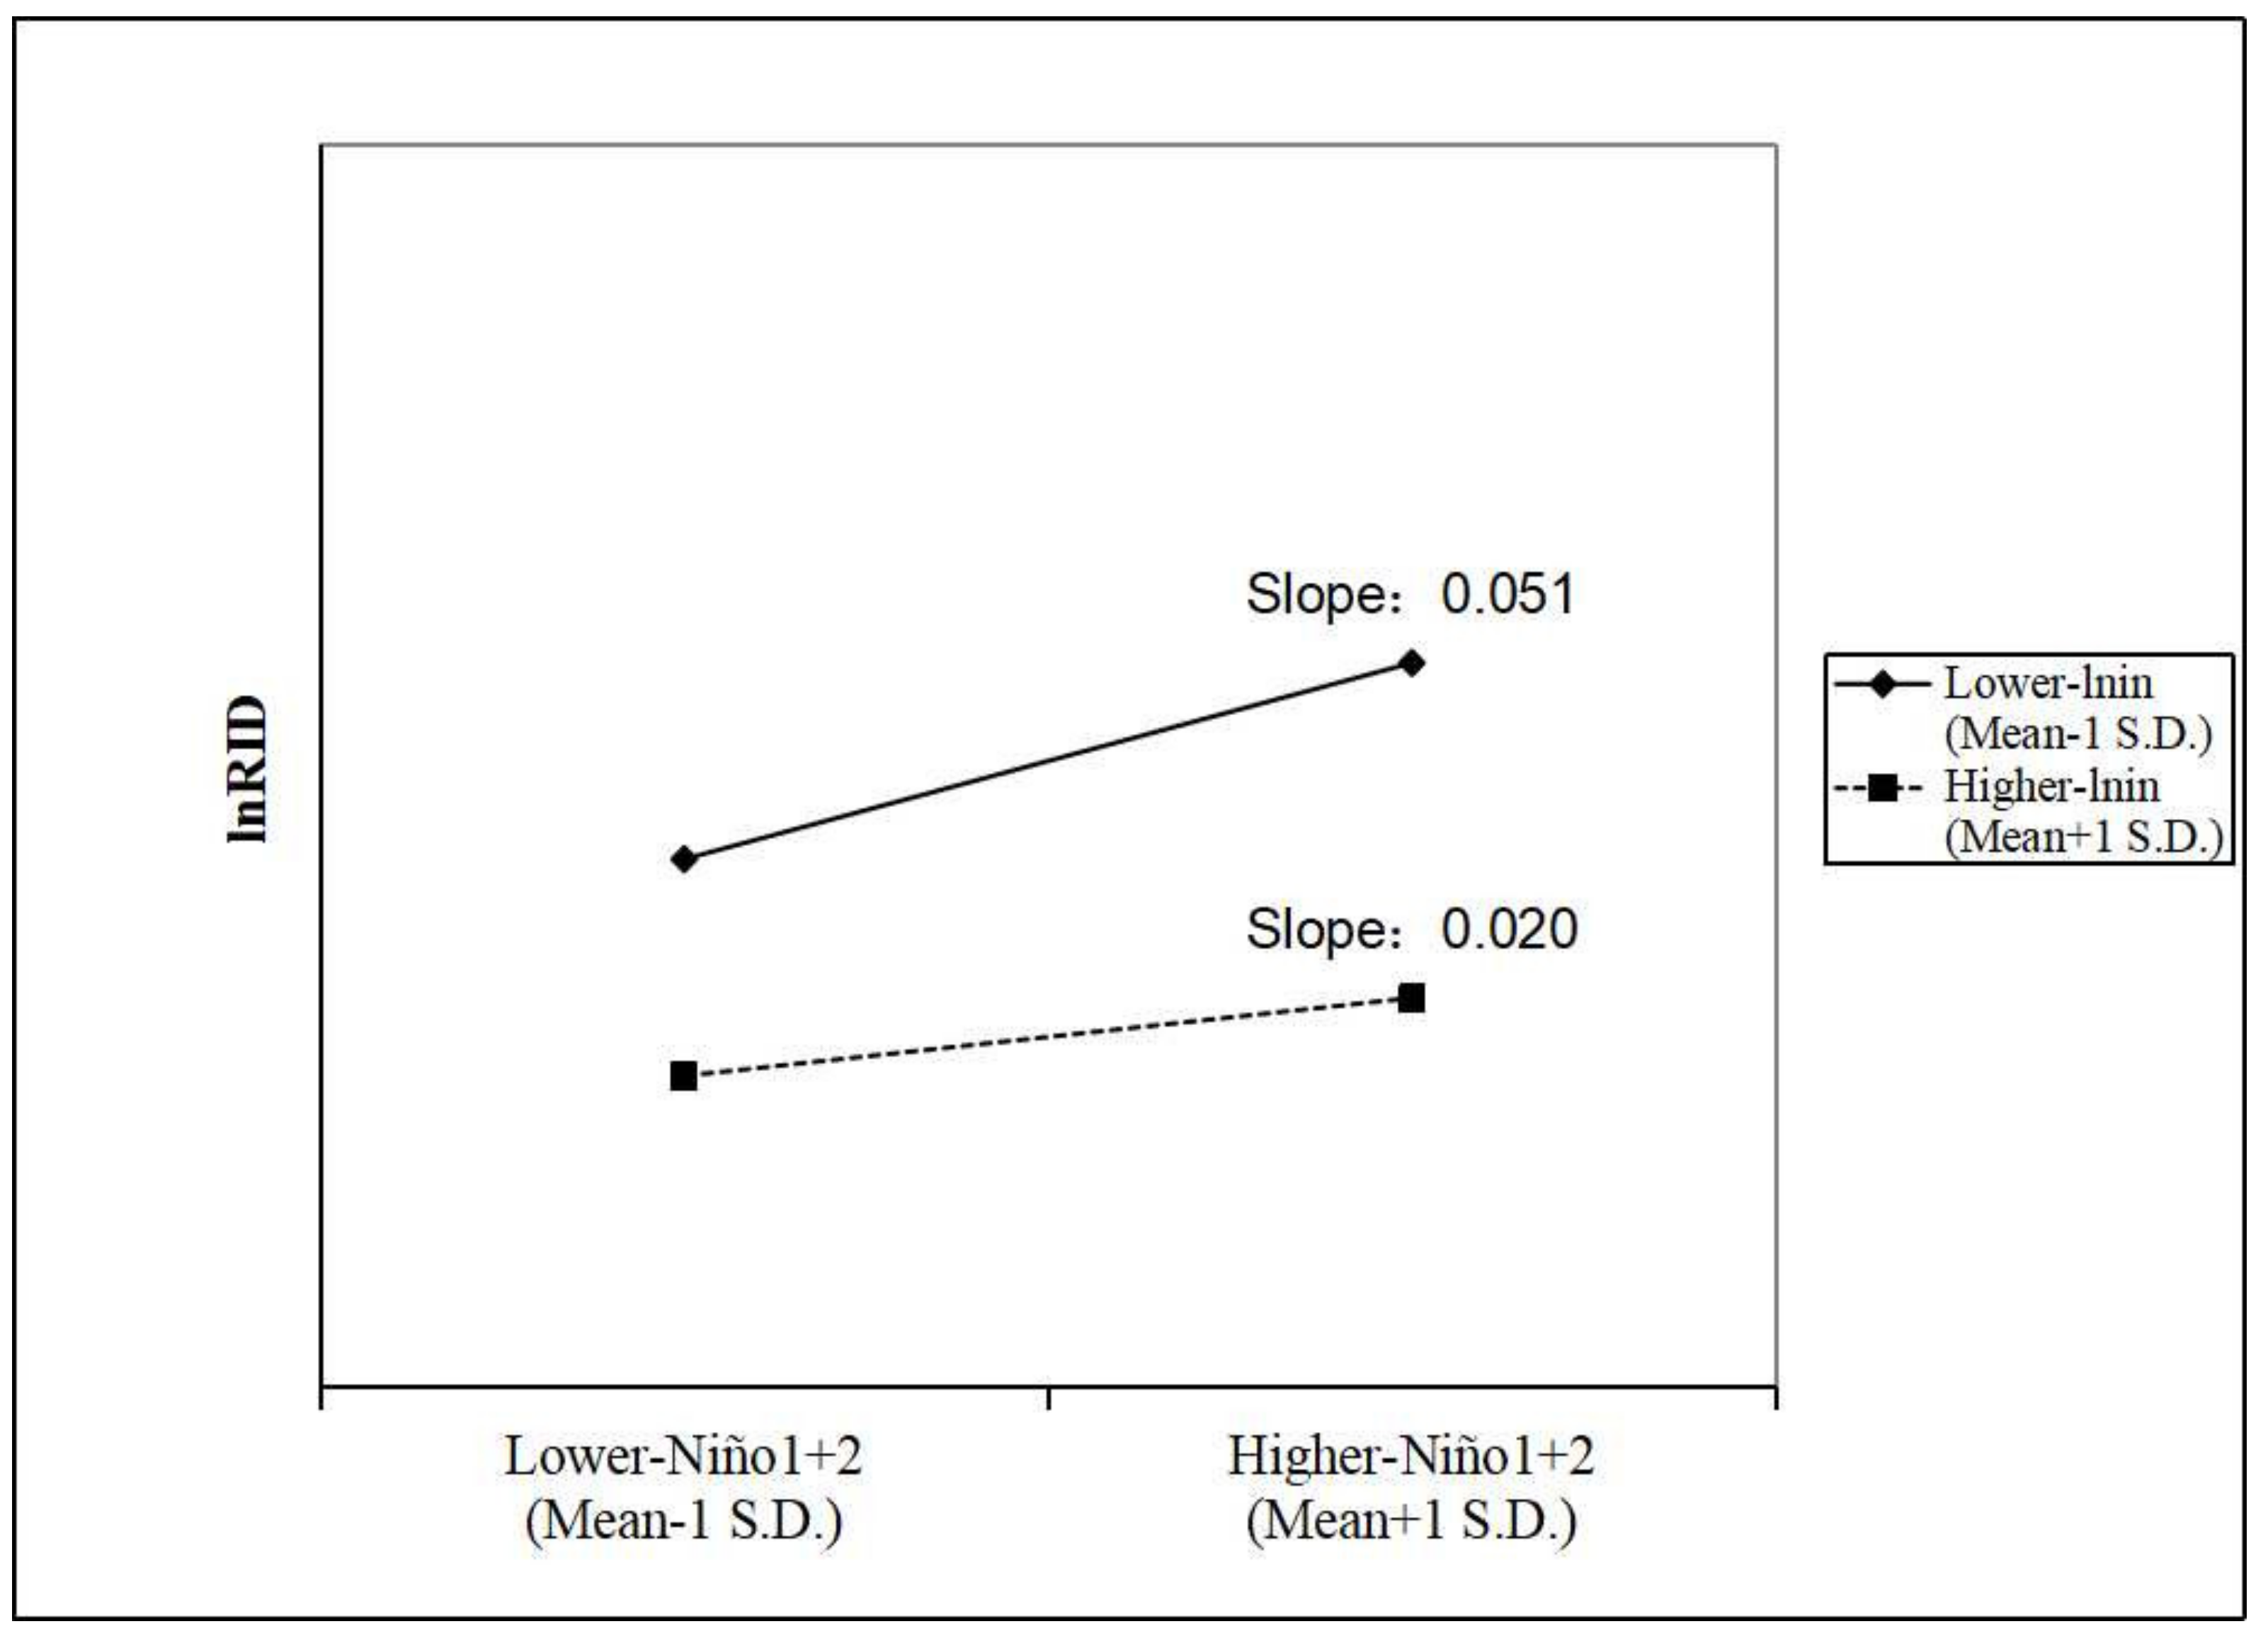
5.3. Does Average Years of Education Have a Moderating Effect on the Relationship between ENSO and RID Morbidity?
5.4. Robustness Analysis
6. Conclusions
Author Contributions
Funding
Institutional Review Board Statement
Informed Consent Statement
Data Availability Statement
Conflicts of Interest
Appendix A
References
- World Health Oraganization. World Health Statistics 2019: Monitoring Health for the SDGs, Sustainable Development Goals; World Health Organization: Geneva, Switzerland, 2019. [Google Scholar]
- Bureau of Disease Control and Prevention. Profiling of the Epidemic Situation of Notifiable Infectious Diseases in China in 2020. 2021. Available online: http://www.nhc.gov.cn/jkj/s3578/202103/f1a448b7df7d4760976fea6d55834966.shtml (accessed on 12 March 2021).
- Troeger, C.E.; Blacker, B.F.; Khalil, I.A.; Zimsen, S.R.M.; Albertson, S.B.; Abate, D.; Abdela, J.; Adhikari, T.B.; Aghayan, S.; Agrawal, S.; et al. Mortality, morbidity, and hospitalisations due to influenza lower respiratory tract infections, 2017: An analysis for the Global Burden of Disease Study 2017. Lancet Respir. Med. 2019, 7, 69–89. [Google Scholar] [CrossRef] [Green Version]
- Mao, Y.; He, R.; Zhu, B.; Liu, J.; Zhang, N. Notifiable respiratory infectious diseases in China: A spatial–temporal epidemiology analysis. Int. J. Environ. Res. Public Health 2020, 17, 2301. [Google Scholar] [CrossRef] [PubMed] [Green Version]
- Mirsaeidi, M.; Motahari, H.; Taghizadeh Khamesi, M.; Sharifi, A.; Campos, M.; Schraufnagel, D.E. Climate change and respiratory infections. Ann. Am. Thorac. Soc. 2016, 13, 1223–1230. [Google Scholar] [CrossRef] [PubMed]
- Hossain, M.Z.; Bambrick, H.; Wraith, D.; Tong, S.; Khan, A.F.; Hore, S.K.; Hu, W. Sociodemographic, climatic variability and lower respiratory tract infections: A systematic literature review. Int. J. Biometeorol. 2019, 63, 209–219. [Google Scholar] [CrossRef]
- Hossain, M.Z.; Bambrick, H.; Wraith, D.; Tong, S.; Khan, A.; Hore, S.K.; Hu, W. A review of progress in coupled ocean-atmosphere model developments for ENSO studies in China. J. Oceanol. Limnol. 2020, 38, 930–961. [Google Scholar]
- Glantz, M.H.; Glantz, M.H. Currents of Change: Impacts of El Niño and La Niña on Climate and Society; Cambridge University Press: Cambridge, UK, 2001. [Google Scholar]
- Hanley, D.E.; Bourassa, M.A.; O’Brien, J.J.; Smith, S.R.; Spade, E.R. A quantitative evaluation of ENSO indices. J. Clim. 2003, 16, 1249–1258. [Google Scholar] [CrossRef]
- Luo, M.; Lau, N.-C. Amplifying effect of ENSO on heat waves in China. Clim. Dyn. 2019, 52, 3277–3289. [Google Scholar] [CrossRef]
- Zhang, W.; Jin, F.F.; Turner, A. Increasing autumn drought over southern China associated with ENSO regime shift. Geophys. Res. Lett. 2014, 41, 4020–4026. [Google Scholar] [CrossRef] [Green Version]
- Tong, J.; Qiang, Z.; Deming, Z.; Yijin, W. Yangtze floods and droughts (China) and teleconnections with ENSO activities (1470–2003). Quat. Int. 2006, 144, 29–37. [Google Scholar] [CrossRef]
- Zhai, P.; Yu, R.; Guo, Y.; Li, Q.; Ren, X.; Wang, Y.; Xu, W.; Liu, Y.; Ding, Y. The strong El Niño of 2015/16 and its dominant impacts on global and China’s climate. J. Meteorol. Res. 2016, 30, 283–297. [Google Scholar] [CrossRef]
- Khider, D.; Stott, L.D.; Emile-Geay, J.; Thunell, R.; Hammond, D.E. Assessing El Niño Southern Oscillation variability during the past millennium. Paleoceanography 2011, 26, PA3222. [Google Scholar] [CrossRef]
- Kurnianingsih; Wirasatriya, A.; Lazuardi, L.; Kubota, N.; Ng, N. IOD and ENSO-Related Time Series Variability and Forecasting of Dengue and Malaria Incidence in Indonesia. In Proceedings of the 2020 International Symposium on Community-Centric Systems (CcS), Tokyo, Japan, 23–26 September 2020; pp. 1–8. [Google Scholar]
- Xiao, J.; Liu, T.; Lin, H.; Zhu, G.; Zeng, W.; Li, X.; Zhang, B.; Song, T.; Deng, A.; Zhang, M.; et al. Weather variables and the El Nino Southern Oscillation may drive the epidemics of dengue in Guangdong Province, China. Sci. Total Environ. 2018, 624, 926–934. [Google Scholar] [CrossRef]
- Demissie, S.; Mengisitie, B. The impact of El Niño on diarrheal disease incidence: A systematic review. Science 2017, 5, 446–451. [Google Scholar] [CrossRef]
- Wang, Q.; Guo, L.; Wang, J.; Zhang, L.; Zhu, W.; Yuan, Y.; Li, J. Spatial distribution of tuberculosis and its socioeconomic influencing factors in mainland China 2013–2016. Trop. Med. Int. Health 2019, 24, 1104–1113. [Google Scholar] [CrossRef]
- Sonego, M.; Pellegrin, M.C.; Becker, G.; Lazzerini, M. Risk factors for mortality from acute lower respiratory infections (ALRI) in children under five years of age in low and middle-income countries: A systematic review and meta-analysis of observational studies. PLoS ONE 2015, 10, e0116380. [Google Scholar] [CrossRef] [Green Version]
- Paget, J.; Spreeuwenberg, P.; Charu, V.; Taylor, R.J.; Iuliano, A.D.; Bresee, J.; Simonsen, L.; Viboud, C.; Global Seasonal Influenza-Associated Mortality Collaborator Network and GLaMOR Collaborating Teams. Global mortality associated with seasonal influenza epidemics: New burden estimates and predictors from the GLaMOR Project. J. Glob. Health 2019, 9, 020421. [Google Scholar] [CrossRef]
- Yu, G.; Yang, R.; Yu, D.; Cai, J.; Tang, J.; Zhai, W.; Wei, Y.; Chen, S.; Chen, Q.; Zhong, G.; et al. Impact of meteorological factors on mumps and potential effect modifiers: An analysis of 10 cities in Guangxi, Southern China. Environ. Res. 2018, 166, 577–587. [Google Scholar] [CrossRef]
- Gurgel, R.Q.; de Matos Bezerra, P.G.; Duarte, M.D.C.M.B.; Moura, A.; Souza, E.L.; Silva, L.S.D.S.; Suzuki, C.E.; Peixoto, R.B. Relative frequency, possible risk factors, viral codetection rates, and seasonality of respiratory syncytial virus among children with lower respiratory tract infection in Northeastern Brazil. Medicine 2016, 95, e3090. [Google Scholar] [CrossRef]
- Carreras, H.; Zanobetti, A.; Koutrakis, P. Effect of daily temperature range on respiratory health in Argentina and its modification by impaired socio-economic conditions and PM10 exposures. Environ. Pollut. 2015, 206, 175–182. [Google Scholar] [CrossRef] [Green Version]
- Yang, W.; Kanavos, P. The less healthy urban population: Income-related health inequality in China. BMC Public Health 2012, 12, 1–15. [Google Scholar] [CrossRef] [Green Version]
- Deaton, A. Health, income, and inequality. In National Bureau of Economic Research Reporter: Research Summary. Retrieved August; National Bureau of Economic Research: Cambridge, MA, USA, 2003; Volume 15, p. 2009. [Google Scholar]
- Woodward, A.; Smith, K.R.; Campbell-Lendrum, D.; Chadee, D.D.; Honda, Y.; Liu, Q.; Olwoch, J.; Revich, B.; Sauerborn, R.; Chafe, Z. Climate change and health: On the latest IPCC report. Lancet 2014, 383, 1185–1189. [Google Scholar] [CrossRef]
- McGregor, G.R.; Ebi, K. El Niño Southern Oscillation (ENSO) and health: An overview for climate and health researchers. Atmosphere 2018, 9, 282. [Google Scholar] [CrossRef] [Green Version]
- Zaraket, H.; Saito, R.; Tanabe, N.; Taniguchi, K.; Suzuki, H. Association of early annual peak influenza activity with El Niño southern oscillation in Japan. Influenza Other Respir. Viruses 2008, 2, 127–130. [Google Scholar] [CrossRef] [PubMed] [Green Version]
- Grossman, M. The Demand for Health: A Theoretical and Empirical; National Bureau of Economay Research and Columbia University Press: New York, NY, USA, 1972; pp. 1–111. [Google Scholar]
- Lee, T.M.; Markowitz, E.; Howe, P.; Ko, C.-Y.; Leiserowitz, A.A. Predictors of public climate change awareness and risk perception around the world. Nat. Clim. Change 2015, 5, 1014–1020. [Google Scholar]
- Yang, X.; Wu, J.; Liu, J.; Ye, X. Changes of Extreme Precipitation and Possible Influence of ENSO Events in a Humid Basin in China. Atmosphere 2021, 12, 1522. [Google Scholar] [CrossRef]
- Breton, T.R. The quality vs. the quantity of schooling: What drives economic growth? Econ. Educ. Rev. 2011, 30, 765–773. [Google Scholar]
- Xie, T. Analysis on inter-provincial disparities of China’s rural education and convergence rate: Empirical analysis on 31 provinces’(municipalities’) panel data from 2001 to 2008. Int. J. Educ. Manag. 2011, 25, 714–723. [Google Scholar] [CrossRef]
- Tong, M.X.; Hansen, A.; Hanson-Easey, S.; Cameron, S.; Xiang, J.; Liu, Q.; Sun, Y.; Weinstein, P.; Han, G.S.; Williams, C.; et al. Infectious diseases, urbanization and climate change: Challenges in future China. Int. J. Environ. Res. Public Health 2015, 12, 11025–11036. [Google Scholar] [CrossRef] [Green Version]
- Yuan, K.; Huang, Y.; Tang, Q. The impact of social and economic development on the spread of infectious respiratory diseases, push or constrain? Empirical research from China based on machine learning methods. In Proceedings of the 2020 IEEE 22nd International Conference on High Performance Computing and Communications, IEEE 18th International Conference on Smart City, IEEE 6th International Conference on Data Science and Systems (HPCC/SmartCity/DSS), Yanuca Island, Cuvu, Fiji, 14–16 December 2020; pp. 1364–1369. [Google Scholar]
- Wang, D. China’s urban and rural old age security system: Challenges and options. China World Econ. 2006, 14, 102–116. [Google Scholar] [CrossRef] [Green Version]
- Lu, C.; Deng, Q.; Yu, C.W.F.; Sundell, J.; Ou, C. Effects of ambient air pollution on the prevalence of pneumonia in children: Implication for national ambient air quality standards in China. Indoor Built Environ. 2014, 23, 259–269. [Google Scholar] [CrossRef]
- Liu, J.; Han, Z.; Veuthey, J.; Ma, B. How investment in public health has impacted the prevalence of tuberculosis in China: A study of provincial variations between 2005 and 2015. Int. J. Health Plan. Manag. 2020, 35, 1546–1558. [Google Scholar] [CrossRef]
- Gerry, C.J. The journals are full of great studies but can we believe the statistics? Revisiting the mass privatisation–Mortality debate. Soc. Sci. Med. 2012, 75, 14–22. [Google Scholar]
- Roodman, D. How to do xtabond2: An introduction to difference and system GMM in Stata. Stata J. 2009, 9, 86–136. [Google Scholar]
- Lütkepohl, H.; Xu, F. The role of the log transformation in forecasting economic variables. Empir. Econ. 2012, 42, 619–638. [Google Scholar] [CrossRef] [Green Version]
- Holtz-Eakin, D. Testing for individual effects in autoregressive models. J. Econom. 1988, 39, 297–307. [Google Scholar] [CrossRef]
- Arellano, M.; Bond, S. Some tests of specification for panel data: Monte Carlo evidence and an application to employment equations. Rev. Econ. Stud. 1991, 58, 277–297. [Google Scholar] [CrossRef] [Green Version]
- Blundell, R.; Bond, S. Initial conditions and moment restrictions in dynamic panel data models. J. Econom. 1998, 87, 115–143. [Google Scholar] [CrossRef] [Green Version]
- Bond, S.R. Dynamic panel data models: A guide to micro data methods and practice. Port. Econ. J. 2002, 1, 141–162. [Google Scholar] [CrossRef]
- Granger, C.W. Investigating causal relations by econometric models and cross-spectral methods. Econom. J. Econom. Soc. 1969, 37, 424–438. [Google Scholar] [CrossRef]
- Dumitrescu, E.-I.; Hurlin, C. Testing for Granger non-causality in heterogeneous panels. Econ. Model. 2012, 29, 1450–1460. [Google Scholar] [CrossRef] [Green Version]
- Anyamba, A.; Chretien, J.P.; Britch, S.C.; Soebiyanto, R.P.; Small, J.L.; Jepsen, R.; Forshey, B.M.; Sanchez, J.L.; Smith, R.D.; Harris, R.; et al. Global disease outbreaks associated with the 2015–2016 El Niño event. Sci. Rep. 2019, 9, 1–14. [Google Scholar] [CrossRef] [PubMed] [Green Version]
- Cameron, A.C.; Miller, D.L. A practitioner’s guide to cluster-robust inference. J. Hum. Resour. 2015, 50, 317–372. [Google Scholar] [CrossRef]
- Wang, M.; Han, X.; Fang, H.; Xu, C.; Lin, X.; Xia, S.; Yu, W.; He, J.; Jiang, S.; Tao, H. Impact of health education on knowledge and behaviors toward infectious diseases among students in Gansu Province, China. BioMed. Res. Int. 2018, 2018. [Google Scholar] [CrossRef] [PubMed] [Green Version]
- Tang, Y.; Zhang, R.-H.; Liu, T.; Duan, W.; Yang, D.; Zheng, F.; Ren, H.; Lian, T.; Gao, C.; Chen, D.; et al. Progress in ENSO prediction and predictability study. Natl. Sci. Rev. 2018, 5, 826–839. [Google Scholar] [CrossRef]
- Vicente-Serrano, S.M.; Aguilar, E.; Martínez, R.; Martín-Hernández, N.; Azorin-Molina, C.; Sanchez-Lorenzo, A.; El Kenawy, A.; Tomás-Burguera, M.; Moran-Tejeda, E.; López-Moreno, J.I.; et al. The complex influence of ENSO on droughts in Ecuador. Clim. Dyn. 2017, 48, 405–427. [Google Scholar] [CrossRef] [Green Version]


| Variable | Observations | Mean | Std. Dev. | Min | Max |
|---|---|---|---|---|---|
| 372 | 162.293 | 76.675 | 54.276 | 626.743 | |
| 372 | −0.055 | 0.621 | −1.067 | 1.433 | |
| 372 | 20366.5 | 8579.501 | 9740 | 64183 | |
| 372 | 8.825 | 1.166 | 4.222 | 12.555 | |
| 372 | 1.586 | 1.612 | 0.273 | 8.623 | |
| 372 | 13.105 | 2.946 | 6.7 | 22.7 | |
| 372 | 0.781 | 0.17 | 0.134 | 1 | |
| 372 | 705.097 | 443.279 | 93.155 | 3020.622 |
| 1.000 | ||||||||
| (-) | ||||||||
| 0.092 * | 1.000 | |||||||
| (0.076) | (-) | |||||||
| −0.622 *** | 0.208 *** | 1.000 | ||||||
| (0.000) | (0.000) | (-) | ||||||
| −0.536 *** | 0.087* | 0.644 *** | 1.000 | |||||
| (0.000) | (0.094) | (0.000) | (-) | |||||
| −0.524*** | 0.038 | 0.719 *** | 0.629 *** | 1.000 | ||||
| (0.000) | (0.464) | (0.000) | (0.000) | (-) | ||||
| −0.367 *** | 0.101 * | 0.334 *** | 0.316 *** | 0.162 *** | 1.000 | |||
| (0.000) | (0.051) | (0.000) | (0.000) | (0.002) | (-) | |||
| −0.327 *** | −0.017 | 0.168 *** | 0.177 *** | 0.188 *** | 0.107 ** | 1.000 | ||
| (0.000) | (0.741) | (0.001) | (0.001) | (0.000) | (0.039) | (-) | ||
| −0.256 *** | 0.386 *** | 0.547 *** | 0.199 *** | 0.314 *** | 0.084 | −0.012 | 1.000 | |
| (0.000) | (0.000) | (0.000) | (0.000) | (0.000) | (0.106) | (0.813) | (-) |
| Variable | W-Bar | Z-Bar | p-Value |
|---|---|---|---|
| ENSO→RID | 3.619 | 4.507 | 0.000 |
| RID→ENSO | 2.3307 | 0.9207 | 0.357 |
| SYS-GMM | |||||||
|---|---|---|---|---|---|---|---|
| (1) | (2) | (3) | (4) | (5) | (6) | (7) | |
| 0.971 *** | 0.869 *** | 0.746 *** | 0.788 *** | 0.742 *** | 0.743 *** | 0.772 *** | |
| (0.049) | (0.084) | (0.142) | (0.163) | (0.163) | (0.165) | (0.182) | |
| 0.028 ** | 0.031 *** | 0.028*** | 0.029 *** | 0.036 *** | 0.035 ** | 0.037 *** | |
| (0.010) | (0.010) | (0.009) | (0.010) | (0.013) | (0.013) | (0.013) | |
| −0.130* | −0.134 * | −0.130 * | −0.148 * | −0.144 * | −0.134 * | ||
| (0.069) | (0.073) | (0.076) | (0.080) | (0.078) | (0.077) | ||
| −0.311 * | −0.316 ** | −0.311 ** | −0.306 ** | −0.316 ** | |||
| (0.169) | (0.141) | (0.144) | (0.141) | (0.139) | |||
| 0.007 | 0.005 | 0.005 | 0.010 | ||||
| (0.012) | (0.012) | (0.012) | (0.014) | ||||
| 0.007 | 0.007 | 0.007 | |||||
| (0.006) | (0.006) | (0.007) | |||||
| −0.055 | −0.047 | ||||||
| (0.064) | (0.062) | ||||||
| −0.017 | |||||||
| (0.018) | |||||||
| Constant | 0.098 | 1.899 * | 3.241 * | 2.981 * | 3.477 ** | 3.460 * | 3.326 * |
| (0.259) | (1.083) | (1.601) | (1.656) | (1.685) | (1.703) | (1.830) | |
| Observations | 341 | 341 | 341 | 341 | 341 | 341 | 341 |
| Number of states | 31 | 31 | 31 | 31 | 31 | 31 | 31 |
| Time fixed effect? | YES | YES | YES | YES | YES | YES | YES |
| Hansen test | 0.120 | 0.117 | 0.078 | 0.117 | 0.111 | 0.107 | 0.103 |
| Arellano-Bond test for AR (1) | 0.007 | 0.007 | 0.007 | 0.008 | 0.008 | 0.008 | 0.008 |
| Arellano-Bond test for AR (2) | 0.407 | 0.453 | 0.450 | 0.453 | 0.454 | 0.468 | 0.421 |
| SYS-GMM | ||
|---|---|---|
| (1) | (2) | |
| 0.756 *** | 0.764 *** | |
| (0.168) | (0.161) | |
| 0.464 * | 0.519 *** | |
| (0.151) | (0.187) | |
| −0.128 * | −0.130 * | |
| (0.075) | (0.074) | |
| −0.304 * | −0.303 * | |
| (0.149) | (0.168) | |
| 0.006 | 0.007 | |
| (0.014) | (0.012) | |
| 0.007 | 0.007 | |
| (0.007) | (0.007) | |
| −0.052 | −0.050 | |
| (0.062) | (0.061) | |
| −0.015 | −0.012 | |
| (0.019) | (0.019) | |
| −0.044* | ||
| (0.036) | ||
| −0.221 ** | ||
| (0.087) | ||
| Constant | 3.324 * | 3.265 * |
| (1.661) | (1.646) | |
| Observations | 341 | 341 |
| Number of states | 31 | 31 |
| Time fixed effect? | YES | YES |
| Hansen test | 0.116 | 0.127 |
| Arellano–Bond test for AR(1) | 0.007 | 0.007 |
| Arellano–Bond test for AR(2) | 0.413 | 0.384 |
| (1) | (2) | (3) | |
|---|---|---|---|
| OLS | FE | SYS-GMM | |
| 0.958 *** | 0.560 *** | 0.756 *** | |
| (0.043) | (0.098) | (0.168) | |
| 0.395 | 0.405 ** | 0.464 * | |
| (0.251) | (0.010) | (0.151) | |
| −0.051 * | −0.077 | −0.128 * | |
| (0.028) | (0.051) | (0.075) | |
| −0.185 *** | −0.651 *** | −0.304 * | |
| (0.061) | (0.201) | (0.149) | |
| 0.014 *** | 0.084 * | 0.006 | |
| (0.003) | (0.043) | (0.014) | |
| 0.004 * | 0.010 ** | 0.007 | |
| (0.002) | (0.004) | (0.007) | |
| −0.015 | 0.008 | −0.052 | |
| (0.034) | (0.042) | (0.062) | |
| −0.017 | −0.047 * | −0.015 | |
| (0.013) | (0.026) | (0.019) | |
| −0.037 | −0.037 * | −0.044 * | |
| (0.026) | (0.020) | (0.036) | |
| Constant | 1.197 ** | 4.874 *** | 3.324 * |
| (0.475) | (0.761) | (1.661) | |
| Observations | 341 | 341 | 341 |
| Number of states | 31 | 31 | 31 |
| Time fixed effect? | YES | YES | YES |
| r2 | 0.931 | 0.692 | |
| Hansen test | 0.116 | ||
| Arellano–Bond test for AR(1) | 0.007 | ||
| Arellano–Bond test for AR(2) | 0.413 |
| (1) | (2) | (3) | |
|---|---|---|---|
| OLS | FE | SYS-GMM | |
| 0.957 *** | 0.563 *** | 0.764 *** | |
| (0.042) | (0.096) | (0.161) | |
| 0.434 *** | 0.403 *** | 0.519 *** | |
| (0.131) | (0.008) | (0.187) | |
| −0.048 * | −0.068 | −0.130 * | |
| (0.028) | (0.051) | (0.074) | |
| −0.179 *** | −0.652 *** | −0.303 * | |
| (0.061) | (0.194) | (0.168) | |
| 0.013 *** | 0.083 * | 0.007 | |
| (0.003) | (0.043) | (0.012) | |
| 0.004 * | 0.010 ** | 0.007 | |
| (0.002) | (0.004) | (0.007) | |
| −0.016 | 0.006 | −0.050 | |
| (0.033) | (0.042) | (0.061) | |
| −0.015 | −0.046* | −0.012 | |
| (0.013) | (0.026) | (0.019) | |
| −0.184 *** | −0.167 *** | −0.221 ** | |
| (0.062) | (0.050) | (0.087) | |
| Constant | 1.154 ** | 4.775 *** | 3.265 * |
| (0.466) | (0.780) | (1.646) | |
| Observations | 341 | 341 | 341 |
| Number of states | 31 | 31 | 31 |
| Time fixed effect? | YES | YES | YES |
| r2 | 0.932 | 0.696 | |
| Hansen test | 0.127 | ||
| Arellano–Bond test for AR(1) | 0.007 | ||
| Arellano–Bond test for AR(2) | 0.384 |
Publisher’s Note: MDPI stays neutral with regard to jurisdictional claims in published maps and institutional affiliations. |
© 2022 by the authors. Licensee MDPI, Basel, Switzerland. This article is an open access article distributed under the terms and conditions of the Creative Commons Attribution (CC BY) license (https://creativecommons.org/licenses/by/4.0/).
Share and Cite
Tang, Q.; Gong, K.; Xiong, L.; Dong, Y.; Xu, W. Can El Niño–Southern Oscillation Increase Respiratory Infectious Diseases in China? An Empirical Study of 31 Provinces. Int. J. Environ. Res. Public Health 2022, 19, 2971. https://doi.org/10.3390/ijerph19052971
Tang Q, Gong K, Xiong L, Dong Y, Xu W. Can El Niño–Southern Oscillation Increase Respiratory Infectious Diseases in China? An Empirical Study of 31 Provinces. International Journal of Environmental Research and Public Health. 2022; 19(5):2971. https://doi.org/10.3390/ijerph19052971
Chicago/Turabian StyleTang, Qingyun, Ke Gong, Li Xiong, Yuanxiang Dong, and Wei Xu. 2022. "Can El Niño–Southern Oscillation Increase Respiratory Infectious Diseases in China? An Empirical Study of 31 Provinces" International Journal of Environmental Research and Public Health 19, no. 5: 2971. https://doi.org/10.3390/ijerph19052971