
Association of Anthropometrics and Body Composition with Maximal and Relative Force and Power of Kayak Stroke in Competitive Kayak Athletes

 ,
,  ,
,  ,
,  and
and 
Abstract
:1. Introduction
2. Materials and Methods
2.1. Experimental Approach to the Problem
2.2. Participants
2.3. Anthropometrics and Body Composition
2.4. Single-Stroke Kayak Force and Power
Force and Power Variables
2.5. Statistical Analyses
3. Results
4. Discussion
Limitations
5. Conclusions
Supplementary Materials
Author Contributions
Funding
Institutional Review Board Statement
Informed Consent Statement
Data Availability Statement
Acknowledgments
Conflicts of Interest
References
- Borges, T.O.; Bullock, N.; Coutts, J.A. Pacing Characteristics of International Sprint Kayak Athletes. Int. J. Perform. Anal. Sport 2013, 13, 353–364. [Google Scholar] [CrossRef]
- Michael, J.S.; Smith, R.; Rooney, K.B. Determinants of Kayak Paddling Performance. Sports Biomech. 2009, 8, 167–179. [Google Scholar] [CrossRef] [PubMed]
- Wainwright, B.; Cooke, C.; Low, C. Performance Related Technique Factors in Olympic Sprint Kayaking. In Proceedings of the ISBS 33rd International Conference on Biomechanics in Sports, Poitiers, France, 29 June–3 July 2015. [Google Scholar]
- McDonnell, L.K.; Hume, P.A.; Nolte, V. An Observational Model for Biomechanical Assessment of Sprint Kayaking Technique. Sports Biomech. 2012, 11, 507–523. [Google Scholar] [CrossRef] [PubMed]
- Baker, J. Biomechanics of Paddling. In Proceedings of the ISBS—Conference Proceedings Archive; International Society of Biomechanics in Sports: Melbourne, Australia, 2012. [Google Scholar]
- Borges, T.O.; Bullock, N.; Duff, C.; Coutts, A.J. Methods for Quantifying Training in Sprint Kayak. J. Strength Cond. Res. 2014, 28, 474–482. [Google Scholar] [CrossRef]
- Jaric, S. Force-Velocity Relationship of Muscles Performing Multi-Joint Maximum Performance Tasks. Int. J. Sports Med. 2015, 36, 699–704. [Google Scholar] [CrossRef]
- Perić, D.; Ilić, N.; Ahmetovićvić, Z. Kinematic and Dynamic Stroke Variables of Elite and Sub-Elite Rowers. Int. J. Perform. Anal. Sport 2019, 19, 65–75. [Google Scholar] [CrossRef]
- Forbes, S.; Fuller, D.; Krentz, J.; Little, J.; Chilibeck, P. Anthropometric and Physiological Predictors of Flat-Water 1000 m Kayak Performance in Young Adolescents and the Effectiveness of a High Volume Training Camp. Int. J. Exerc. Sci. 2009, 2, 4. [Google Scholar]
- Aitken, D.A.; Jenkins, D.G. Anthropometric-Based Selection and Sprint Kayak Training in Children. J. Sports Sci. 1998, 16, 539–543. [Google Scholar] [CrossRef]
- Gryko, K.; Kopiczko, A.; Mikołajec, K.; Stasny, P.; Musalek, M. Anthropometric Variables and Somatotype of Young and Professional Male Basketball Players. Sports 2018, 6, 9. [Google Scholar] [CrossRef] [Green Version]
- Zarić, I.; Kukić, F.; Jovićević, N.; Zarić, M.; Marković, M.; Toskić, L.; Dopsaj, M. Body Height of Elite Basketball Players: Do Taller Basketball Teams Rank Better at the FIBA World Cup? Int. J. Environ. Res. Public Health 2020, 17, 3141. [Google Scholar] [CrossRef]
- Diafas, V.; Dimakopoulou, E.; Diamanti, V.; Zelioti, D.; Kaloupsis, S. Anthropometric Characteristics and Somatotype of Greek Male and Female Flatwater Kayak Athletes. Biomed. Hum. Kinet. 2011, 3, 111–114. [Google Scholar] [CrossRef] [Green Version]
- Ackland, T.R.; Ong, K.B.; Kerr, D.A.; Ridge, B. Morphological Characteristics of Olympic Sprint Canoe and Kayak Paddlers. J. Sci. Med. Sport 2003, 6, 285–294. [Google Scholar] [CrossRef]
- Akca, F.; Muniroglu, S. Anthropometric-Somatotype and Strength Profiles and On-Water Performance in Turkish Elite Kayakers. Int. J. Appl. Sports Sci. IJASS 2008, 20, 22–34. [Google Scholar]
- Hamano, S.; Ochi, E.; Tsuchiya, Y.; Muramatsu, E.; Suzukawa, K.; Igawa, S. Relationship between Performance Test and Body Composition/Physical Strength Characteristic in Sprint Canoe and Kayak Paddlers. Open Access J. Sports Med. 2015, 6, 191–199. [Google Scholar] [CrossRef] [Green Version]
- Petrovic, M.R.; García-Ramos, A.; Janicijevic, D.N.; Pérez-Castilla, A.; Knezevic, O.M.; Mirkov, D.M. The Novel Single-Stroke Kayak Test: Can It Discriminate between 200-m and Longer-Distance (500- and 1000-m) Specialists in Canoe Sprint? Int. J. Sports Physiol. Perform. 2020, 16, 208–215. [Google Scholar] [CrossRef]
- Petrović, M.; García Ramos, A.; Janićijević, D.; Pérez Castilla, A.; Knezevic, O.; Mirkov, D. Force-Velocity Profile of Competitive Kayakers: Evaluation of a Novel Single Kayak Stroke Test. J. Hum. Kinet. 2021, 80, 49–59. [Google Scholar] [CrossRef]
- Van Someren, K.A.; Howatson, G. Prediction of Flatwater Kayaking Performance. Int. J. Sports Physiol. Perform. 2008, 3, 207–218. [Google Scholar] [CrossRef] [Green Version]
- Van Someren, K.A.; Palmer, G.S. Prediction of 200-m Sprint Kayaking Performance. Can. J. Appl. Physiol. 2003, 28, 505–517. [Google Scholar] [CrossRef]
- Temprom, V.; Sangnon, C.; Boontham, P.; Viriyatharakij, N. Clarifying Acromial Distance: Standardisation and Association between Supine and Sitting Positions. Phys. Ther. Sport 2019, 36, 51–54. [Google Scholar] [CrossRef]
- Aandstad, A.; Holtberget, K.; Hageberg, R.; Holme, I.; Anderssen, S.A. Validity and Reliability of Bioelectrical Impedance Analysis and Skinfold Thickness in Predicting Body Fat in Military Personnel. Mil. Med. 2014, 179, 208–217. [Google Scholar] [CrossRef] [Green Version]
- Kukic, F.; Dopsaj, M.; Dawes, J.; Orr, R.; Cvorovic, A. Use of Human Body Morphology as an Indicator of Physical Fitness: Implications for Police Officers. Int. J. Morphol. 2018, 36, 1407–1412. [Google Scholar] [CrossRef]
- Kukić, F.; Koropanovski, N.; Janković, R.; Čvorović, A.; Dawes, J.J.; Lockie, G.R.; Orr, R.M.; Dopsaj, M. Association of Sex-Related Differences in Body Composition to Change of Direction Speed in Police Officers While Carrying Load. Int. J. Morphol. 2020, 38, 731–736. [Google Scholar] [CrossRef]
- Zarić, I.; Dopsaj, M.; Marković, M.; Zarić, M.; Jakovljević, S.; Berić, D. Body Composition Characteristics Measured by Multichannel Bioimpedance in Young Female Basketball Players: Relation with Match Performance. Int. J. Morphol. 2020, 38, 328–335. [Google Scholar] [CrossRef] [Green Version]
- Dopsaj, M.; Markovic, M.; Kasum, G.; Jovanovic, S.; Koropanovski, N.; Vukovic, M.; Mudric, M. Discrimination of Different Body Structure Indexes of Elite Athletes in Combat Aports Measured by Multi Frequency Bioimpedance Method. Int. J. Morphol. 2017, 35, 199–207. [Google Scholar] [CrossRef] [Green Version]
- García-Ramos, A.; Haff, G.G.; Padial, P.; Feriche, B. Reliability of Power and Velocity Variables Collected during the Traditional and Ballistic Bench Press Exercise. Sports Biomech. 2018, 17, 117–130. [Google Scholar] [CrossRef] [PubMed]
- Jaric, S.; Mirkov, D.M.; Markovic, G. Normalizing Physical Performance Test for Body Size: A Proposal for Standardization. J. Strength Cond. Res. Res. J. NSCA 2005, 19, 467–474. [Google Scholar] [CrossRef] [PubMed]
- Markovic, G.; Jaric, S. Movement Performance and Body Size: The Relationship for Different Groups of Tests. Eur. J. Appl. Physiol. 2004, 92, 139–149. [Google Scholar] [CrossRef] [PubMed]
- Sullivan, G.M.; Feinn, R. Using Effect Size—Or Why the P Value Is Not Enough. J. Grad. Med. Educ. 2012, 4, 279–282. [Google Scholar] [CrossRef] [Green Version]
- McKean, M.R.; Burkett, B.J. The Influence of Upper-Body Strength on Flat-Water Sprint Kayak Performance in Elite Athletes. Int. J. Sports Physiol. Perform. 2014, 9, 707–714. [Google Scholar] [CrossRef] [Green Version]
- Camera, D.M.; Smiles, W.J.; Hawley, J.A. Exercise-Induced Skeletal Muscle Signaling Pathways and Human Athletic Performance. Free. Radic. Biol. Med. 2016, 98, 131–143. [Google Scholar] [CrossRef]
- Methenitis, S.; Spengos, K.; Zaras, N.; Stasinaki, A.-N.; Papadimas, G.; Karampatsos, G.; Arnaoutis, G.; Terzis, G. Fiber Type Composition and Rate of Force Development in Endurance- and Resistance-Trained Individuals. J. Strength Cond. Res. 2019, 33, 2388–2397. [Google Scholar] [CrossRef]
- Tesch, P.A.; Karlsson, J. Muscle Fiber Types and Size in Trained and Untrained Muscles of Elite Athletes. J. Appl. Physiol. 1985, 59, 1716–1720. [Google Scholar] [CrossRef]
- Fischetti, F.; Cataldi, S.; Greco, G. Lower-Limb Plyometric Training Improves Vertical Jump and Agility Abilities in Adult Female Soccer Players. J. Phys. Educ. Sport 2019, 19, 1254–1261. [Google Scholar] [CrossRef]
- Fischetti, F.; Vilardi, A.; Cataldi, S.; Greco, G. Effects of Plyometric Training Program on Speed and Explosive Strength of Lower Limbs in Young Athletes. J. Phys. Educ. Sport 2018, 18, 2476–2482. [Google Scholar] [CrossRef]

| Variables | Mean | Std. Dev. | Min. | Max. | SWT |
|---|---|---|---|---|---|
| Age (years) | 21.67 | 3.14 | 17.00 | 29.00 | 0.108 |
| BH (cm) | 180.78 | 6.26 | 167.80 | 190.60 | 0.688 |
| BM (kg) | 80.08 | 7.11 | 64.50 | 95.40 | 0.895 |
| Sitting height (cm) | 95.88 | 3.20 | 87.40 | 101.50 | 0.502 |
| Between-acromial distance (cm) | 43.1381 | 1.63 | 40.70 | 47.00 | 0.600 |
| Arm span (cm) | 188.4286 | 7.85 | 176.00 | 199.50 | 0.074 |
| Stroke length (cm) | 97.4286 | 2.86 | 92.00 | 102.00 | 0.854 |
| Body mass index (kg/m²) | 24.49 | 1.62 | 22.83 | 28.13 | 0.066 |
| Percent body fat (%) | 9.56 | 3.44 | 3.05 | 15.39 | 0.779 |
| Percent of skeletal muscle mass (%) | 51.99 | 2.24 | 48.15 | 55.89 | 0.723 |
| Skeletal muscle mass index (kg/m²) | 12.73 | 0.98 | 11.00 | 14.50 | 0.807 |
| Single-stroke kayak TestFmax (N) | 533.27 | 95.52 | 419.84 | 826.34 | 0.233 |
| Single-stroke kayak TestFrel (N/kg2/3) | 28.70 | 4.59 | 22.53 | 44.00 | 0.143 |
| Single-stroke kayak TestPmax (W) | 233.26 | 58.30 | 158.35 | 406.98 | 0.114 |
| Single-stroke kayak TestPrel (W/kg2/3) | 12.56 | 3.02 | 9.14 | 21.67 | 0.081 |
| BH | BM | SH | BAD | AS | SL | BMI | PBF | PSMM | SMMI | |
|---|---|---|---|---|---|---|---|---|---|---|
| SSKTFmax | 0.197 | 0.511 * | 0.430 | 0.231 | 0.263 | 0.322 | 0.495 * | −0.090 | 0.189 | 0.530 * |
| SSKTFrel | −0.130 | 0.069 | 0.132 | 0.107 | 0.008 | 0.066 | 0.241 | −0.029 | 0.091 | 0.253 |
| SSKTPmax | −0.057 | 0.286 | 0.183 | 0.256 | 0.077 | 0.066 | 0.471 * | −0.084 | 0.167 | 0.489 * |
| SSKTPrel | −0.227 | 0.051 | 0.014 | 0.190 | −0.057 | −0.075 | 0.332 | −0.052 | 0.113 | 0.337 |
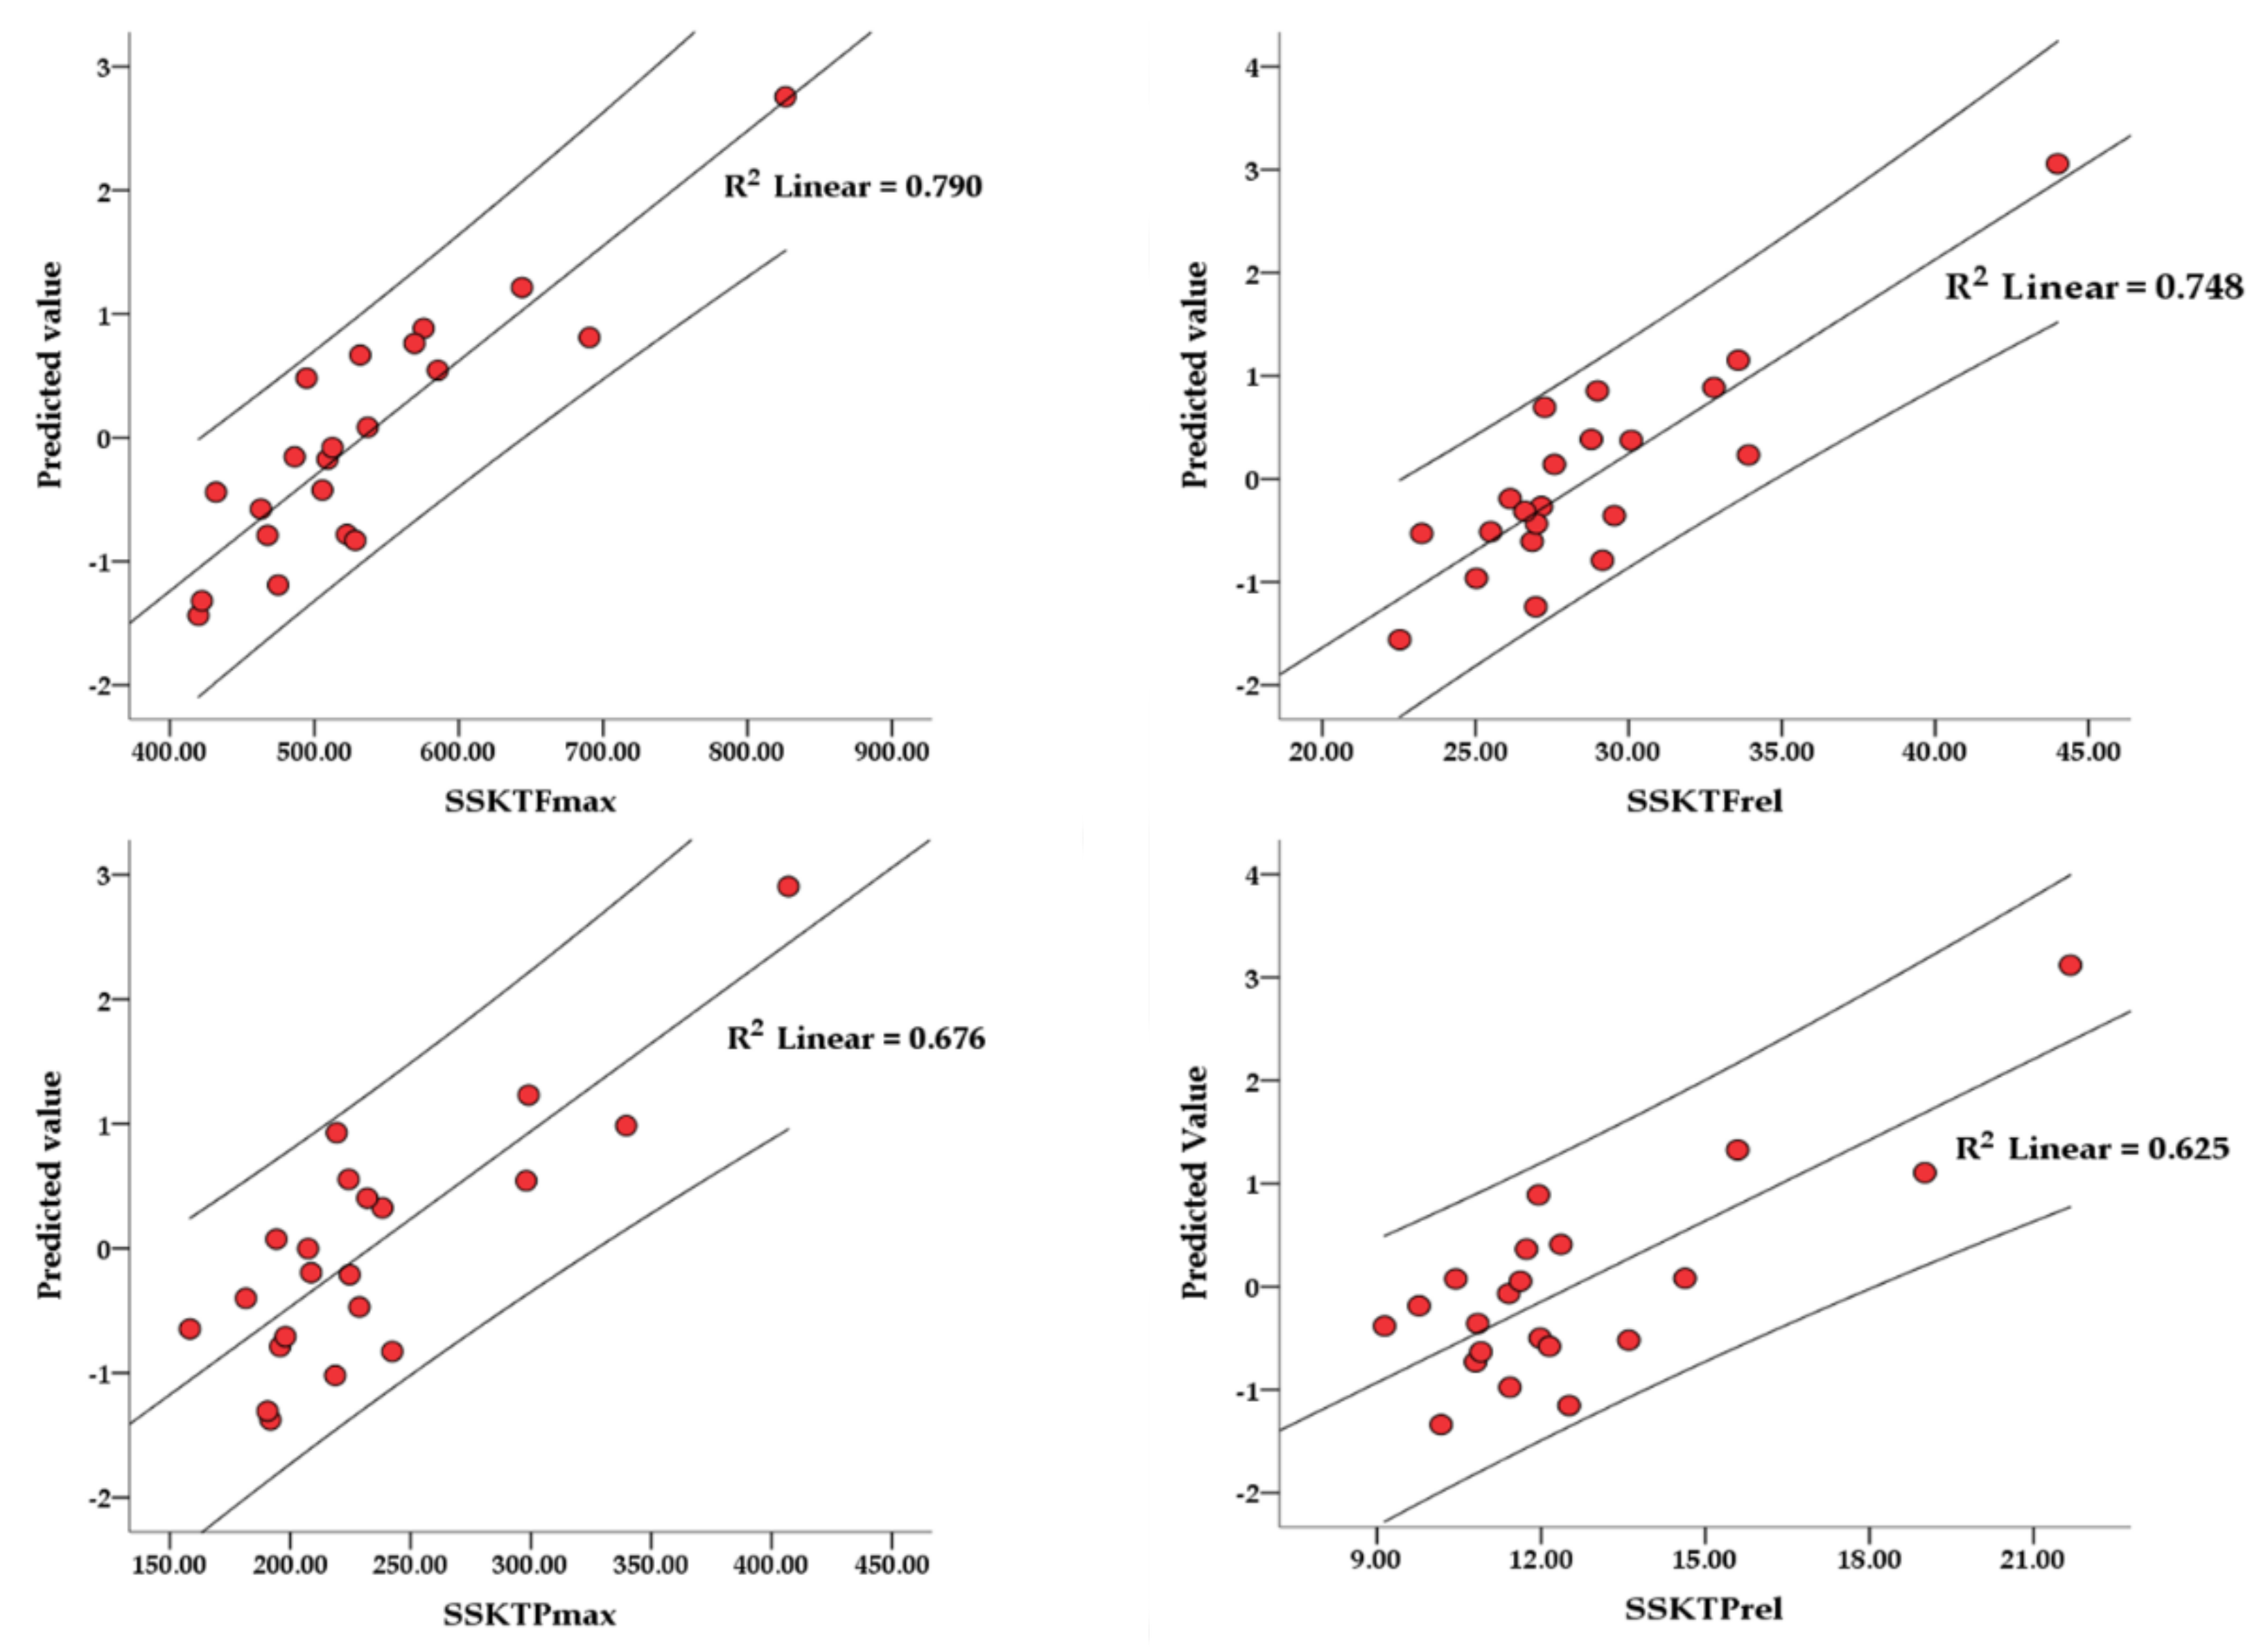
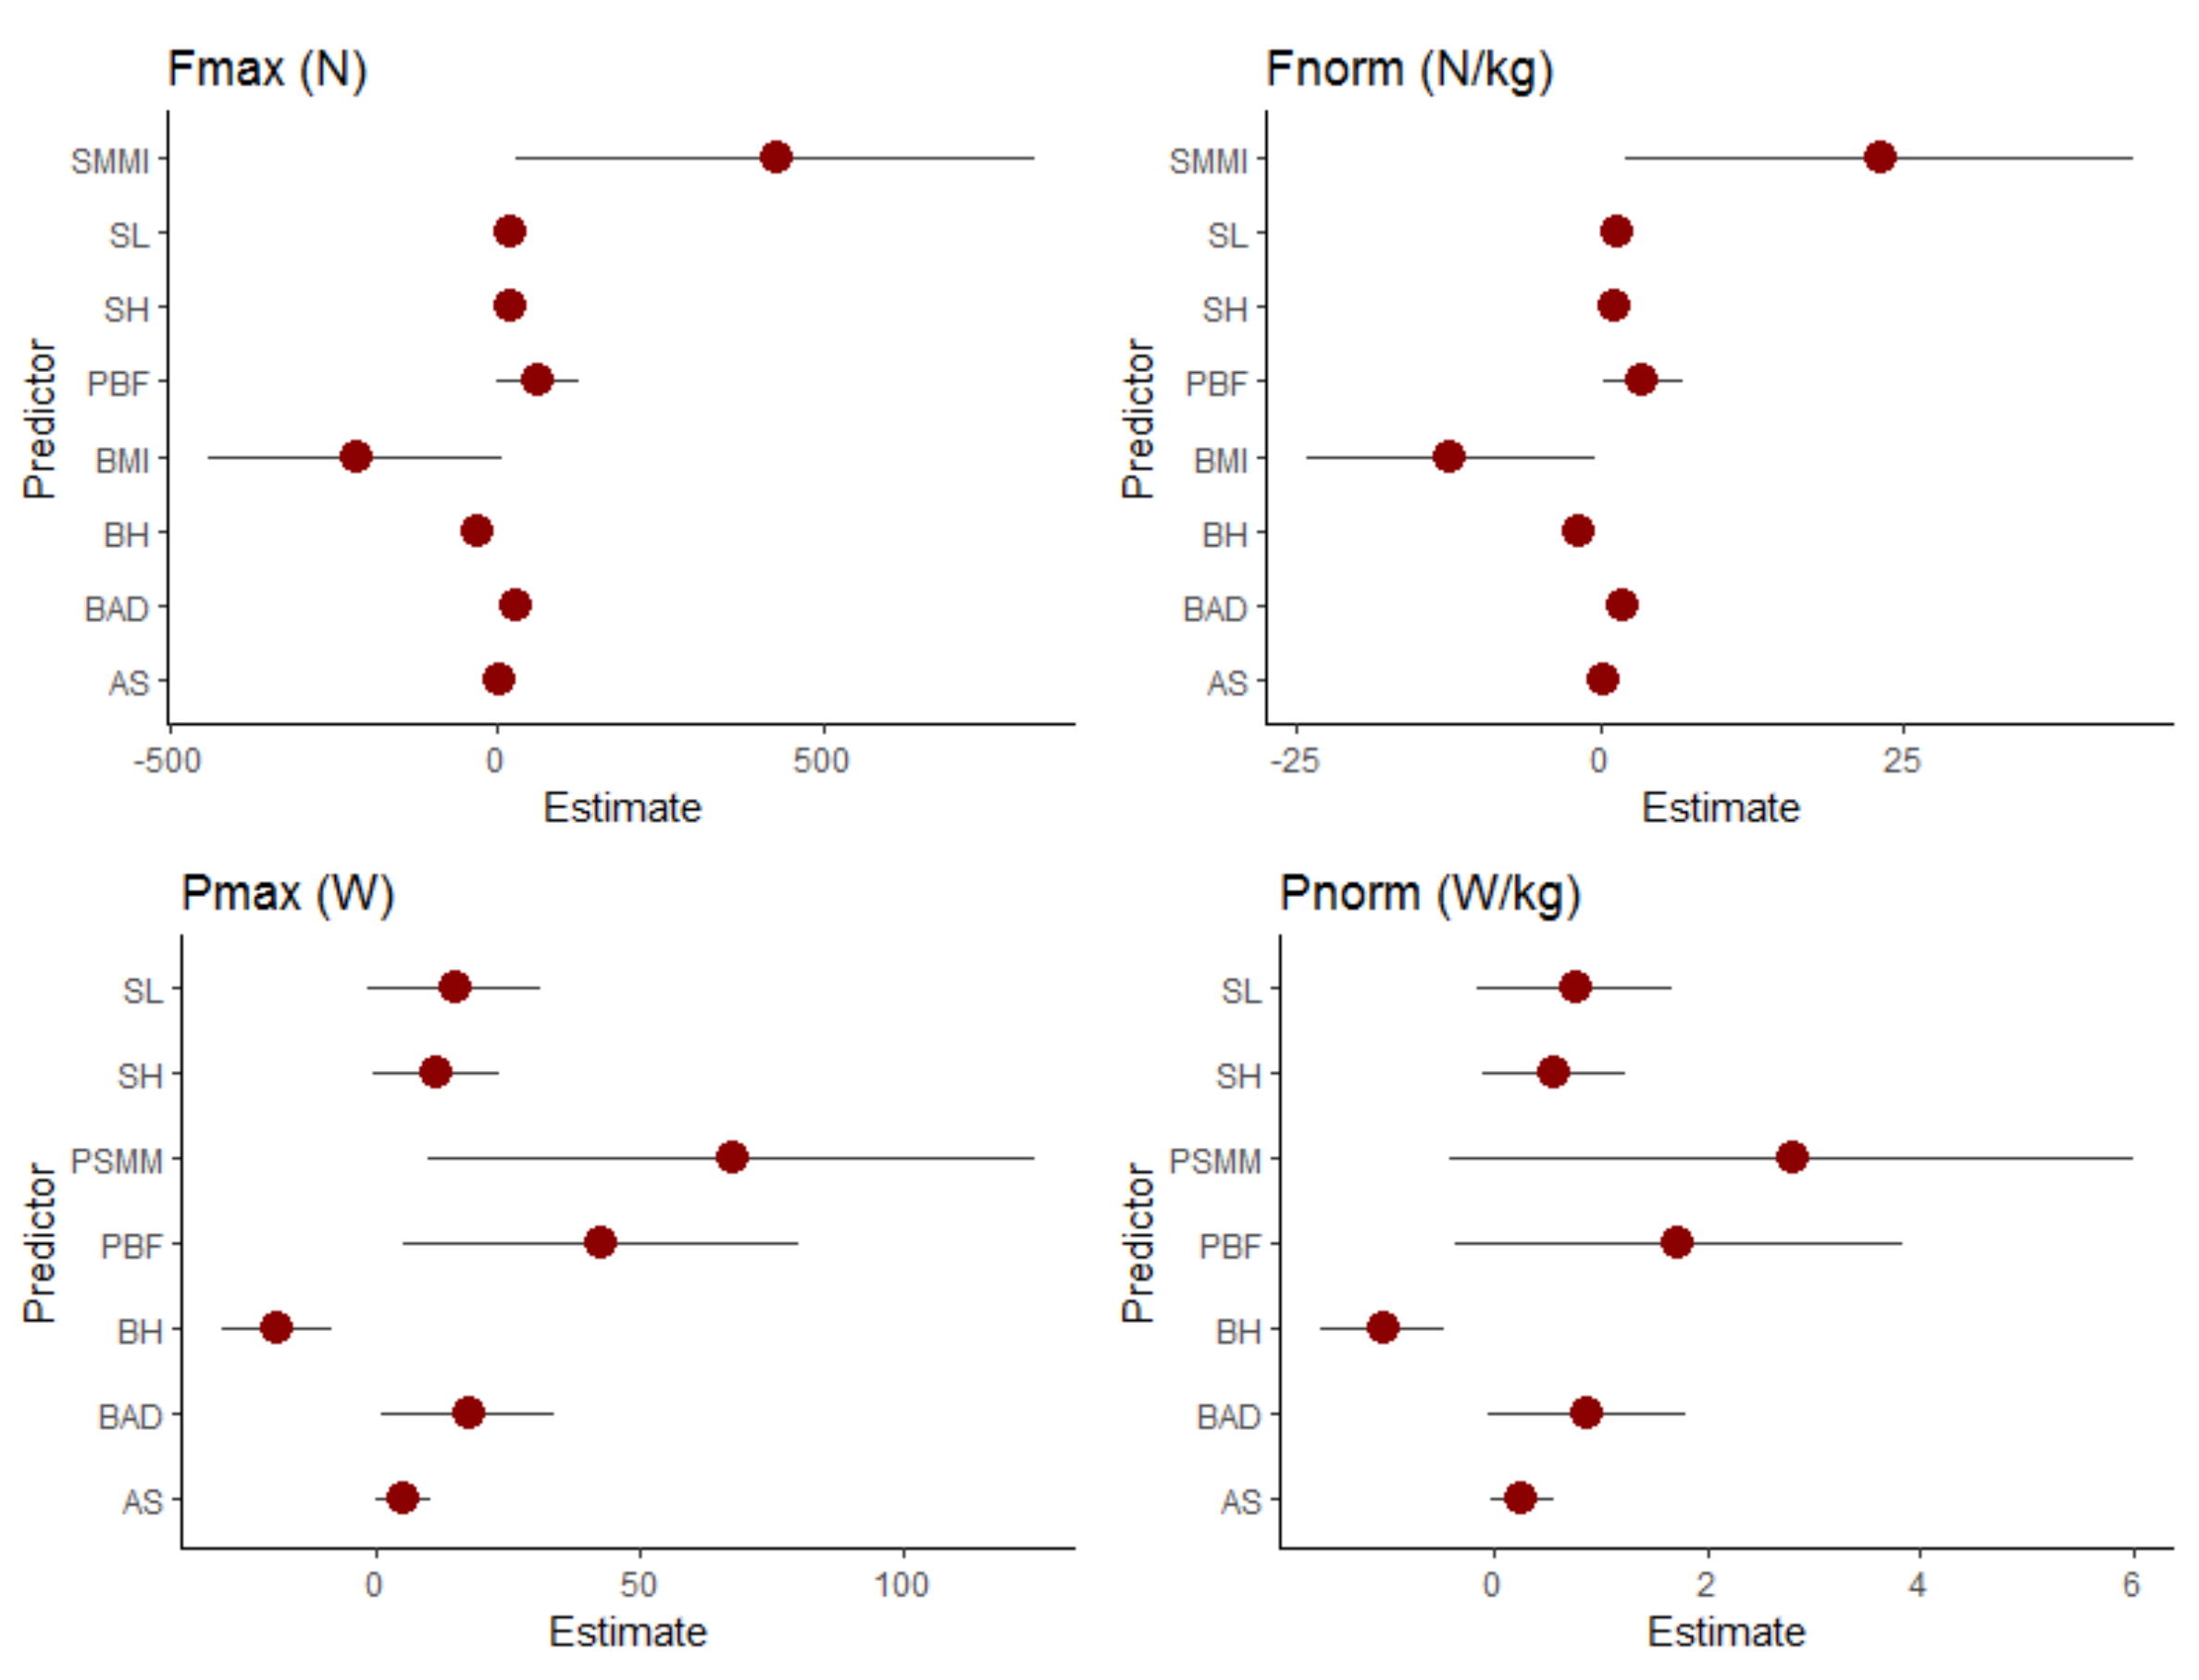
| Model | Unstandardized Coefficients | Standardized Coefficients | t | Sig. | 95.0% Confidence Interval for B | |||
|---|---|---|---|---|---|---|---|---|
| B | Std. Error | Beta | Lower Bound | Upper Bound | ||||
| SSKTFmax (N) | (Constant) | −1958.73 | 589.69 | −3.32 | 0.006 | −3243.55 | −673.92 | |
| BH | −29.55 | 7.25 | −1.94 | −4.08 | 0.002 | −45.34 | −13.76 | |
| SH | 20.87 | 7.55 | 0.70 | 2.77 | 0.017 | 4.43 | 37.31 | |
| BAD | 32.16 | 11.16 | 0.55 | 2.88 | 0.014 | 7.84 | 56.48 | |
| AS | 6.65 | 3.46 | 0.55 | 1.92 | 0.079 | −0.89 | 14.20 | |
| SL | 24.29 | 10.18 | 0.73 | 2.39 | 0.034 | 2.11 | 46.48 | |
| BMI | −213.83 | 102.66 | −3.63 | −2.08 | 0.059 | −437.52 | 9.85 | |
| PBF | 64.71 | 28.96 | 2.33 | 2.23 | 0.045 | 1.60 | 127.81 | |
| SMMI | 427.56 | 182.36 | 4.39 | 2.34 | 0.037 | 30.24 | 824.88 | |
| SSKTFrel (N/kg2/3) | (Constant) | −49.37 | 31.02 | −1.59 | 0.137 | −116.95 | 18.21 | |
| BH | −1.80 | 0.38 | −2.46 | −4.72 | 0.000 | −2.63 | −0.97 | |
| SH | 1.12 | 0.40 | 0.78 | 2.81 | 0.016 | 0.25 | 1.98 | |
| BAD | 1.77 | 0.59 | 0.63 | 3.02 | 0.011 | 0.49 | 3.05 | |
| AS | 0.36 | 0.18 | 0.62 | 2.00 | 0.069 | −0.03 | 0.76 | |
| SL | 1.29 | 0.54 | 0.80 | 2.41 | 0.033 | 0.13 | 2.46 | |
| BMI | −12.29 | 5.40 | −4.34 | −2.28 | 0.042 | −24.06 | −0.53 | |
| PBF | 3.51 | 1.52 | 2.63 | 2.30 | 0.040 | 0.19 | 6.82 | |
| SMMI | 23.02 | 9.59 | 4.91 | 2.40 | 0.034 | 2.12 | 43.92 | |
| SSKTPmax (W) | (Constant) | −4536.72 | 1557.72 | −2.91 | 0.012 | −7901.97 | −1171.47 | |
| BH | −18.84 | 4.81 | −2.02 | −3.91 | 0.002 | −29.24 | −8.44 | |
| SH | 11.31 | 5.56 | 0.62 | 2.03 | 0.063 | −0.70 | 23.33 | |
| BAD | 17.52 | 7.60 | 0.49 | 2.30 | 0.038 | 1.09 | 33.95 | |
| AS | 5.16 | 2.47 | 0.69 | 2.09 | 0.057 | −0.18 | 10.49 | |
| SL | 14.81 | 7.57 | 0.73 | 1.96 | 0.072 | −1.55 | 31.17 | |
| PBF | 42.62 | 17.47 | 2.52 | 2.44 | 0.030 | 4.86 | 80.37 | |
| PSMM | 67.57 | 26.67 | 2.59 | 2.53 | 0.025 | 9.96 | 125.18 | |
| SSKTPrel (W/kg2/3) | (Constant) | −176.51 | 86.84 | −2.03 | 0.063 | −364.13 | 11.10 | |
| BH | −1.04 | 0.27 | −2.15 | −3.87 | 0.002 | −1.62 | −0.46 | |
| SH | 0.56 | 0.31 | 0.59 | 1.80 | 0.094 | −0.11 | 1.23 | |
| BAD | 0.87 | 0.42 | 0.47 | 2.06 | 0.060 | −0.04 | 1.79 | |
| AS | 0.27 | 0.14 | 0.69 | 1.93 | 0.076 | −0.03 | 0.56 | |
| SL | 0.76 | 0.42 | 0.72 | 1.79 | 0.096 | −0.15 | 1.67 | |
| PBF | 1.73 | 0.97 | 1.97 | 1.78 | 0.099 | −0.37 | 3.84 | |
| PSMM | 2.79 | 1.49 | 2.07 | 1.88 | 0.083 | −0.42 | 6.01 | |
Publisher’s Note: MDPI stays neutral with regard to jurisdictional claims in published maps and institutional affiliations. |
© 2022 by the authors. Licensee MDPI, Basel, Switzerland. This article is an open access article distributed under the terms and conditions of the Creative Commons Attribution (CC BY) license (https://creativecommons.org/licenses/by/4.0/).
Share and Cite
Kukić, F.; Petrović, M.; Greco, G.; Cataldi, S.; Fischetti, F. Association of Anthropometrics and Body Composition with Maximal and Relative Force and Power of Kayak Stroke in Competitive Kayak Athletes. Int. J. Environ. Res. Public Health 2022, 19, 2977. https://doi.org/10.3390/ijerph19052977
Kukić F, Petrović M, Greco G, Cataldi S, Fischetti F. Association of Anthropometrics and Body Composition with Maximal and Relative Force and Power of Kayak Stroke in Competitive Kayak Athletes. International Journal of Environmental Research and Public Health. 2022; 19(5):2977. https://doi.org/10.3390/ijerph19052977
Chicago/Turabian StyleKukić, Filip, Miloš Petrović, Gianpiero Greco, Stefania Cataldi, and Francesco Fischetti. 2022. "Association of Anthropometrics and Body Composition with Maximal and Relative Force and Power of Kayak Stroke in Competitive Kayak Athletes" International Journal of Environmental Research and Public Health 19, no. 5: 2977. https://doi.org/10.3390/ijerph19052977