
Association between Participation in the Short Version of a Workplace Oral Health Promotion Program and Medical and Dental Care Expenditures in Japanese Workers: A Longitudinal Study


Abstract
:1. Introduction
2. Materials and Methods
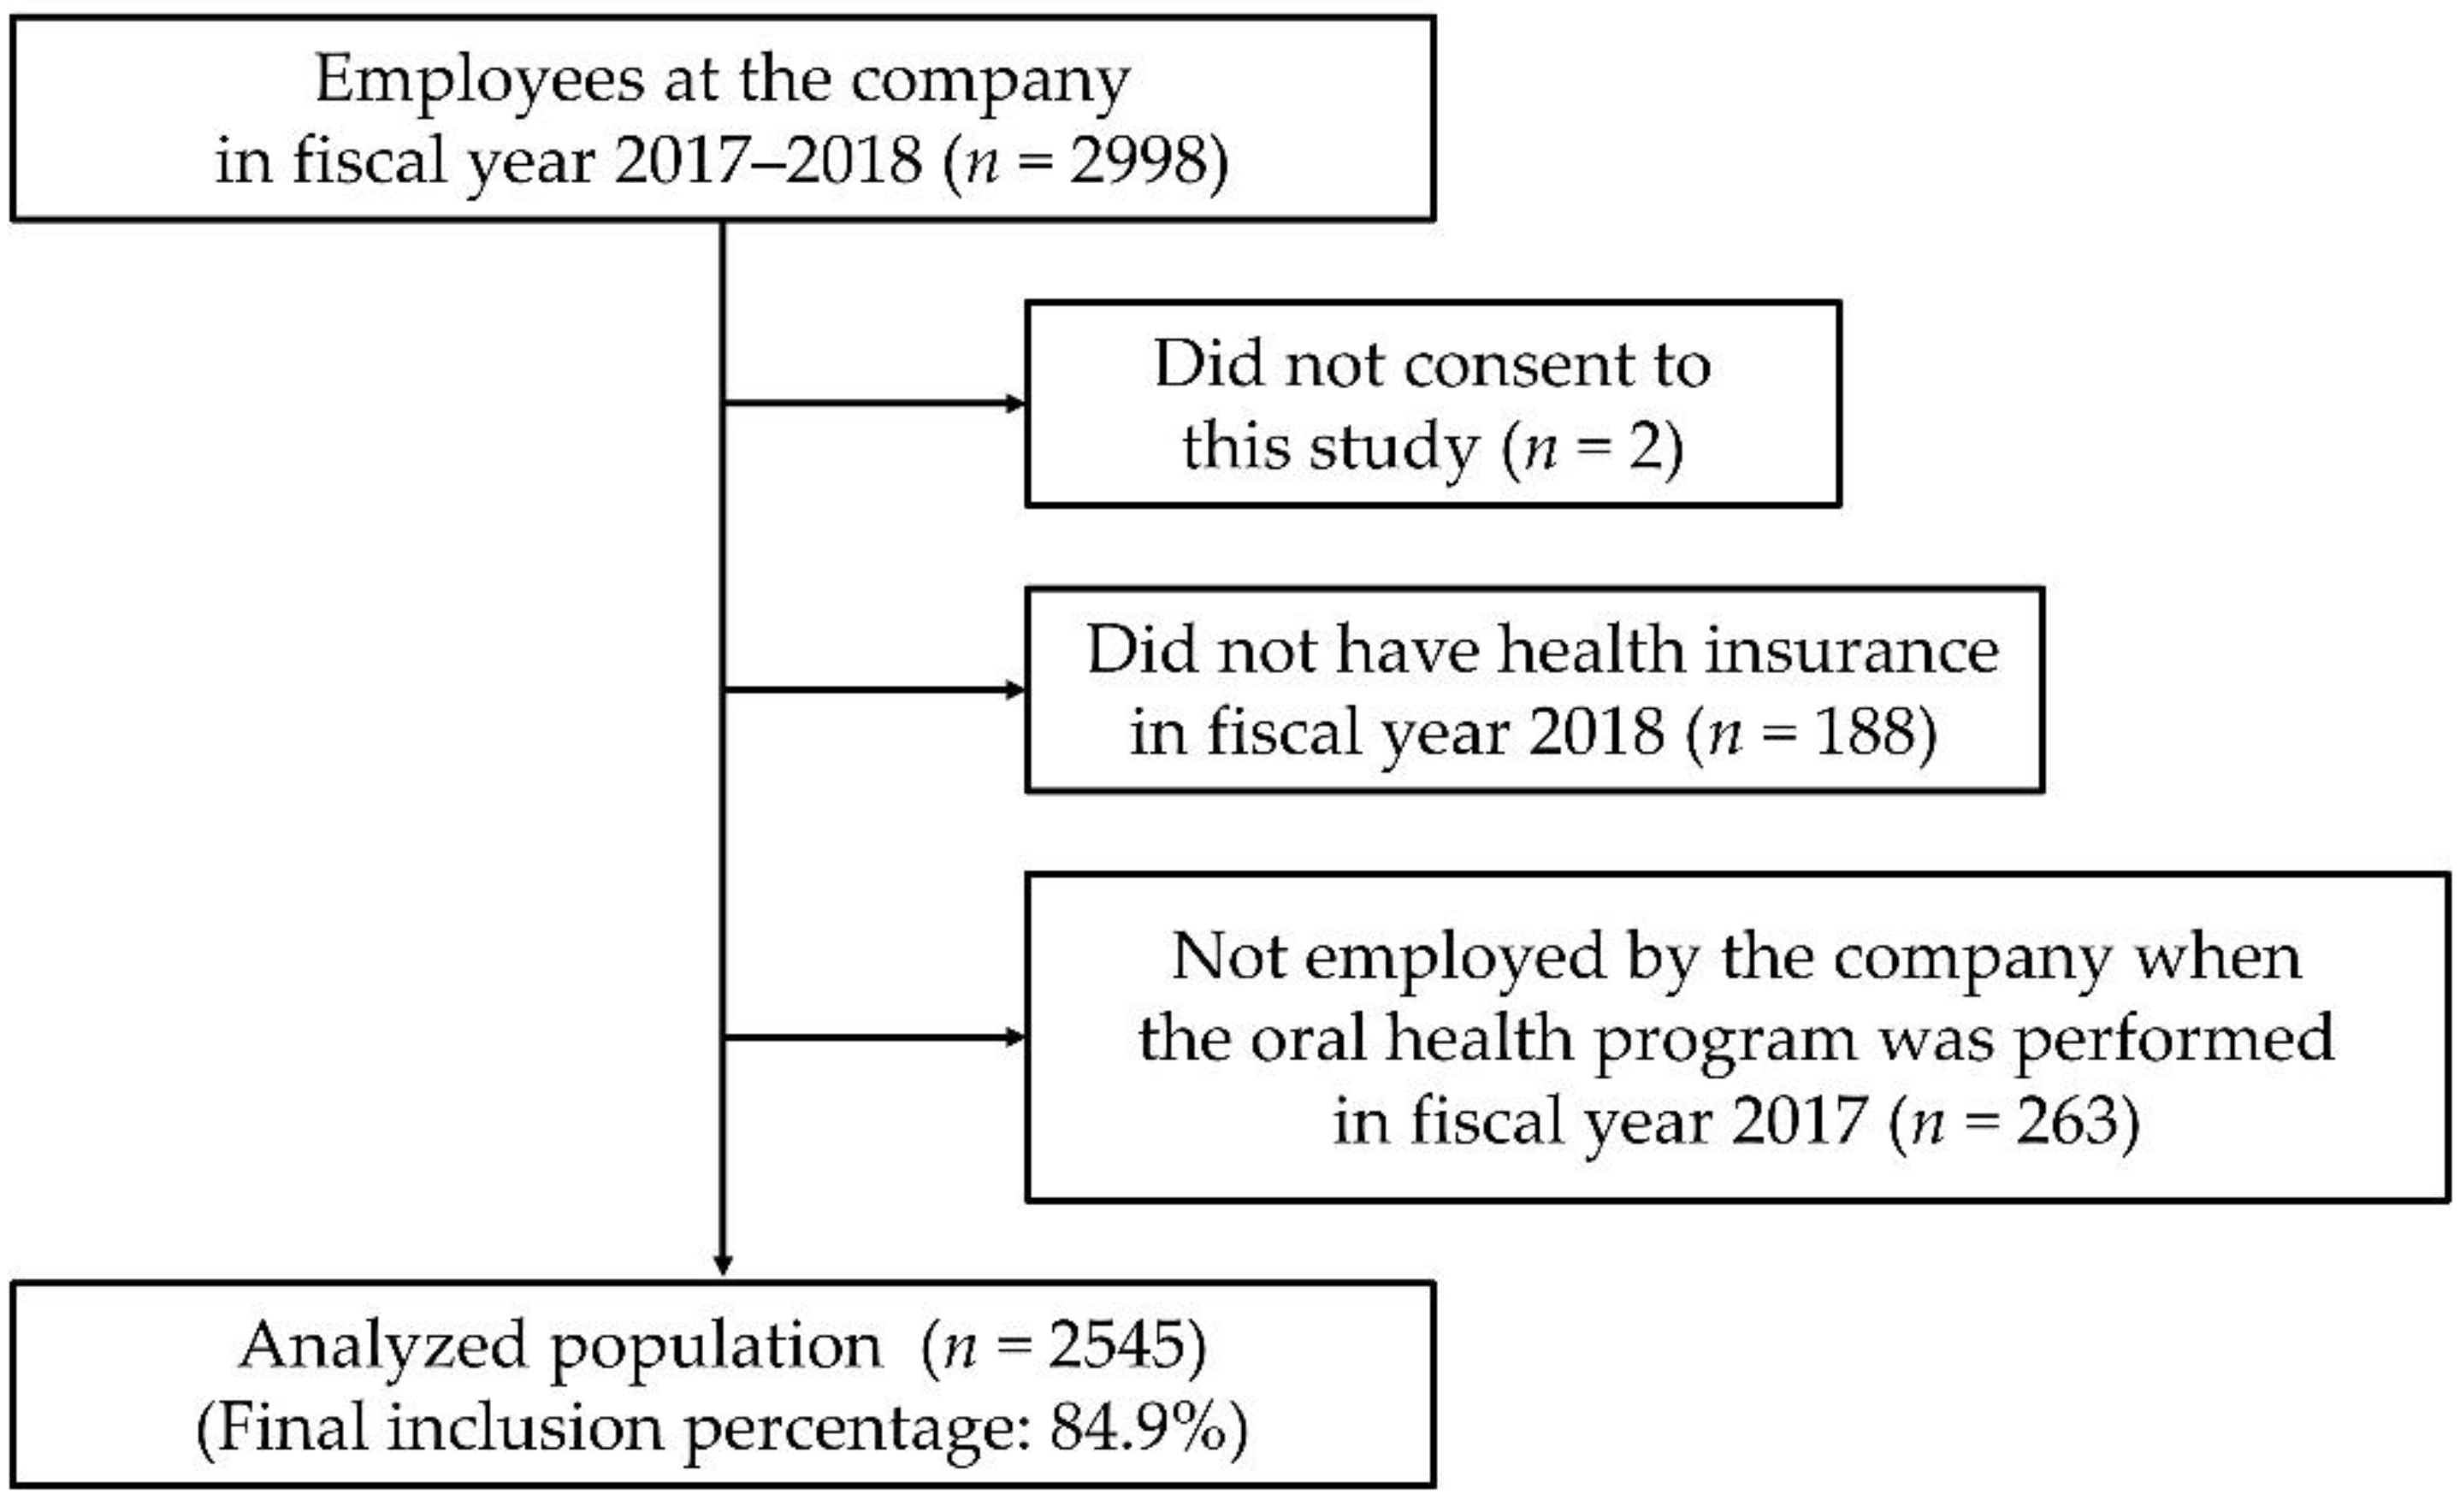
2.1. Study Design and Participants
2.2. Measures
2.3. Statistical Analysis
3. Results
4. Discussion
5. Conclusions
Author Contributions
Funding
Institutional Review Board Statement
Informed Consent Statement
Data Availability Statement
Acknowledgments
Conflicts of Interest
References
- Interim Evaluation Report of “Health Japan 21 (2nd Stage)”. Available online: https://www.mhlw.go.jp/content/000378318.pdf (accessed on 18 January 2022).
- Survey of Dental Diseases. Available online: https://www.mhlw.go.jp/toukei/list/62-17.html (accessed on 18 January 2022).
- Yatabe, N.; Furuta, M.; Takeuchi, K.; Suma, S.; Fuchida, S.; Yamamoto, T.; Yamashita, Y. Periodic and regional differences in estimated consultation rate for periodontal disease screening in Japan. J. Dent. Health 2018, 68, 92–100. [Google Scholar]
- Morishita, M.; Sakemi, M.; Tsutsumi, M.; Gake, S. Effectiveness of an oral health promotion programme at the workplace. J. Oral Rehabil. 2003, 30, 414–417. [Google Scholar] [CrossRef]
- Hanioka, T.; Shigemoto, Y.; Matsuse, R.; Ojima, M.; Shizukuishi, S. Effect of follow-up intervention of toothbrushing on periodontal health in workplace dental examination. J. Occup. Health 2004, 46, 199–204. [Google Scholar] [CrossRef] [Green Version]
- Ide, R.; Mizoue, T.; Tsukiyama, Y.; Ikeda, M.; Yoshimura, T. Evaluation of oral health promotion in the workplace: The effects on dental care costs and frequency of dental visits. Community Dent. Oral Epidemiol. 2001, 29, 213–219. [Google Scholar] [CrossRef]
- Kimura, H.; Goda, K.; Takeda, N.; Hirao, T.; Fukunaga, I.; Kageyama, H.; Jitsunari, F. Oral health promotion in the workplace and relative factors. J. Dent. Health 2001, 51, 37–47. [Google Scholar]
- Ishii, M.; Komatsuzaki, A.; Suetaka, T.; Iida, H. Relations between dental care expenses and dental health services carried out by health insurance associations. Jpn. J. Dent. Pract. Adm. 1999, 34, 58–66. [Google Scholar]
- Schou, L. Oral health promotion at worksites. Int. Dent. J. 1989, 39, 122–128. [Google Scholar] [PubMed]
- Cutress, T.W.; Ainamo, J.; Sardo-Infirri, J. The community periodontal index of treatment needs (CPITN) procedure for population groups and individuals. Int. Dent. J. 1987, 37, 222–233. [Google Scholar] [PubMed]
- Ichihashi, T.; Muto, T.; Shibuya, K. Cost-benefit analysis of a worksite oral-health promotion program. Ind. Health 2007, 45, 32–36. [Google Scholar] [CrossRef] [PubMed] [Green Version]
- Morita, M.; Kishimoto, E.; Ishikawa, A.; Kimura, T.; Tomozane, T.; Nishigawa, M.; Kuroki, R.; Kajiura, S.; Watanabe, T. Effect of dental health programs on periodontal disease in communities. Dent. Jpn. 1993, 30, 102–105. [Google Scholar]
- Seitz, M.W.; Listl, S.; Bartols, A.; Schubert, I.; Blaschke, K.; Haux, C.; Van Der Zande, M.M. Current knowledge on correlations between highly prevalent dental conditions and chronic diseases: An umbrella review. Prev. Chronic Dis. 2019, 16, E132. [Google Scholar] [CrossRef] [Green Version]
- Yamamoto, T.; Koyama, R.; Tamaki, N.; Maruyama, T.; Tomofuji, T.; Ekuni, D.; Yamanaka, R.; Azuma, T.; Morita, M. Validity of a questionnaire for periodontitis screening of Japanese employees. J. Occup. Health 2009, 51, 137–143. [Google Scholar] [CrossRef]
- Ekuni, D.; Yamane-Takeuchi, M.; Kataoka, K.; Yokoi, A.; Taniguchi-Tabata, A.; Mizuno, H.; Miyai, H.; Uchida, Y.; Fukuhara, D.; Sugiura, Y.; et al. Validity of a new kit measuring salivary lactate dehydrogenase level for screening gingivitis. Dis. Markers 2017, 2017, 9547956. [Google Scholar] [CrossRef]
- Taniguchi-Tabata, A.; Ekuni, D.; Azuma, T.; Yoneda, T.; Yamane-Takeuchi, M.; Kataoka, K.; Mizuno, H.; Miyai, H.; Iwasaki, Y.; Morita, M. The level of salivary lactate dehydrogenase as an indicator of the association between gingivitis and related factors in Japanese university students. J. Oral Sci. 2019, 61, 133–139. [Google Scholar] [CrossRef] [PubMed] [Green Version]
- Morita, M.; Nishi, K.; Watanabe, T. Comparison of 2 toothbrushing methods for efficacy in supragingival plaque removal. The Toothpick method and the Bass method. J. Clin. Periodontol. 1998, 25, 829–831. [Google Scholar] [CrossRef] [PubMed]
- Naegele, E.R.; Cunha-Cruz, J.; Nadanovsky, P. Disparity between dental needs and dental treatment provided. J. Dent. Res. 2010, 89, 975–979. [Google Scholar] [CrossRef] [PubMed]
- Tsuneishi, M.; Yamamoto, T.; Ishii, T.; Wada, K.; Sugiyama, S. Association between number of teeth and medical and dental care expenditure-analysis using the Receipt and Health Checkup Information Database in Japan. Jpn. J. Dent. Pract. Adm. 2016, 51, 136–142. [Google Scholar]
- Sanz, M.; Ceriello, A.; Buysschaert, M.; Chapple, I.; Demmer, R.T.; Graziani, F.; Herrera, D.; Jepsen, S.; Lione, L.; Madianos, P.; et al. Scientific evidence on the links between periodontal diseases and diabetes: Consensus report and guidelines of the joint workshop on periodontal diseases and diabetes by the International Diabetes Federation and the European Federation of Periodontology. J. Clin. Periodontol. 2018, 45, 138–149. [Google Scholar] [CrossRef] [PubMed]
- Ichihashi, T.; Nishinoue, N.; Takada, K.; Muto, T. Comparison of oral health status and health behaviors between participants and non-participants of voluntary participation-based occupational oral health program. J. Dent. Health 2013, 63, 238–248. [Google Scholar]
- Ichihashi, T.; Muto, T. Effectiveness of worksite dental health promotion activities in terms of dental and medical expenses and number of visits for treatment. J. Dent. Health 2001, 51, 168–175. [Google Scholar]


| Total | Participation in Fiscal Year 2017 and Prior | p b | |||||||
|---|---|---|---|---|---|---|---|---|---|
| Never | Once | Twice or More | |||||||
| (n = 2545) | (n = 1258) | (n = 86) | (n = 1201) | ||||||
| n | n | % | n | % | n | % | |||
| Sex | Male | 1059 | 494 | 46.6 | 39 | 3.7 | 526 | 49.7 | 0.058 |
| Female | 1486 | 764 | 51.4 | 47 | 3.2 | 675 | 45.4 | ||
| Diabetes mellitus | Without | 2277 | 1120 | 49.2 | 79 | 3.5 | 1078 | 47.3 | 0.642 |
| With | 268 | 138 | 51.5 | 7 | 2.6 | 123 | 45.9 | ||
| % | Statistics | Statistics | Statistics | p c | |||||
| Age in fiscal year 2017 (y) d | Median | 41 | 30 | 39 | <0.001 | ||||
| 25th percentile | 34 | 24 | 32 | ||||||
| 75th percentile | 47 | 40 | 46 | ||||||
| Dental care expenditures in fiscal year 2018 (Japanese yen a) | Median | 8950 | 12,480 | 8960 | 0.364 | ||||
| 25th percentile | 0 | 0 | 0 | ||||||
| 75th percentile | 30,690 | 37,988 | 28,560 | ||||||
| Percentage of zeros | 44.0% | ||||||||
| Periodontal care expenditures in fiscal year 2018 (Japanese yen) | Median | 5295 | 8390 | 6950 | 0.732 | ||||
| 25th percentile | 0 | 0 | 0 | ||||||
| 75th percentile | 26,403 | 28,998 | 24,990 | ||||||
| Percentage of zeros | 48.7% | ||||||||
| Medical care expenditures in fiscal year 2018 (Japanese yen) | Median | 30,530 | 31,035 | 37,060 | 0.083 | ||||
| 25th percentile | 11,678 | 14,708 | 14,070 | ||||||
| 75th percentile | 75,818 | 80,400 | 75,505 | ||||||
| Percentage of zeros | 4.4% | ||||||||
| Number of days of dental treatment in fiscal year 2018 | Median | 1.0 | 2.0 | 1.0 | 0.267 | ||||
| 25th percentile | 0.0 | 0.0 | 0.0 | ||||||
| 75th percentile | 4.0 | 5.0 | 4.0 | ||||||
| Percentage of zeros | 44.0% | ||||||||
| Number of days of periodontal treatment in fiscal year 2018 | Median | 1.0 | 1.0 | 1.0 | 0.703 | ||||
| 25th percentile | 0.0 | 0.0 | 0.0 | ||||||
| 75th percentile | 4.0 | 4.0 | 3.0 | ||||||
| Percentage of zeros | 48.7% | ||||||||
| Number of days of medical treatment in fiscal year 2018 e | Median | 5.0 | 5.0 | 6.0 | 0.013 | ||||
| 25th percentile | 2.0 | 2.0 | 3.0 | ||||||
| 75th percentile | 11.0 | 11.0 | 12.0 | ||||||
| Percentage of zeros | 4.5% | ||||||||
| Outcome Variable | Explanatory Variable | Zero-Inflated Part | Negative Binomial Part | |||||||
|---|---|---|---|---|---|---|---|---|---|---|
| OR a | 95% CI | p | RR b | 95% CI | p | |||||
| Low | High | Low | High | |||||||
| Dental care expenditures in fiscal year 2018 | Sex | Male | 1.00 | (reference) | 1.00 | (reference) | ||||
| Female | 0.59 | 0.40 | 0.88 | 0.010 | 0.84 | 0.83 | 0.85 | <0.001 | ||
| Age | 0.98 | 0.97 | 0.99 | <0.001 | 1.01 | 0.98 | 1.04 | 0.666 | ||
| Participation in the program in the fiscal year 2017 and prior | Never | 1.00 | (reference) | 1.00 | (reference) | |||||
| Once | 0.47 | 0.35 | 0.62 | <0.001 | 0.86 | 0.48 | 1.53 | 0.600 | ||
| Twice or more | 0.82 | 0.64 | 1.05 | 0.115 | 0.84 | 0.83 | 0.85 | <0.001 | ||
| Periodontal care expenditures in fiscal year 2018 | Sex | Male | 1.00 | (reference) | 1.00 | (reference) | ||||
| Female | 0.68 | 0.60 | 0.78 | <0.001 | 0.85 | 0.83 | 0.88 | <0.001 | ||
| Age | 0.98 | 0.97 | 0.99 | <0.001 | 1.01 | 0.98 | 1.04 | 0.689 | ||
| Participation in the program in the fiscal year 2017 and prior | Never | 1.00 | (reference) | 1.00 | (reference) | |||||
| Once | 0.48 | 0.35 | 0.67 | <0.001 | 0.79 | 0.50 | 1.24 | 0.301 | ||
| Twice or more | 0.79 | 0.67 | 0.92 | 0.003 | 0.85 | 0.83 | 0.87 | <0.001 | ||
| Number of days of dental treatment in fiscal year 2018 | Sex | Male | 1.00 | (reference) | 1.00 | (reference) | ||||
| Female | 0.43 | 0.22 | 0.81 | 0.009 | 0.82 | 0.75 | 0.91 | <0.001 | ||
| Age | 0.98 | 0.97 | 0.99 | <0.001 | 1.01 | 0.97 | 1.05 | 0.665 | ||
| Participation in the program in the fiscal year 2017 and prior | Never | 1.00 | (reference) | 1.00 | (reference) | |||||
| Once | 0.29 | 0.15 | 0.56 | <0.001 | 0.83 | 0.35 | 1.98 | 0.668 | ||
| Twice or more | 0.67 | 0.53 | 0.85 | 0.001 | 0.79 | 0.78 | 0.79 | <0.001 | ||
| Number of days of periodontal treatment in fiscal year 2018 | Sex | Male | 1.00 | (reference) | 1.00 | (reference) | ||||
| Female | 0.53 | 0.41 | 0.67 | <0.001 | 0.82 | 0.72 | 0.94 | 0.004 | ||
| Age | 0.98 | 0.97 | 0.98 | <0.001 | 1.01 | 0.97 | 1.05 | 0.695 | ||
| Participation in the program in the fiscal year 2017 and prior | Never | 1.00 | (reference) | 1.00 | (reference) | |||||
| Once | 0.27 | 0.14 | 0.53 | <0.001 | 0.72 | 0.34 | 1.52 | 0.395 | ||
| Twice or more | 0.65 | 0.55 | 0.76 | <0.001 | 0.80 | 0.74 | 0.87 | <0.001 | ||
| Outcome Variable in Fiscal Year 2018 | Participation in the Program in Fiscal Year 2017 and Prior (Reference: Never) | Zero-Inflated Part | Negative Binomial Part | ||||||
|---|---|---|---|---|---|---|---|---|---|
| OR a | 95% CI | p | RR b | 95% CI | p | ||||
| Low | High | Low | High | ||||||
| Male | |||||||||
| Dental care | Once | 0.25 | 0.24 | 0.26 | <0.001 | 0.75 | 0.36 | 1.56 | 0.445 |
| expenditures | Twice or more | 0.73 | 0.51 | 1.04 | 0.085 | 0.85 | 0.68 | 1.06 | 0.153 |
| Periodontal care | Once | 0.22 | 0.17 | 0.29 | <0.001 | 0.68 | 0.40 | 1.17 | 0.166 |
| expenditures | Twice or more | 0.72 | 0.52 | 1.00 | 0.048 | 0.87 | 0.66 | 1.16 | 0.338 |
| Number of days of | Once | 0.15 | 0.09 | 0.23 | <0.001 | 0.76 | 0.22 | 2.62 | 0.669 |
| dental treatment | Twice or more | 0.65 | 0.40 | 1.05 | 0.076 | 0.81 | 0.58 | 1.14 | 0.226 |
| Number of days of | Once | 0.07 | 0.05 | 0.12 | <0.001 | 0.68 | 0.22 | 2.09 | 0.500 |
| periodontal treatment | Twice or more | 0.63 | 0.38 | 1.06 | 0.080 | 0.83 | 0.53 | 1.32 | 0.436 |
| Female | |||||||||
| Dental care | Once | 0.56 | 0.16 | 1.92 | 0.355 | 0.82 | 0.35 | 1.90 | 0.644 |
| Dexpenditures | Twice or more | 0.80 | 0.54 | 1.18 | 0.255 | 0.79 | 0.76 | 0.82 | <0.001 |
| Periodontal care | Once | 0.65 | 0.14 | 2.90 | 0.570 | 0.77 | 0.35 | 1.71 | 0.521 |
| expenditures | Twice or more | 0.75 | 0.58 | 0.97 | 0.031 | 0.79 | 0.77 | 0.81 | <0.001 |
| Number of days of | Once | 0.43 | 0.05 | 3.95 | 0.457 | 0.74 | 0.23 | 2.39 | 0.619 |
| dental treatment | Twice or more | 0.56 | 0.37 | 0.86 | 0.008 | 0.72 | 0.69 | 0.75 | <0.001 |
| Number of days of | Once | 0.53 | 0.05 | 5.19 | 0.588 | 0.64 | 0.21 | 1.93 | 0.427 |
| periodontal treatment | Twice or more | 0.54 | 0.43 | 0.69 | <0.001 | 0.72 | 0.71 | 0.73 | <0.001 |
| Outcome Variable | Explanatory Variable | Model 1 | Model 2 | |||||||
|---|---|---|---|---|---|---|---|---|---|---|
| RR a | 95% CI | p | RR a | 95% CI | p | |||||
| Low | High | Low | High | |||||||
| Medical care expenditures in fiscal year 2018 | Sex | Male | 1.00 | (reference) | 1.00 | (reference) | ||||
| Female | 1.00 | 0.63 | 1.57 | 0.989 | 1.16 | 0.56 | 2.38 | 0.691 | ||
| Age (y) | 1.02 | 0.96 | 1.09 | 0.518 | 1.01 | 0.97 | 1.07 | 0.575 | ||
| Diabetes mellitus | Without | 1.00 | (reference) | 1.00 | (reference) | |||||
| With | 4.07 | 0.13 | 127.49 | 0.425 | ||||||
| Participation in the program in the fiscal year 2017 and prior | Never | 1.00 | (reference) | 1.00 | (reference) | |||||
| Once | 0.77 | 0.36 | 1.67 | 0.511 | 0.89 | 0.33 | 2.37 | 0.814 | ||
| Twice or more | 0.81 | 0.77 | 0.85 | <0.001 | 0.85 | 0.75 | 0.97 | 0.014 | ||
| Number of days of medical treatment in fiscal year 2018 | Sex | Male | 1.00 | (reference) | 1.00 | (reference) | ||||
| Female | 1.17 | 0.63 | 2.16 | 0.620 | 1.23 | 0.61 | 2.47 | 0.568 | ||
| Age (y) | 1.01 | 0.98 | 1.04 | 0.625 | 1.00 | 0.98 | 1.02 | 0.839 | ||
| Diabetes mellitus | Without | 1.00 | (reference) | 1.00 | (reference) | |||||
| With | 2.05 | 0.31 | 13.49 | 0.453 | ||||||
| Participation in the program in the fiscal year 2017 and prior | Never | 1.00 | (reference) | 1.00 | (reference) | |||||
| Once | 0.84 | 0.50 | 1.40 | 0.493 | 0.83 | 0.52 | 1.32 | 0.429 | ||
| Twice or more | 1.00 | 0.74 | 1.35 | 0.990 | 1.00 | 0.74 | 1.33 | 0.975 | ||
| Outcome Variable in Fiscal Year 2018 | Participation in the Program in Fiscal Year 2017 and Prior (Reference: Never) | Model 1 | Model 2 | ||||||
|---|---|---|---|---|---|---|---|---|---|
| RR a | 95% CI | p | RR a | 95% CI | p | ||||
| Low | High | Low | High | ||||||
| Male | |||||||||
| Medical care | Once | 0.37 | 0.33 | 0.42 | <0.001 | 0.46 | 0.31 | 0.69 | <0.001 |
| expenditures | Twice or more | 0.65 | 0.60 | 0.70 | <0.001 | 0.90 | 0.53 | 1.52 | 0.688 |
| Number of days of medical treatment | Once | 0.62 | 0.41 | 0.93 | 0.022 | 0.59 | 0.44 | 0.80 | 0.001 |
| Twice or more | 0.90 | 0.67 | 1.20 | 0.461 | 0.92 | 0.67 | 1.27 | 0.601 | |
| Female | 1.02 | 0.95 | 1.09 | 0.574 | 1.01 | 0.96 | 1.07 | 0.640 | |
| Medical care | Once | 0.96 | 0.20 | 4.53 | 0.960 | 1.06 | 0.20 | 5.56 | 0.947 |
| expenditures | Twice or more | 0.88 | 0.65 | 1.19 | 0.407 | 0.77 | 0.75 | 0.78 | <0.001 |
| Number of days of medical treatment | Once | 0.85 | 0.38 | 1.90 | 0.696 | 0.87 | 0.39 | 1.98 | 0.749 |
| Twice or more | 1.02 | 0.67 | 1.57 | 0.922 | 1.00 | 0.69 | 1.45 | 0.997 | |
Publisher’s Note: MDPI stays neutral with regard to jurisdictional claims in published maps and institutional affiliations. |
© 2022 by the authors. Licensee MDPI, Basel, Switzerland. This article is an open access article distributed under the terms and conditions of the Creative Commons Attribution (CC BY) license (https://creativecommons.org/licenses/by/4.0/).
Share and Cite
Mochida, Y.; Fuchida, S.; Yamamoto, T. Association between Participation in the Short Version of a Workplace Oral Health Promotion Program and Medical and Dental Care Expenditures in Japanese Workers: A Longitudinal Study. Int. J. Environ. Res. Public Health 2022, 19, 3143. https://doi.org/10.3390/ijerph19053143
Mochida Y, Fuchida S, Yamamoto T. Association between Participation in the Short Version of a Workplace Oral Health Promotion Program and Medical and Dental Care Expenditures in Japanese Workers: A Longitudinal Study. International Journal of Environmental Research and Public Health. 2022; 19(5):3143. https://doi.org/10.3390/ijerph19053143
Chicago/Turabian StyleMochida, Yuki, Shinya Fuchida, and Tatsuo Yamamoto. 2022. "Association between Participation in the Short Version of a Workplace Oral Health Promotion Program and Medical and Dental Care Expenditures in Japanese Workers: A Longitudinal Study" International Journal of Environmental Research and Public Health 19, no. 5: 3143. https://doi.org/10.3390/ijerph19053143