
Comparison of Four Tourmalines for PS Activation to Degrade Sulfamethazine: Efficiency, Kinetics and Mechanisms


Abstract
:1. Introduction
2. Materials and Methods
2.1. Materials
2.2. Experimental Procedures
2.3. Materials Characterization and Sample Analysis
3. Results and Discussion
3.1. TM Characterization
3.1.1. SEM and EDS
3.1.2. XRD
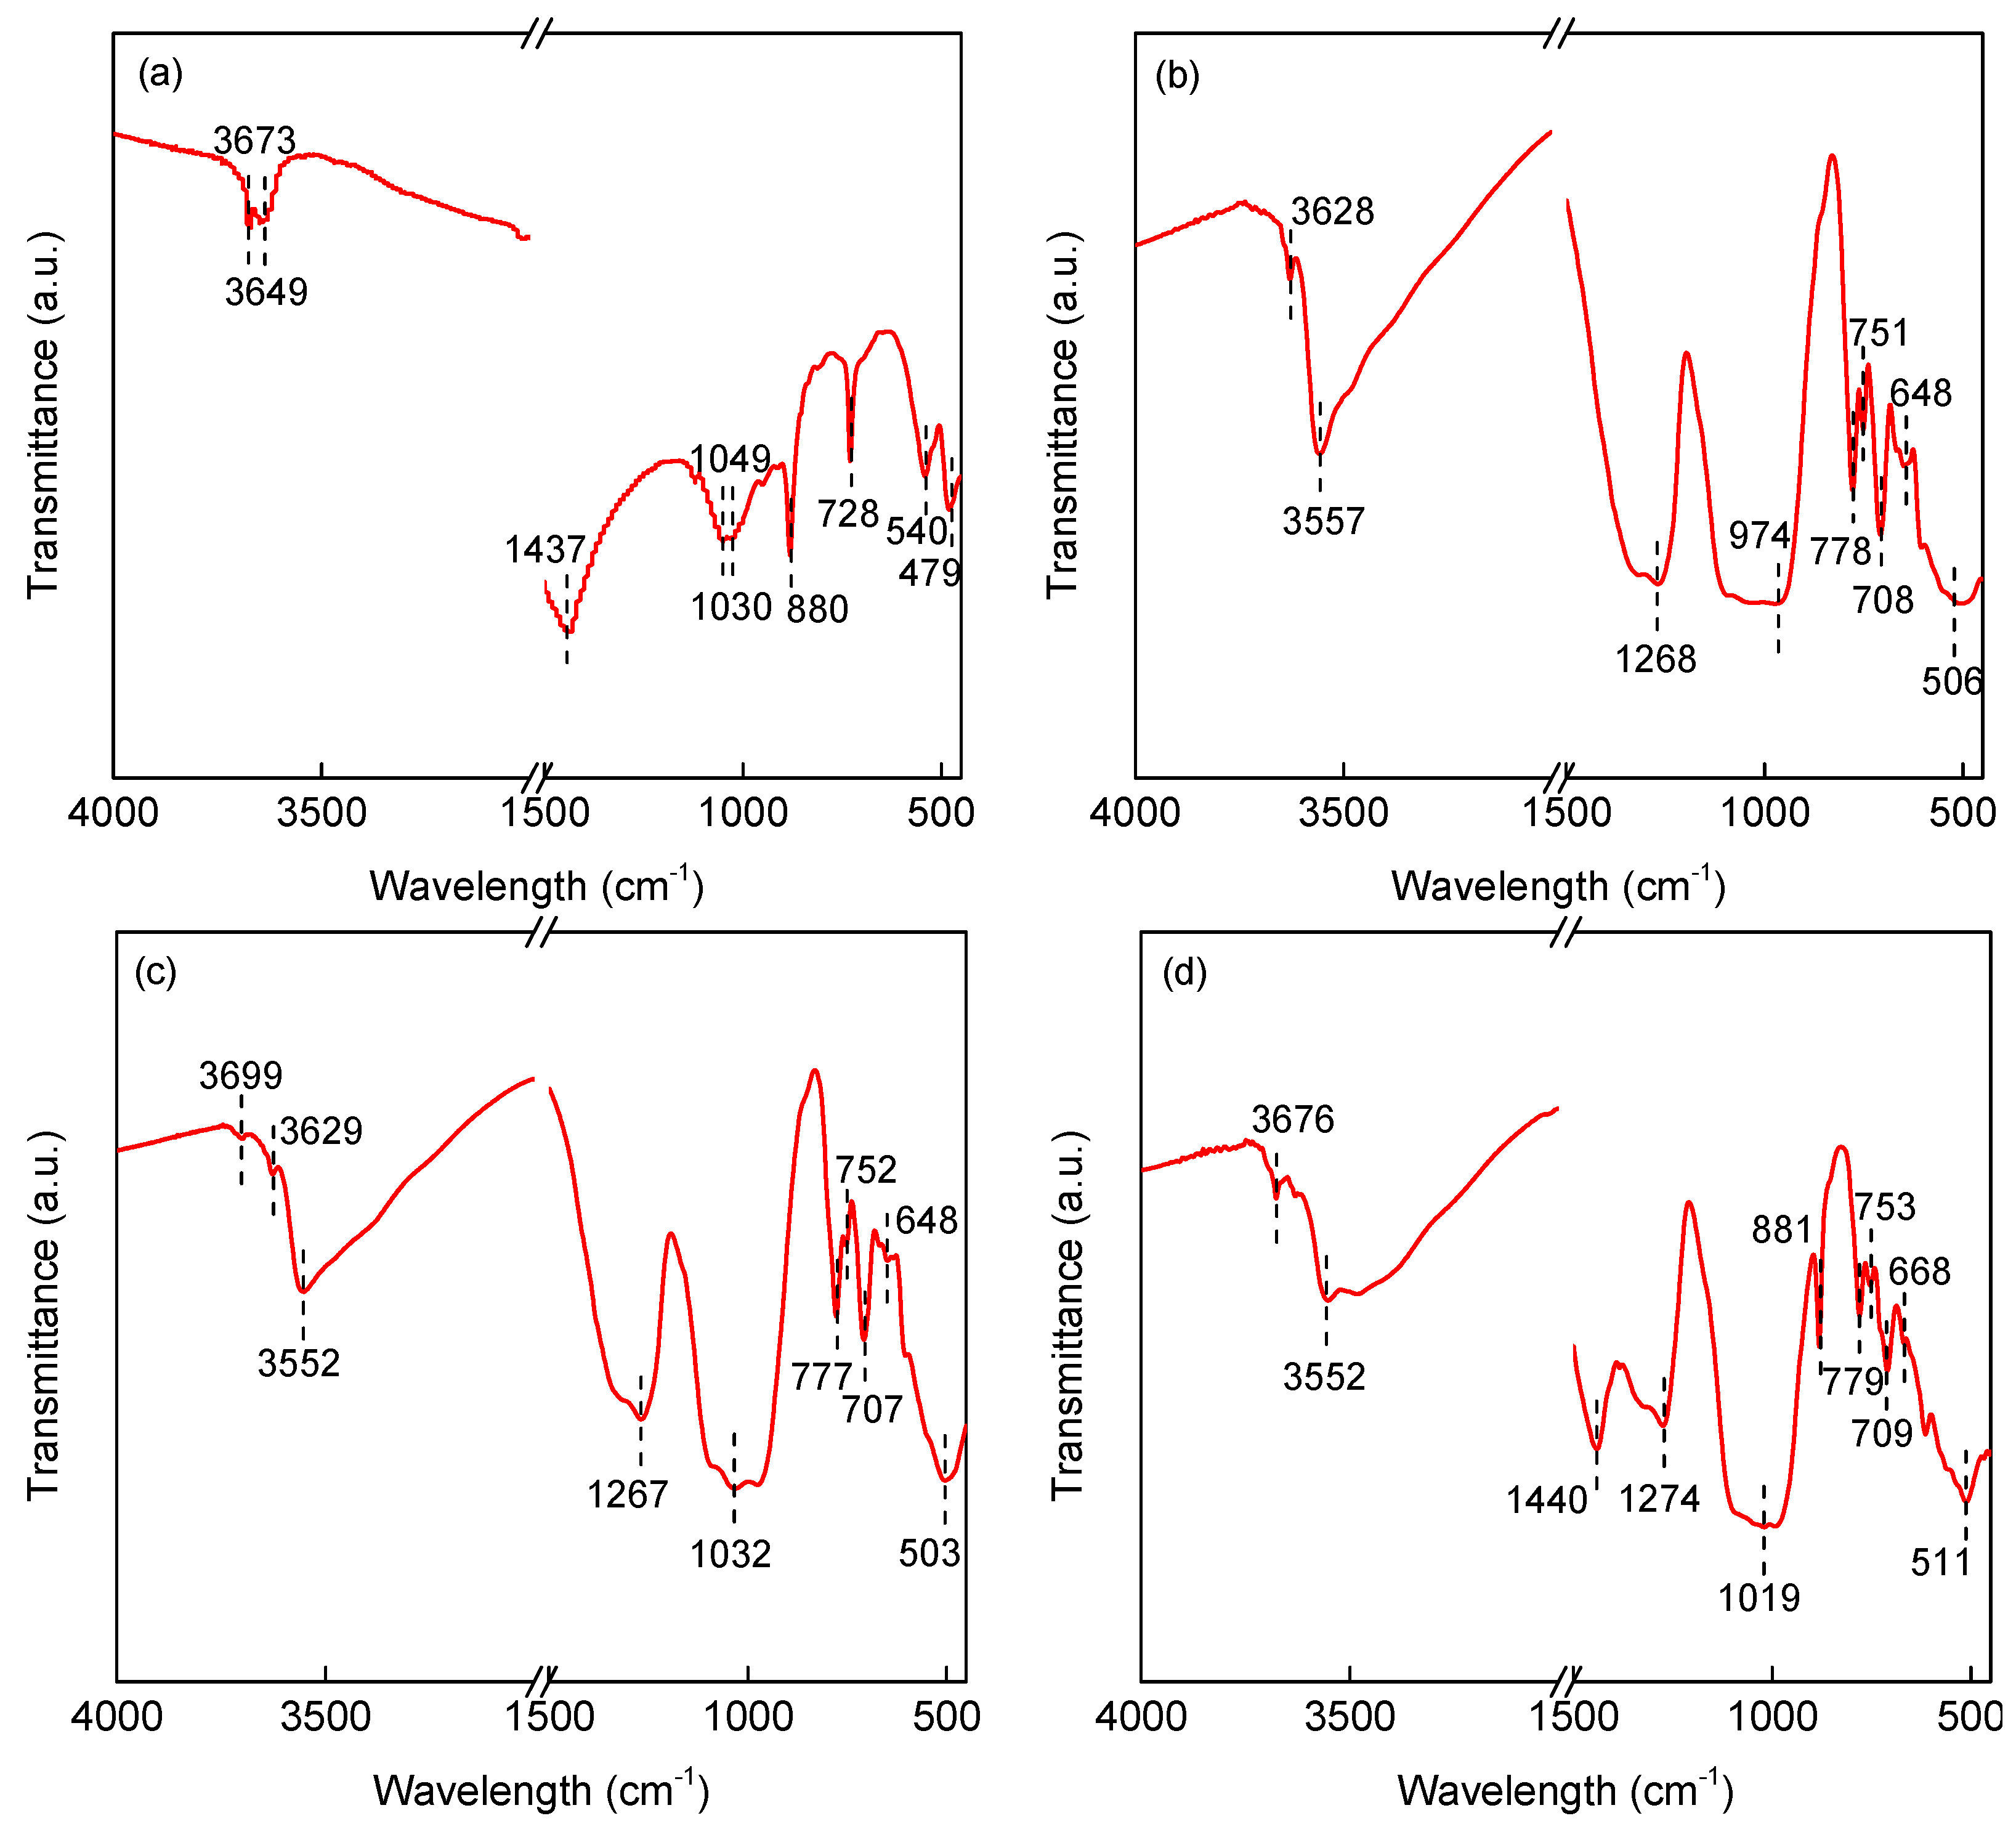
3.1.3. FTIR
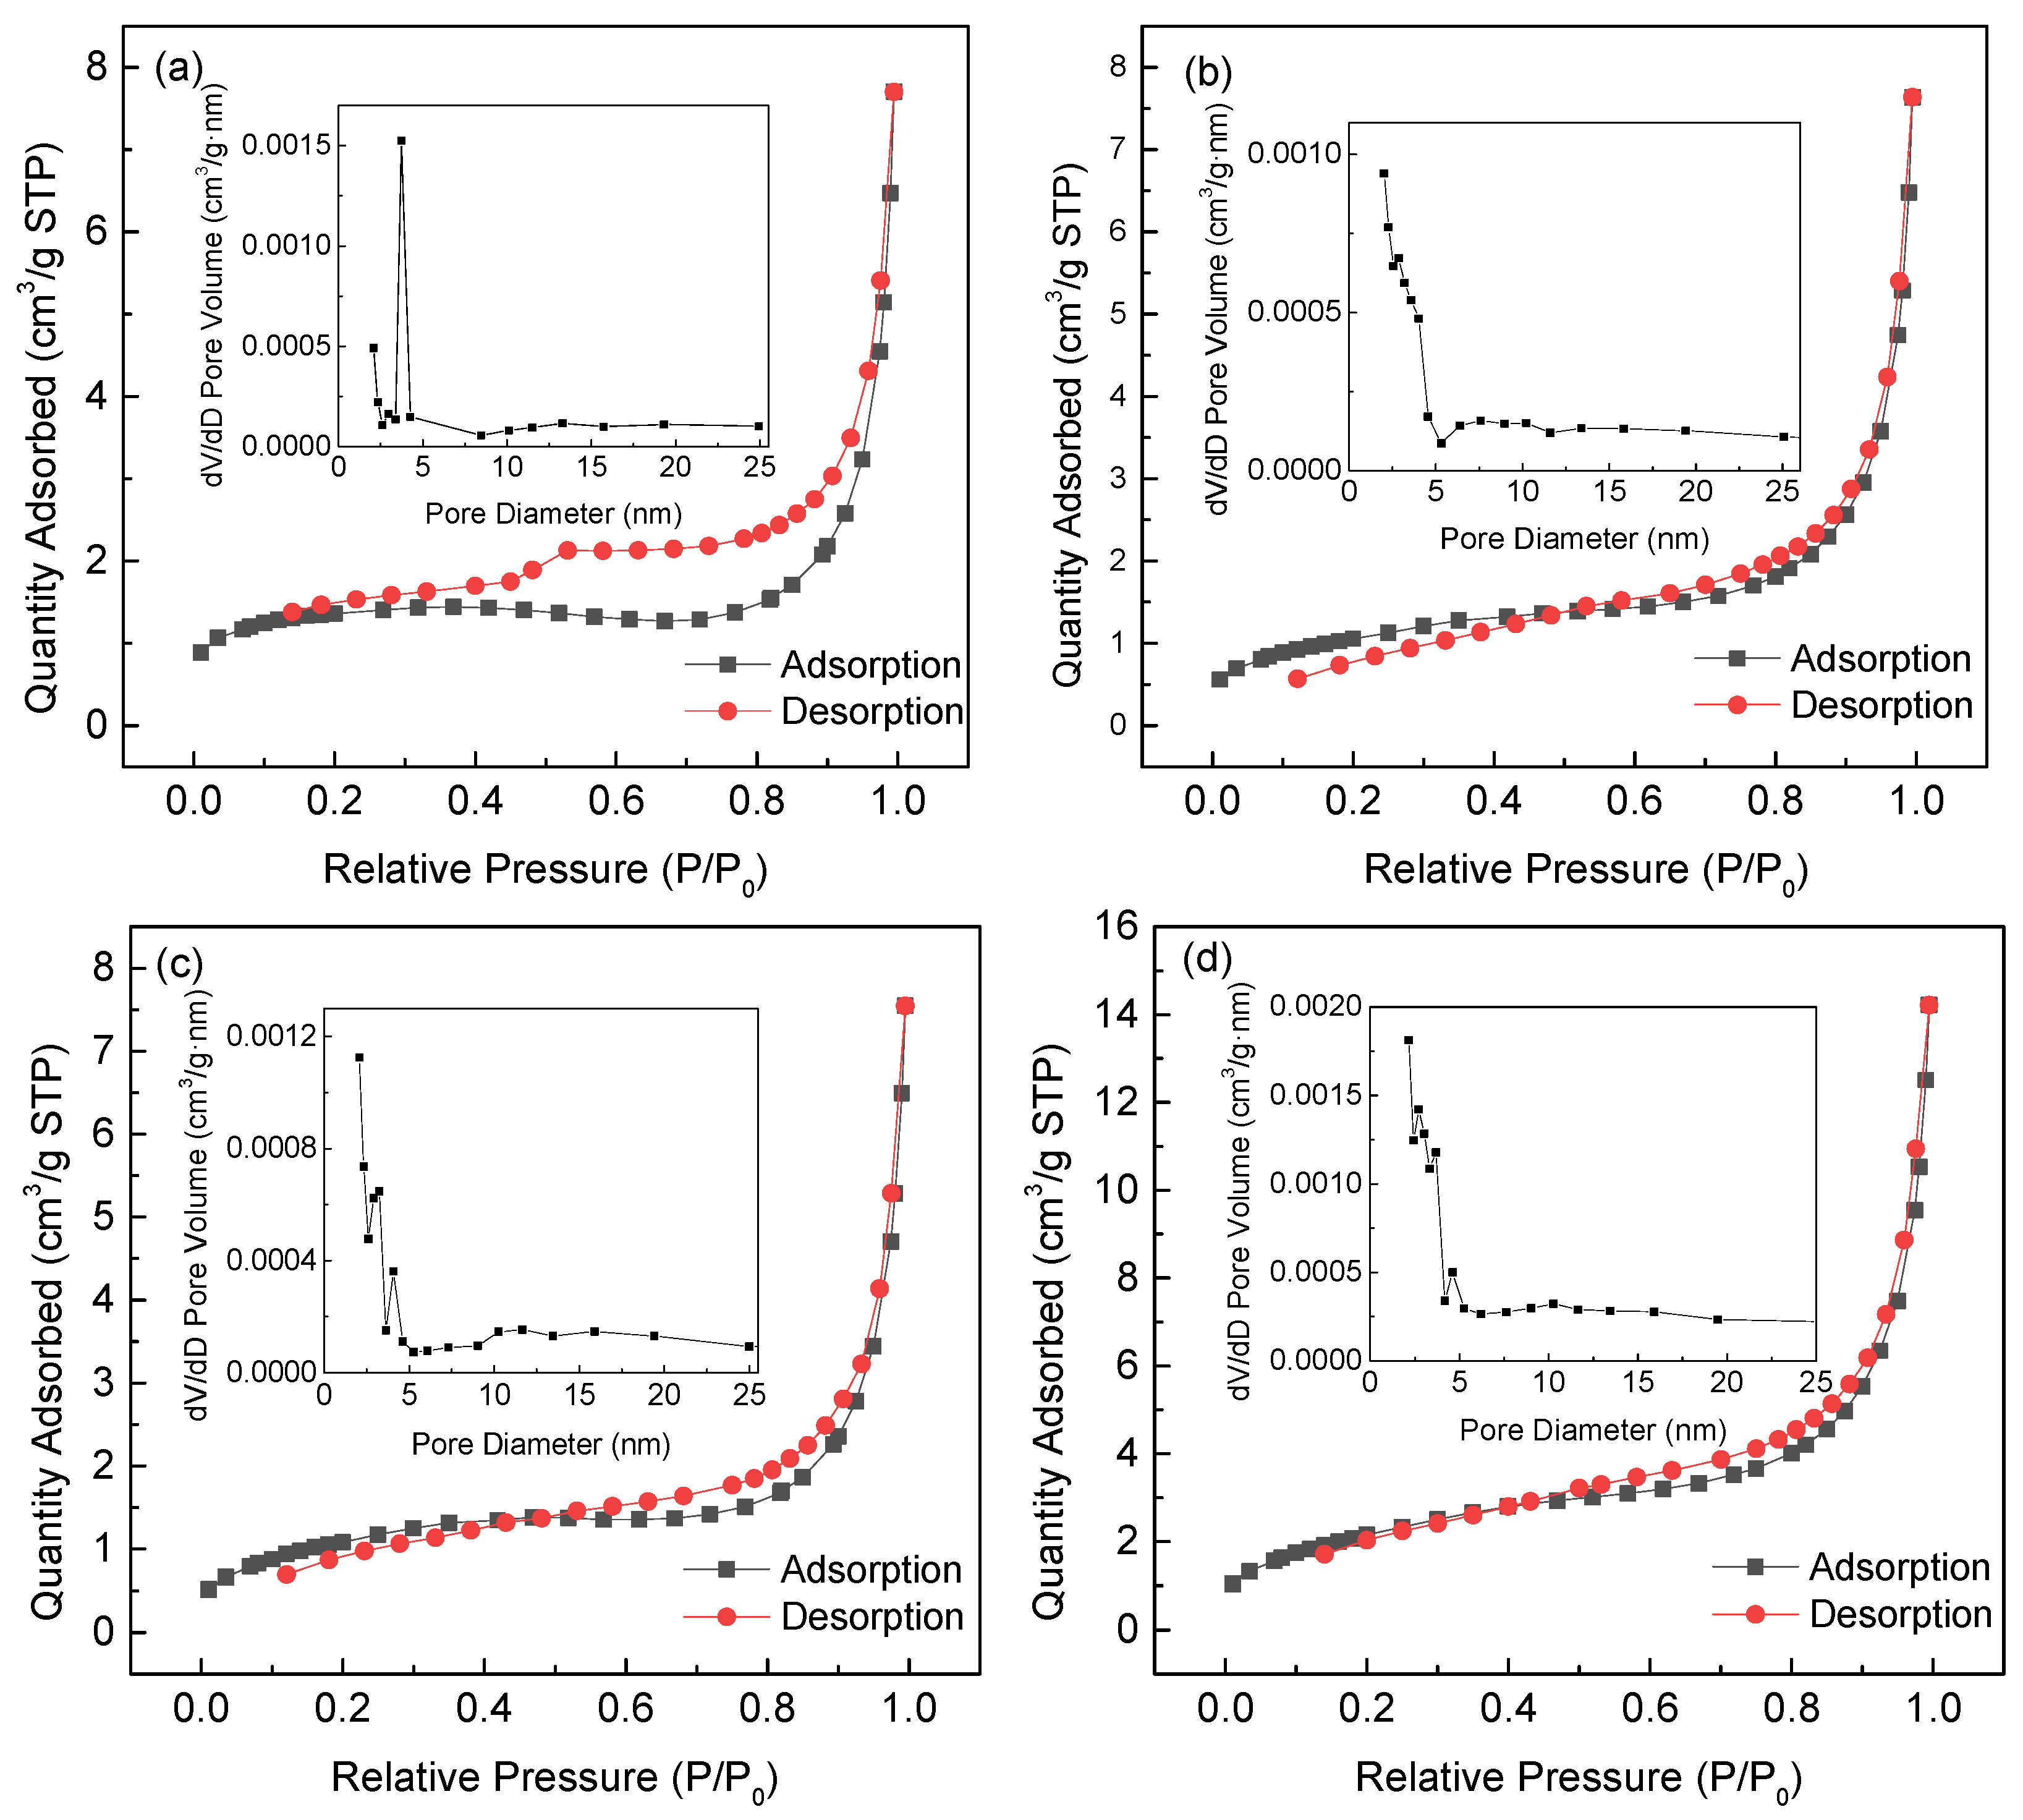
3.1.4. BET
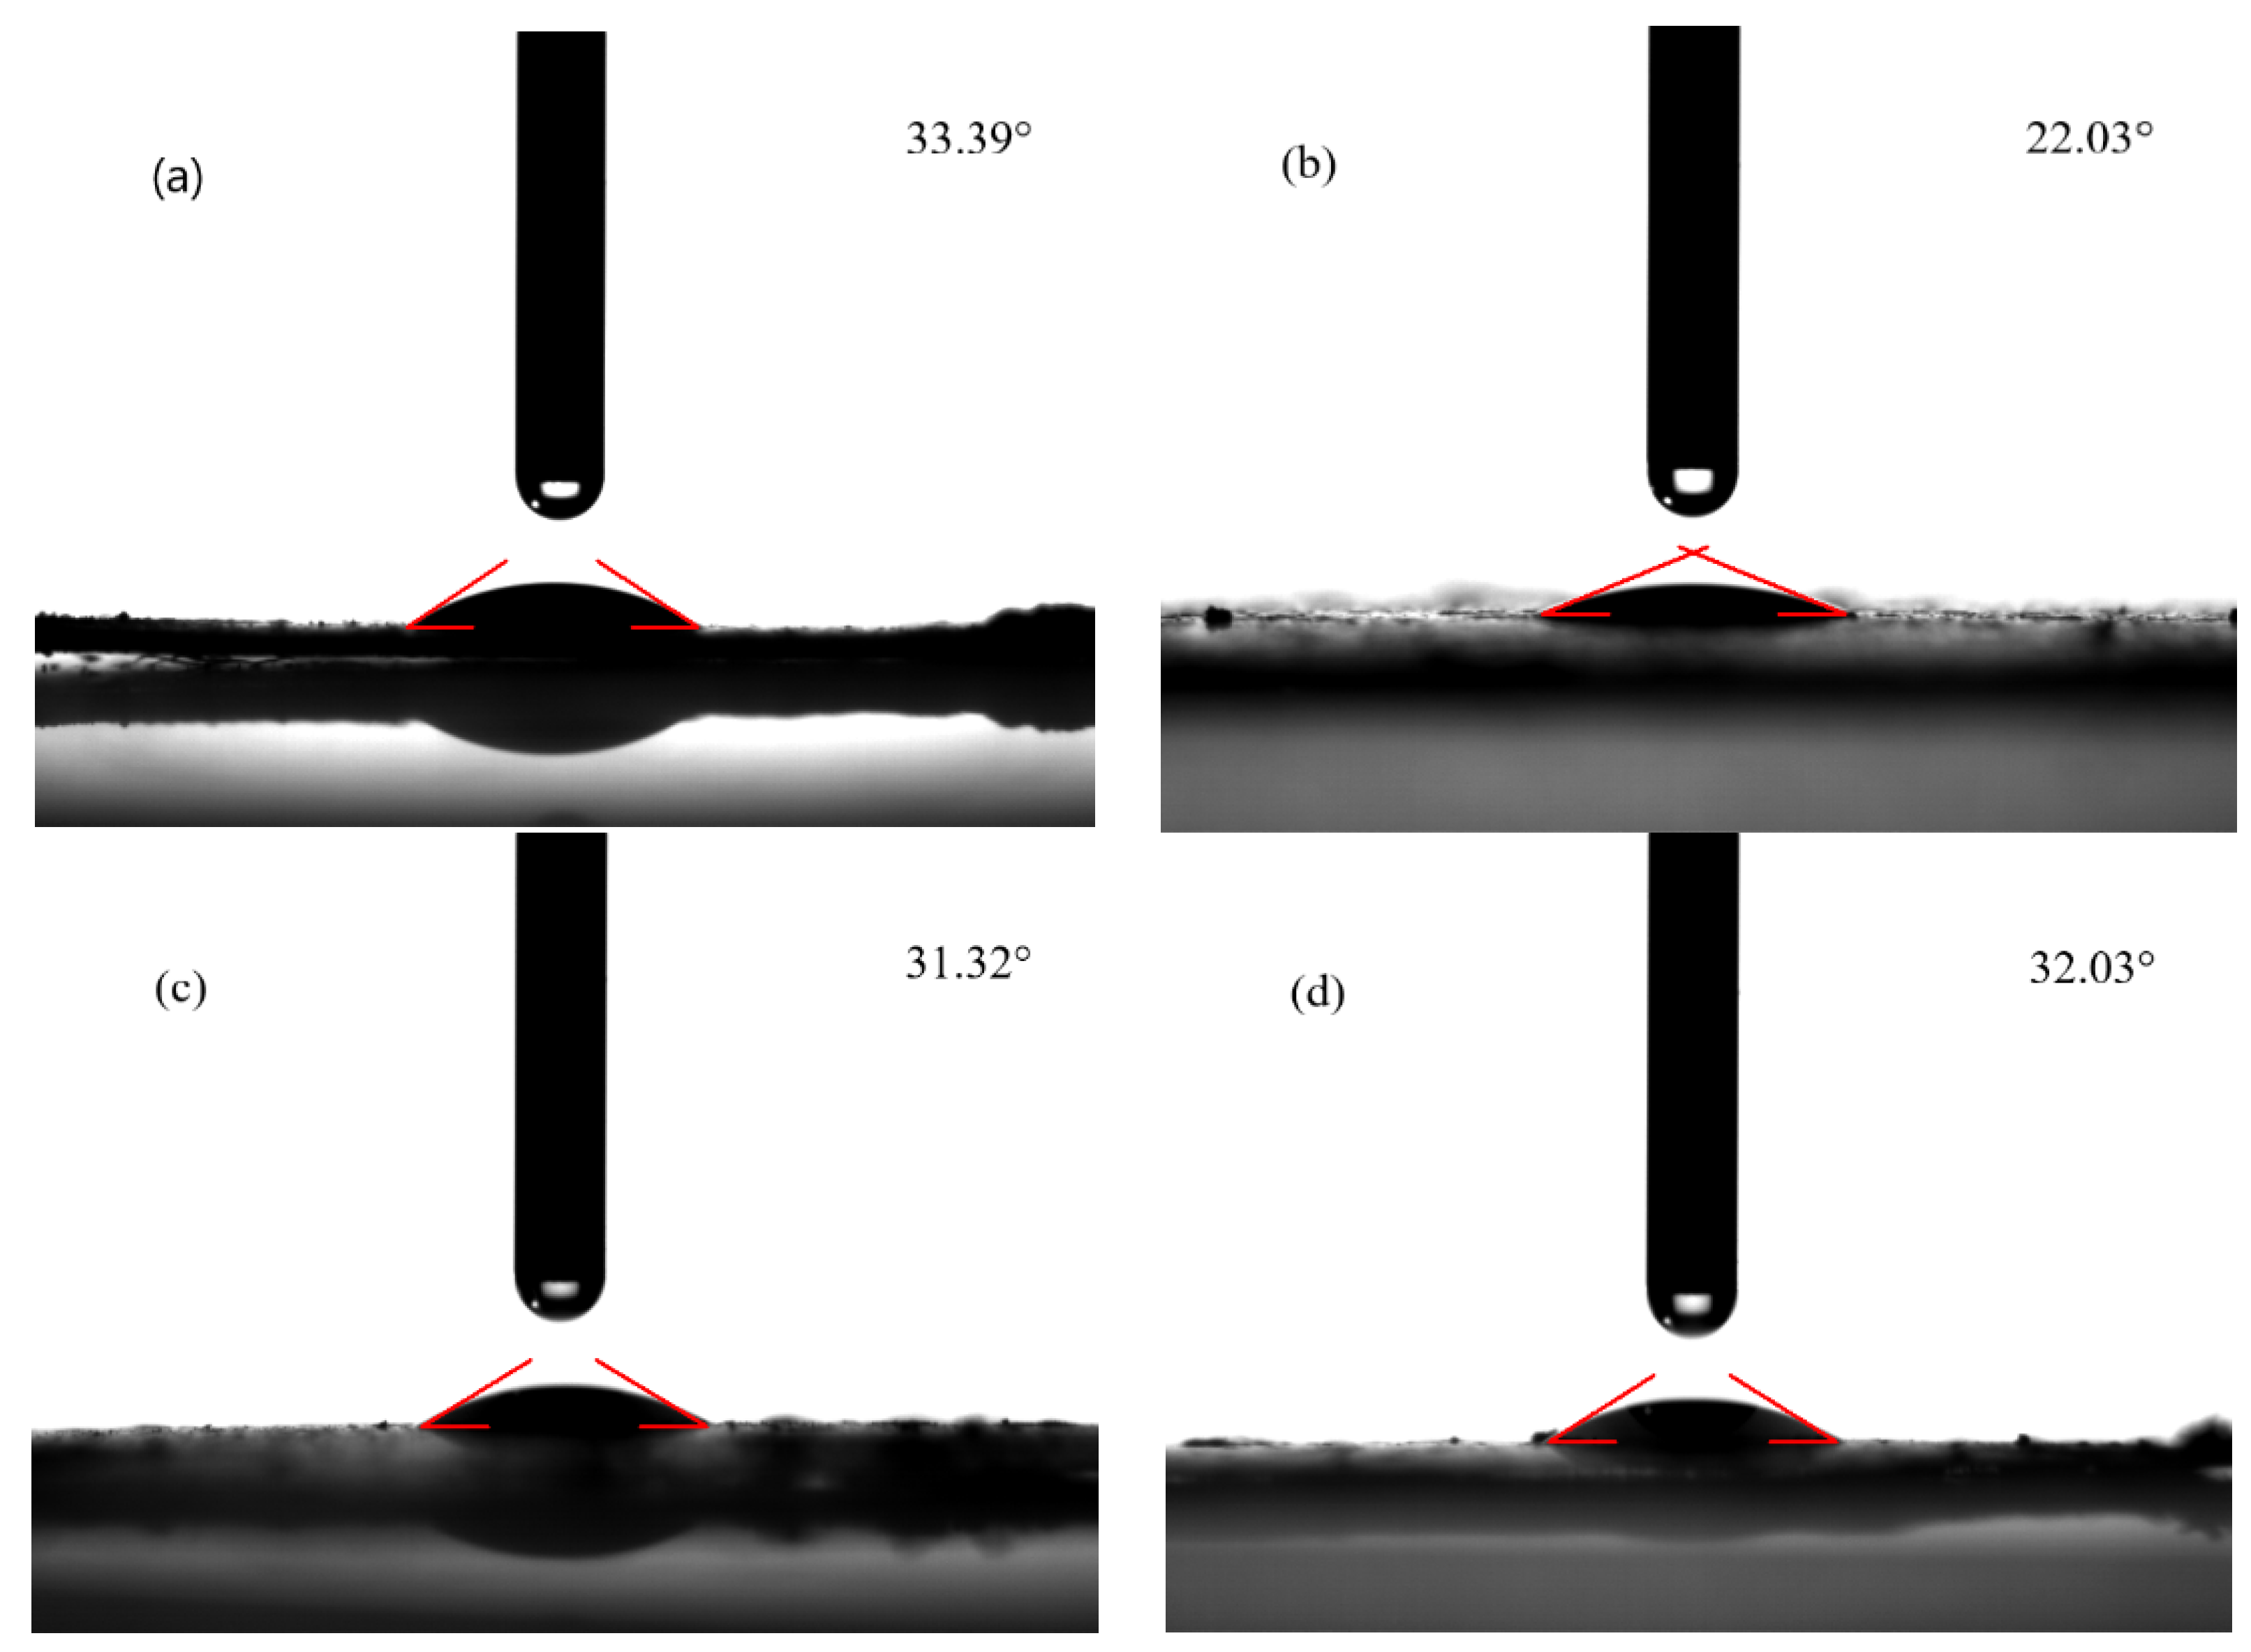
3.1.5. Contact Angles
3.1.6. Zero-Potential Point
3.2. Comparison of Four TMs
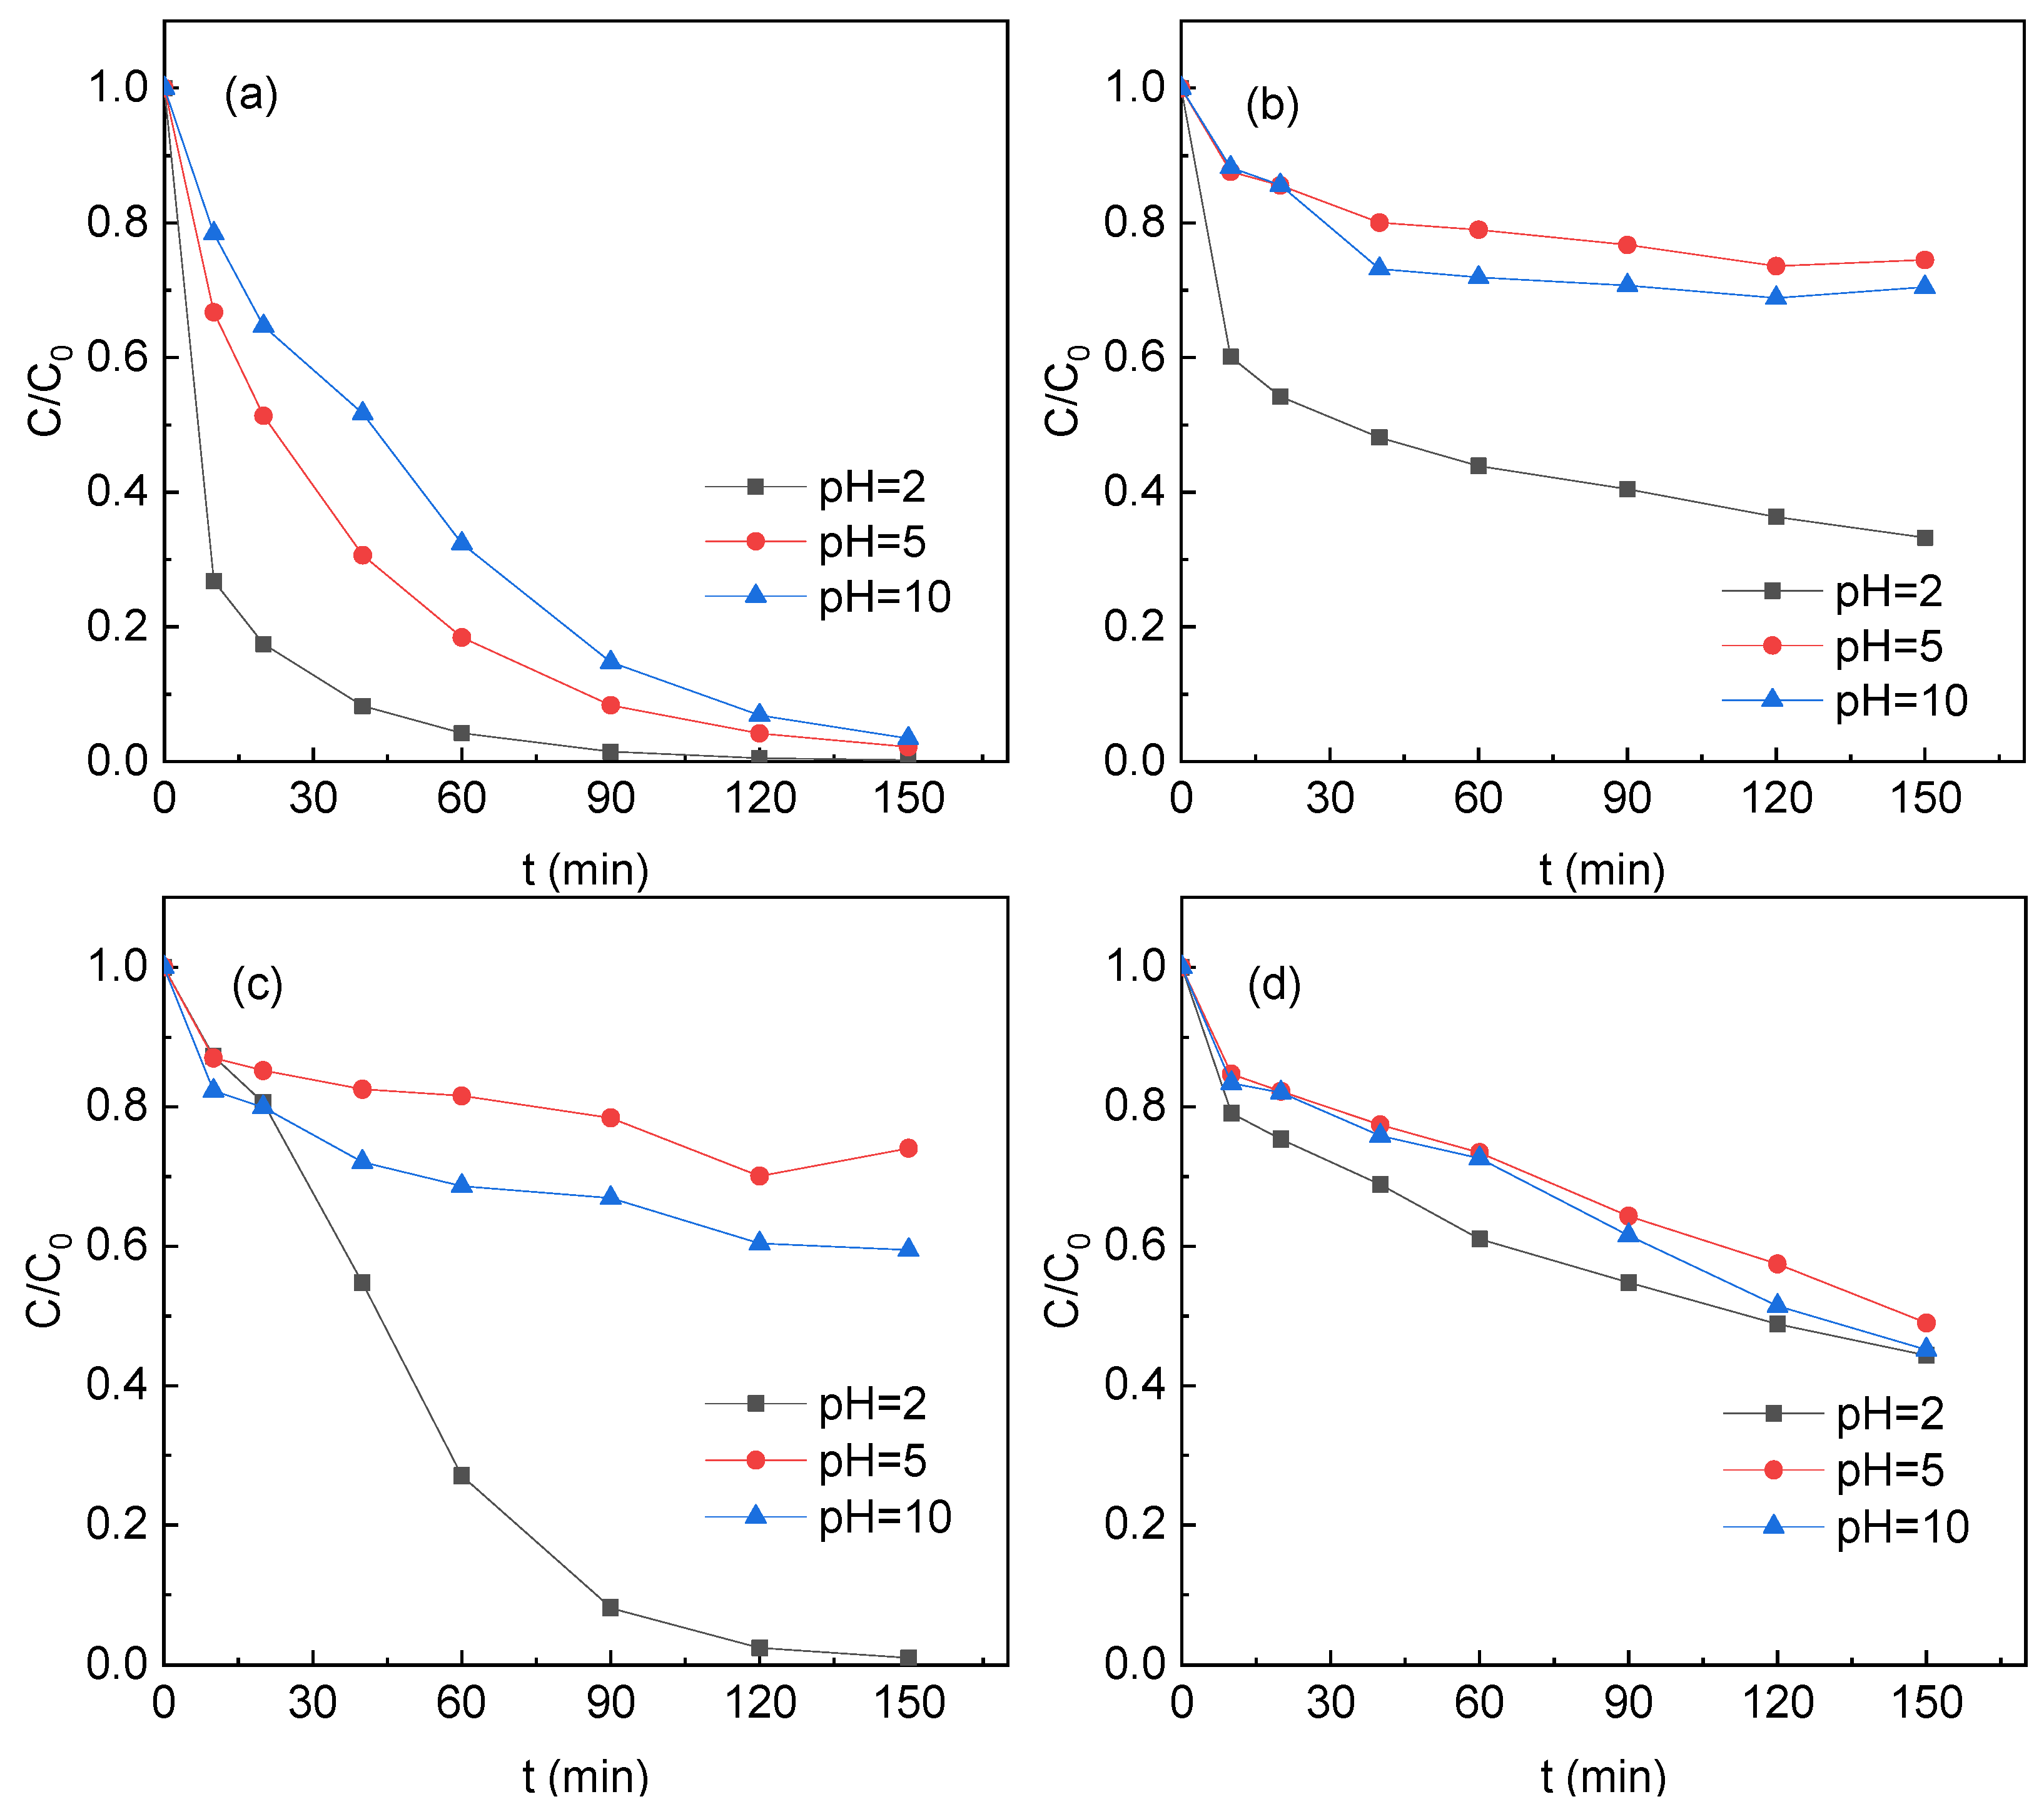
3.3. The Effect of pH
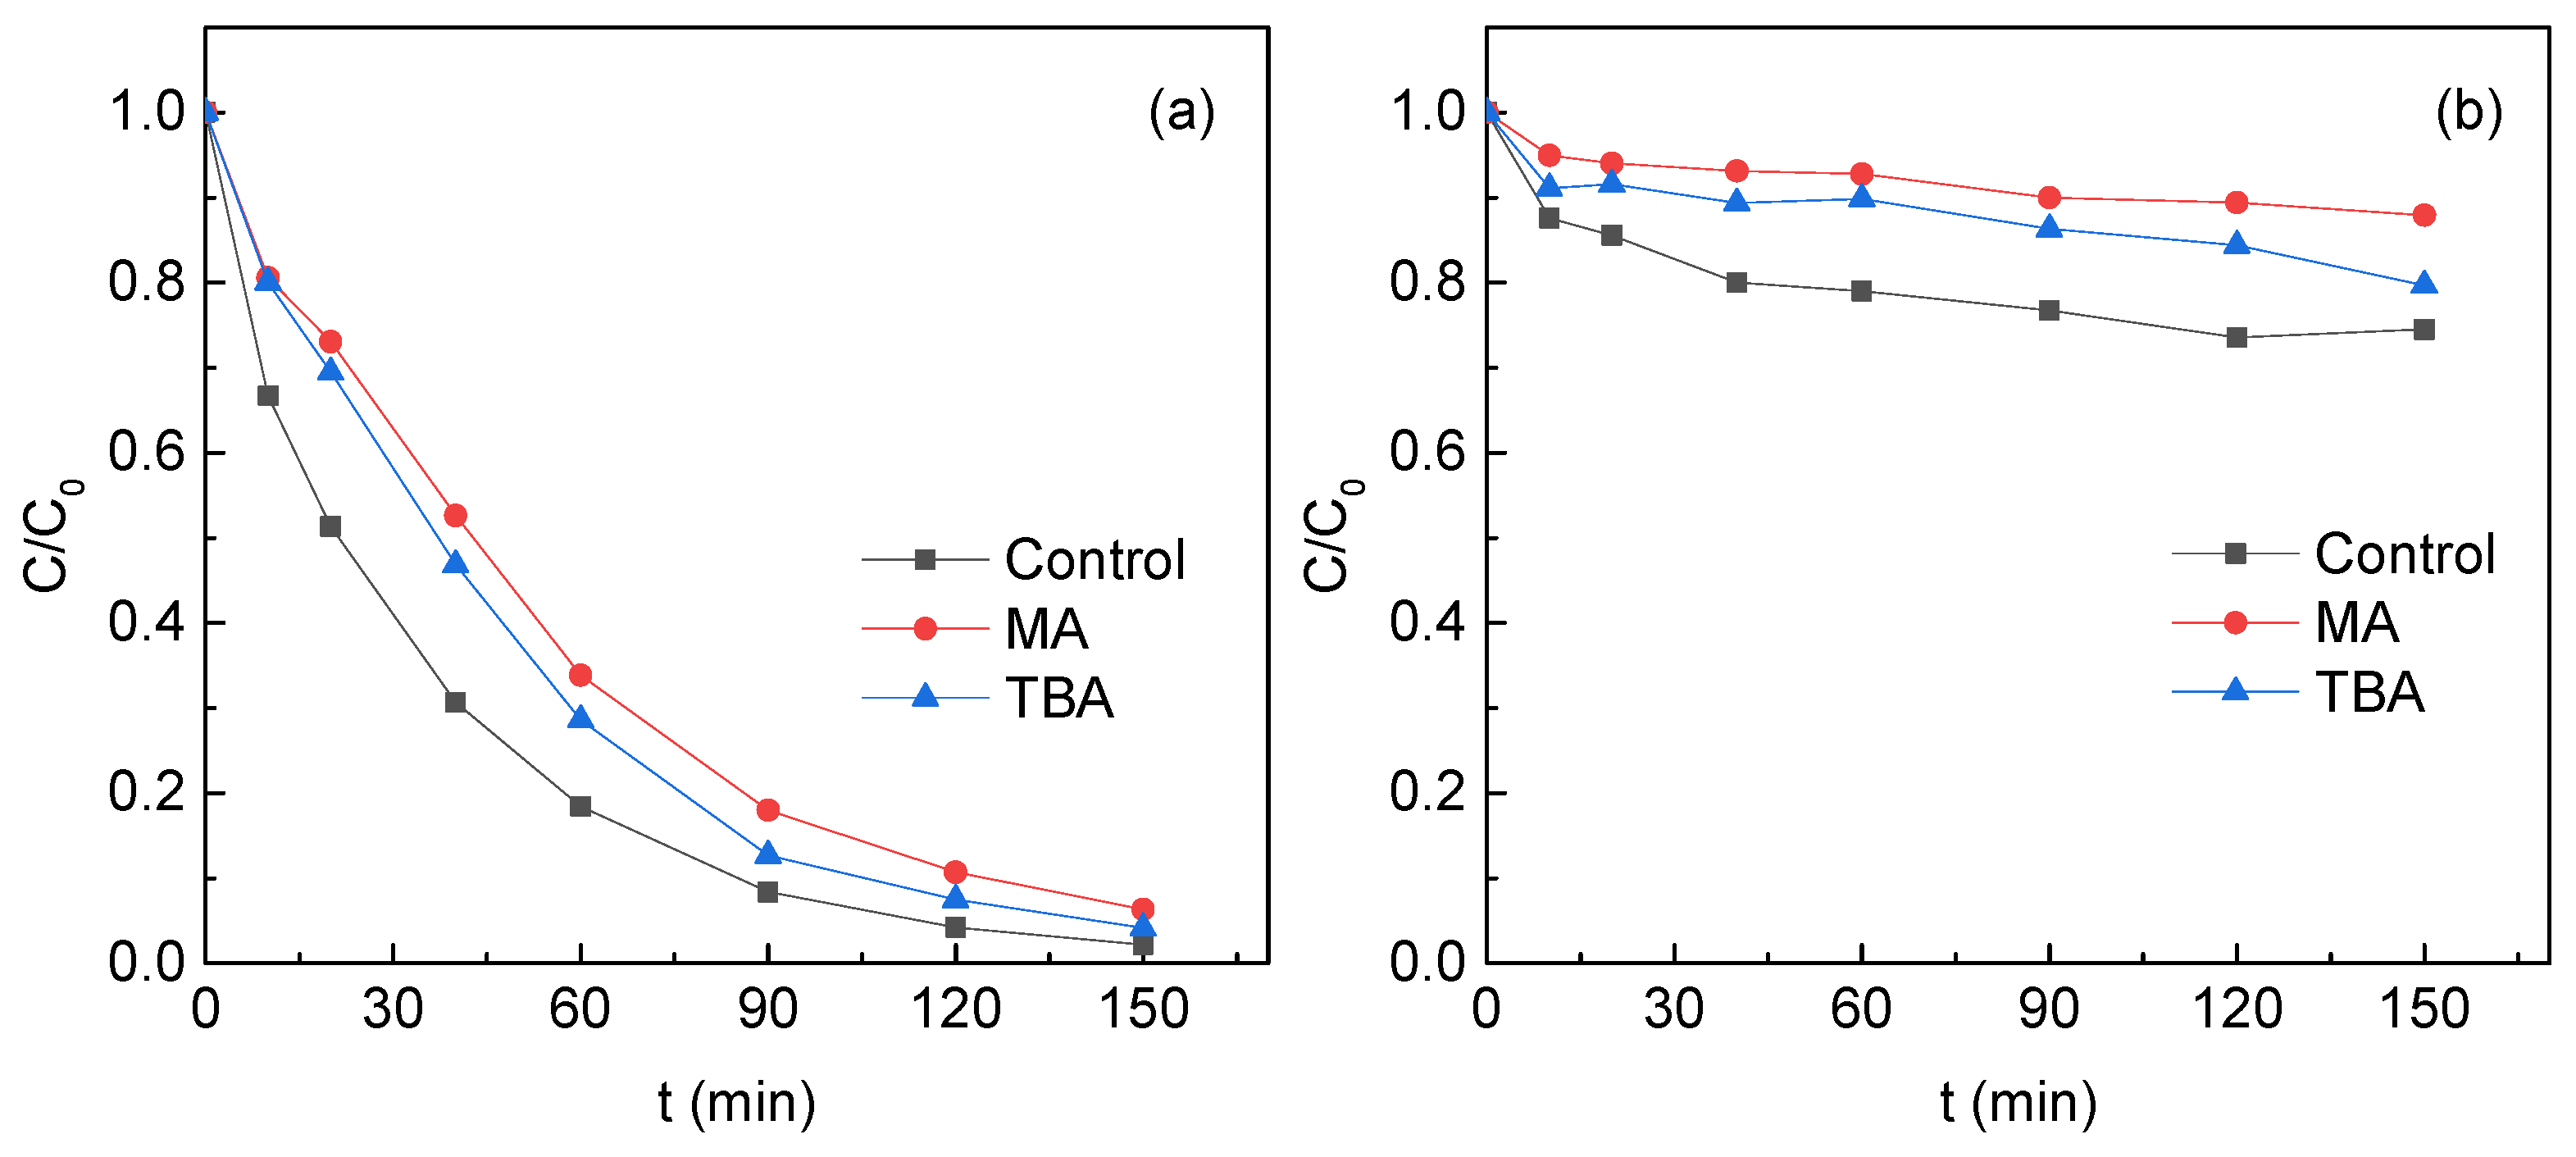
3.4. Reactive Species
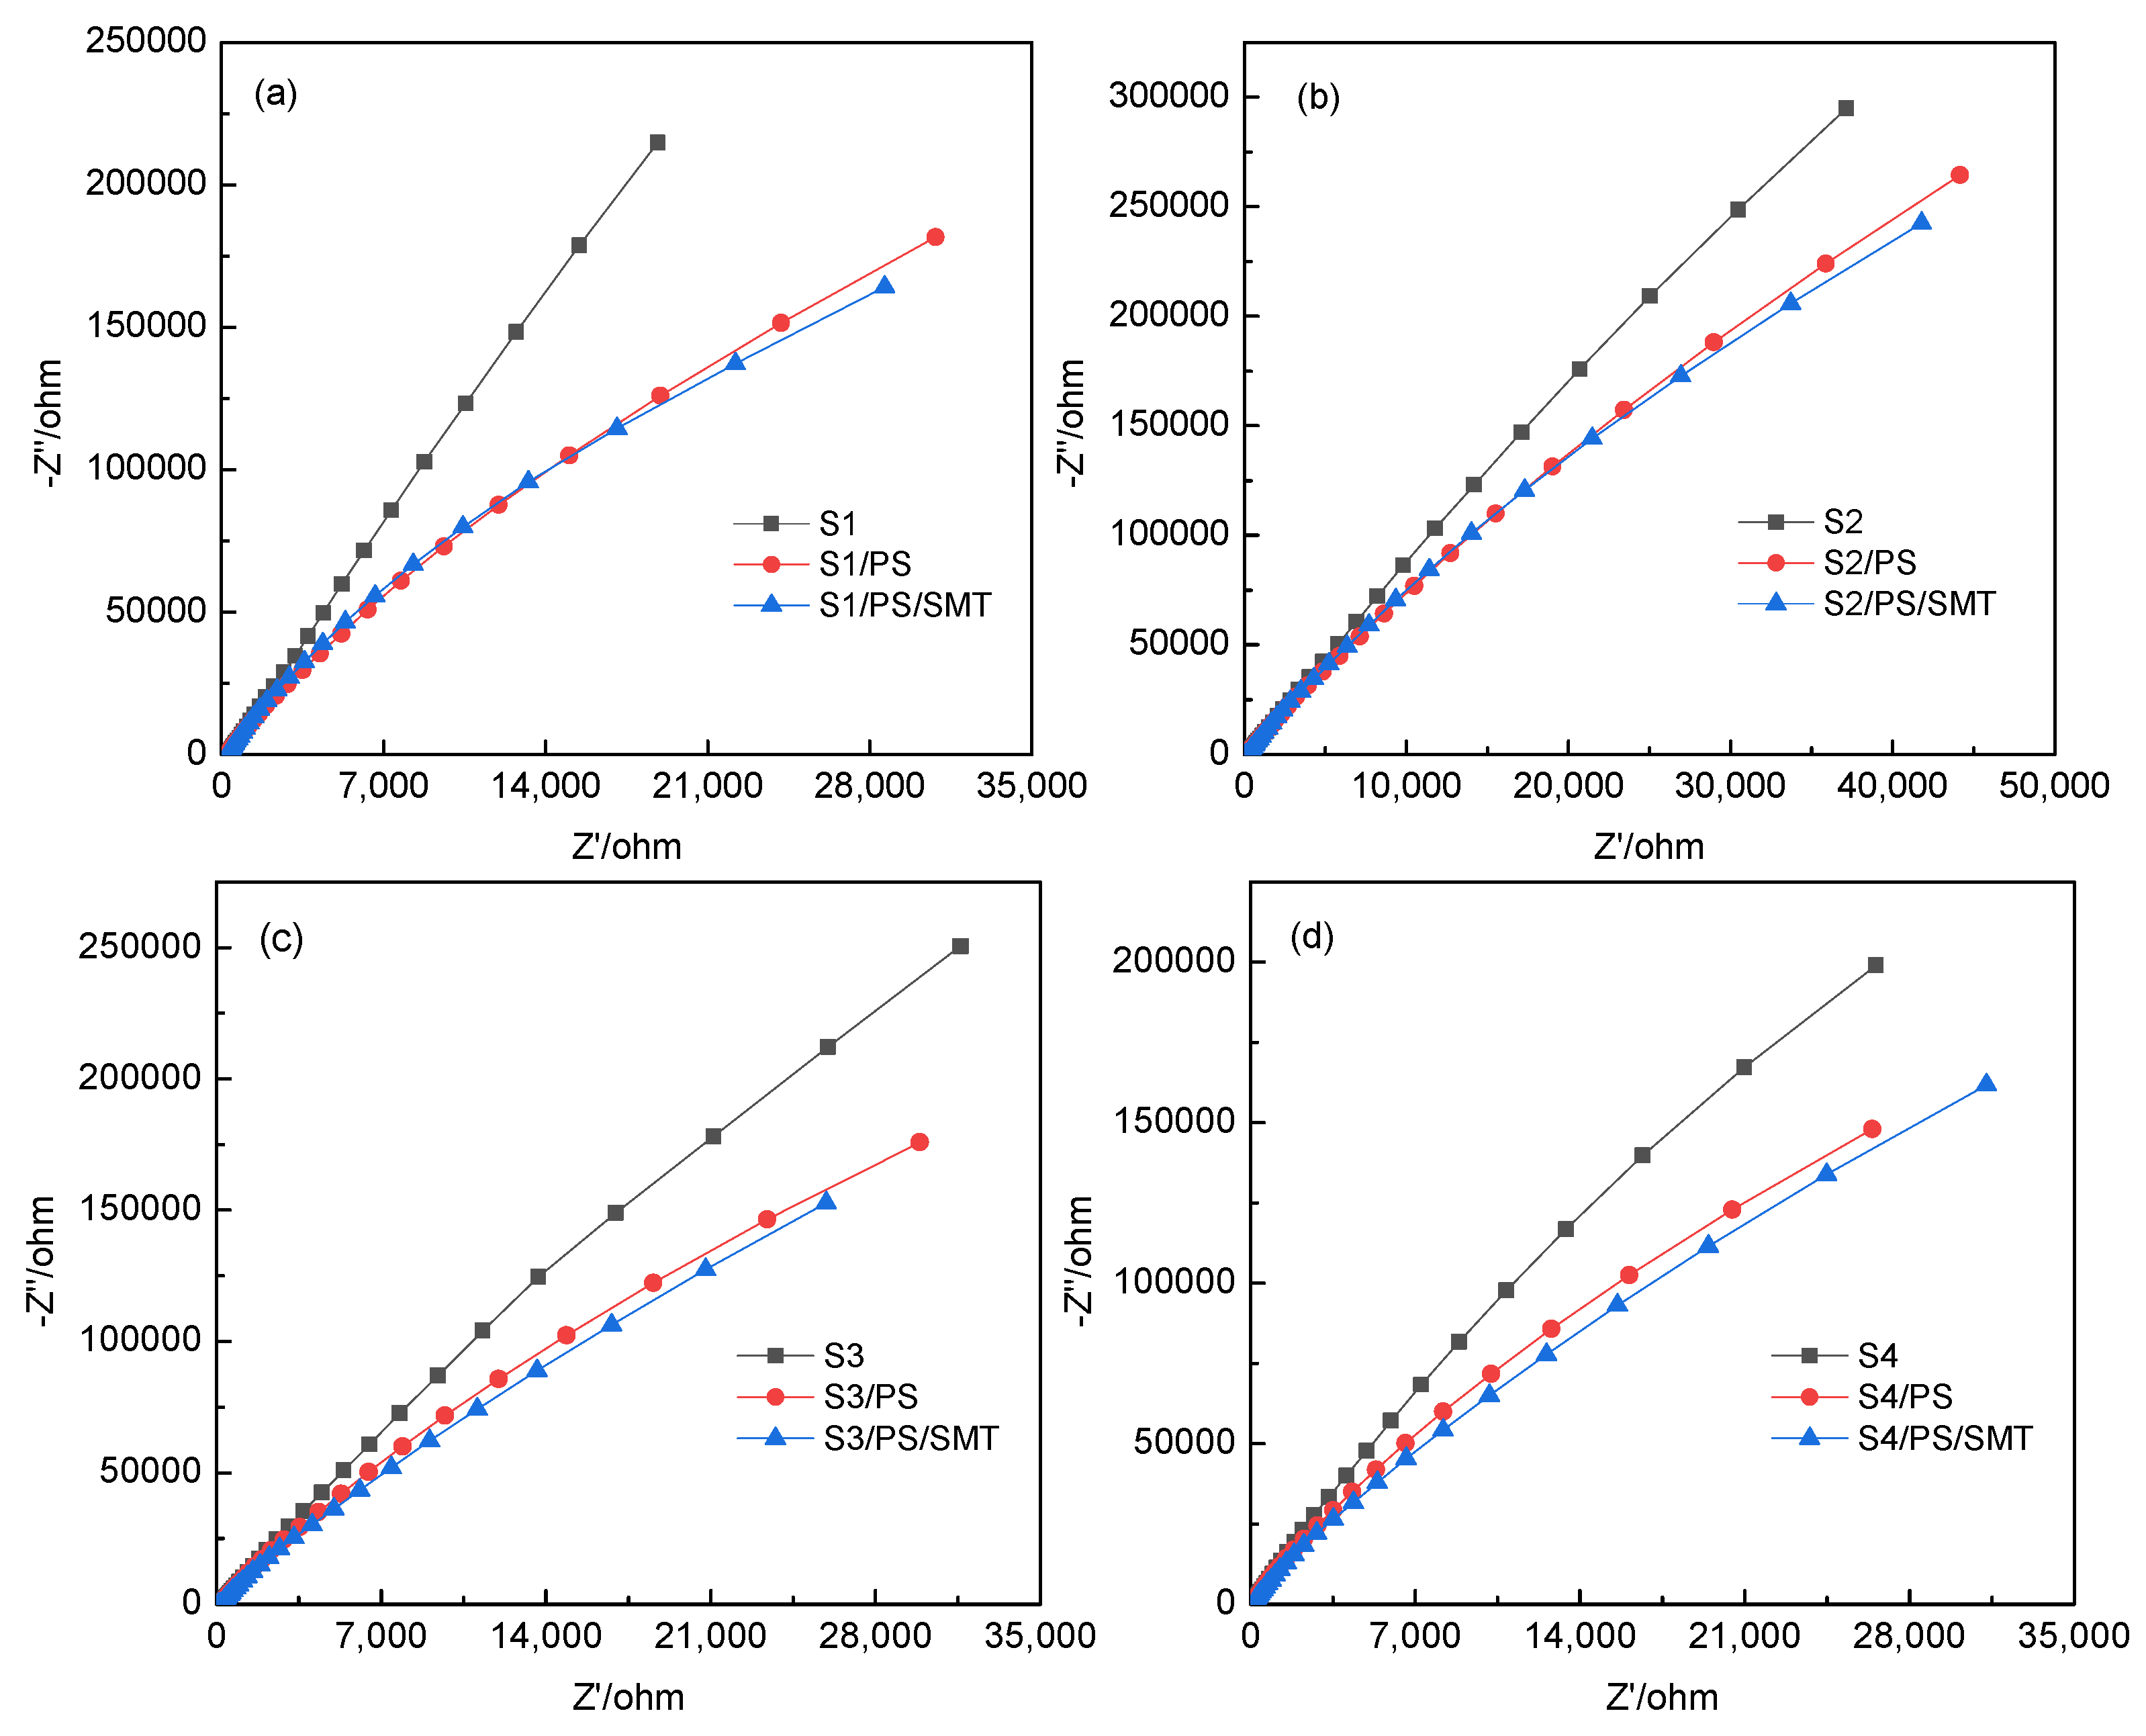
3.5. Electrochemical Test
3.6. Reaction Mechanisms
4. Conclusions
Supplementary Materials
Author Contributions
Funding
Institutional Review Board Statement
Informed Consent Statement
Data Availability Statement
Conflicts of Interest
References
- Prasad, P.S.R. Study of Structural Disorder in Natural Tourmalines by Infrared Spectroscopy. Gondwana Res. 2005, 8, 265–270. [Google Scholar] [CrossRef]
- Harraz, H.Z.; El-Sharkawy, M.F. Origin of tourmaline in the metamorphosed Sikait pelitic belt, south Eastern Desert, Egypt. J. Afr. Earth Sci. 2001, 33, 391–416. [Google Scholar] [CrossRef]
- Liu, N.; Wang, H.; Weng, C.H.; Hwang, C.C. Adsorption characteristics of Direct Red 23 azo dye onto powdered tourmaline. Arab. J. Chem. 2018, 11, 1281–1291. [Google Scholar] [CrossRef] [Green Version]
- Li, N.; Zhang, J.; Wang, C.; Sun, H. Enhanced photocatalytic degradation of tetrabromobisphenol a by tourmaline—TiO2 composite catalyst. J. Mater. Sci. 2017, 52, 6937–6949. [Google Scholar] [CrossRef]
- Yavuz, F. TOURMAL: Software package for tourmaline, tourmaline-rich rocks and related ore deposits. Comput. Geosci. 1997, 23, 47–59. [Google Scholar] [CrossRef]
- Liu, L.; Liu, Q.; Wang, Y.; Huang, J.; Liu, N. Nonradical activation of peroxydisulfate promoted by oxygen vacancy-laden NiO for catalytic phenol oxidative polymerization. Appl. Catal. B Environ. 2019, 254, 166–173. [Google Scholar] [CrossRef]
- Niu, B.; Wang, N.; Chen, Y.; Yu, M.; Hou, Z.; Li, Z.; Zheng, Y. Tourmaline synergized with persulfate for degradation of sulfadiazine: Influencing parameters and reaction mechanism. Sep. Purif. Technol. 2021, 257, 117893. [Google Scholar] [CrossRef]
- Zhang, Y.; Zhao, H.; Wen, J.; Ding, S.; Wang, W. Insights into the nonradical degradation mechanisms of antibiotics in persulfate activation by tourmaline. Sep. Purif. Technol. 2021, 270, 118772. [Google Scholar] [CrossRef]
- Liang, Y.; Tang, X.; Zhu, Q.; Han, J.; Wang, C. A review: Application of tourmaline in environmental fields. Chemosphere 2021, 281, 130780. [Google Scholar] [CrossRef]
- Yu, C.; Wen, M.; Li, S.; Tong, Z.; Yin, Y.; Liu, X.; Li, Y.; Wu, Z.; Dionysiou, D.D. Elbaite catalyze peroxymonosulfate for advanced oxidation of organic pollutants: Hydroxyl groups induced generation of reactive oxygen species. J. Hazard. Mater. 2020, 398, 122932. [Google Scholar] [CrossRef]
- Fan, Y.; Ji, Y.; Kong, D.; Lu, J.; Zhou, Q. Kinetic and mechanistic investigations of the degradation of sulfamethazine in heat-activated persulfate oxidation process. J. Hazard. Mater. 2015, 300, 39–47. [Google Scholar] [CrossRef] [PubMed]
- Pan, Y.; Wang, Q.; Zhou, M.; Cai, J.; Zhang, Y. Kinetic and mechanism study of UV/pre-magnetized-Fe0/oxalate for removing sulfamethazine. J. Hazard. Mater. 2020, 398, 122931. [Google Scholar] [CrossRef] [PubMed]
- Li, Q.; Wei, G.; Duan, G.; Zhang, L.; Li, Z.; Wei, Z.; Zhou, Q.; Pei, R. Photocatalysis activation of peroxydisulfate over oxygen vacancies-rich mixed metal oxide derived from red mud-based layered double hydroxide for ciprofloxacin degradation. Sep. Purif. Technol. 2022, 289, 120733. [Google Scholar] [CrossRef]
- Srivastava, V.; Weng, C.H.; Singh, V.K.; Sharma, Y.C. Adsorption of Nickel Ions from Aqueous Solutions by Nano Alumina: Kinetic, Mass Transfer, and Equilibrium Studies. J. Chem. Eng. Data 2011, 56, 1414–1422. [Google Scholar] [CrossRef]
- Wang, L.; Huang, X.; Han, M.; Lyu, L.; Li, T.; Gao, Y.; Zeng, Q.; Hu, C. Efficient inhibition of photogenerated electron-hole recombination through persulfate activation and dual-pathway degradation of micropollutants over iron molybdate. Appl. Catal. B Environ. 2019, 257, e117904. [Google Scholar] [CrossRef]
- Guo, L.; Zhao, L.; Tang, Y.; Zhou, J.; Shi, B. Switching the free radical based peroxydisulfate activation to the nonradical pathway by a chrome shaving–derived biochar for the efficient degradation of tetracycline. Chem. Eng. J. 2022, 435, 135189. [Google Scholar] [CrossRef]
- Singh, A.K.; Hollmann, D.; Schwarze, M.; Panda, C.; Singh, B.; Menezes, P.W.; Indra, A. Exploring the Mechanism of Peroxodisulfate Activation with Silver Metavanadate to Generate Abundant Reactive Oxygen Species. Adv. Sustain. Syst. 2021, 5, 2000288. [Google Scholar] [CrossRef]
- Yu, Z.; Ma, J.; Huang, X.; Lv, Y.; Liu, Y.; Lin, C.; Dou, R.; Ye, X.; Shi, Y.; Liu, M. Insights into enhanced peroxydisulfate activation with S doped Fe@C catalyst for the rapid degradation of organic pollutants. J. Colloid Interfcae Sci. 2022, 610, 24–34. [Google Scholar] [CrossRef]
- Li, G.; Chen, D.; Zhao, W.; Zhang, X. Efficient adsorption behavior of phosphate on La-modified tourmaline. J. Environ. Chem. Eng. 2015, 3, 515–522. [Google Scholar] [CrossRef]
- Wenzhen, D.; Ningfen, W.; Weilong, X.; Youfeng, Z.; Yian, Z. Ciprofloxacin adsorption onto different micro-structured tourmaline, halloysite and biotite. J. Mol. Liq. 2018, 269, 874–881. [Google Scholar]
- Thommes, M.; Kaneko, K.; Neimark, A.V.; Olivier, J.P.; Rodriguez-Reinoso, F.; Rouquerol, J.; Sing, K.S.W. Physisorption of gases, with special reference to the evaluation of surface area and pore size distribution (IUPAC Technical Report). Pure Appl. Chem. 2015, 87, 1051–1069. [Google Scholar] [CrossRef] [Green Version]
- Shevkunov, S.V.; Vegiri, A. Electric field induced transitions in water clusters. J. Mol. Struc.-THEOCHEM 2002, 593, 19–32. [Google Scholar] [CrossRef]
- Xia, M.S.; Hu, C.H.; Zhang, H.M. Effects of tourmaline addition on the dehydrogenase activity of Rhodopseudomonas palustris. Process Biochem. 2006, 41, 221–225. [Google Scholar] [CrossRef]
- Tijing, L.D.; Ruelo, M.T.G.; Amarjargal, A.; Pant, H.R.; Park, C.-H.; Kim, D.W.; Kim, C.S. Antibacterial and superhydrophilic electrospun polyurethane nanocomposite fibers containing tourmaline nanoparticles. Chem. Eng. J. 2012, 197, 41–48. [Google Scholar] [CrossRef]
- Xia, D.; He, H.; Liu, H.; Wang, Y.; Zhang, Q.; Li, Y.; Lu, A.; He, C.; Po, K.W. Persulfate-mediated catalytic and photocatalytic bacterial inactivation by magnetic natural ilmenite. Appl. Catal. B Environ. 2018, 238, 70–81. [Google Scholar] [CrossRef]
- Nosaka, Y.; Nosaka, A.Y. Generation and Detection of Reactive Oxygen Species in Photocatalysis. Chem. Rev. 2017, 117, 11302–11336. [Google Scholar] [CrossRef]
- Wang, W.; Liu, X.; Li, K.; Li, T. Dechlorinating performance of Dehalococcoides spp. mixed culture enhanced by tourmaline. Chemosphere 2018, 194, 9–19. [Google Scholar] [CrossRef]
- Wang, W.; Jiang, H.; Zhu, G.; Song, X.; Liu, X.; Qiao, Y. Effect of tourmaline on denitrification characteristics of hydrogenotrophic bacteria. Environ. Sci. Pollut. Res. 2016, 23, 4868–4875. [Google Scholar] [CrossRef]
- Zhou, L.; Sleiman, M.; Ferronato, C.; Chovelon, J.-M.; de Sainte-Claire, P.; Richard, C. Sulfate radical induced degradation of β2-adrenoceptor agonists salbutamol and terbutaline: Phenoxyl radical dependent mechanisms. Water Res. 2017, 123, 715–723. [Google Scholar] [CrossRef]
- Xiong, X.; Sun, B.; Zhang, J.; Gao, N.; Shen, J.; Li, J.; Guan, X. Activating persulfate by Fe0 coupling with weak magnetic field: Performance and mechanism. Water Res. 2014, 62, 53–62. [Google Scholar] [CrossRef]


Publisher’s Note: MDPI stays neutral with regard to jurisdictional claims in published maps and institutional affiliations. |
© 2022 by the authors. Licensee MDPI, Basel, Switzerland. This article is an open access article distributed under the terms and conditions of the Creative Commons Attribution (CC BY) license (https://creativecommons.org/licenses/by/4.0/).
Share and Cite
Jiao, Y.; Zhang, Y.; Wang, W. Comparison of Four Tourmalines for PS Activation to Degrade Sulfamethazine: Efficiency, Kinetics and Mechanisms. Int. J. Environ. Res. Public Health 2022, 19, 3244. https://doi.org/10.3390/ijerph19063244
Jiao Y, Zhang Y, Wang W. Comparison of Four Tourmalines for PS Activation to Degrade Sulfamethazine: Efficiency, Kinetics and Mechanisms. International Journal of Environmental Research and Public Health. 2022; 19(6):3244. https://doi.org/10.3390/ijerph19063244
Chicago/Turabian StyleJiao, Yongli, Ying Zhang, and Wei Wang. 2022. "Comparison of Four Tourmalines for PS Activation to Degrade Sulfamethazine: Efficiency, Kinetics and Mechanisms" International Journal of Environmental Research and Public Health 19, no. 6: 3244. https://doi.org/10.3390/ijerph19063244
APA StyleJiao, Y., Zhang, Y., & Wang, W. (2022). Comparison of Four Tourmalines for PS Activation to Degrade Sulfamethazine: Efficiency, Kinetics and Mechanisms. International Journal of Environmental Research and Public Health, 19(6), 3244. https://doi.org/10.3390/ijerph19063244