Article

Trends of Multimorbidity Patterns over 16 Years in Older Taiwanese People and Their Relationship to Mortality

by
Hsin-En Ho
1,2,3,
Chih-Jung Yeh
4,
James Cheng-Chung Wei
1,5,6,
Wei-Min Chu
7,8,9,10,11,* and
Meng-Chih Lee
1,12,13,14,15,*
1
Institute of Medicine, Chung Shan Medical University, Taichung 40201, Taiwan
2
Department of Family Medicine, Taichung Armed Forces General Hospital, Taichung 41152, Taiwan
3
School of Medicine, National Defense Medical Center, Taipei 11490, Taiwan
4
School of Public Health, Chung-Shan Medical University, Taichung 40201, Taiwan
5
Department of Allergy, Immunology & Rheumatology, Chung Shan Medical University Hospital, Taichung 40201, Taiwan
6
Graduate Institute of Integrated Medicine, China Medical University, Taichung 40402, Taiwan
7
Department of Family Medicine, Taichung Veterans General Hospital, Taichung 40705, Taiwan
8
School of Medicine, National Yang Ming Chiao Tung University, Taipei 11221, Taiwan
9
Department of Post-Baccalaureate Medicine, College of Medicine, National Chung Hsing University, Taichung 40227, Taiwan
10
School of Medicine, Chung Shan Medical University, Taichung 40201, Taiwan
11
Institute of Health Policy and Management, National Taiwan University, Taipei 10617, Taiwan
12
Department of Family Medicine, Taichung Hospital, Ministry of Health and Welfare, Taichung 40343, Taiwan
13
Institute of Population Sciences, National Health Research Institutes, Miaoli 35053, Taiwan
14
College of Management, Chaoyang University of Technology, Taichung 41349, Taiwan
15
Study Group of Integrated Health and Social Care Project, Ministry of Health and Welfare, Taipei 11558, Taiwan
*
Authors to whom correspondence should be addressed.
Int. J. Environ. Res. Public Health 2022, 19(6), 3317; https://doi.org/10.3390/ijerph19063317
Submission received: 24 January 2022 / Revised: 6 March 2022 / Accepted: 9 March 2022 / Published: 11 March 2022
(This article belongs to the Special Issue Psychosocial Factors and Health Outcomes of the Elderly)

Abstract

:
Understanding multimorbidity patterns is important in finding a common etiology and developing prevention strategies. Our aim was to identify the multimorbidity patterns of Taiwanese people aged over 50 years and to explore their relationship with health outcomes. This longitudinal cohort study used data from the Taiwan Longitudinal Study on Aging. The data were obtained from wave 3, and the multimorbidity patterns in 1996, 1999, 2003, 2007, and 2011 were analyzed separately by latent class analysis (LCA). The association between each disease group and mortality was examined using logistic regression. Four disease patterns were identified in 1996, namely, the cardiometabolic (18.57%), arthritis–cataract (15.61%), relatively healthy (58.92%), and multimorbidity (6.9%) groups. These disease groups remained similar in the following years. After adjusting all the confounders, the cardiometabolic group showed the highest risk for mortality (odds ratio: 1.237, 95% confidence interval: 1.040–1.472). This longitudinal study reveals the trend of multimorbidity among older adults in Taiwan for 16 years. Older adults with a cardiometabolic multimorbidity pattern had a dismal outcome. Thus, healthcare professionals should put more emphasis on the prevention and identification of cardiometabolic multimorbidity.

1. Introduction

Taiwan has been an aging society since 2018 and is expected to be a super-aged society in 2025 [1], suggesting that one in five citizens will be over 65 years old. As the aging population rapidly grows, public issues, especially medical demands, also grow. Multimorbidity, defined as the coexistence of two or more chronic conditions in a person, is frequently observed on older people, leading to problems of polypharmacy and increased difficulty to provide care [2,3]. Multimorbidity is also associated with worse clinical outcomes, poorer quality of life, and increased medical expenditures [4,5,6].
Multimorbidity has been widely measured by disease numbers or severity [7,8], but rarely by disease patterns. Certain conditions are more likely to cluster than others. They may share causal factors and have similar or the same pathological pathways or networks; among them are cardiovascular diseases and some metabolic diseases [9,10]. Mapping the disease clusters may help us find the possible etiology of multimorbidity, allowing us to better understand which multimorbidity clusters cause the greatest burden and to identify the determinants of the most common clusters of conditions; as a result, the prevention strategy of different clusters of multimorbidity could be developed.
Latent class analysis (LCA) is a statistical procedure used to identify different subgroups within populations who often share similar characteristics [11]. Hence, recent studies have used LCA to determine disease patterns. In the United States, participants aged 50 years and older with different combinations of 13 chronic conditions were surveyed from 2002 to 2014 by the National Health Interview Survey. Five multimorbidity groups were identified, namely, healthy (51.5%), age-associated chronic conditions (33.6%), respiratory conditions (7.3%), cognitively impaired (4.3%), and complex cardiometabolic (3.2%). The cognitively impaired group demonstrated a significantly higher mortality [12]. Moreover, a Korean study discovered three disease patterns: a relatively healthy group (60.4%); a cardiometabolic conditions group (27.8%); and an arthritis, asthma, allergic rhinitis, depression, and thyroid disease group (11.8%) [13].
However, no similar study has been conducted in Taiwan. Considering that Taiwan is one of the most rapidly aging countries worldwide, understanding its multimorbidity pattern over the years will help us understand its process and the impact of aging. This study aimed to identify the disease patterns of Taiwanese people aged over 50 years and to explore their relationship to health outcomes through a population-based longitudinal study.

2. Materials and Methods

2.1. Data Source

This longitudinal cohort study used data from the Taiwan Longitudinal Study on Aging (TLSA), which has been conducted by the health promotion ministration since 1989. TLSA involves adults aged above 60 years residing in nonaboriginal townships of Taiwan. The respondents were followed every 3 to 4 years (1989, 1993, 1996, 1999, 2003, 2007, and 2011). Two fresh samples were added in 1996 and 2003 to maintain the representativeness of the younger age cohort and extend that of the cohort aged 50 years or more. This trend analysis obtained data from wave 3 and examined the multimorbidity patterns in 1996, 1999, 2003, 2007, and 2011 separately. Initially, 5130 individuals aged above 50 years were involved, and in 2011, 2420 individuals were included in the analysis.
The mortality rate was verified in 2012 using the Death Registration from the Ministry of the Interior in Taiwan.

2.2. Study Variables

This study assessed 12 diseases, including hypertension, diabetes mellitus, coronary artery disease, stroke, cancer, lung disease, arthritis or rheumatic disease, hepatobiliary disease, renal disease (including stone), gout, hip fracture, and cataracts. Participants were asked the following question: “Have you ever had the disease…?” If the answer was “No” or “I don’t know”, they would be categorized as the disease-free group. Other variables were age, sex, income level, social participation, self-rated health, health behaviors (smoking, drinking, betelnut chewing, and exercise habit), admission experience in the past 12 months, disability, and depression.
The level of income was determined by asking “Are you satisfied with your income?” The answer could be good (very satisfied/satisfied), fair, or poor (unsatisfied/very unsatisfied). Individuals who had either paid, voluntarily worked, or participated in community activities were considered as having social participation. Moreover, individuals were divided into three groups according to self-rated health: good (very good/good), fair, and poor (poor/very poor). Exercise habits were divided into no exercise, ≤2 times, 3–5 times, and ≥6 times per week.
Their activities of daily living were also assessed by asking if they can do the following tasks: bathing, taking off and putting on clothes, eating meal, getting up from bed, standing and sitting on a chair, walking indoor, and going to the toilet. If they could not do any one of these tasks, they were considered disabled. In addition, depression was evaluated using the 10-item questionnaire of the Center for Epidemiologic Studies Depression Scale (CES-D). Each question was scored between 0 and 3, and the last two questions were reverse questions. A score above 10 points indicated depression [14].

2.3. Statistical Analysis

Disease patterns were estimated by LCA. We chose the most appropriate model groups with lower Bayesian Information Criterion values and descriptively analyzed the demographic and clinical characteristics of each group. Continuous and categorical variables were assessed using the analysis of variance and Chi-square test, respectively. The relationship between disease patterns and mortality was examined by univariate and multivariate logistic regression. In the multivariate analysis, we classified all the covariates into sociodemographic factors (age, sex, income satisfaction, and social participation), health behavior factors (smoking, drinking, and exercise habits), and health status factors (self-rated health, admission experience, disability status, and depression status). Each time we added one group, we adjusted the covariates to observe the effect of different dimensions.
The LCA was performed in PROC LCA 1.3.2, which is developed for SAS version 9.4 for Windows by the Methodology Center at Penn State. All the data were analyzed using the SAS 9.4 (SAS Institute, Cary, NC, USA). A p-value of less than 0.05 was considered statistically significant.

3. Results

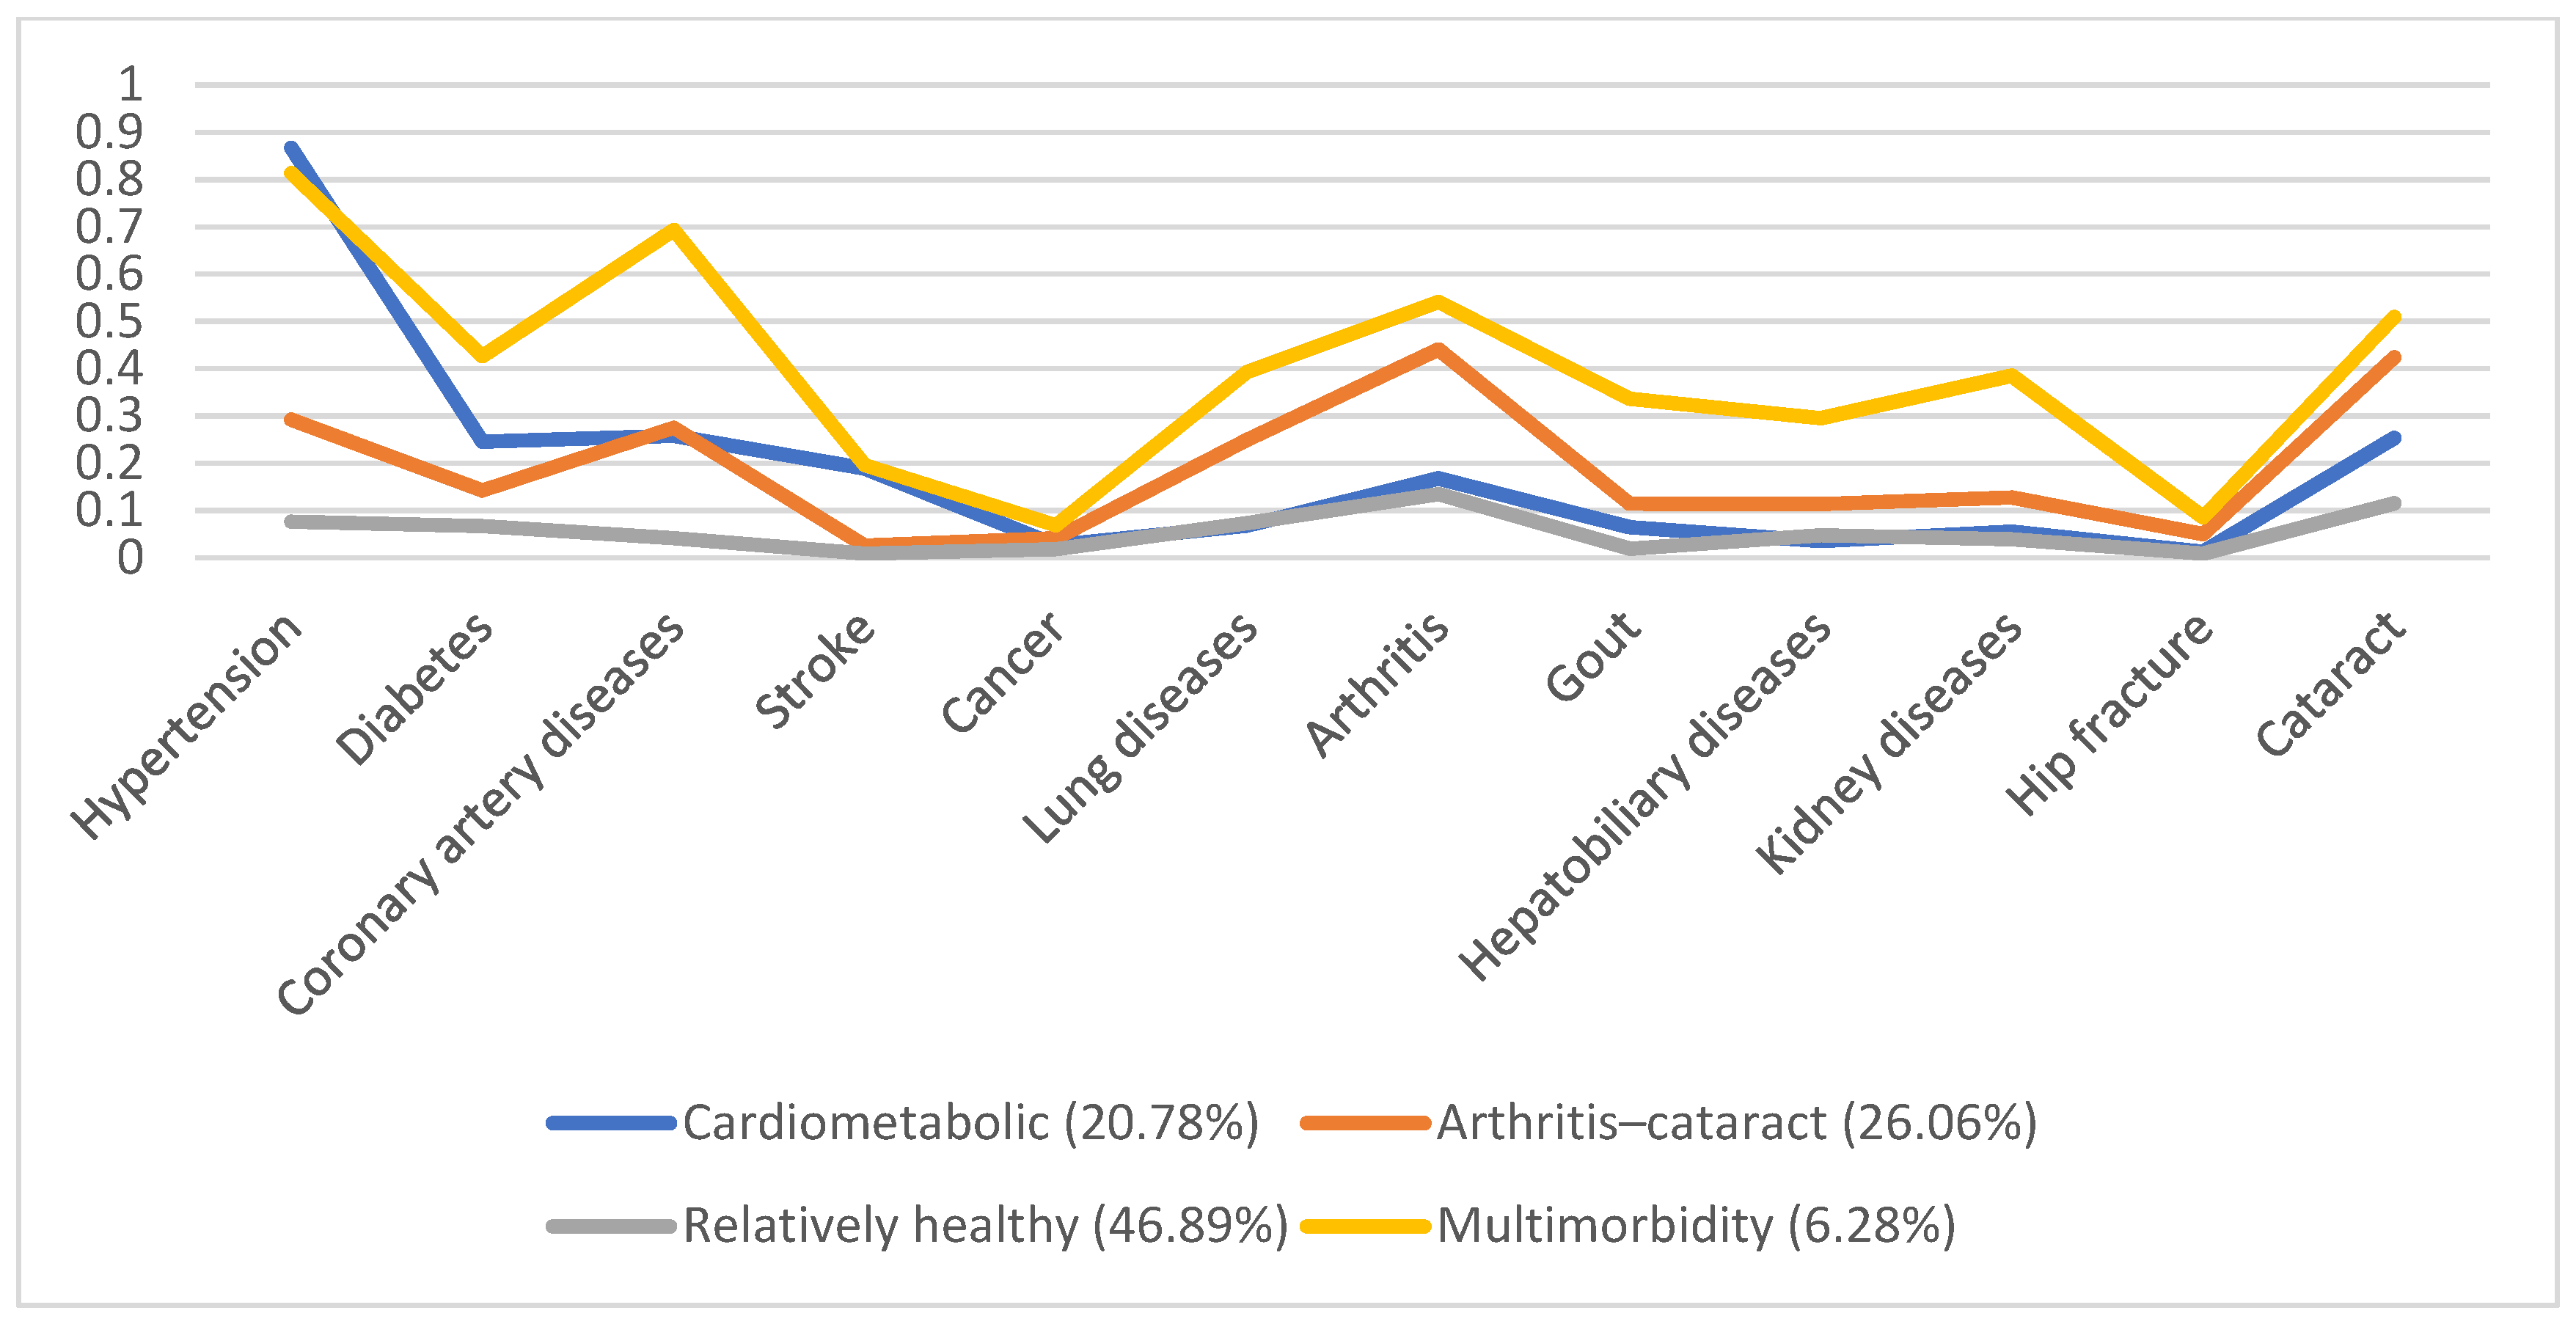
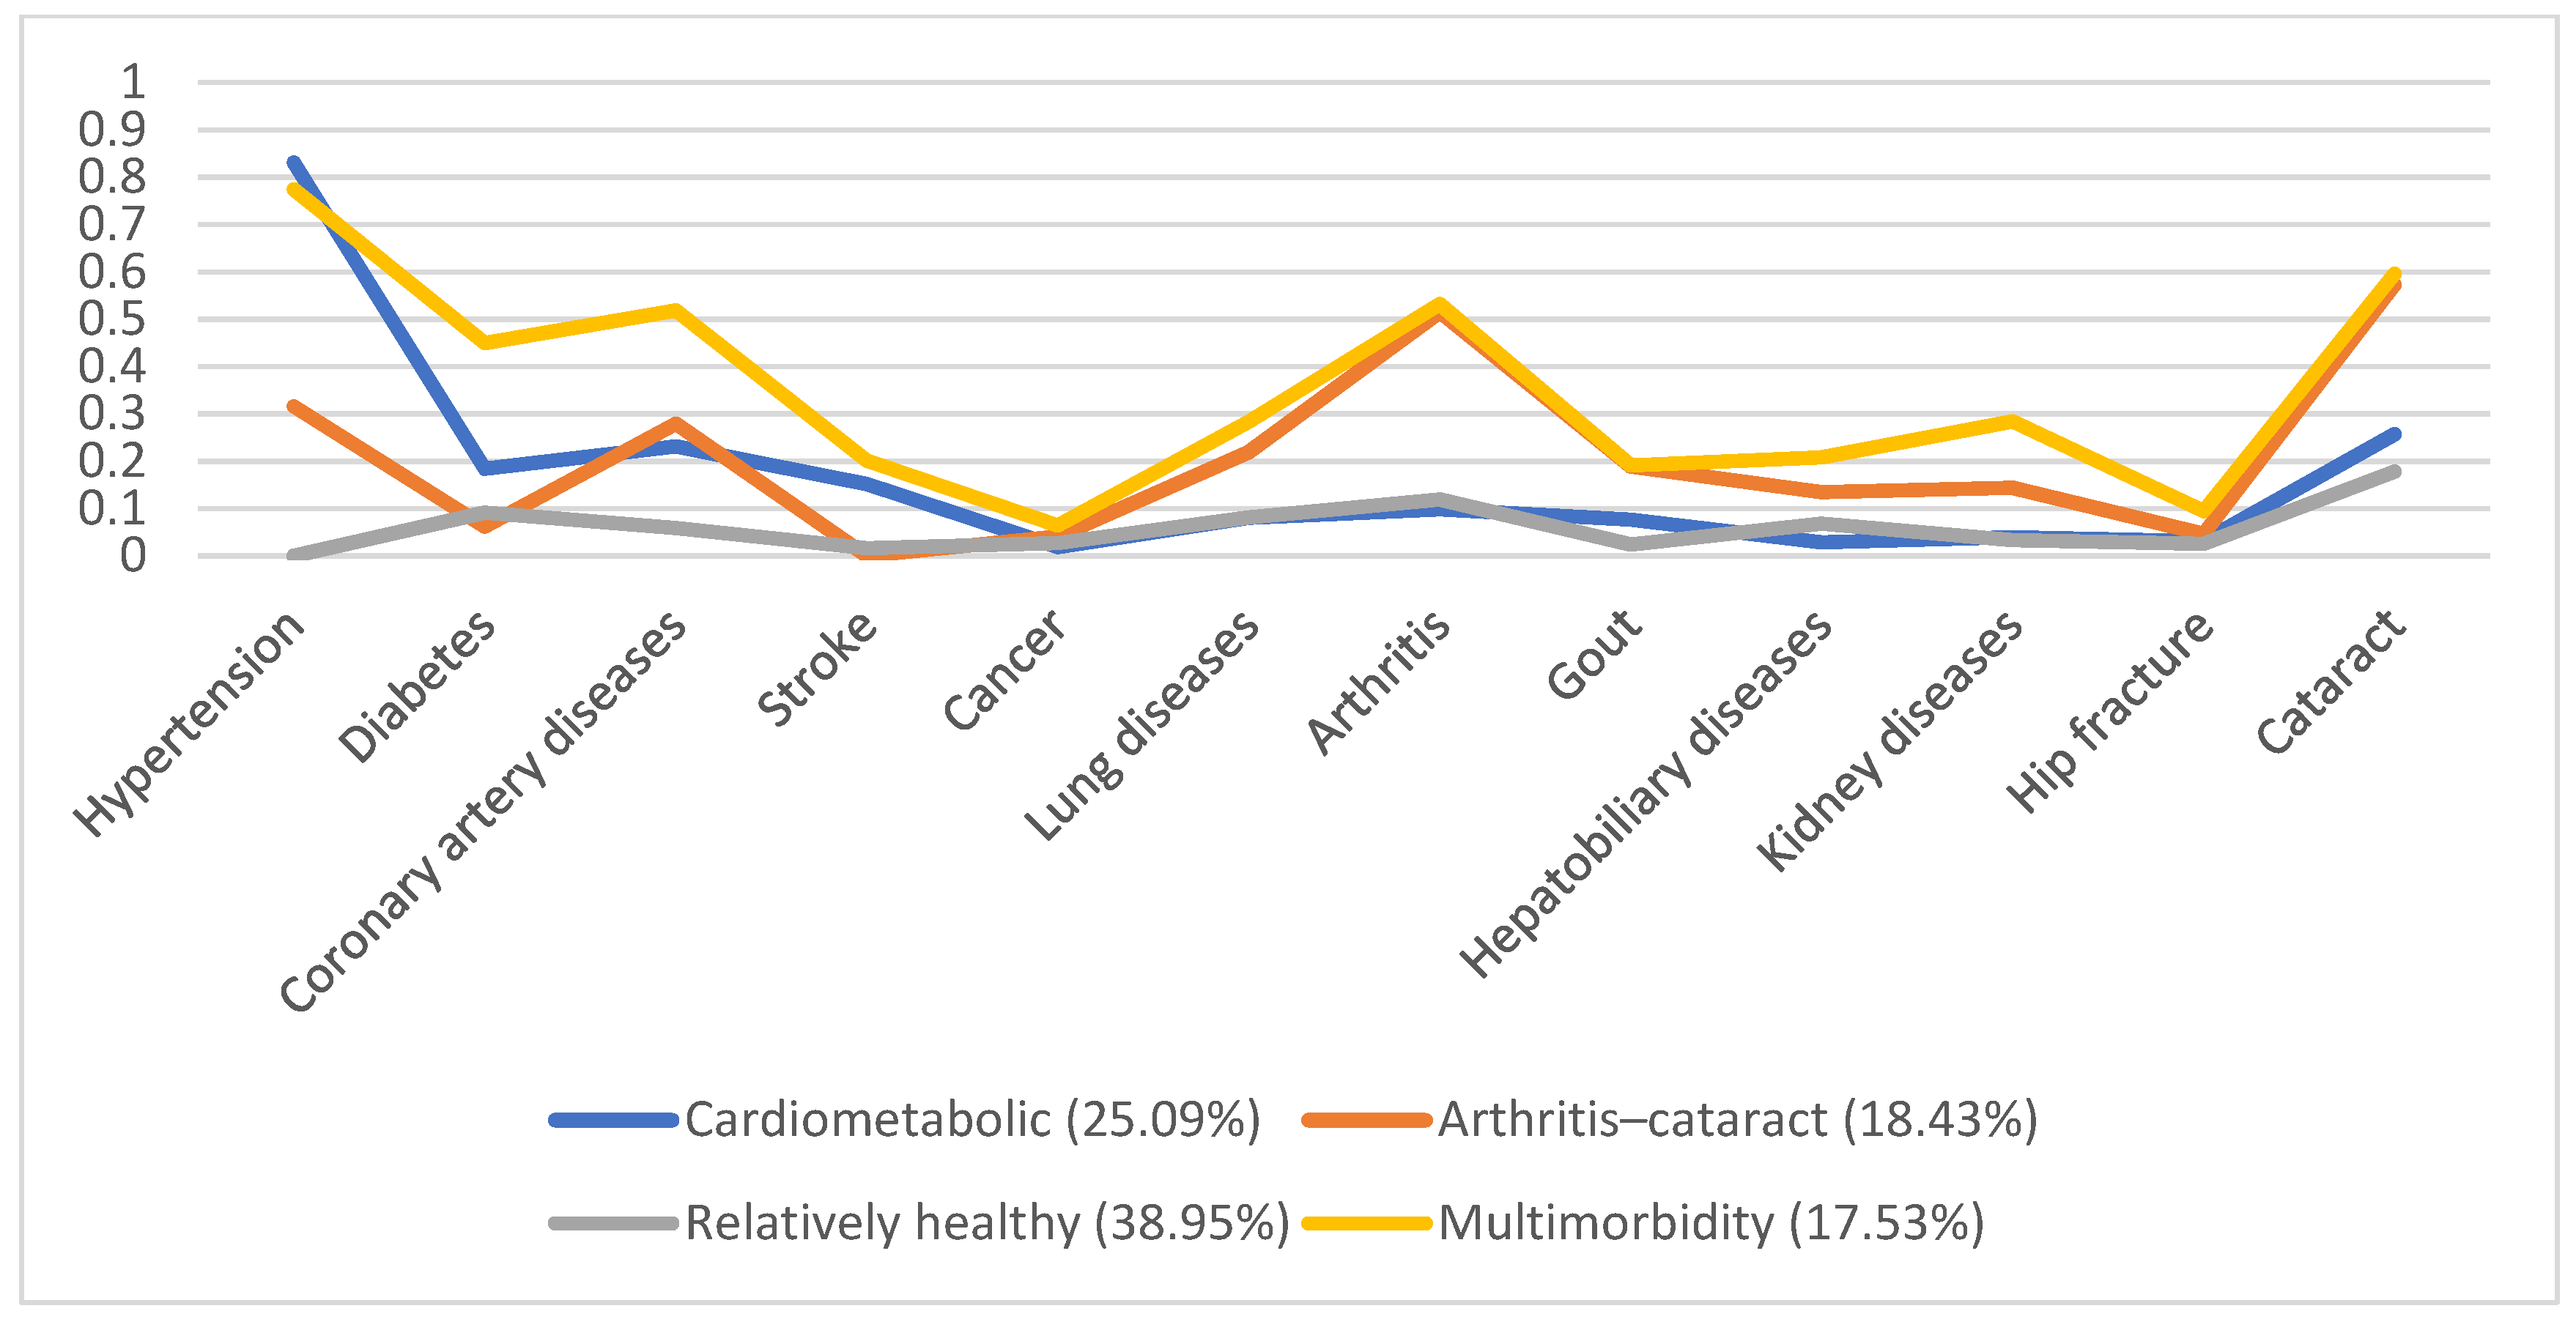
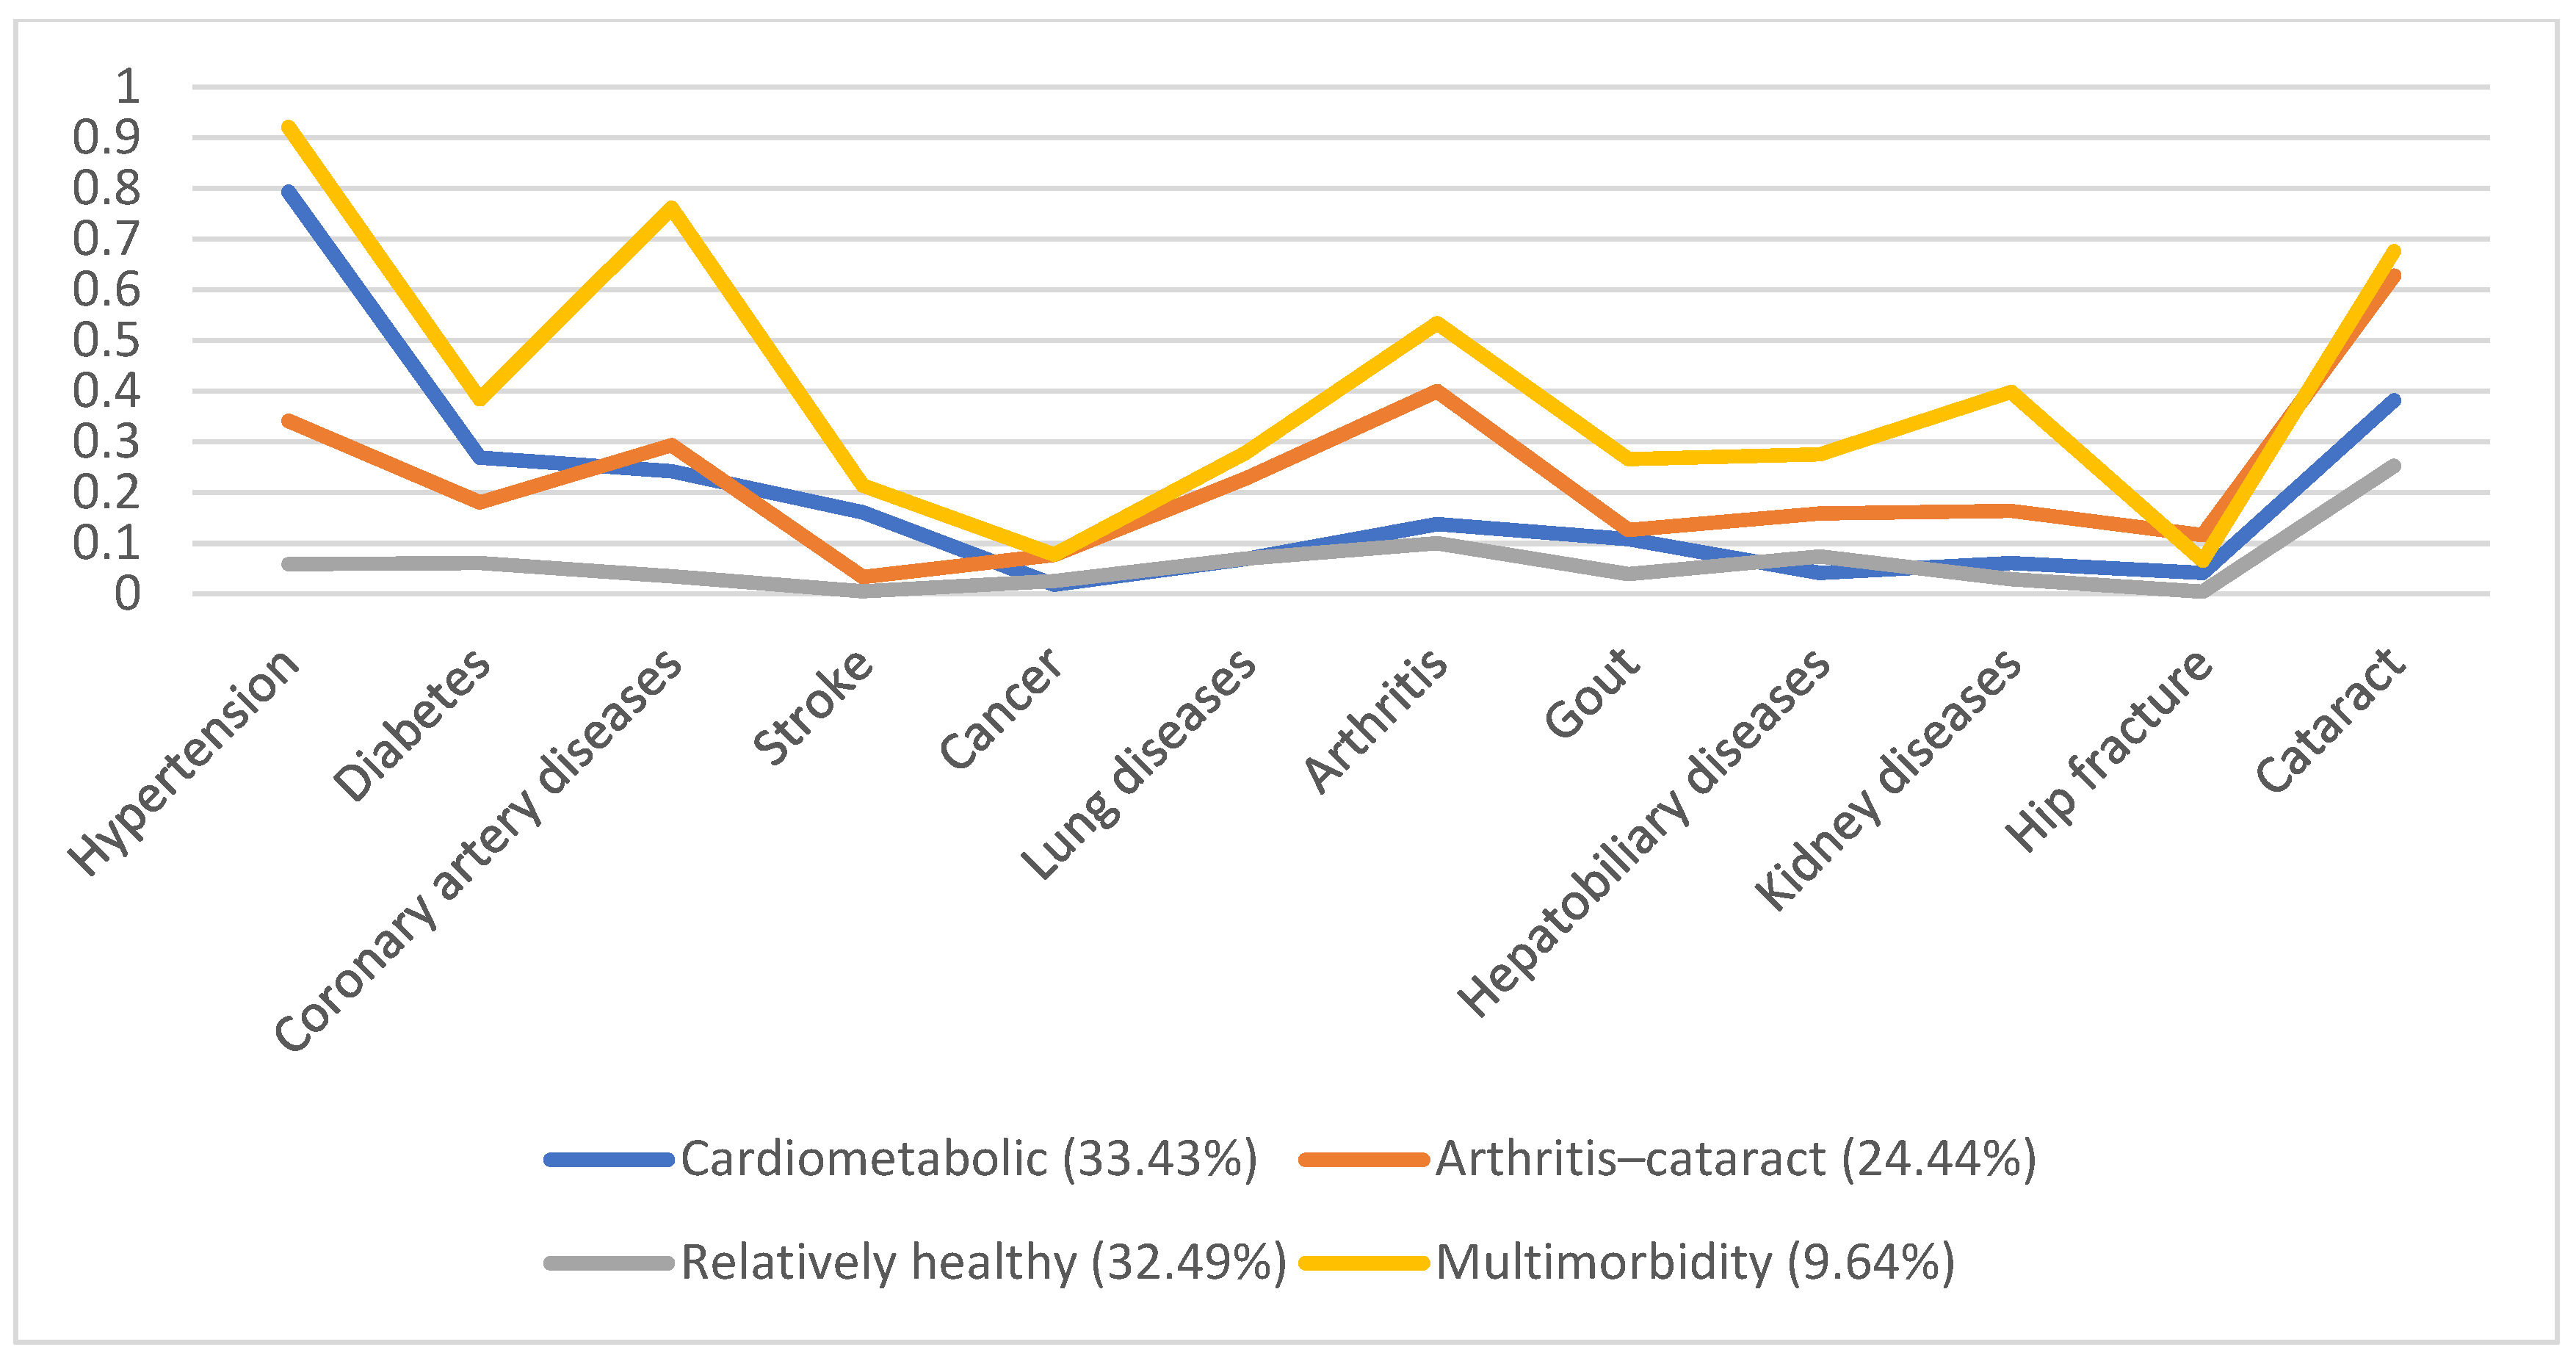
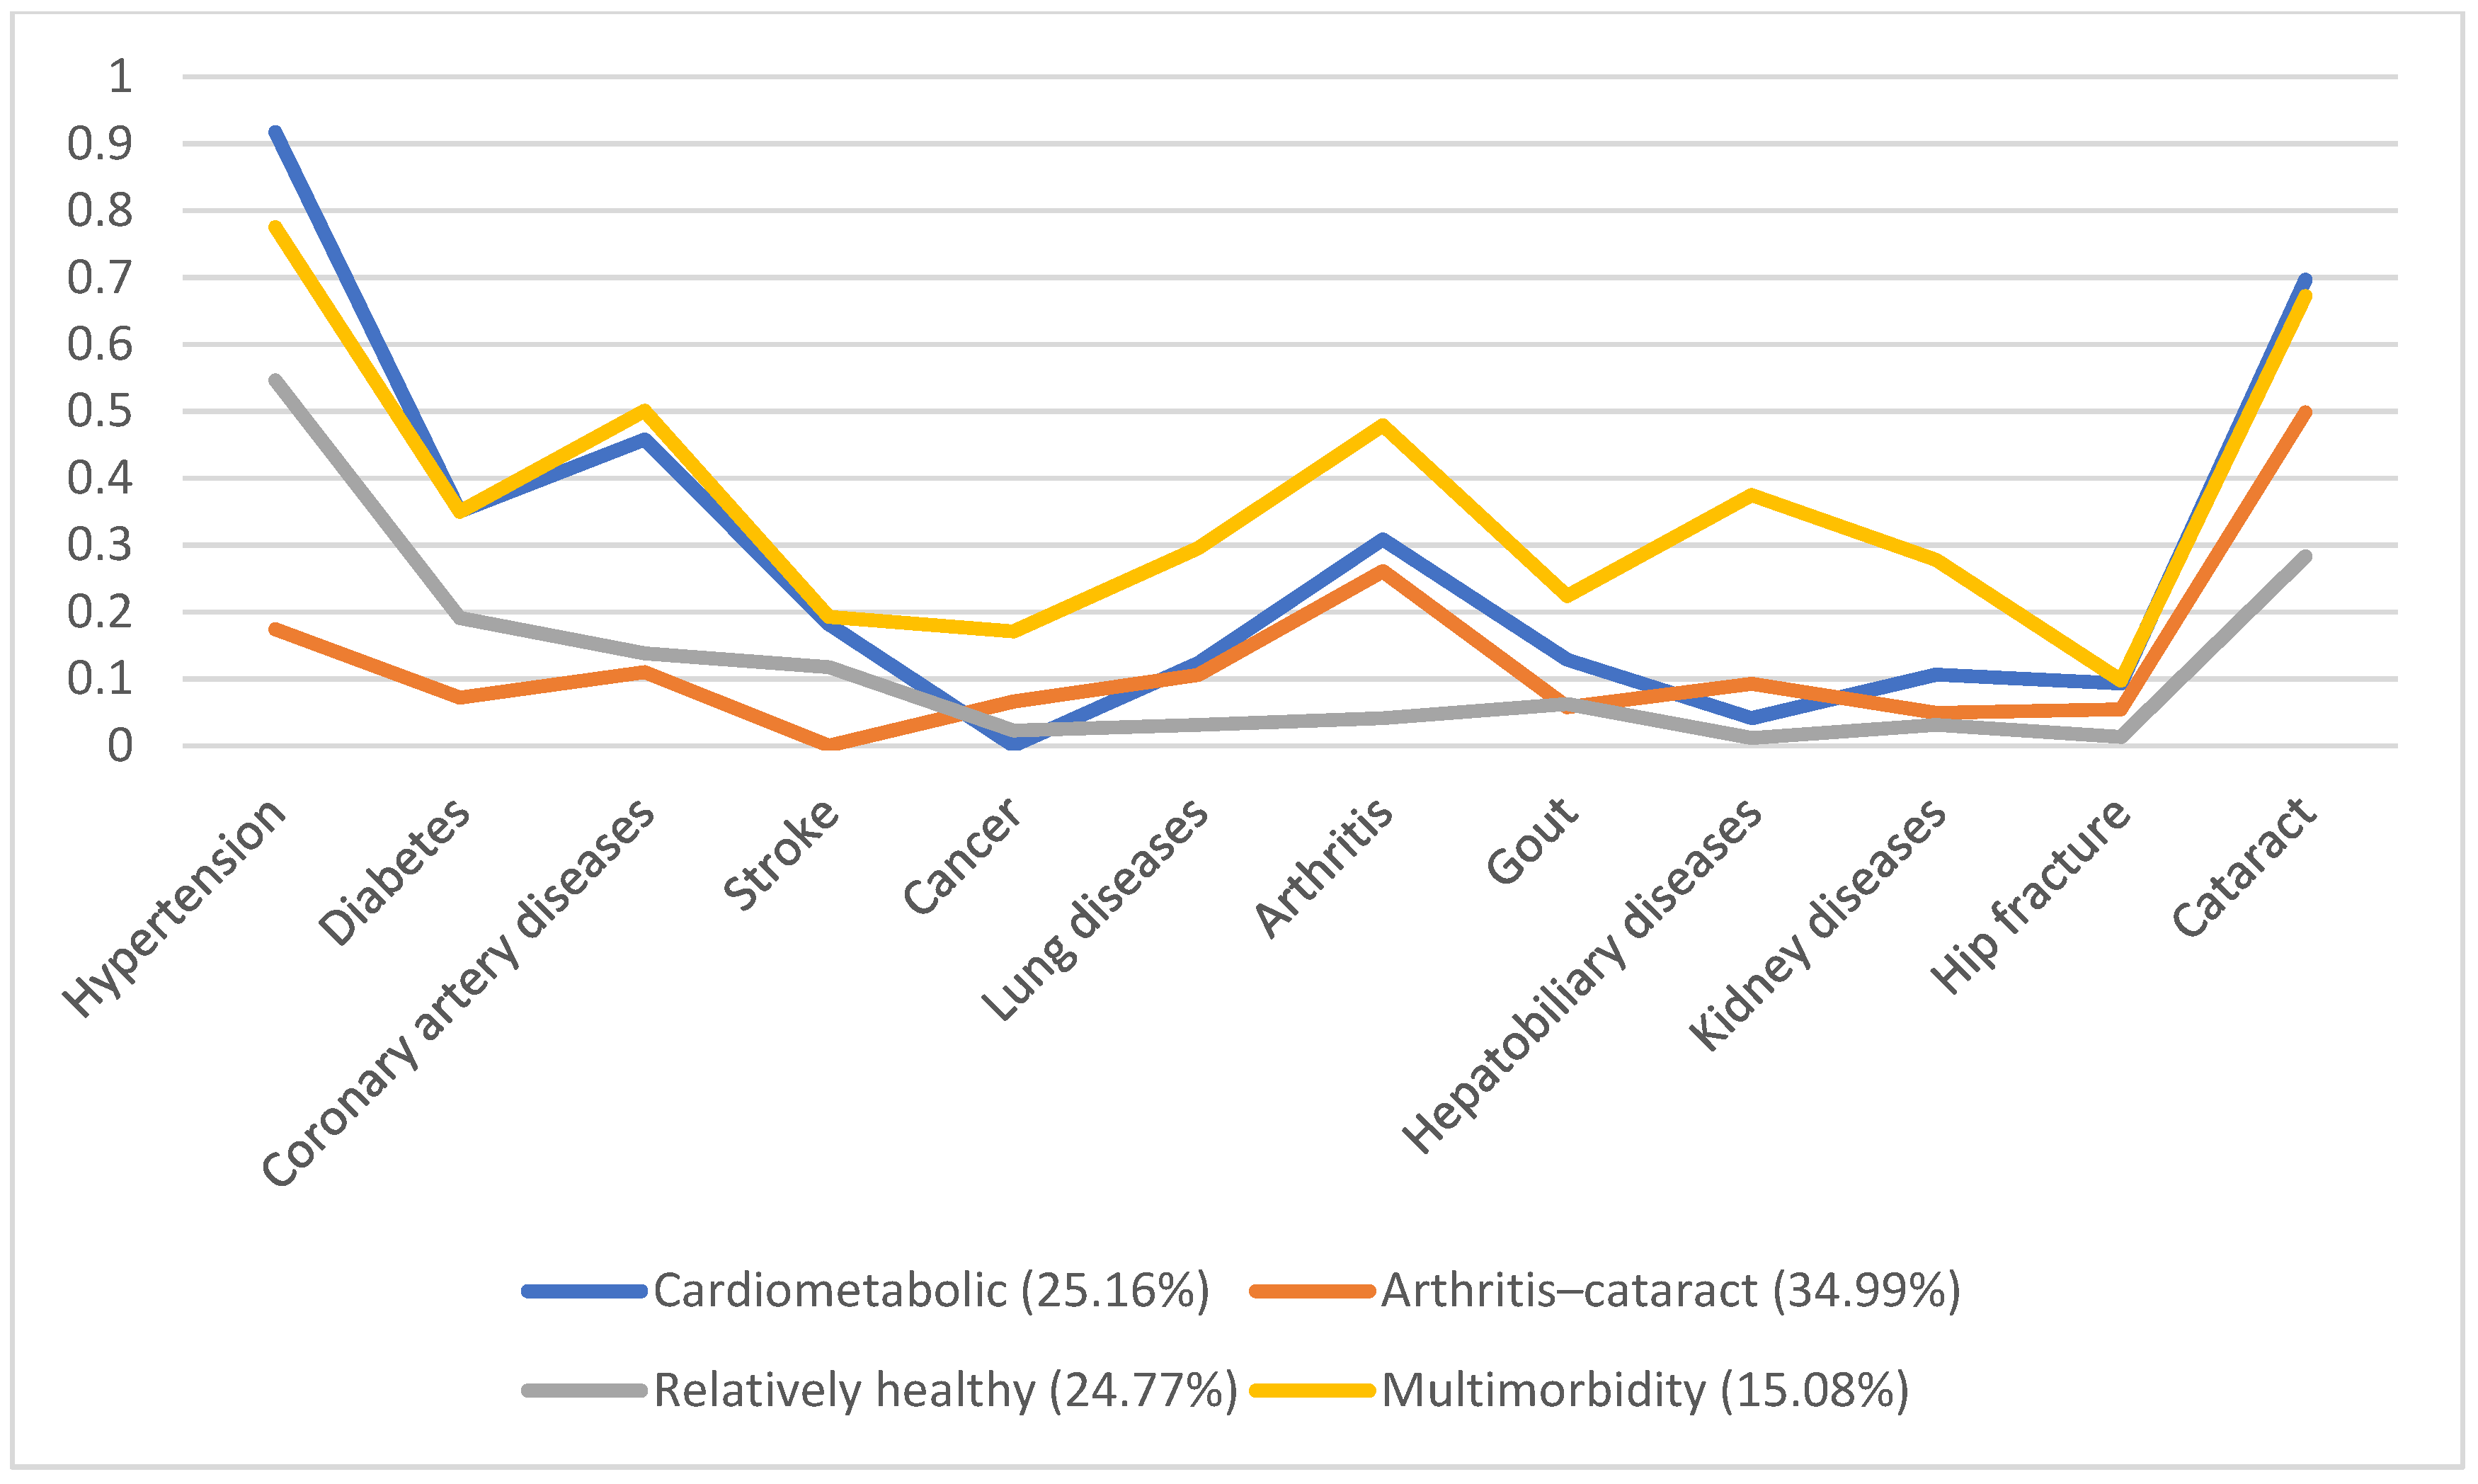
In 1996, 5130 individuals were involved, with male predominance (53.8%) and a mean age of 66.7. Additionally, we identified four disease patterns, namely, the cardiometabolic, arthritis–cataract, relatively healthy, and multimorbidity groups (18.57%, 15.61%, 58.92%, and 6.9%, respectively). These disease patterns remained similar in the following years (Figure 1, Figure 2, Figure 3, Figure 4 and Figure 5). However, eventually, the participants acquired more disease problems, causing the proportion of the multimorbidity group to rise from 6.9% to 15.08% and that of the relatively health group to decrease from 58.92% to 24.77%.
The baseline demographic characteristics showed higher rates of poor income satisfaction, self-rated health, admission experience, disability, and depression in the multimorbidity group than in the other groups (Table 1).
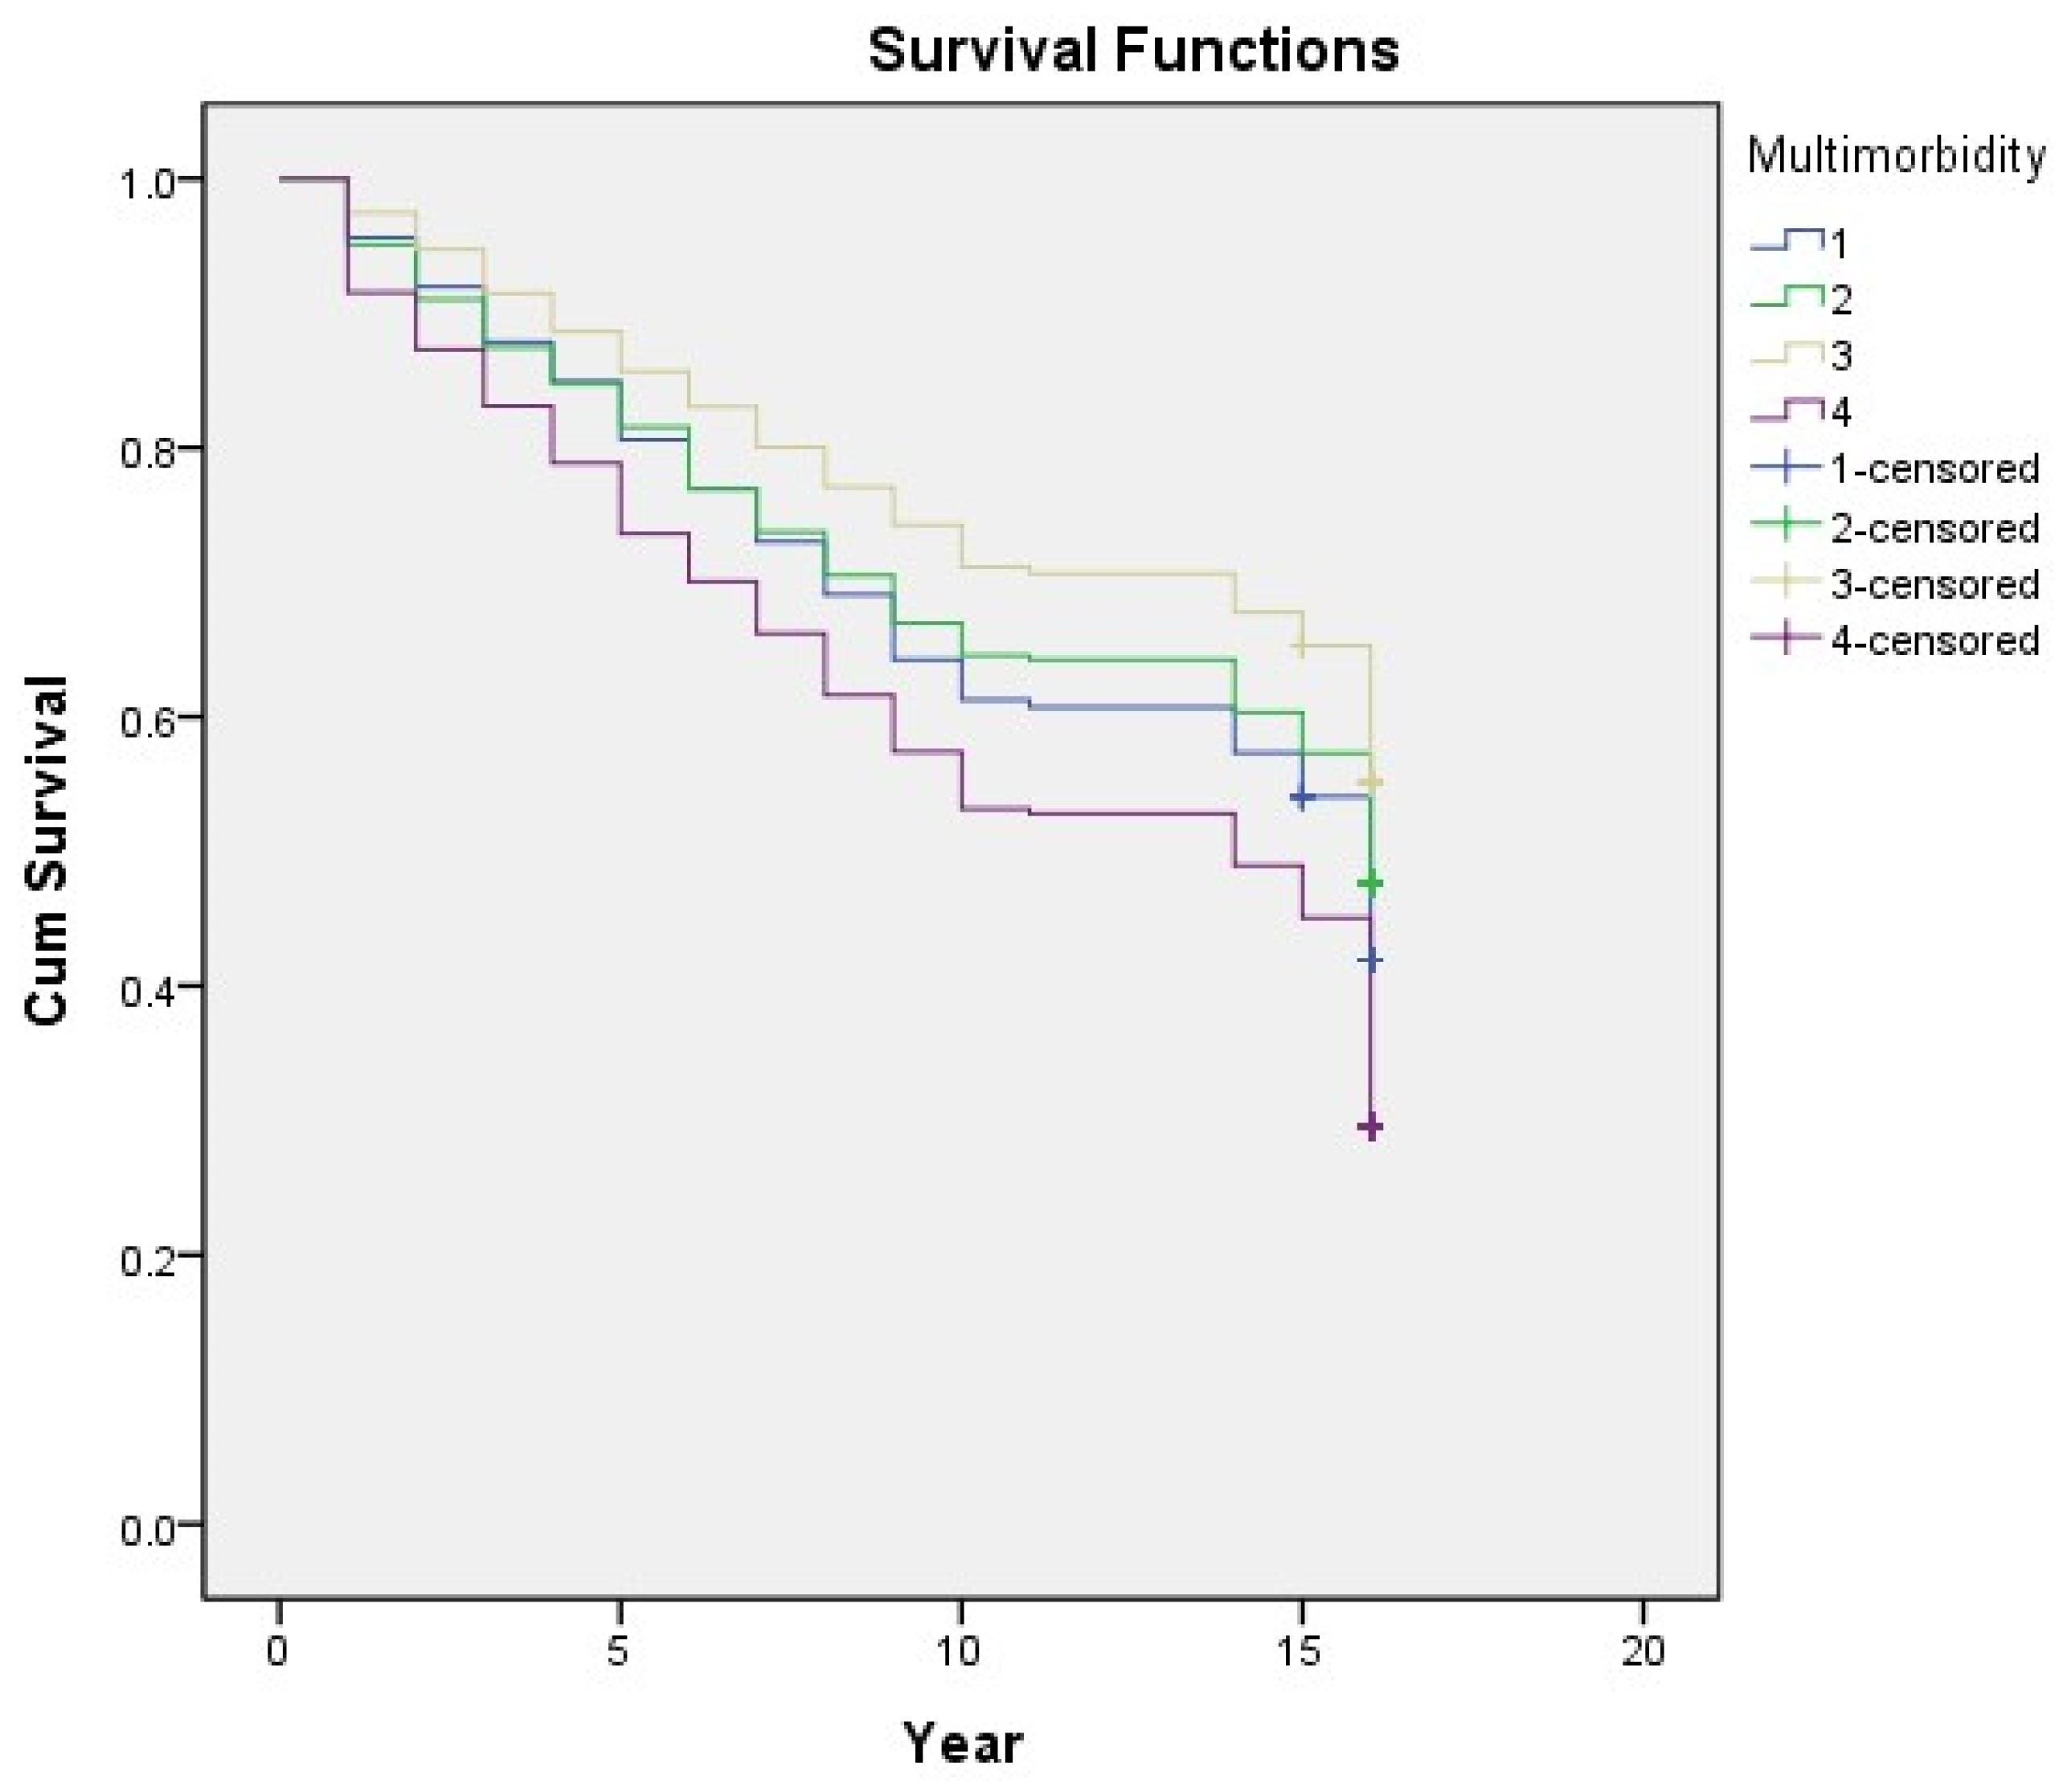
In the univariate logistic regression analysis, all the variables, except for betelnut chewing, were significantly associated with mortality (Table 2). In the unadjusted model (Model 1), the multimorbidity group showed a higher risk for mortality, followed by the cardiometabolic and arthritis–cataract groups. Figure 6 shows the survival analysis of the Kaplan–Meier curve under the Cox regression model. After adjusting the socioeconomic factors (Model 2), the relationship between mortality risk and the arthritis–cataract group became insignificant. Model 3 (added health behavior confounders) demonstrated that the mortality risk was high in individuals with a smoking habit and that drinking showed a protective effect; the result remained the same in Model 4 (added health status factors). Eventually, after adjusting all the confounders, the cardiometabolic group showed the highest risk for mortality (odd ratio: 1.237, 95% confidence interval: 1.040–1.472); other significant risk factors were advanced age, male sex, smoking, poor self-rated health, admission in the past year, disability, and depression (Table 3).
Subgroup analysis of age among different multimorbidity patterns in relation to mortality was also done. There was a significant association between the cardiometabolic group and multimorbidity group and mortality among participants less than 65 years old. Gender has no effect on mortality in different multimorbidity patterns according to the subgroup analysis (Supplementary Table S1).

4. Discussion

In this population-based longitudinal study with LCA, we determined four disease patterns, namely, the cardiometabolic, arthritis–cataract, relative healthy, and multimorbidity groups. Comparing our findings with those of other countries is difficult because the population compositions and socioeconomic status are very different. Nonetheless, our findings and those from other countries have some similarities. For instance, the relatively healthy group is the majority, and the percentage is approximately 50–70% [12,13,15,16]. In our study, the relatively healthy group accounted for 58.92% of the whole study population.
Hypertension, diabetes, coronary diseases, and stroke, which constitute the cardiometabolic group, coexist in many studies [12,13,16]. The World Health Organization and the American Society of Endocrinology already recognize cardiometabolic syndrome as a disease entity [17] with similar risk factors and pathophysiology, such as visceral obesity, chronic inflammation, insulin resistance, dyslipidemia, and hypertension. In our study, the cardiometabolic group comprised almost 20% of older people initially and had a higher risk for mortality in the multivariate regression analysis. Developing an effective screening strategy to identify the population at risk and introducing appropriate treatment and lifestyle interventions are essential among older people [18]. Furthermore, our results implicated that healthcare professionals should be more careful when treating patients with comorbid hypertension, diabetes, coronary diseases, and stroke, especially those less than 65 years old. Case management and telemonitoring should be applied to this specific group of patients to lower the risk in daily life [19,20].
Our study also identified the arthritis–cataract group, which is not frequently seen in other studies. Only few studies have investigated the relationship between eye diseases and arthritis. One study using data from the Irish Longitudinal Study on Aging found that eye diseases increased the risk of developing arthritis, whereby cataracts were the most significant [21]. In other studies, ocular comorbidities were associated with many types of arthritis, including juvenile idiopathic arthritis and psoriatic arthritis [22,23]. Although the causal relationship is vague, some common pathological mechanisms are involved. For example, the inflammatory process may both affect the joints and eyes [24,25]. A unifying role of the oxidative stress between cataracts and rheumatoid arthritis has also been suggested [26]. The body’s immune system attacking self-antigens also plays a crucial role in arthritis and ocular comorbidities [27]. Corticosteroid could also be a linkage between these two comorbidities. A meta-analysis found that there is a possible association between glucocorticoid use and the development of cataract in patients with rheumatoid arthritis [28]. In a recent study, a relationship has been found between cataracts and juvenile arthritis mediated by topical corticosteroid use, suggesting that medication is one of the reasons for these comorbidities [29]. Additionally, life quality, negative self-perceptions regarding aging, mobility, memory impairments, and sleep quality mediated the relationship between cataracts and arthritis according to a previous study [21]. Further study is warranted to explore the mechanism of these two comorbidities. Although the arthritis–cataract group did not have a higher risk of mortality, many studies investigating both of these diseases reported a poorer quality of life [30,31,32,33,34]. To achieve a better quality of life, older people with these problems must receive early intervention and proper treatment.
Our stepwise multivariate analysis revealed that advanced age, male sex, smoking, poor self-rated health, admission in the past year, disability, and depression are risk factors of mortality. Interestingly, drinking was a protective factor in our analysis. Previous reports regarding the relationship between alcohol consumption and mortality were inconsistent [35,36,37]. Further study is required to evaluate the details of drinking habits and the types and amount of alcohol.
This study is the first to use LCA to evaluate disease patterns in Taiwan. Moreover, it included a large nationwide, representative, and randomly selected population with extremely high response rates. Hence, the results are reliable, thereby applicable for risk stratification by policymakers and the development of effective health interventions.
However, this study has some limitations. First, all the variables obtained were self-reported. Although some questions, such as “Is your disease being diagnosed by doctors or treated with medications?” were added to improve the accuracy; no medical records, blood tests, or images were utilized to confirm the diagnosis. Recall bias may also exist. Second, the relationship between each disease pattern and mortality was surveyed over a long period. The time-varying effect was not considered in the logistic regression model. Further statistical methods concerning the time effect might be used in future studies.

5. Conclusions

This nationwide study identified four disease patterns in older people: the cardiometabolic, arthritis–cataract, relatively healthy, and multimorbidity groups. The cardiometabolic group showed the highest risk for mortality. Thus, improving the prevention strategy toward cardiometabolic diseases with proper intervention should be emphasized in the future.

Supplementary Materials

The following supporting information can be downloaded at: https://www.mdpi.com/article/10.3390/ijerph19063317/s1, Table S1. Subgroup analysis of age among different multimorbidity patterns in relation to mortality.

Author Contributions

Conceptualization, H.-E.H.; methodology, H.-E.H.; software, J.C.-C.W.; validation, W.-M.C. and M.-C.L.; formal analysis, H.-E.H. and C.-J.Y.; investigation, H.-E.H. and W.-M.C.; resources, J.C.-C.W. and M.-C.L.; data curation, C.-J.Y.; writing—original draft preparation, H.-E.H. and W.-M.C.; writing—review and editing, H.-E.H. and W.-M.C.; supervision, W.-M.C.; project administration, M.-C.L.; funding acquisition, M.-C.L. All authors have read and agreed to the published version of the manuscript.

Funding

This work was supported by the Ministry of Health and Welfare, Taiwan (Grant number: M06M2346 awarded to M.-C.L.).

Institutional Review Board Statement

The current study was approved by the Institutional Review Board of Health Promotion Administration, Ministry of Health and Welfare (Approval no. BHP-2007-002).

Informed Consent Statement

Before recruitment, all participants received a proper explanation about the study and provided consent for inclusion in the study. Participants who could read and write signed the written consent documents; those who could not read or write used a name chop or handprint with the assistance of their family members. In addition, a legal guardian/representative provided consent on behalf of participants with cognitive decline or stroke.

Data Availability Statement

The datasets used and analyzed during the current study are not publicly available, but are available from the corresponding author on reasonable request with the permission of the Ministry of Health and Welfare, Taiwan.

Conflicts of Interest

The authors declare no conflict of interest. The funders had no role in the design of the study; in the collection, analyses, or interpretation of data; in the writing of the manuscript; or in the decision to publish the results.

References

  1. National Development Council, Taiwan. Population projections for the ROC (Taiwan): 2018–2065; National Development Council: Taipei, Taiwan, 2018.
  2. Yarnall, A.J.; Sayer, A.A.; Clegg, A.; Rockwood, K.; Parker, S.; Hindle, J.V. New horizons in multimorbidity in older adults. Age Ageing 2017, 46, 882–888. [Google Scholar] [CrossRef] [PubMed] [Green Version]
  3. Kuzuya, M. Era of geriatric medical challenges: Multimorbidity among older patients. Geriatr. Gerontol. Int. 2019, 19, 699–704. [Google Scholar] [CrossRef] [PubMed]
  4. Sum, G.; Hone, T.; Atun, R.; Millett, C.; Suhrcke, M.; Mahal, A.; Koh, G.C.-H.; Lee, J.T. Multimorbidity and out-of-pocket expenditure on medicines: A systematic review. BMJ Glob. Health 2018, 3, e000505. [Google Scholar] [CrossRef] [PubMed] [Green Version]
  5. Makovski, T.T.; Schmitz, S.; Zeegers, M.P.; Stranges, S.; van den Akker, M. Multimorbidity and quality of life: Systematic literature review and meta-analysis. Ageing Res. Rev. 2019, 53, 100903. [Google Scholar] [CrossRef] [PubMed]
  6. Nguyen, Q.D.; Wu, C.; Odden, M.C.; Kim, D.H. Multimorbidity Patterns, Frailty, and Survival in Community-Dwelling Older Adults. J. Gerontol. A Biol. Sci. Med. Sci. 2019, 74, 1265–1270. [Google Scholar] [CrossRef] [Green Version]
  7. King, D.E.; Xiang, J.; Pilkerton, C.S. Multimorbidity Trends in United States Adults, 1988–2014. J. Am. Board Fam. Med. 2018, 31, 503–513. [Google Scholar] [CrossRef] [Green Version]
  8. Hu, R.H.; Hsiao, F.Y.; Chen, L.J.; Huang, P.T.; Hsu WW, Y. Increasing age- and gender-specific burden and complexity of multimorbidity in Taiwan, 2003–2013: A cross-sectional study based on nationwide claims data. BMJ Open 2019, 9, e028333. [Google Scholar] [CrossRef] [Green Version]
  9. Poblador-Plou, B.; van den Akker, M.; Vos, R.; Calderón-Larrañaga, A.; Metsemakers, J.; Prados-Torres, A. Similar multimorbidity patterns in primary care patients from two European regions: Results of a factor analysis. PLoS ONE 2014, 9, e100375. [Google Scholar] [CrossRef] [Green Version]
  10. Goodman, R.A.; Ling, S.M.; Briss, P.A.; Parrish, R.G.; Salive, M.E.; Finke, B.S. Multimorbidity Patterns in the United States: Implications for Research and Clinical Practice. J. Gerontol. A Biol. Sci. Med. Sci. 2016, 71, 215–220. [Google Scholar] [CrossRef] [Green Version]
  11. Weller, B.E.; Bowen, N.K.; Faubert, S.J. Latent class analysis: A guide to best practice. J. Black Psychol. 2020, 46, 287–311. [Google Scholar] [CrossRef]
  12. Zheng, D.D.; Loewenstein, D.A.; Christ, S.L.; Feaster, D.J.; Lam, B.L.; McCollister, K.E.; Curiel-Cid, R.E.; Lee, D.J. Multimorbidity patterns and their relationship to mortality in the US older adult population. PLoS ONE 2021, 16, e0245053. [Google Scholar] [CrossRef] [PubMed]
  13. Park, B.; Lee, H.A.; Park, H. Use of latent class analysis to identify multimorbidity patterns and associated factors in Korean adults aged 50 years and older. PLoS ONE 2019, 14, e0216259. [Google Scholar] [CrossRef] [PubMed] [Green Version]
  14. Zhang, W.; O’Brien, N.; Forrest, J.I.; Salters, K.A.; Patterson, T.L.; Montaner, J.S.G.; Hogg, R.S.; Lima, V.D. Validating a shortened depression scale (10 item CES-D) among HIV-positive people in British Columbia, Canada. PLoS ONE 2012, 7, e40793. [Google Scholar] [CrossRef]
  15. Nguyen, H.; Wu, Y.T.; Dregan, A.; Vitoratou, S.; Chua, K.C.; Prina, A.M. Multimorbidity patterns, all-cause mortality and healthy aging in older English adults: Results from the English Longitudinal Study of Aging. Geriatr. Gerontol. Int. 2020, 20, 1126–1132. [Google Scholar] [CrossRef] [PubMed]
  16. Olaya, B.; Moneta, M.V.; Caballero, F.F.; Tyrovolas, S.; Bayes, I.; Ayuso-Mateos, J.L.; Haro, J.M. Latent class analysis of multimorbidity patterns and associated outcomes in Spanish older adults: A prospective cohort study. BMC Geriatr. 2017, 17, 186. [Google Scholar] [CrossRef]
  17. Castro, J.P.; El-Atat, F.A.; McFarlane, S.I.; Aneja, A.; Sowers, J.R. Cardiometabolic syndrome: Pathophysiology and treatment. Curr. Hypertens. Rep. 2003, 5, 393–401. [Google Scholar] [CrossRef] [PubMed]
  18. Sattar, N.; Gill, J.M.R.; Alazawi, W. Improving prevention strategies for cardiometabolic disease. Nat. Med. 2020, 26, 320–325. [Google Scholar] [CrossRef]
  19. Padwal, R.S.; So, H.; Wood, P.W.; McAlister, F.A.; Siddiqui, M.; Norris, C.M.; Jeerakathil, T.; Stone, J.; Valaire, S.; Mann, B.; et al. Cost-effectiveness of home blood pressure telemonitoring and case management in the secondary prevention of cerebrovascular disease in Canada. J. Clin. Hypertens. 2019, 21, 159–168. [Google Scholar] [CrossRef]
  20. Kirchberger, I.; Hunger, M.; Stollenwerk, B.; Seidl, H.; Burkhardt, K.; Kuch, B.; Meisinger, C.; Holle, R. Effects of a 3-year nurse-based case management in aged patients with acute myocardial infarction on rehospitalisation, mortality, risk factors, physical functioning and mental health. a secondary analysis of the randomized controlled KORINNA study. PLoS ONE 2015, 10, e0116693. [Google Scholar] [CrossRef]
  21. Jin, W.; Yao, Q.; Liu, Z.; Cao, W.; Zhang, Y.; Che, Z.; Peng, H. Do eye diseases increase the risk of arthritis in the elderly population? Aging (Albany N. Y.) 2021, 13, 15580–15594. [Google Scholar] [CrossRef]
  22. Angeles-Han, S.; Yeh, S. Prevention and management of cataracts in children with juvenile idiopathic arthritis-associated uveitis. Curr. Rheumatol. Rep. 2012, 14, 142–149. [Google Scholar] [CrossRef] [PubMed] [Green Version]
  23. Lima, F.B.; Abalem, M.F.; Ruiz, D.G.; Gomes BD, A.; de Azevedo, M.N.; Moraes, H.V., Jr.; Yeskel, A.S.; Kara-Junior, N. Prevalence of eye disease in Brazilian patients with psoriatic arthritis. Clinics 2012, 67, 249–253. [Google Scholar] [CrossRef]
  24. Wang, H.; Tao, Y. Relationship between the higher inflammatory cytokines level in the aqueous humor of Fuchs uveitis syndrome and the presence of cataract. BMC Ophthalmol. 2021, 21, 108. [Google Scholar] [CrossRef] [PubMed]
  25. Patel, S.J.; Lundy, D.C. Ocular manifestations of autoimmune disease. Am. Fam. Phys. 2002, 66, 991–998. [Google Scholar]
  26. Hutnik, C.M.; Nichols, B.D. Cataracts in systemic diseases and syndromes. Curr. Opin. Ophthalmol. 1998, 9, 14–19. [Google Scholar] [CrossRef]
  27. Glover, K.; Mishra, D.; Singh, T.R.R. Epidemiology of Ocular Manifestations in Autoimmune Disease. Front. Immunol. 2021, 12, 744396. [Google Scholar] [CrossRef]
  28. Black, R.J.; Hill, C.L.; Lester, S.; Dixon, W. The Association between Systemic Glucocorticoid Use and the Risk of Cataract and Glaucoma in Patients with Rheumatoid Arthritis: A Systematic Review and Meta-Analysis. PLoS ONE 2016, 11, e0166468. [Google Scholar]
  29. Thorne, J.E.; Woreta, F.A.; Dunn, J.P.; Jabs, D.A. Risk of Cataract Development among Children with Juvenile Idiopathic Arthritis-Related Uveitis Treated with Topical Corticosteroids. Ophthalmology 2020, 127, S21–S26. [Google Scholar] [CrossRef]
  30. Mikuls, T.; Saag, K.; Criswell, L.; Merlino, L.; Cerhan, J.R. Health related quality of life in women with elderly onset rheumatoid arthritis. J. Rheumatol. 2003, 30, 952–957. [Google Scholar]
  31. Park, J.H.; Kim, D.J.; Kim, S.J. Is arthritis associated with suicidal ideation and quality of life? Psychol. Health Med. 2019, 24, 144–154. [Google Scholar] [CrossRef]
  32. Lee, Y.; Lee, S.-H.; Lim, S.M.; Baek, S.H.; Ha, I.-H. Mental health and quality of life of patients with osteoarthritis pain: The sixth Korea National Health and Nutrition Examination Survey (2013–2015). PLoS ONE 2020, 15, e0242077. [Google Scholar]
  33. Polack, S.; Kuper, H.; Mathenge, W.; Fletcher, A.; Foster, A. Cataract visual impairment and quality of life in a Kenyan population. Br. J. Ophthalmol. 2007, 91, 927–932. [Google Scholar] [CrossRef] [PubMed]
  34. Harutyunyan, T.; Giloyan, A.; Petrosyan, V. Factors associated with vision-related quality of life among the adult population living in Nagorno Karabagh. Public Health 2017, 153, 137–146. [Google Scholar] [CrossRef] [PubMed]
  35. Xi, B.; Veeranki, S.P.; Zhao, M.; Ma, C.; Yan, Y.; Mi, J. Relationship of Alcohol Consumption to All-Cause, Cardiovascular, and Cancer-Related Mortality in U.S. Adults. J. Am. Coll. Cardiol. 2017, 70, 913–922. [Google Scholar] [CrossRef]
  36. Stockwell, T.; Zhao, J.; Panwar, S.; Roemer, A.; Naimi, T.; Chikritzhs, T. Do “Moderate” Drinkers Have Reduced Mortality Risk? A Systematic Review and Meta-Analysis of Alcohol Consumption and All-Cause Mortality. J. Stud. Alcohol Drugs 2016, 77, 185–198. [Google Scholar] [CrossRef] [Green Version]
  37. Keyes, K.M.; Calvo, E.; Ornstein, K.A.; Rutherford, C.; Fox, M.P.; Staudinger, U.M.; Fried, L.P. Alcohol Consumption in Later Life and Mortality in the United States: Results from 9 Waves of the Health and Retirement Study. Alcohol. Clin. Exp. Res 2019, 43, 1734–1746. [Google Scholar] [CrossRef]
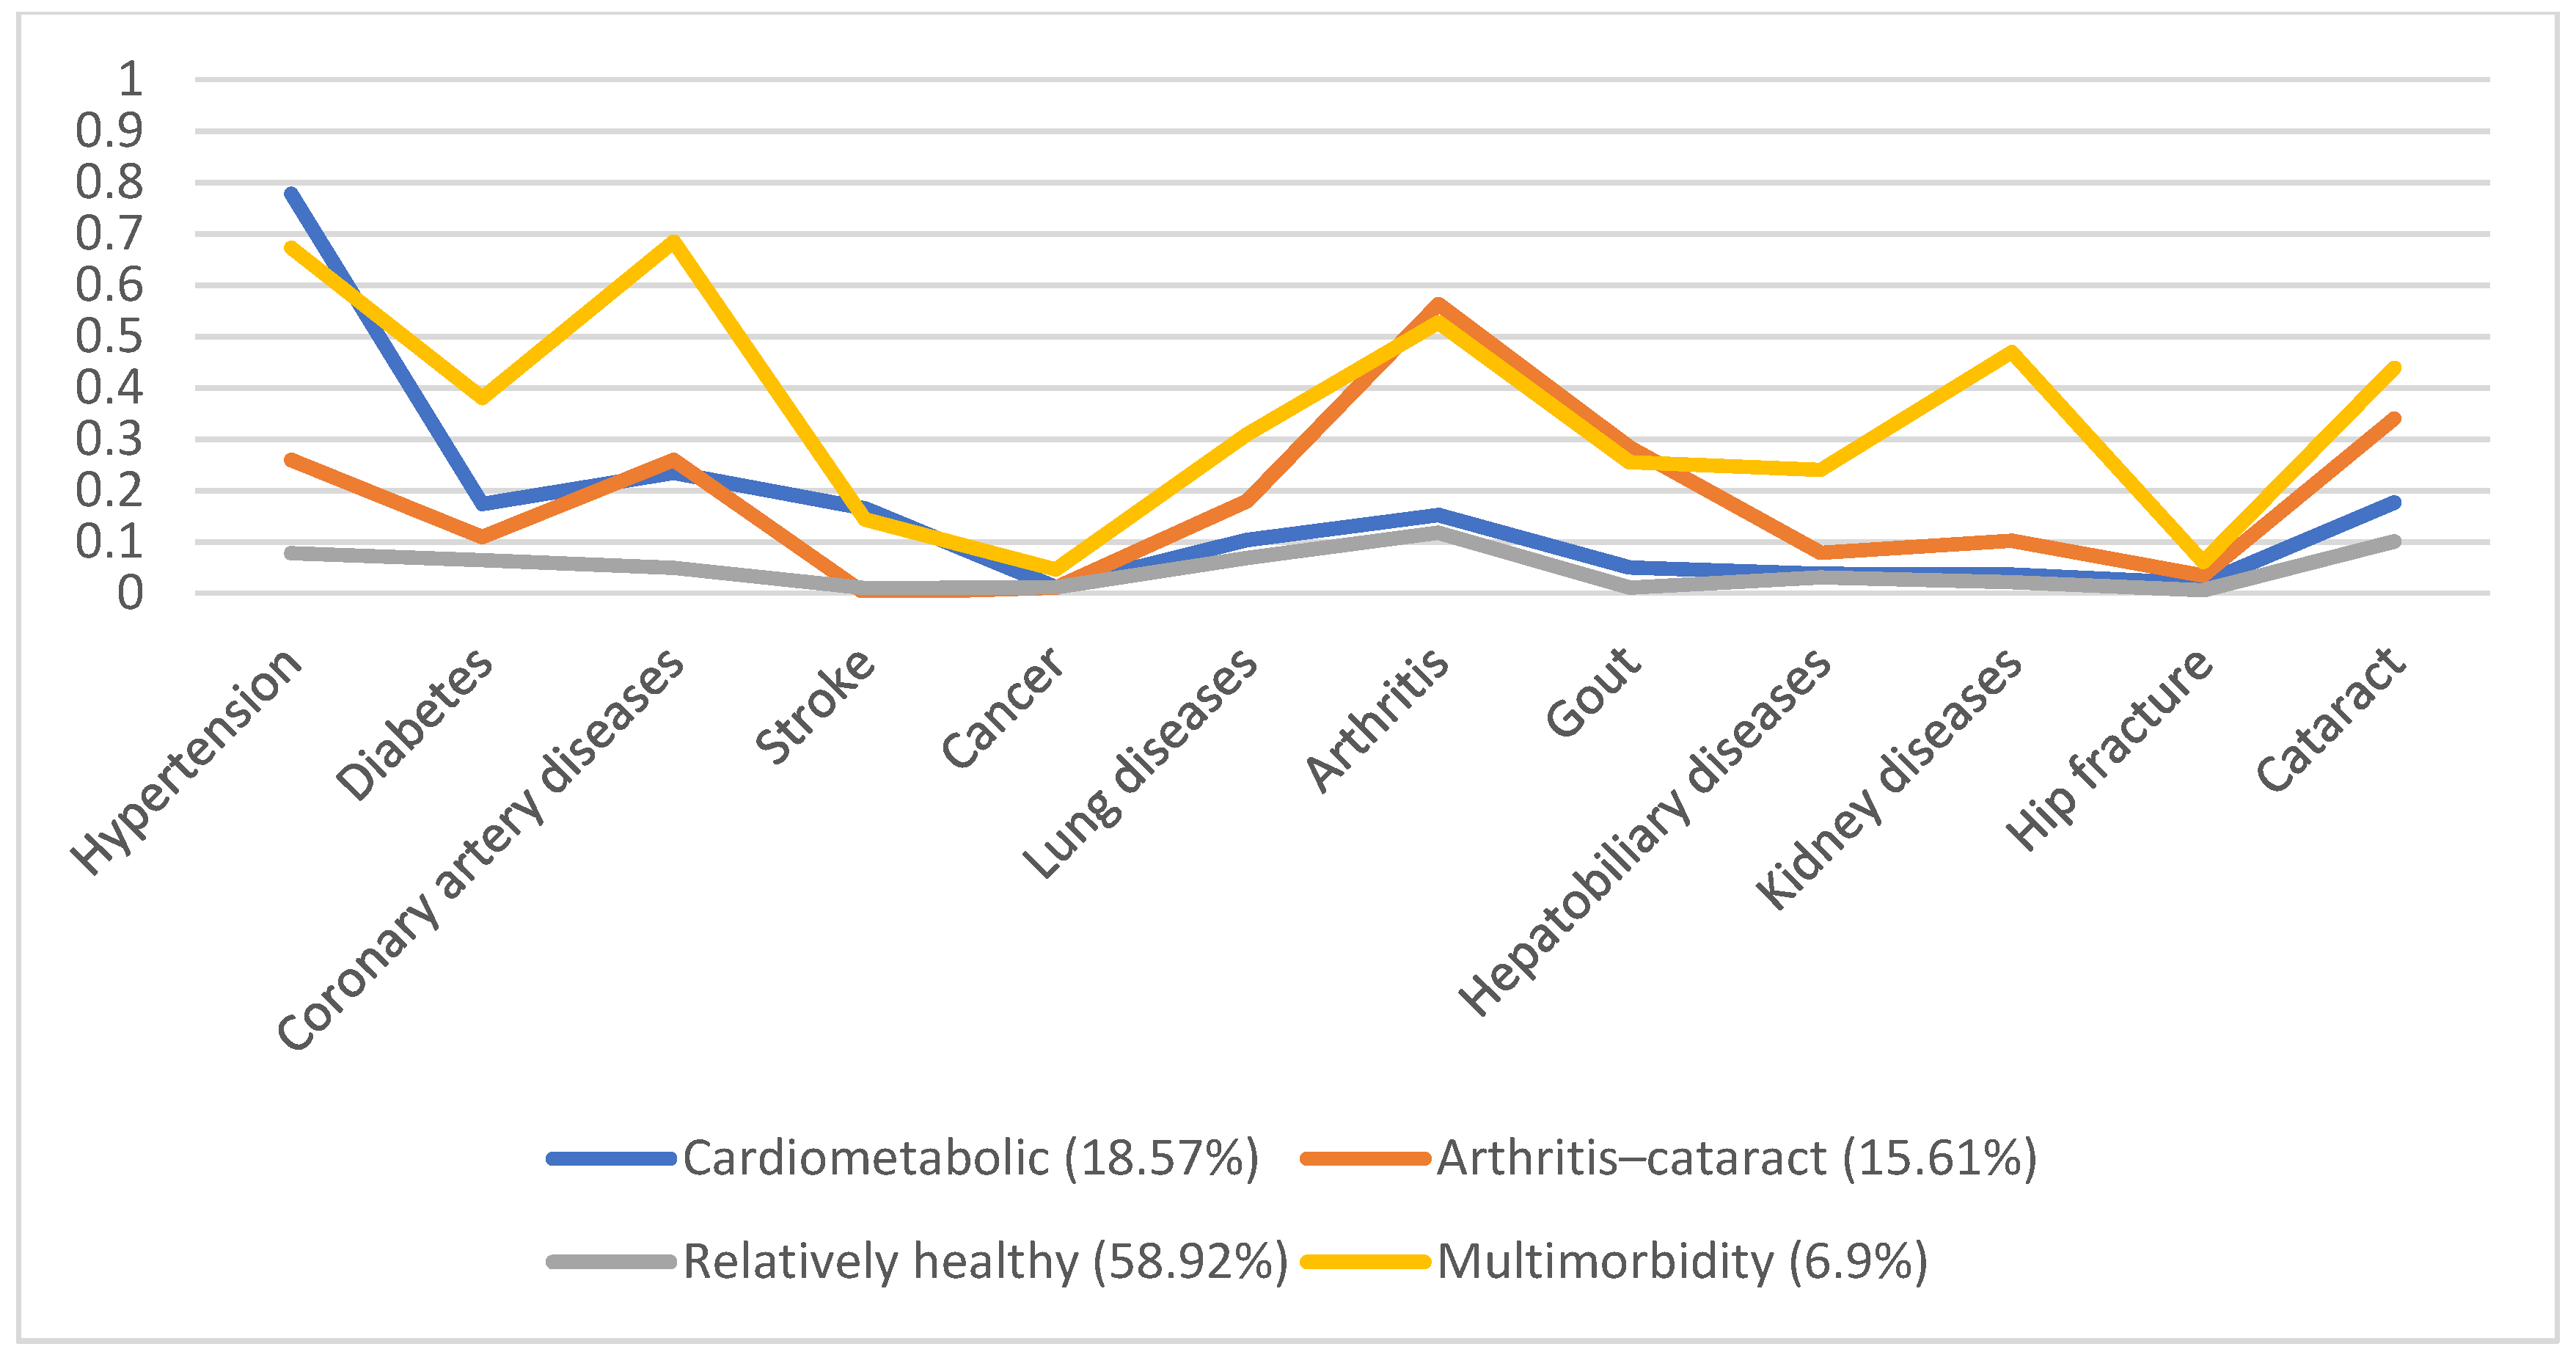
Figure 1. Multimorbidity patterns in 1996.
Ijerph 19 03317 g001
Figure 2. Multimorbidity patterns in 1999.
Ijerph 19 03317 g002
Figure 3. Multimorbidity patterns in 2003.
Ijerph 19 03317 g003
Figure 4. Multimorbidity patterns in 2007.
Ijerph 19 03317 g004
Figure 5. Multimorbidity patterns in 2011.
Ijerph 19 03317 g005
Figure 6. Association between each multimorbidity group in 1996 and long-term mortality in older adults. 1 (blue line): cardiometabolic group; 2 (green line): arthritis–cataract group; 3 (yellow line): relatively healthy group; 4 (purple line): multimorbidity group. Cum survival: cumulative survival.
Ijerph 19 03317 g006
Table 1. Demographic and clinical characteristics of the participants in 1996.
Multimorbidity Patterns
CharacteristicsTotalCardiometabolicArthritis–CataractRelatively HealthyMultimorbidityp Value
n = 5130n = 1111n = 594n = 3138n = 287
Age 66.7 (9.37)68.12 (8.84)68.9 (8.76)65.51 (9.58)69.73 (7.9)<0.0001
Sex <0.0001
Male2760 (53.8%)577 (51.94%)258 (43.43%)1794 (57.17%)131 (45.64%)
Female2370 (46.2%)534 (48.06%)336 (56.57%)1344 (42.83%)156 (54.36%)
Income
satisfaction
<0.0001
Poor829 (17.79%)166 (16.73%)106 (18.76%)478 (16.35%)79 (30.38%)
Fair2126 (44.3%)432 (43.55%)271 (47.96%)1310 (44.82%)93 (35.77%)
Good1805 (38.08%)394 (39.72%)188 (33.27%)1135 (38.83%)88 (33.85%)
Social
participation
<0.0001
Yes2146 (41.83%)509 (45.81%)259 (43.6%)1234 (39.32%)144 (50.17%)
No2984 (58.17%)602 (54.19%)335 (56.4%)1904 (60.68%)143 (49.83%)
Self-rated
health
<0.0001
Poor1401 (29.40%)359 (35.83%)261 (46.03%)594 (20.24%)187 (71.37%)
Fair1613 (33.84%)341 (34.03%)205 (36.16%)1008 (30.34%)59 (22.52%)
Good1752 (36.76%)302 (30.14%)101 (17.81%)1333 (45.42%)16 (6.11%)
Smoking <0.0001
Yes1380 (26.9%)224 (20.14%)123 (20.71%)971 (30.94%)62 (21.6%)
No3750 (73.1%)887 (79.84%)471 (79.29%)2167 (69.06%)225 (78.4%)
Alcohol <0.0001
Yes1083 (21.12%)195 (17.55%)98 (16.5%)764 (24.35%)26 (9.06%)
No4046 (78.88%)916 (82.45%)496 (83.5%)2373 (75.65%)261 (90.94%)
Betelnut 0.0212
Yes346 (6.75%)65 (5.85%)39 (6.57%)233 (7.43%)9 (3.14%)
No4783 (93.25%)1046 (94.15%)555 (93.43%)2904 (92.57%)278 (96.86%)
Admission in
past one year
<0.0001
Yes909 (17.72%)262 (23.58%)129 (21.72%)400 (12.75%)118 (41.11%)
No4221 (82.28%)849 (76.42%)465 (78.28%)2738 (87.25%)169 (58.89%)
Exercise 0.0077
No2506 (48.87%)488 (43.92%)306 (51.52%)1556 (49.62%)156 (54.36%)
≤2 times/week275 (5.36%)54 (4.86%)29 (4.88%)174 (5.52%)18 (6.27%)
3–5 times/week395 (7.7%)88 (7.92%)43 (7.24%)242 (7.72%)22 (7.67%)
≥6 times/week1952 (38.07%)481 (43.29%)216 (36.36%)1164 (37.12%)91 (31.71%)
Disability <0.0001
Yes671 (13.1%)200 (18.03%)111 (18.69%)271 (8.64%)89 (31.12%)
No4453 (86.9%)909 (81.97%)483 (81.31%)2864 (91.36%)197 (68.88%)
Depression <0.0001
Yes1062 (22.42%)228 (22.85%)198 (35.17%)508 (17.42%)128 (49.61%)
No3674 (77.58%)770 (77.15%)365 (64.83%)2409 (82.58%)130 (50.39%)
The data in tables are the number (%) for categorical variables and the mean (SD) for continuous variables. OR, odds ratio; CI, confidence interval.
Table 2. Univariate logistic regression analysis of demographic and clinical characteristics predicting mortality.
Mortality
OR95% CIp Value
Age 1.141 *1.132–1.150<0.0001
Sex
Male1.551 *1.389–1.732<0.0001
FemaleRef
Income satisfaction
Poor1.200 *1.018–1.4150.0299
Fair0.9860.869–1.1190.8271
GoodRef
Social participation
YesRef
No1.716 *1.534–1.919<0.0001
Self-rated health
Poor2.533 *2.193–2.926<0.0001
Fair1.356 *1.182–1.556<0.0001
GoodRef
Smoking
Yes1.44 *1.272–1.630<0.0001
NoRef
Drinking
Yes0.7390.646–0.846<0.0001
NoRef
Betelnut
Yes0.8910.716–1.1090.3013
NoRef
Admission
Yes2.719 *2.333–3.169<0.0001
NoRef
Exercise habits
No1.329 *1.073–1.6460.0092
≤2 times/week0.8090.591–1.1810.1865
3–5 times/weekRef
≥6 times/week1.336 *1.074–1.6610.0092
Disability
Yes5.669 *4.618–6.958<0.0001
NoRef
Depression
Yes2.203 *1.760–2.325<0.0001
NoRef
OR, odds ratio; CI, confidence interval; *: p value < 0.05.
Table 3. Multivariate logistic regression analysis of demographic and clinical characteristics predicting mortality. Model 1: Disease patterns only; Model 2: Adjusted with socioeconomic factors; Model 3: Adjusted with socioeconomic factors and health behaviors; Model 4: Adjusted with socioeconomic factors, health behaviors, and physical conditions.
Model 1Model 2Model 3Model 4
OR95% CIp ValueOR95% CIp ValueOR95% CIp ValueOR95% CIp Value
Disease patterns
Cardio-metabolic1.703 *1.484–1.956<0.00011.354 *1.147–1.5990.00031.424 *1.203–1.684<0.00011.237 *1.040–1.4720.0162
Arthritis–cataract1.379 *1.157–1.644<0.00011.0230.831–1.2600.82921.040.844–1.2820.71450.8310.667–1.0340.0968
Relatively healthyRef Ref Ref Ref
Multimorbidity2.924 *2.251–3.797<0.00012.028 *1.504–2.736<0.00012.008 *1.486–2.713<0.00011.3530.982–1.8630.0646
Age 1.136 *1.126–1.146<0.00011.14 *1.129–1.150<0.00011.133 *1.122–1.143<0.0001
Sex <0.0001 <0.0001 <0.0001
Male 1.907 *1.659–2.192 1.689 *1.437–1.985 1.718 *1.454–2.028
Female Ref Ref Ref
Income satisfaction
Poor 1.54 *1.269–1.870<0.00011.434 *1.177–1.7470.00031.1150.901–13800.3163
Fair 1.1370.981–1.3160.08781.0850.935–1.2590.28261.0130.869–1.1810.8704
Good Ref Ref Ref
Social participation 0.0023 0.0058 0.1369
Yes Ref Ref Ref
No 1.247 *1.082–1.437 1.224 *1.060–1.413 1.1190.965–1.297
Smoking <0.0001 <0.0001
Yes 1.708 *1.432–2.037 1.756 *1.468–2.1
No Ref Ref
Drinking 0.0003 0.0197
Yes 0.724 *0.606–0.864 0.807 *0.673–0.966
No Ref Ref
Exercise habits
No 1.2220.945–1.5820.12671.1720.901–1.5250.2358
≤2 times/week 0.8880.605–1.3020.54160.8720.591–1.2870.4903
3–5 times/week Ref Ref
≥6 times/week 0.970.748–1.2590.81931.060.814–1.3820.6649
Self-rated health
Poor 1.587 *1.301–1.935<0.0001
Fair 1.1190.947–1.3230.1853
Good Ref
Admission <0.0001
Yes 1.84 *1.516–2.232
No Ref
Disability <0.0001
Yes 1.799 *1.390–2.2328
No Ref
Depression 0.0178
Yes 1.249 *1.039–1.501
No No
OR, odds ratio; CI, confidence interval; *: p value < 0.05.
Publisher’s Note: MDPI stays neutral with regard to jurisdictional claims in published maps and institutional affiliations.