
Direct-Read Fluorescence-Based Measurements of Bioaerosol Exposure in Home Healthcare

 , and
, and
Abstract
:1. Introduction
2. Materials and Methods
3. Results
4. Discussion
5. Conclusions
Author Contributions
Funding
Institutional Review Board Statement
Informed Consent Statement
Data Availability Statement
Conflicts of Interest
References
- Bien, E.; Davis, K.; Gillespie, G. Home Healthcare Workers’ Occupational Exposures. Home Healthc. Now 2020, 38, 247–253. [Google Scholar] [CrossRef] [PubMed]
- Bien, E.; Davis, K.; Reutman, S.; Gillespie, G. Occupational Exposures in the Homecare Environment: Piloting an Observation Tool. Home Health Care Manag. Pract. 2021, 33, 162–170. [Google Scholar] [CrossRef]
- Institute for Healthcare Improvement. No place like home: Advancing the safety of care in the home. In No Place Like Home; Institute for Healthcare Improvement: Boston, MA, USA, 2018. [Google Scholar]
- Hittle, B.; Agbonifo, N.; Suarez, R.; Davis, K.G.; Ballard, T. Complexity of occupational exposures for home health-care workers: Nurses vs. home health aides. J. Nurs. Manag. 2016, 24, 1071–1079. [Google Scholar] [CrossRef] [PubMed]
- Agbonifo, N.; Hittle, B.; Suarez, R.; Davis, K. Occupational Exposures of Home Healthcare Workers. Home Healthc. Now 2017, 35, 150–159. [Google Scholar] [CrossRef]
- US Department of Labor, Bureau of Statistics Staff, & United States. Home health aides and personal care aides. In Occupational Outlook Handbook; US Department of Labor: Washington, DC, USA, 2018. [Google Scholar]
- Cox, J.; Mbareche, H.; Lindsley, W.G.; Duchaine, C. Field sampling of indoor bioaerosols. Aerosol Sci. Technol. 2020, 54, 572–584. [Google Scholar] [CrossRef]
- Kettleson, E.M.; Adhikari, A.; Vesper, S.; Coombs, K.; Indugula, R.; Reponen, T. Key determinants of the fungal and bacterial microbiomes in homes. Environ. Res. 2015, 138, 130–135. [Google Scholar] [CrossRef] [Green Version]
- Niemeier-Walsh, C.; Ryan, P.H.; Meller, J.; Ollberding, N.J.; Adhikari, A.; Indugula, R.; Reponen, T. The mycobiomes and bacteriomes of sputum, saliva, and home dust. Indoor Air 2021, 31, 357–368. [Google Scholar] [CrossRef]
- Reponen, T.; Levin, L.; Zheng, S.; Vesper, S.; Ryan, P.; Grinshpun, S.A.; LeMasters, G. Family and home characteristics correlate with mold in homes. Environ. Res. 2013, 124, 67–70. [Google Scholar] [CrossRef] [Green Version]
- Heo, K.J.; Lim, C.E.; Kim, H.B.; Lee, B.U. Effects of human activities on concentrations of culturable bioaerosols in indoor air environments. J. Aerosol Sci. 2017, 104, 58–65. [Google Scholar] [CrossRef]
- Zhang, Z.; Reponen, T.; Hershey, G.K.K. Fungal Exposure and Asthma: IgE and Non-IgE-Mediated Mechanisms. Curr. Allergy Asthma Rep. 2016, 16, 86. [Google Scholar] [CrossRef]
- Klepeis, N.E.; Nelson, W.C.; Ott, W.R.; Robinson, J.P.; Tsang, A.M.; Switzer, P.; Behar, J.V.; Hern, S.C.; Engelmann, W.H. The National Human Activity Pattern Survey (NHAPS): A resource for assessing exposure to environmental pollutants. J. Expo. Sci. Environ. Epidemiol. 2001, 11, 231–252. [Google Scholar] [CrossRef] [Green Version]
- Tian, Y.; Liu, Y.; Misztal, P.K.; Xiong, J.; Arata, C.M.; Goldstein, A.H.; Nazaroff, W.W. Fluorescent biological aerosol particles: Concentrations, emissions, and exposures in a northern California residence. Indoor Air 2018, 28, 559–571. [Google Scholar] [CrossRef]
- Veillette, M.; Knibbs, L.; Pelletier, A.; Charlebois, R.; Lecours, P.B.; He, C.; Morawska, L.; Duchaine, C. Microbial Contents of Vacuum Cleaner Bag Dust and Emitted Bioaerosols and Their Implications for Human Exposure Indoors. Appl. Environ. Microbiol. 2013, 79, 6331–6336. [Google Scholar] [CrossRef] [Green Version]
- Cox, J.; Indugula, R.; Vesper, S.; Zhu, Z.; Jandarov, R.; Reponen, T. Comparison of indoor air sampling and dust collection methods for fungal exposure assessment using quantitative PCR. Environ. Sci. Process. Impacts 2017, 19, 1312–1319. [Google Scholar] [CrossRef]
- Grinshpun, S.A.; Weber, A.M.; Yermakov, M.; Indugula, R.; Elmashae, Y.; Reponen, T.; Rose, L. Evaluation of personal inhalable aerosol samplers with different filters for use during anthrax responses. J. Occup. Environ. Hyg. 2017, 14, 585–595. [Google Scholar] [CrossRef]
- Kulkarni, P.; Baron, P.A.; Willeke, K. Aerosol Measurement: Principles, Techniques, and Applications, 3rd ed.; Wiley: Hoboken, NJ, USA, 2011; p. 904. [Google Scholar]
- Lee, B.U.; Hong, I.G.; Lee, D.H.; Chong, E.-S.; Jung, J.H.; Lee, J.H.; Kim, H.J.; Lee, I.-S. Bacterial Bioaerosol Concentrations in Public Restroom Environments. Aerosol Air Qual. Res. 2012, 12, 251–255. [Google Scholar] [CrossRef] [Green Version]
- Meadow, J.F.; Altrichter, A.E.; Kembel, S.W.; Moriyama, M.; O’Connor, T.K.; Womack, A.M.; Brown, G.Z.; Green, J.L.; Bohannan, B.J.M. Bacterial communities on classroom surfaces vary with human contact. Microbiome 2014, 2, 7. [Google Scholar] [CrossRef] [Green Version]
- Nazaroff, W.W. Indoor bioaerosol dynamics. Indoor Air 2016, 26, 61–78. [Google Scholar] [CrossRef] [PubMed]
- Amend, A.S.; Seifert, K.A.; Samson, R.; Bruns, T.D. Indoor fungal composition is geographically patterned and more diverse in temperate zones than in the tropics. Proc. Natl. Acad. Sci. USA 2010, 107, 13748–13753. [Google Scholar] [CrossRef] [Green Version]
- Chen, Q.; Hildemann, L.M. The Effects of Human Activities on Exposure to Particulate Matter and Bioaerosols in Residential Homes. Environ. Sci. Technol. 2009, 43, 4641–4646. [Google Scholar] [CrossRef]
- Lehtonen, M.; Reponen, T.; Nevalainen, A. Everyday activities and variation of fungal spore concentrations in indoor air. Int. Biodeterior. Biodegrad. 1993, 31, 25–39. [Google Scholar] [CrossRef]
- Reponen, T.; Lehtonen, M.; Raunemaa, T.; Nevalainen, A. Effect of indoor sources on fungal spore concentrations and size distributions. J. Aerosol Sci. 1992, 23, 663–666. [Google Scholar] [CrossRef]
- Yang, S.; Bekö, G.; Wargocki, P.; Williams, J.; Licina, D. Human Emissions of Size-Resolved Fluorescent Aerosol Particles: Influence of Personal and Environmental Factors. Environ. Sci. Technol. 2021, 55, 509–518. [Google Scholar] [CrossRef] [PubMed]
- Li, J.; Wan, M.P.; Schiavon, S.; Tham, K.W.; Zuraimi, S.; Xiong, J.; Fang, M.; Gall, E. Size-resolved dynamics of indoor and outdoor fluorescent biological aerosol particles in a bedroom: A one-month case study in Singapore. Indoor Air 2020, 30, 942–954. [Google Scholar] [CrossRef]
- Luoma, M.; Batterman, S.A. Characterization of Particulate Emissions from Occupant Activities in Offices. Indoor Air 2001, 11, 35–48. [Google Scholar] [CrossRef] [Green Version]
- Oh, H.-J.; Jeong, N.-N.; Chi, W.-B.; Seo, J.-H.; Jun, S.-M.; Sohn, J.-R. Characterization of particulate matter concentrations and bioaerosol on each floor at a building in Seoul, Korea. Environ. Sci. Pollut. Res. 2015, 22, 16040–16050. [Google Scholar] [CrossRef]
- Bhangar, S.; Adams, R.; Pasut, W.; Huffman, J.; Arens, E.A.; Taylor, J.W.; Bruns, T.D.; Nazaroff, W.W. Chamber bioaerosol study: Human emissions of size-resolved fluorescent biological aerosol particles. Indoor Air 2016, 26, 193–206. [Google Scholar] [CrossRef] [Green Version]
- Bhangar, S.; Huffman, J.; Nazaroff, W.W. Size-resolved fluorescent biological aerosol particle concentrations and occupant emissions in a university classroom. Indoor Air 2014, 24, 604–617. [Google Scholar] [CrossRef]
- Collins, S.; Stevenson, D.; Bennett, A.; Walker, J. Occurrence of Legionella in UK household showers. Int. J. Hyg. Environ. Health 2017, 220 Pt B, 401–406. [Google Scholar] [CrossRef]
- Hospodsky, D.; Qian, J.; Nazaroff, W.; Yamamoto, N.; Bibby, K.; Rismani-Yazdi, H.; Peccia, J. Human Occupancy as a Source of Indoor Airborne Bacteria. PLoS ONE 2012, 7, e34867. [Google Scholar] [CrossRef] [Green Version]
- Knibbs, L.D.; He, C.; Duchaine, C.; Morawska, L. Vacuum Cleaner Emissions as a Source of Indoor Exposure to Airborne Particles and Bacteria. Environ. Sci. Technol. 2012, 46, 534–542. [Google Scholar] [CrossRef] [PubMed]
- Licina, D.; Tian, Y.; Nazaroff, W.W. Emission rates and the personal cloud effect associated with particle release from the perihuman environment. Indoor Air 2017, 27, 791–802. [Google Scholar] [CrossRef] [PubMed] [Green Version]
- Patel, S.; Sankhyan, S.; Boedicker, E.; Decarlo, P.F.; Farmer, D.K.; Goldstein, A.H.; Katz, E.F.; Nazaroff, W.W.; Tian, Y.; Vanhanen, J.; et al. Indoor Particulate Matter during HOMEChem: Concentrations, Size Distributions, and Exposures. Environ. Sci. Technol. 2020, 54, 7107–7116. [Google Scholar] [CrossRef] [PubMed]
- Tian, Y.; Arata, C.; Boedicker, E.; Lunderberg, D.M.; Patel, S.; Sankhyan, S.; Kristensen, K.; Misztal, P.K.; Farmer, D.K.; Vance, M.; et al. Indoor emissions of total and fluorescent supermicron particles during HOMEChem. Indoor Air 2021, 31, 88–98. [Google Scholar] [CrossRef]
- Kaarakainen, P.; Rintala, H.; Vepsäläinen, A.; Hyvärinen, A.; Nevalainen, A.; Meklin, T. Microbial content of house dust samples determined with qPCR. Sci. Total Environ. 2009, 407, 4673–4680. [Google Scholar] [CrossRef]
- Boor, B.E.; Spilak, M.P.; Laverge, J.; Novoselac, A.; Xu, Y. Human exposure to indoor air pollutants in sleep microenvironments: A literature review. Build. Environ. 2017, 125, 528–555. [Google Scholar] [CrossRef]
- Zanobetti, A.; Redline, S.; Schwartz, J.; Rosen, D.; Patel, S.; O’Connor, G.T.; Lebowitz, M.; Coull, B.A.; Gold, D.R. Associations of PM10with Sleep and Sleep-disordered Breathing in Adults from Seven U.S. Urban Areas. Am. J. Respir. Crit. Care Med. 2010, 182, 819–825. [Google Scholar] [CrossRef] [Green Version]
- Pereira, M.L.; Knibbs, L.; He, C.; Grzybowski, P.; Johnson, G.; Huffman, J.; Bell, S.; Wainwright, C.; Matte, D.L.; Dominski, F.; et al. Sources and dynamics of fluorescent particles in hospitals. Indoor Air 2017, 27, 988–1000. [Google Scholar] [CrossRef]
- Nieto-Caballero, M.; Gomez, O.M.; Shaughnessy, R.; Hernandez, M. Aerosol fluorescence, airborne hexosaminidase, and quantitative genomics distinguish reductions in airborne fungal loads following major school renovations. Indoor Air 2022, 32, e12975. [Google Scholar] [CrossRef]
- Su, C.; Lau, J.; Yu, F. A Case Study of Upper-Room UVGI in Densely-Occupied Elementary Classrooms by Real-Time Fluorescent Bioaerosol Measurements. Int. J. Environ. Res. Public Health 2017, 14, 51. [Google Scholar] [CrossRef] [Green Version]
- ASHRAE. Ventilation for Acceptable Indoor Air Quality (ANSI/ASHRAE 62.2). ANSI/ASHRAE, 2019. Available online: https://www.ashrae.org/technical-resources/bookstore/standards-62-1-62-2 (accessed on 13 March 2022).
- Hernandez, M.; Perring, A.E.; McCabe, K.; Kok, G.; Granger, G.; Baumgardner, D. Chamber catalogues of optical and fluorescent signatures distinguish bioaerosol classes. Atmos. Meas. Tech. 2016, 9, 3283–3292. [Google Scholar] [CrossRef] [Green Version]
- Perring, A.E.; Schwarz, J.P.; Baumgardner, D.; Hernandez, M.T.; Spracklen, D.V.; Heald, C.L.; Gao, R.S.; Kok, G.; McMeeking, G.; McQuaid, J.B.; et al. Airborne observations of regional variation in fluorescent aerosol across the United States. J. Geophys. Res. Atmos. 2015, 120, 1153–1170. [Google Scholar] [CrossRef]
- Handorean, A.; Robertson, C.E.; Harris, J.; Frank, D.N.; Hull, N.M.; Kotter, C.; Stevens, M.J.; Baumgardner, D.; Pace, N.R.; Hernandez, M. Microbial aerosol liberation from soiled textiles isolated during routine residuals handling in a modern health care setting. Microbiome 2015, 3, 72. [Google Scholar] [CrossRef] [Green Version]
- Kaye, P.H.; Stanley, W.; Hirst, E.; Foot, E.V.; Baxter, K.L.; Barrington, S.J. Single particle multichannel bio-aerosol fluorescence sensor. Opt. Express 2005, 13, 3583–3593. [Google Scholar] [CrossRef] [Green Version]
- Robinson, E.S.; Gao, R.-S.; Schwarz, J.P.; Fahey, D.W.; Perring, A.E. Fluorescence calibration method for single-particle aerosol fluorescence instruments. Atmos. Meas. Tech. 2017, 10, 1755–1768. [Google Scholar] [CrossRef] [Green Version]
- Haysom, I.; Sharp, K. The survival and recovery of bacteria in vacuum cleaner dust. J. R. Soc. Promot. Health 2003, 123, 39–45. [Google Scholar] [CrossRef]
- Corsi, R.L.; Siegel, J.A.; Chiang, C. Particle Resuspension During the Use of Vacuum Cleaners on Residential Carpet. J. Occup. Environ. Hyg. 2008, 5, 232–238. [Google Scholar] [CrossRef]
- Jürgensen, C.W.; Madsen, A.M. Influence of everyday activities and presence of people in common indoor environments on exposure to airborne fungi. AIMS Environ. Sci. 2016, 3, 77–95. [Google Scholar] [CrossRef]
- Balasubramanian, R.; Nainar, P.; Rajasekar, A. Airborne bacteria, fungi, and endotoxin levels in residential microenvironments: A case study. Aerobiologia 2012, 28, 375–390. [Google Scholar] [CrossRef]
- Goebes, M.D.; Boehm, A.B.; Hildemann, L.M. Contributions of Foot Traffic and Outdoor Concentrations to Indoor AirborneAspergillus. Aerosol Sci. Technol. 2011, 45, 352–363. [Google Scholar] [CrossRef]
- Buttner, M.P.; Stetzenbach, L.D. Monitoring airborne fungal spores in an experimental indoor environment to evaluate sampling methods and the effects of human activity on air sampling. Appl. Environ. Microbiol. 1993, 59, 219–226. [Google Scholar] [CrossRef] [PubMed] [Green Version]
- Zhou, J.; Fang, W.; Cao, Q.; Yang, L.; Chang, V.W.-C.; Nazaroff, W.W. Influence of moisturizer and relative humidity on human emissions of fluorescent biological aerosol particles. Indoor Air 2017, 27, 587–598. [Google Scholar] [CrossRef] [PubMed] [Green Version]
- Kanaani, H.; Hargreaves, M.; Ristovski, Z.; Morawska, L. Deposition rates of fungal spores in indoor environments, factors effecting them and comparison with non-biological aerosols. Atmos. Environ. 2008, 42, 7141–7154. [Google Scholar] [CrossRef] [Green Version]
- Allegra, S.; Riffard, S.; Leclerc, L.; Girardot, F.; Stauffert, M.; Forest, V.; Pourchez, J. A valuable experimental setup to model exposure to Legionella’s aerosols generated by shower-like systems. Water Res. 2020, 172, 115496. [Google Scholar] [CrossRef] [PubMed] [Green Version]
- Estrada-Perez, C.; Kinney, K.; Maestre, J.P.; Hassan, Y.; King, M. Droplet distribution and airborne bacteria in an experimental shower unit. Water Res. 2018, 130, 47–57. [Google Scholar] [CrossRef]
- Sasahara, T.; Ogawa, M.; Fujimura, I.; Ae, R.; Kosami, K.; Morisawa, Y. Efficacy and Effectiveness of Showerheads Attached with Point-of-use (POU) Filter Capsules in Preventing Waterborne Diseases in a Japanese Hospital. Biocontrol Sci. 2020, 25, 223–230. [Google Scholar] [CrossRef] [PubMed]
- Moat, J.; Rizoulis, A.; Fox, G.; Upton, M. Domestic shower hose biofilms contain fungal species capable of causing opportunistic infection. J. Water Health 2016, 14, 727–737. [Google Scholar] [CrossRef] [Green Version]
- Bemt, L.V.D.; De Vries, M.P.; Van Knapen, L.; Jansen, M.; Goossens, M.; Muris, J.W.M.; Van Schayck, C.P. Influence of mattress characteristics on house dust mite allergen concentration. Clin. Exp. Allergy 2006, 36, 233–237. [Google Scholar] [CrossRef]
- Tischer, C.; Zock, J.-P.; Valkonen, M.; Doekes, G.; Guerra, S.; Heederik, D.; Jarvis, D.; Norbäck, D.; Olivieri, M.; Sunyer, J.; et al. Predictors of microbial agents in dust and respiratory health in the Ecrhs. BMC Pulm. Med. 2015, 15, 48. [Google Scholar] [CrossRef] [Green Version]
- Dannemiller, K.C.; Weschler, C.J.; Peccia, J. Fungal and bacterial growth in floor dust at elevated relative humidity levels. Indoor Air 2017, 27, 354–363. [Google Scholar] [CrossRef]
- Woodcock, A.; Steel, N.; Moore, C.B.; Howard, S.J.; Custovic, A.; Denning, D. Fungal contamination of bedding. Allergy 2006, 61, 140–142. [Google Scholar] [CrossRef] [PubMed]
- Górny, R.L.; Reponen, T.; Willeke, K.; Schmechel, D.; Robine, E.; Boissier, M.; Grinshpun, S.A. Fungal Fragments as Indoor Air Biocontaminants. Appl. Environ. Microbiol. 2002, 68, 3522–3531. [Google Scholar] [CrossRef] [Green Version]
- Reponen, T.; Seo, S.-C.; Grimsley, F.; Lee, T.; Crawford, C.; Grinshpun, S.A. Fungal fragments in moldy houses: A field study in homes in New Orleans and Southern Ohio. Atmos. Environ. 2007, 41, 8140–8149. [Google Scholar] [CrossRef] [Green Version]


| Particle Type | Concentration During Activities (n = 34) | Background Concentrations (n = 5) | Outdoor Concentrations (n = 7) |
|---|---|---|---|
| Pollen | 242 ± 405 | 14 ± 5 | 27 ± 21 |
| Bacteria | 9 ± 9 | 4 ± 2 | 0.7 ± 0.4 |
| Fungi | 139 ± 198 | 22 ± 6 | 7 ± 4 |
| Fluorescent | 2240 ± 2899 | 578 ± 255 | 1213 ± 994 |
| Non-Fluorescent | 621 ± 799 | 140 ± 120 | 178 ± 85 |
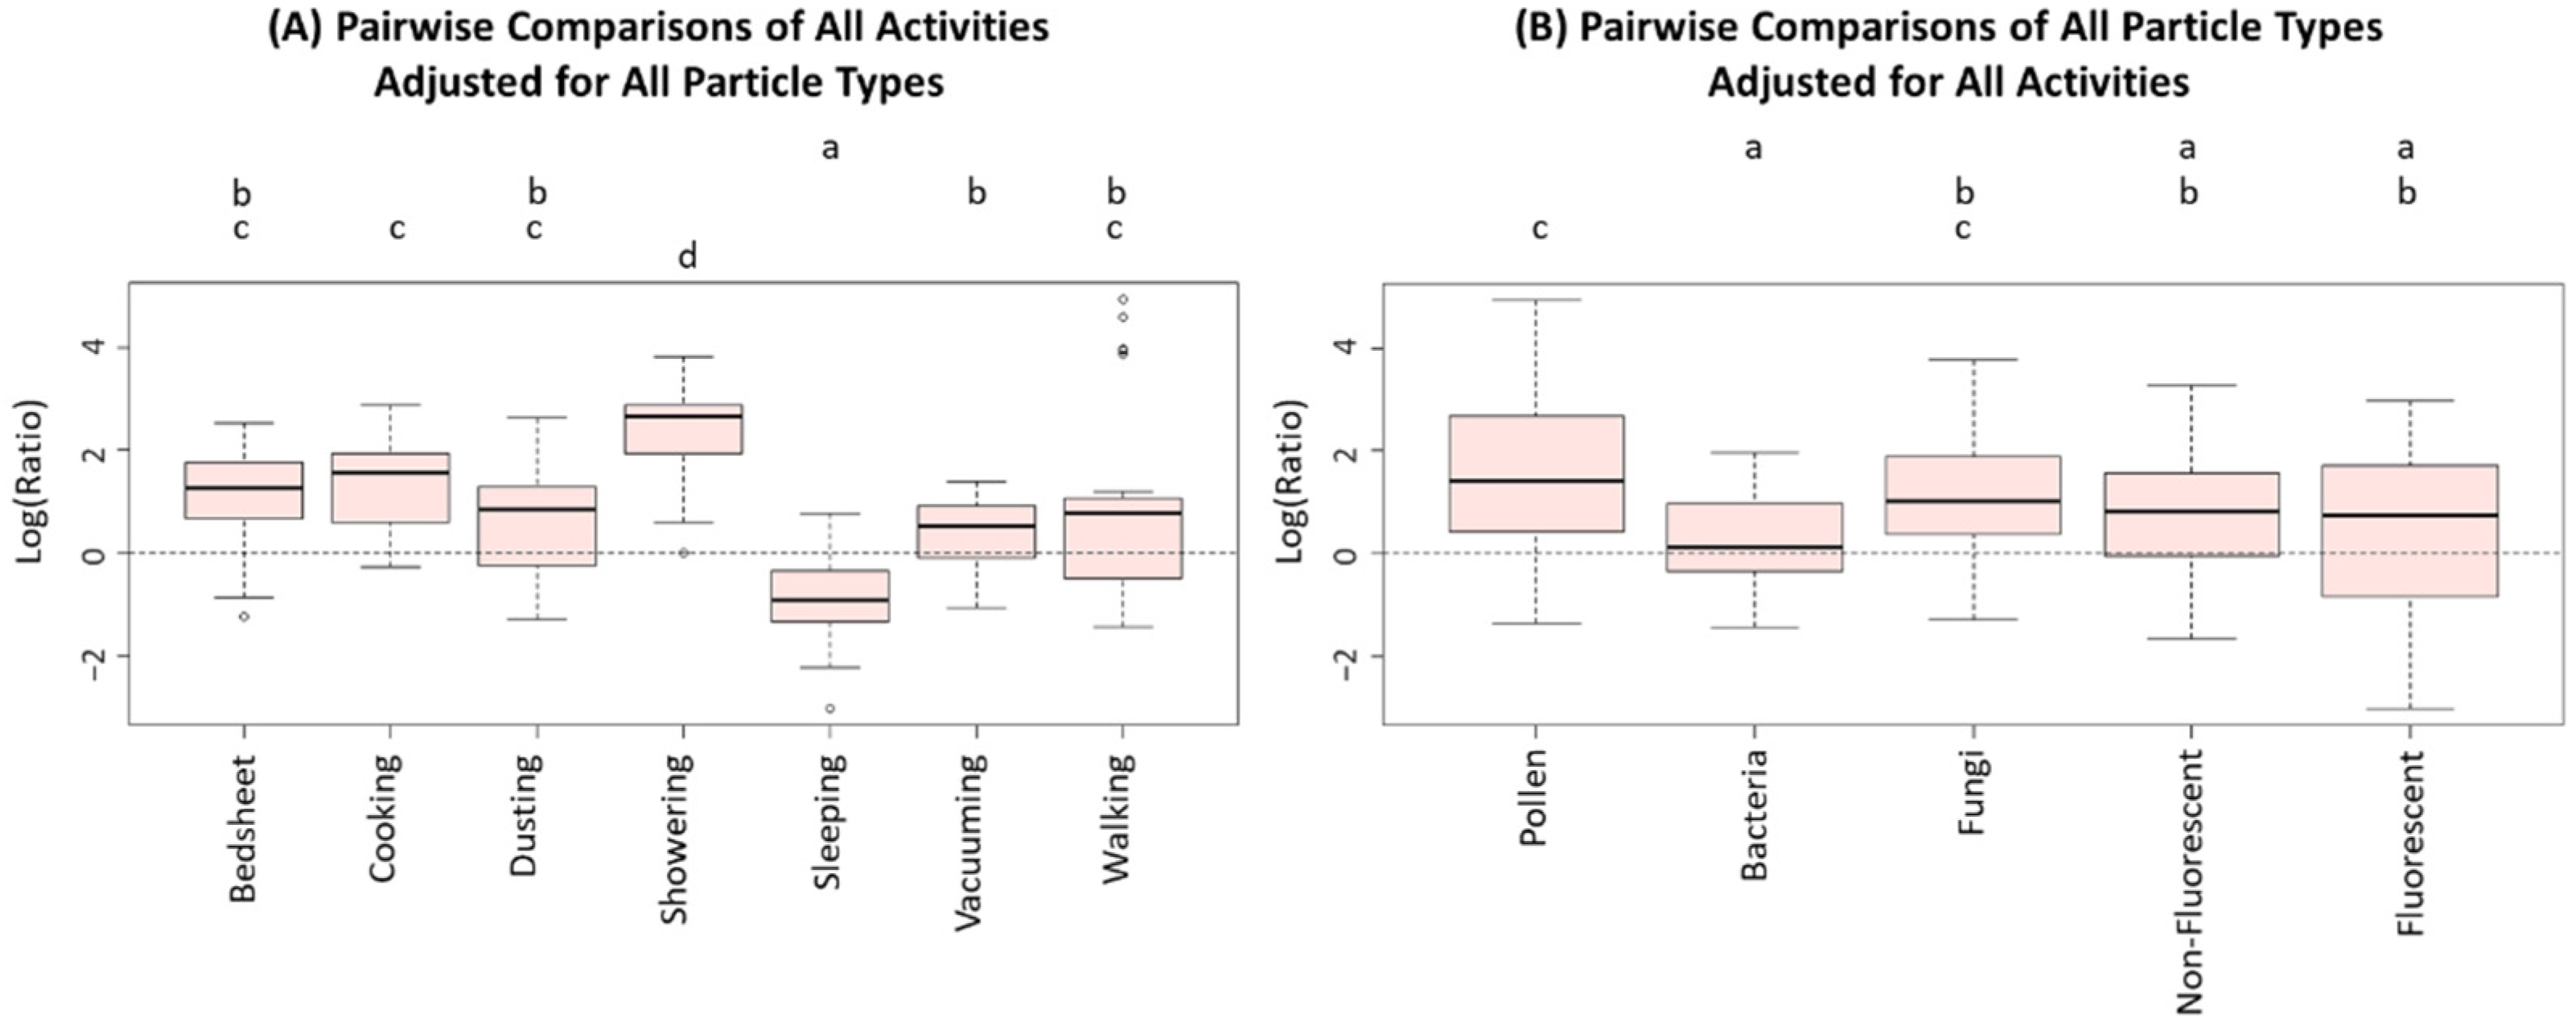
| Degrees of Freedom | Sum Sq 2 | Mean Sq | F-Value | p-Value | |
|---|---|---|---|---|---|
| Activity | 6 | 133.77 | 22.295 | 22.02 | <0.001 |
| Particle Type | 4 | 40.82 | 10.206 | 10.08 | <0.001 |
| Residuals | 159 | 160.95 | 1.012 |
| Particle Type | p-Value |
|---|---|
| Bacteria | 0.015 * |
| Pollen | <0.001 * |
| Fungi | <0.001 * |
| Non-Fluorescent | <0.001 * |
| Fluorescent | <0.001 * |
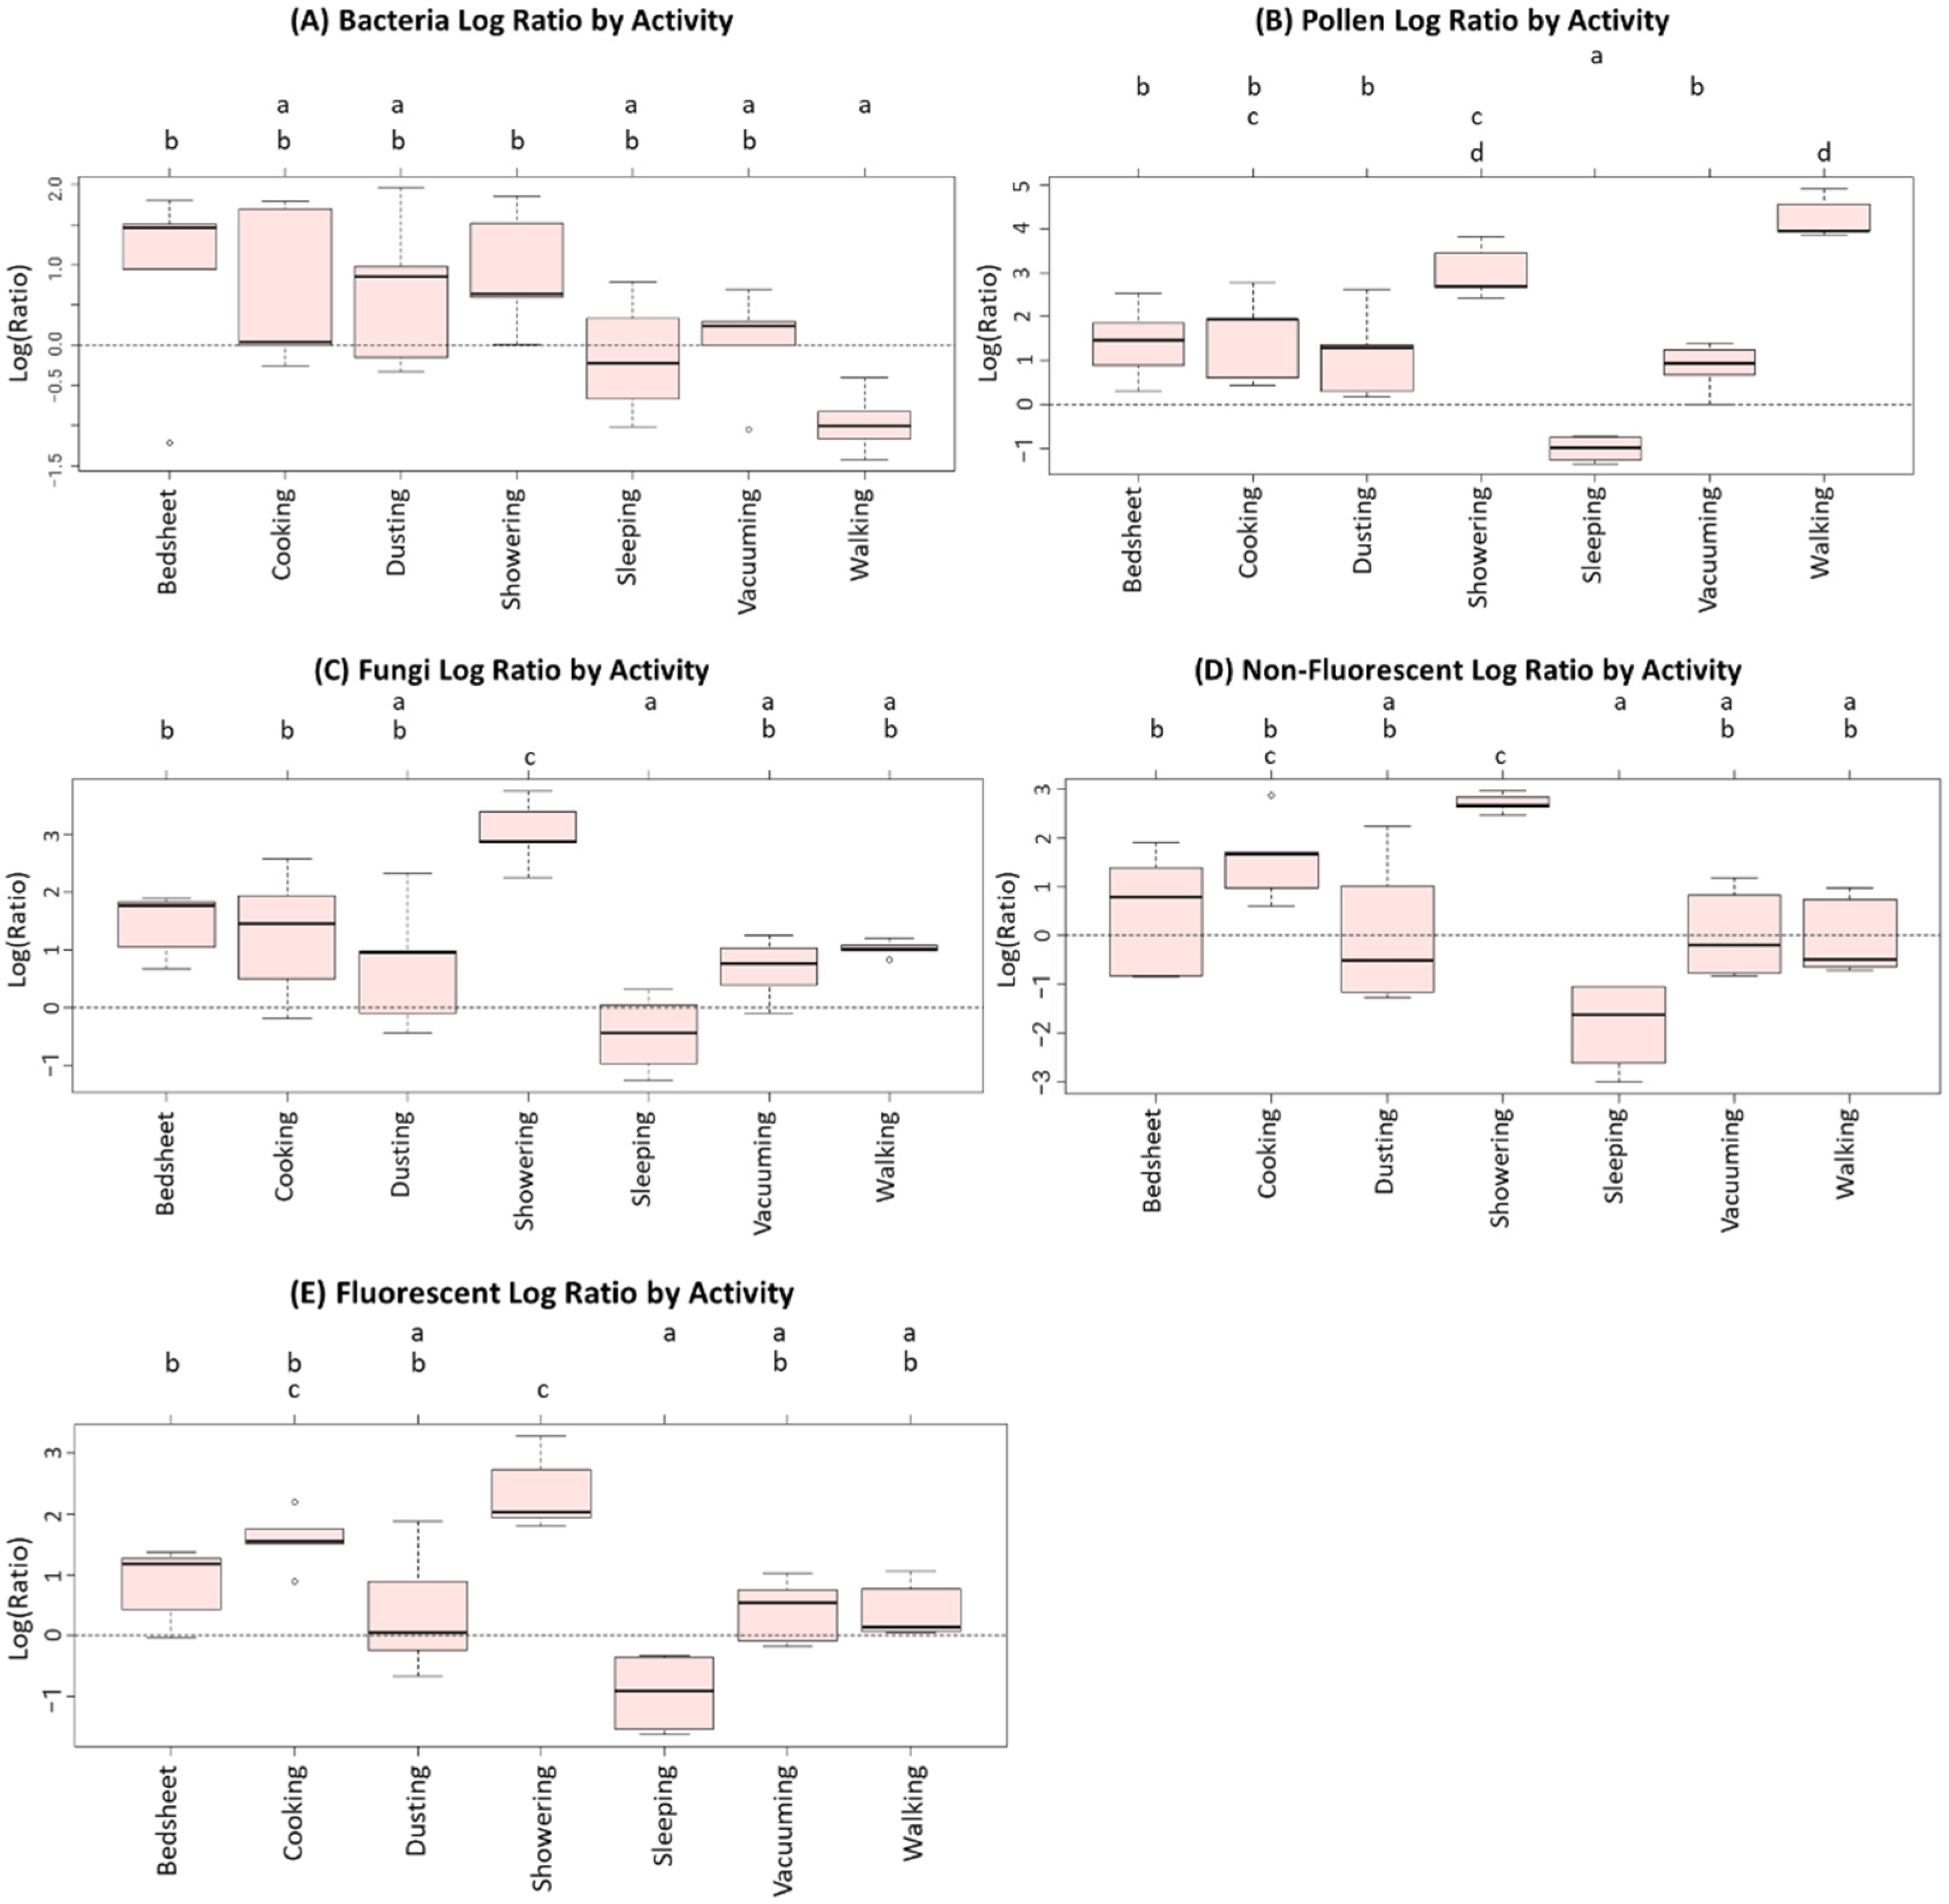
| Activity | p-Value |
|---|---|
| Bedsheet Changing | 0.47 |
| Cooking | 0.463 |
| Dusting | 0.632 |
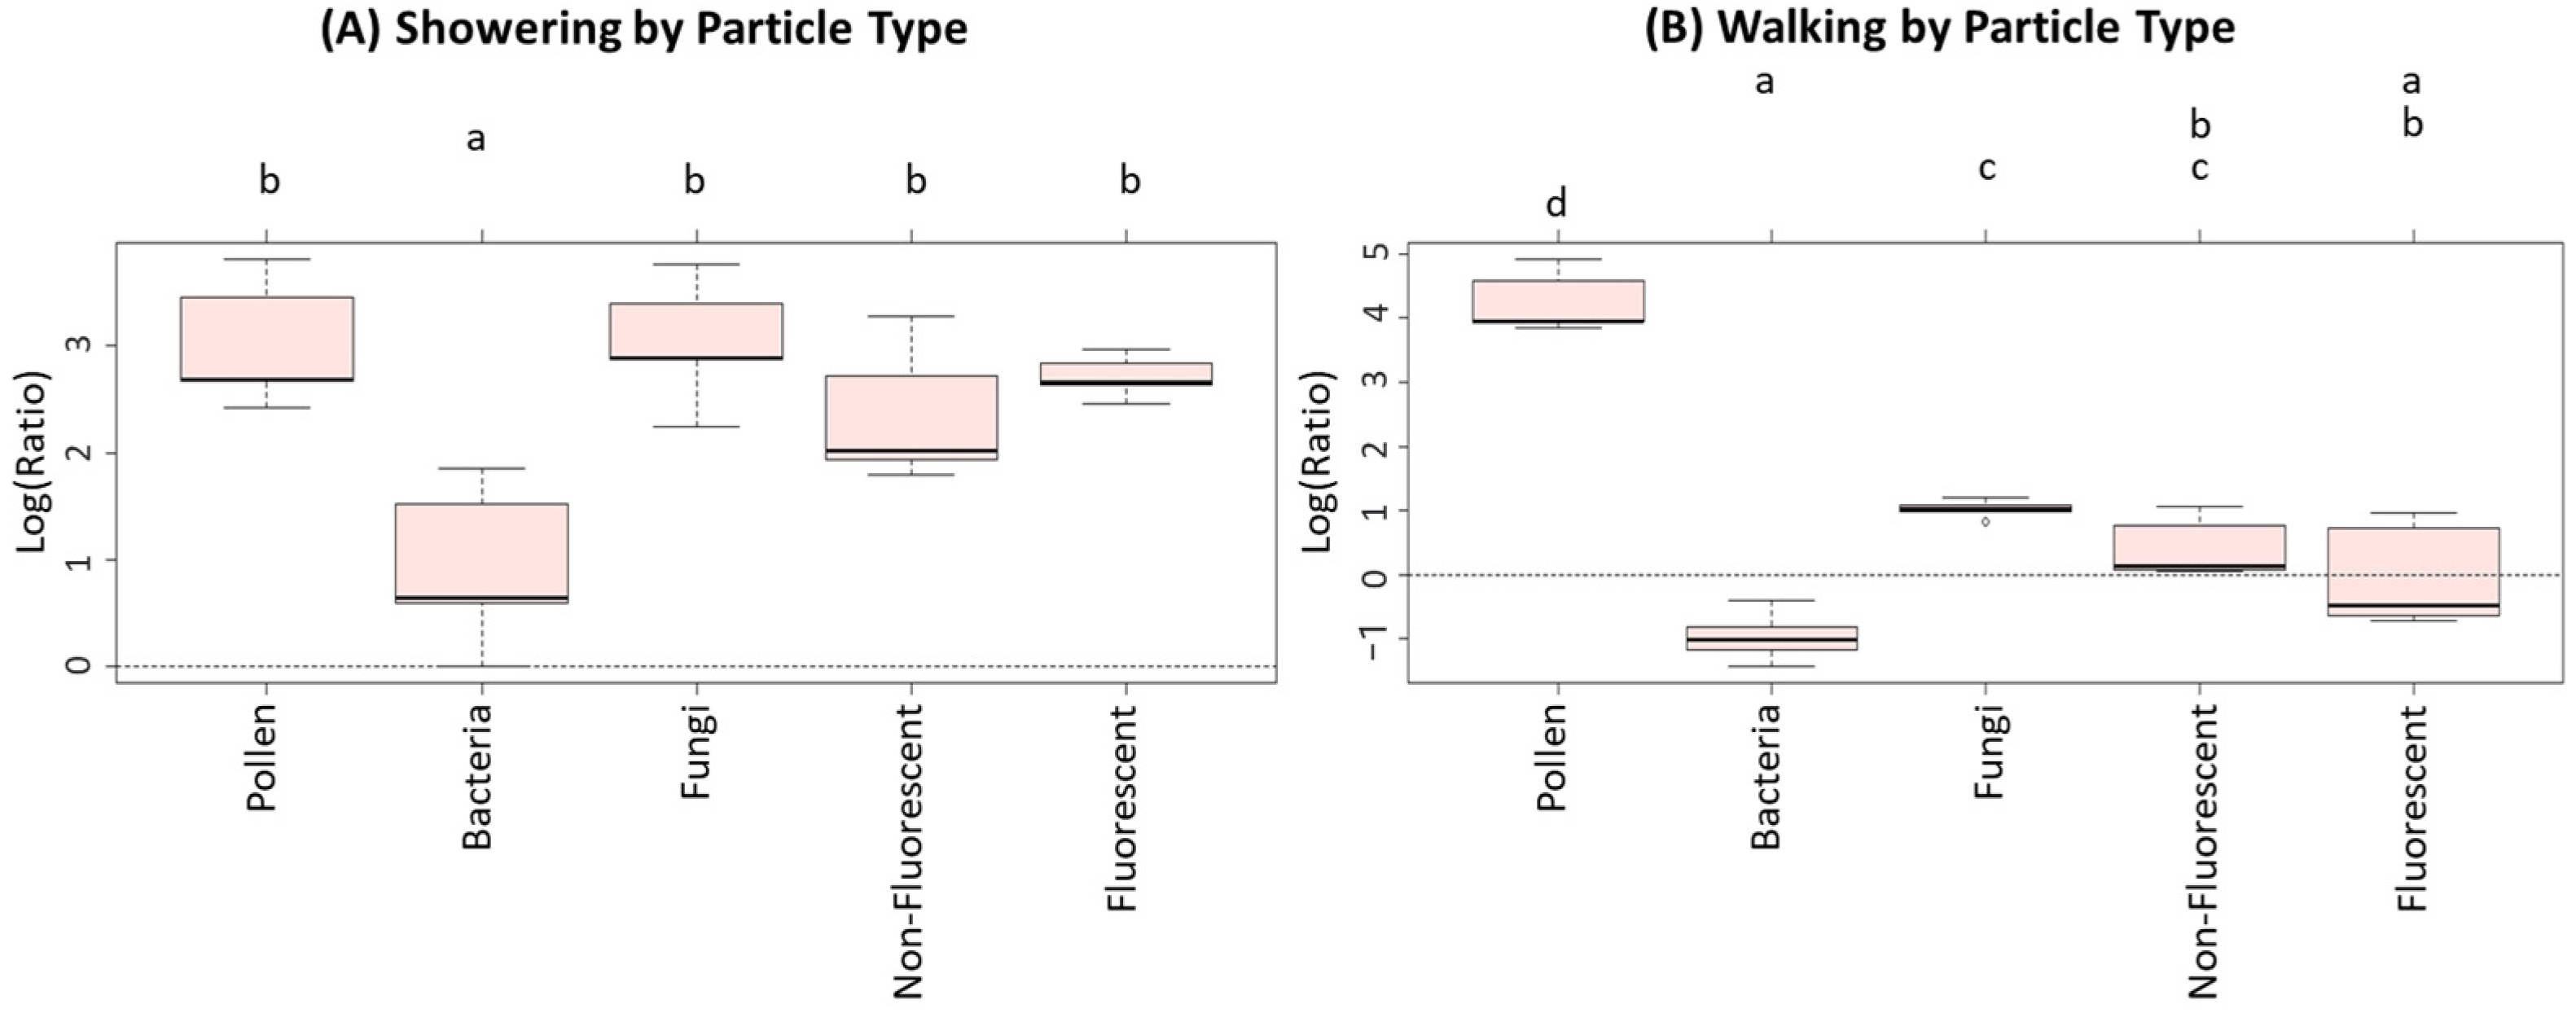
| Showering | <0.001 * |
| Sleeping | 0.061 |
| Vacuuming | 0.219 |
| Walking | <0.001 * |
Publisher’s Note: MDPI stays neutral with regard to jurisdictional claims in published maps and institutional affiliations. |
© 2022 by the authors. Licensee MDPI, Basel, Switzerland. This article is an open access article distributed under the terms and conditions of the Creative Commons Attribution (CC BY) license (https://creativecommons.org/licenses/by/4.0/).
Share and Cite
Nathu, V.D.; Virkutyte, J.; Rao, M.B.; Nieto-Caballero, M.; Hernandez, M.; Reponen, T. Direct-Read Fluorescence-Based Measurements of Bioaerosol Exposure in Home Healthcare. Int. J. Environ. Res. Public Health 2022, 19, 3613. https://doi.org/10.3390/ijerph19063613
Nathu VD, Virkutyte J, Rao MB, Nieto-Caballero M, Hernandez M, Reponen T. Direct-Read Fluorescence-Based Measurements of Bioaerosol Exposure in Home Healthcare. International Journal of Environmental Research and Public Health. 2022; 19(6):3613. https://doi.org/10.3390/ijerph19063613
Chicago/Turabian StyleNathu, Vishal D., Jurate Virkutyte, Marepalli B. Rao, Marina Nieto-Caballero, Mark Hernandez, and Tiina Reponen. 2022. "Direct-Read Fluorescence-Based Measurements of Bioaerosol Exposure in Home Healthcare" International Journal of Environmental Research and Public Health 19, no. 6: 3613. https://doi.org/10.3390/ijerph19063613
APA StyleNathu, V. D., Virkutyte, J., Rao, M. B., Nieto-Caballero, M., Hernandez, M., & Reponen, T. (2022). Direct-Read Fluorescence-Based Measurements of Bioaerosol Exposure in Home Healthcare. International Journal of Environmental Research and Public Health, 19(6), 3613. https://doi.org/10.3390/ijerph19063613